This section presents the general principles for executing DataViewer, introduces the applications developed in the LCVM2 laboratory and gives a short explanation for writing a new application.
To run a DataViewer demo, you must be in the main directory of
Dataviewer. For example, if DataViewer is installed under your
/usr/local/ directory, then you should move to
/usr/local/DataViewer/
Then run the runme.sh script. With most shells, typing
the name of the script is enough. Otherwise, you can type
sh runme.sh
This should open an empty DataViewer window, similar to
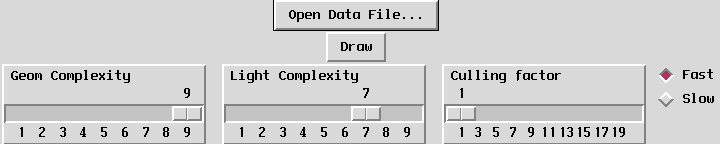
Figure. Call the File/User
menu, which should activate the dialog shown in
Figure.
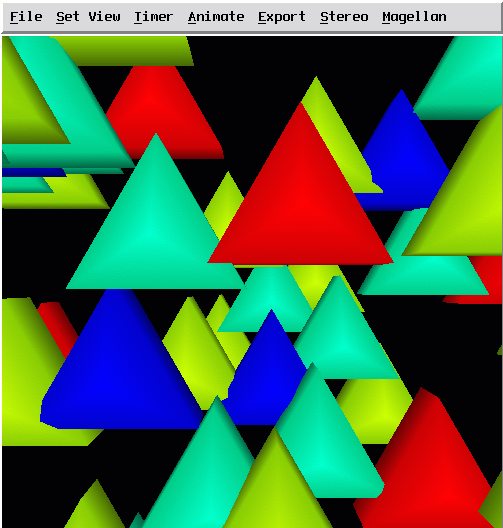
Using the "Open Data File ..." button, open the file named
...DataViewer/applications/Python_demo_complex/data/ala_min.crd
and then hit the "Draw" button. You should now obtain a result as shown in Figure.
Play around with the options in the dialog and notice the changes in the image. Remember to press "Draw" after each change. You can also play with the mouse within the main window, and get familiar with the manipulation of the geometrical scene. For more details on this part, see Section.
To run a DataViewer application, you need to execute the following command, in which you must replace the quoted parts with something corresponding to your real situation:
"dv_dir/bin/"DV.py"dv_dir/python_script/application_script".py
For example, to run the application contained in the demo script, go
to the directory applications/PythonDV_demo_complex/ and run
the command
bin/DV.py python_script/charmm_crd.py
Thus, to run DataViewer you need to execute two python scripts
(.py). The first, named DV.py, is the general DataViewer script and
usually can be found in the bin directory of the application. The
second one comes as an argument to the first one, and is different for
each application, defining its specific operations (usually linked to
the "File/User" menu). It is usually situated in the
python_script directory of the application.
For example, if you are in the
DataViewer/applications/Python_demo_simple directory, you can
run this application by executing the following command:
bin/DV.py python_script/typein.py
The command usually opens an empty DataViewer main window (see Figure).
To actually draw the scene aimed by the application, you must call the "File/User" menu, that opens an application dialog. In many cases, you have to hit the "Draw" button to visualize a scene similar to Figure. For more complex applications, other operations may be needed to create the scene. Follow the application's instructions for that part (see Section).
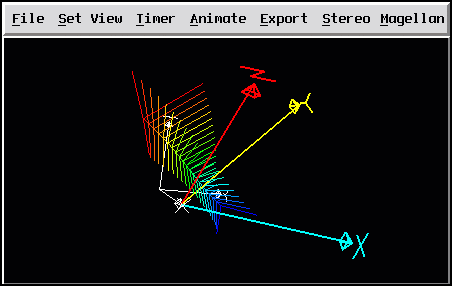
An example of the main window for a DataViewer application.
Here is a list of the applications that normally come with the DataViewer distribution:
This application, launched by the typein.py python script, allows you to enter the name of the problem you want to treat. The only available problem for this module is the default problem, which does nothing. This demo is an example of how to create your own application.
This python script from
the Python_demo_complex directory draws a set of spheres that are read
from a data file. For example, the data/ala_min.crd file contains the
simulation of a molecule.
This script draws a sinusoidal surface that can be animated.
This script draws 3 spheres.
This script allows you to select the problem you want to run and to send the problem an argument string. For example, you can choose the "select_test" problem, the argument string should be an integer number between 1 and 4. This problem will draw 4 spheres with the colors red, green, blue and yellow. The color of the selected sphere (the argument of the problem) will be drawn using a darker shade.
This python script creates a scene from a scene file. For more information, see the scene file documentation.
This python script can translate a color map from a povray file to a scene file or the contrary. The povray color map can be initially created with a program like GIMP, and then be transfered to a scene file to be used with the previously described module (scene_file.py).
Other more complex applications of DataViewer are:
The Visualization of Bifurcation Manifolds is probably the most important application of DataViewer up to now. For more information, see http://lcvmwww.epfl.ch/VBM.
This application simulates deformations of elastic rods. Complementary to VBM which is specialized on continuation problems, Slinky can solve various initial value problems linked to rods. For more information, see lcvmsun1.epfl.ch/~jdesiebe/slinky/.
The python script of the application must define a class inheriting
from the geom_window.GeomWindow class, with a UserWidgets
function inside it. This function must contain the widgets specific to
the application. At some point, this class must communicate with a c++
source problem, by calling the
self.geom.set_problem("problem_source_name") to set the problem
name, and self.geom.file(argument_string) to transfer the
parameters that the c++ function needs.
On the c++ side, you must define a function taking an
argument of the type DVcreate_image_arguments and returning an
integer. The argument send by the python script is a string and can be
found in dv.input_string . Then any geometrical object created by
the application can be added to dv.top which is the root of the
scene tree and the operation for this action is
dv.top.copy_child(any_object); . The prototype of the c++
function must be added to DVpython_problems.h and the function
must also be called from inside the DVpython_problems function in
the DVpython_problems.cc module. Make sure the Makefile of the
application has the name of your module in it.