The DataViewer based Data Probe for the rod problem..
When VBM is compiled with the VBM_DEVELOPER option
various other special purpose Data Probe modules are created.
Eventually there will be documentation for them
here, but currently they are strictly "Use at your
own risk"! One thing that they might be useful
for to a general audience is as an example of what is
possible. They do not have as extensive
documentation as the normal modules, but the following
sections give brief descriptions of what they do.
This module lists the arguments that are sent to the Data Probe. The main purpose of this module is debugging.
This modules displays all of the pointwise tags that are associated with the current point. The main purpose of this module is debugging.
This modules displays all of the data blocks that are associated with the current point. The main purpose of this module is debugging.
The DataViewer based Data Probe for the rod problem..
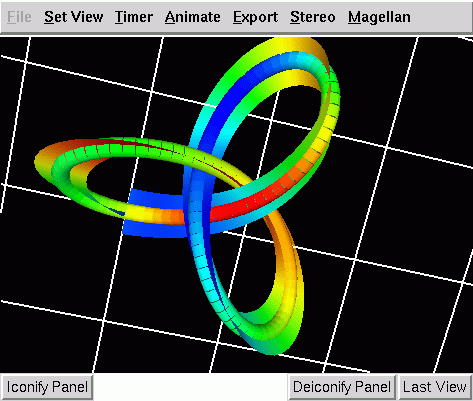
The Rod problem module is an example of a data probe module and exemplifies many of the important details of the interface discussed in Section and its implementation. This module has been used extensively in our work for the visualization of a continuum rod model used in the study of DNA. An example of the visualization provided by this module is shown in Figure.
The reason that this module is considered a Developer
Module, and is not part of the standard distribution
us that is calls Fortran subroutines from C++.
While this is a standard thing to do, the exact
compilation flags needed to make it work
differ from one machine to the next. Hence,
VBM only attempts to compile this module
if the VBM_DEVELOPER option
is selected.
This module has been implemented in DataViewer (see http://lcvmwww.epfl.ch/DV for more detail). Accordingly, it automatically inherits all of the advantages of this library. In this case, the module provides a visualization of a single, full solution to the problem of interest. Given a bifurcation diagram object and a pointer object, this module reconstructs the full solution from a small subset of representatives, using an IVP solver.. Basically, it assumes that a subset of the representatives chosen for the bifurcation diagram are actually the values of the continuous system at the point s=0. For this module the original problem is solved as a boundary value problem. Once the boundary value problem has been solved, and the solution recorded at one endpoint, the rest of the solution may be reconstructed trivially using an initial value problem solver, because here the equations are not too stiff. One important implication of this method is that the visualization domain and computation domain can be fully decoupled. The discretization at which the solution of the boundary value problem is performed is independent of the discretization used in the initial value problem solver and the visualization.
We also note that the visualization this module provides is quite specialized. As shown in Figure the solution is represented as a tube and a ribbon. This visualization metaphor is chosen because of the specific structure of these equations, which represent the statics of an elastic rod. The two basic properties of such an entity are a centerline and a set of directors. To capture this information in a single visualization we represent the centerline by a tube and the directors by a ribbon. In some sense, we display a representation of the solution as it would appear if it were physically realizable. We are, of course, not bound by physical realizability, and may add whatever other cues we wish to the visualization, such as the ribbon. Other information may be encoded, as well, for example utilizing color of the tube and ribbon. Other cues are also possible, for example the radius of the tube, or the width of the ribbon.
The visualization in this module may be manipulated by using both the mouse and the keyboard. Note, this information is repeated in several sections since it is the same for all DataViewer based modules. We include it to make each section as self-contained as possible.
Keyboard bindings
Perform rotations about the vertical axis.
Perform rotations about the horizontal axis.
Perform rotations about the axis "coming out of the screen".
Translate the object horizontally.
Translate the object vertically.
Zoom the object.
Mouse bindings
Performs rotations of the solution based upon the virtual trackball paradigm.
The solution continues to rotate in the same direction as it was rotating when the button was release.
The solution stops rotating.
Translates the solution based upon the movements of the mouse.
As the mouse is moved up the solution is moved closer to the eye-point, and as the mouse is moved down the solution is moved further away from the eye-point.
This is a very special purpose module, which functions very similarly to the module in Section, except that, instead of plotting the solution to the ODE, it plots a surface of revolution based on the solution.
This is also a DataViewer based module.
The goal of this module is to draw rotation surfaces from the solution reconstructed with the IVP solver. The assumption of this module is that the solution is planar, and situated in the XZ plane. After reconstructing the solution, the module will compute a surface by rotation around the Z axis.
Thus, the coordinate settings in the Coord and Scale page are used in the following way: the y coordinate is ignored, and the x and z coordinates are used to construct the surface by rotation around the Z axis.
The setting panel of this module behaves like the panel of the General AUTO Solution dataprobe, except for one specific page, named Surface.
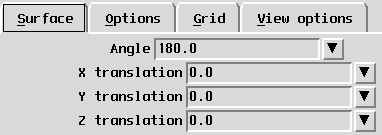
This page, shown in Figure, provides a set of widgets used to define the way the rotation surface is constructed.
The first typein on this page, labeled "Angle", defines the rotation angle for the surface and is expressed in degrees. Thus, the rotation surface is constructed for an angle going from 0 to the specified angle, which is 180 by default.
The next 3 typeins define a translation to be applied to the solution before constructing the rotation surface. As the solution is assumed to be in the XZ plane, the Y translation widget has no effect. The X translation will affect the shape of the rotation surface, while the Z translation will only move it.
This module is specialized on visualizing rod problems. It is derived from the General AUTO Dataprobe and inherits most of its features from it.
For this reason, the documentation on this module contains only the parts that are specific to it. For anything else, please refer to Section.
The only page in the Data control panel that is specific to rods is the Extra Data page.
Beside this, you may need to know some particular information about the rod problems to run this module and set the problem correctly in the IVP Options page.
This module is especially designed for DNA problems. In the normal distribution package, you will find a directory called "dna_problems" where there are several types of problems linked to DNA.
formula_uhats
This directory contains an example problem of rod computation in the case where the uhats and the angles are given as a formula. It should work in any case where the ancient
# FORMULAT_UHATS
tag was used.
For this problem,
uhat1 = 0.0
uhat2 = par3*dsin(s)
uhat3 = 0.0
k1 = 0.1
k2 = 0.1
k3 = 0.15+0.05*par5
perfect
This directory contains an example problem of rod computation in the perfect case. It represents the generic rod problem. In this case,
uhat1 = 0.0
uhat2 = 0.0
uhat3 = 0.0
k1= 0.1
k2= 0.1
k3= 0.1
perfect_old
This directory contains an example problem of rod computation in the
perfect case, for VBM files that have recorded only the data for
m1, m2, m3, n1, n2, and n3. It also represents the generic rod
problem. In this case,
uhat1 = 0.0
uhat2 = 0.0
uhat3 = 0.0
k1= 0.1
k2= 0.1
k3= 0.1
The "dna.f" file in this directory contains a function named
SUBROUTINE PREPROCESS(NDIM,U,PAR)
that transforms the m1, m2, m3, n1, n2, n3 values into x, y,
z, q1, q2, q3, q4, mu1, mu2, mu3, mu4, n1, n2, n3, t. Thus, when
compiling the IVP problem, you should choose the preprocess option on.
To make a module using this problem work, you should use the following tags:
# Reconstruct_EQ 0 5
# Reconstruct_PAR 6 14
# Reconstruct_names x;y;z;q1;q2;q3;q4;mu1;mu2;mu3;mu4;n1;n2;n3;t
rob_problem
The files in the directory called "rob_problem", describe the right hand sides used by the "Rod problem" dataprobe. The problem file you must select on the IVP Options page to use thid module is "rod_dna.f" in the same directory.
This module reads the name of a file containing the uhats information from a file named "dna.dat" that is created by the module at run time. This file name can be directly derived from whatever tag starting with "uhats_from_file" if the VBM file contains it. It can also consist in the name of a temporary file written by the module with data obtained from the data blocks also existing in the VBM file, in case the tag "uhats_at_bottom" is specified. The problem uses the "dna.h" file containing a constant defining the size of the common arrays, and the size of the uhats arrays. Be sure this file is present in the working directory, because the module does not automatically copy it.
If you want to use this problem to visualise some of the previously created VBM files that used to be visualized with the "Rod problem" dataprobe, beware that this problems need "t" as the 15th equation. If the VBM file only contains 14 initial values for each point (from "x" to "n3"), you will have to specify
# Reconstruct_EQ -1 13
# Reconstruct_PAR 14 31
to be able to view the solution.
For this problem,
k1 = 0.1
k2 = 0.1
k3 = 0.15+0.05*par5
uhats_current
This directory contains a file named "dna.f" that reads the uhats information from the current directory. It does not need any additional file. For old VBM files, you may have to take the same steps as for the previous problem.
For this problem,
k1 = 0.1-0.05*par4+par2*s*(s-0.75)
k2 = 0.1+0.05*par4+par2*s*(s-0.75)
k3 = 0.15+0.05*par5
uhats_file
This directory contains a file named "dna.f" that functions almost the same way as the "rob_dna.f" file. The only difference is that the number of uhats is read from the "dna.dat" file created by the module.
For this problem,
k1 = 0.1-0.05*par4+par2*s*(s-0.75)
k2 = 0.1+0.05*par4+par2*s*(s-0.75)
k3 = 0.15+0.05*par5
Note. These problems are just guidelines for rendering DNA problems. We suggest that you copy into your own directory whatever problem seems appropriate for your file and verify all the information inside them before use.
This page is shown in Figure and contains all the operations needed to add new columns to the solution.
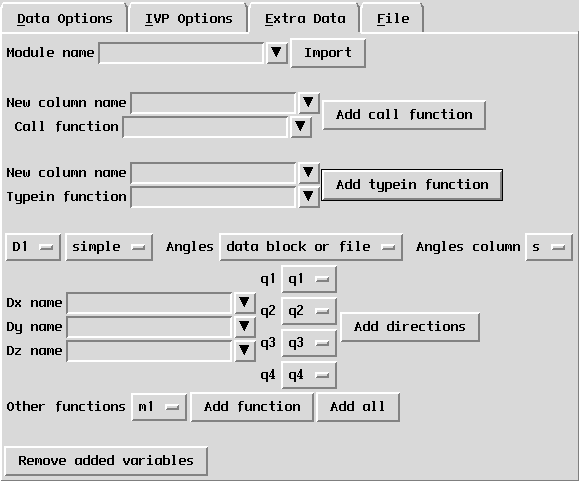
The Extra Data page for the
General rod problems module.
Importing modules
The first operation that can be performed is importing a module. As the new columns are computed, they could need to call a function defined in a Python module outside VBM.
To import a module, you must type its name in the typein at the top of the page, labeled "Module name". Then you must press the "Import" button. Then any function defined inside it can be called by its name.
For Python programmers, the described actions have the following effect:
from 'module_name' import *
Call functions
The next operation that can be performed on this page is adding a new column by calling a function. For this, you must do the following:
s, f, q, r
and you use "q" as parameter in the function call, then this parameter
will have the integer value 2. You can also pass the whole data matrix
to the function, by using the name "solution".
Note: If you define your function in a module, then you must import
the module for the computation of the new column to work. Typein functions
The next action on this page is adding a new column as a typein expression. The main difference between this operation and the previous one is that for the call functions, the new column is computed in one function call. In the present case, the new column is computed point by point, and any function used inside its expression is called for each point of the solution. Thus, this type of computation can take longer. it is recommended to use it only for simple expressions.
To add a new column by a typein expression, you must do the following:
Removing the extra data
The last button on this page, labeled "Remove added variables", clears
all the added variables. It will delete all the columns added to the
data any action taken on this page. It will also delete the columns
produced by the extra variable file if the VBM file contains the
VBM_extra_data_file tag (see
subsection). All the menus based on the variable names will also
be updated, and the data reloaded, so be sure you are not currently
using any of the extra column for visualization when you press this
button, otherwise the result may be hazardous. You do not need to
press the Draw button after this action.
Rod specific operations
The last part of this page is specific to rod problems. It allows the user to add columns to the data corresponding to specific rod properties.
More specifically, this module supposes that 4 of the columns composing the solution are the four quaternions corresponding to a rotation matrix defined in each point of the solution. The rotation matrix defines a frame composed by two vectors perpendicular to the curve (D1 and D2) and a third one that is tangent to the curve (D3). For numerical reasons, it is easier to perform continuations using the quaternions, considering that the vectorial frame can be easily computed from them afterwards.
The 4 menus on this page labeled as q1,q2,q3,q4 allow the
user to specify which columns of the data represent the 4
quaternions. If the list of variable names contains "q1" to "q4" or
"Q1" to "Q4", these variables will automatically fill the columns
corresponding to the quaternions. Otherwise you can choose them from
the variables list by hand.
Based on this information, the module is able to compute some vectors with the following options:
# uhats_from_file filename group1 group2
# uhats_at_bottom group1 group2
filename/angles. For the second tag, they must be included as
a data bloc in the VBM file itself. The bloc must start with
##Begin angles and end with ##End angles. In both
cases, for each point in the solution there must be an angle line of
the form:
arclength angle number number
group1 and group2, are optional and denote the first
and last groups of points in the bifurcation diagram that these tags
apply to. Thus, several angle files can be used in the same VBM file.
In general, the data concerning the strains can be found in the same
way as the data concerning the angles. Thus, if the tag
uhats_from_file is present in the VBM file, then the directory
containing the angles file must also contain a file named "uhats",
where each line singifies
arclength uhat1 uhat2 curvature
where curvature is equal to the square root of uhat1*uhat1+uhat2*uhat2.
Similarly, if the tag uhats_at_bottom is present in the VBM
file, then this file must contain a data block within the tags
##Begin uhats and ##End uhatss, where each line has
the same structure as the file of strains.
For the second option of the Angles menu, the angles are local to each point of the bifurcation diagram, and are specified as a column in the solution. The angle column can then be specified using the corresponding menu.
After choosing the appropriate options for the vector to be computed,
the user must specify the names of the 3 composants of the vector in
the typeins labeled as Dx name, Dy name and Dz name.
Pressing the Add directions button will communicate the
information about the vector to the module, but the buttons
Update Data or Draw must be pressed before the new
columns are added to the solution.
Note. Adding the D1 vector in the simple or rotated frame sets the simple (natural) or rotated (real) ribbon to the coordinates of this vector (see the next section for details).
The last line on this page simplifies the operation for adding 6 other rod-specific functions: 3 moments, bend, twist and global energy. For each of the 6 function, first select its name from the menu, then press the "Add function" button. For the module to be able to add them, it needs to know which columns of the data represent the 4-vector mu that is conjugate to the 4-vector q of quaternions. To use this feature, some of the variables (columns of the data) must have the names "mu1" to "mu4", in small or large caps. Otherwise you can also import the compiled module named "rod_functions" and call the appropriate functions.
For example, suppose the quaternion vector is formed by the columns named "q1" to "q4", and the conjugate vector for the quaternions is formed by the columns named "mu1" to "mu4". If you type
rod_functions
as the module name in the import module typein and then press the "Import" button, then you can add the first (and similarly any other) moment by introducing the function
moment1(solution, q1, q2, q3, q4, mu1, mu2, mu3, mu4)
in the call function typein, and by pressing the "Add call function button".
The energy functions need the moments to be computed beforehand, so if you want to add these columns one by one, you must do it in order. A second option is to add the 6 columns in one step, by pressing the "Add all" button. Remember to press the "Draw" button after each operation.
Automatic operations
When this module is loaded, it automatically detects the presence of
the quaternion vector and adds the simple ribbon if it is the case. If
any information other than formulauhats is given in the VBM
file by the presence of tags like uhats_from_file or
uhats_at_bottom, then it will also compute the rotated ribbon
and the 7 rod-specific functions previously described. If you do not
wish to use these ribbons or any automatically computed function, or
would like to compute them otherwise, just remove all added variables.
The only page in the Visual control panel specific to rods is the Ribbons page.
This page, shown in Figure, can be used to add one or several ribbons to the solution.
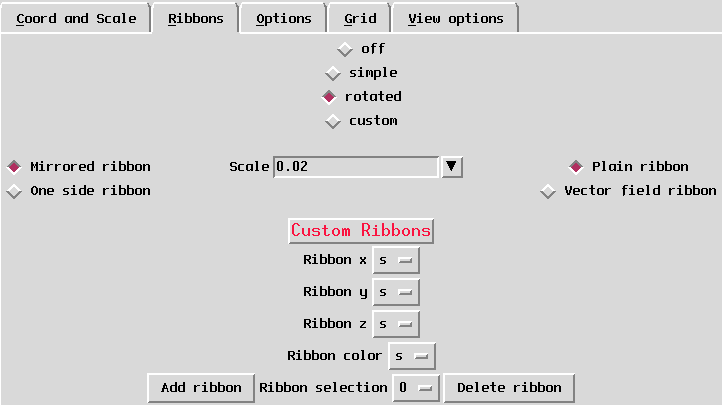
The Ribbons page for the
General rod problems module.
This module defines two macros for adding a ribbon to the centerline: the natural ribbon and the real ribbon. These ribbons, except for their color, are usually set by computing the D1 vector with the simple or rotated option in the Extra Data page from the Data control panel (see the previous subsection). The user can also use custom ribbons to visualize the solution.
At the top of the page there are 4 toggle buttons that can be used to
The line below the toggle buttons contains general properties that apply to all the ribbons, simple, rotated or custom.
The first one, linked to the left buttons on this line, allows the user to choose between a mirrored ribbon (symmetrical towards the centerline of the solution) and a one-sided ribbon. The default option is mirrored.
The second one, linked to the typein labeled "Scale" on the center on the line, scales all the ribbons with a real value.
The last one, linked to the top right buttons on this line, allows the user to choose between a ribbon drawn as a surface (plain) and as a vector field. By default the ribbons are drawn as surfaces.
The next part of the page concerns mainly the custom ribbons.
The four menus at the center of the page define each of the ribbons attached to the solution. The first three menus set the columns of the data used for the x, y, and z coordinates of the ribbon. The values in these columns are used relatively to the centerline. Thus, in each point of the solution, the ribbon will be defined by a vector with the origin on the centerline and with offset defined by the 3 coordinates.
A fourth coordinate sets the color the ribbon in relation with a column of the data. The ribbon also uses the colormap defined on the View Options page (see below).
These four coordinates are specific to each ribbon, and their values concern the current ribbon (see Ribbon selection below). By default they all have the 0 value, which usually designs the variable "s".
If the simple or the rotated ribbon is selected, then the four menus display the settings for these particular ribbons. If any of the four coordinates of the ribbon are changed while the simple or the rotated ribbon are chosen, then the macro attached to these ribbons is modified according to the new choice. This feature is especially designed to choose the color of these ribbons, for which there is no automatic way of setting it, but can also be used in a general way to program the two macros.
The bottom line on this page allow the user to work with several ribbons attached to the same solution. These buttons have no effect under the simple or the rotated choice of ribbon.
The first button on this line, labeled "Add ribbon", adds a new ribbon to the solution, as its name states its. The particularity of this operation is that if the ribbons are off, they will be turned on, without adding a new ribbon. A consequent message will also be printed on the standard output.
The next widget on this line, labeled "Ribbon selection", allow to choose the current ribbon. This selection will have the effect of setting all the values on the middle line as being the ones of the selected ribbon. It also designates the ribbon number to be deleted by the "Delete ribbon" operation. When adding a new ribbon, this value will automatically be updated to the last ribbon number, so the new ribbon can be set right away.
The next button, labeled "Delete ribbon", will delete the current ribbon. If the ribbon is the last added, then the current ribbon becomes the previous one. Otherwise, the current ribbon conserves its number, but of course, its identity is different, because the remaining ribbons are shifted. The coordinates of the ribbon are also updated according to the current ribbon selection. The particularity of this button is that if there is only one ribbon left, it will not be deleted, but turned off instead. A consequent message is also printed on the standard output.
Note. Any of the described actions on this page will not have any visual effect until the "Draw" button is pressed. The macros defining the simple and rotated ribbon are also recorded when the visualization options are saved in a file, and can automatically be retrieved afterwards.