
Results
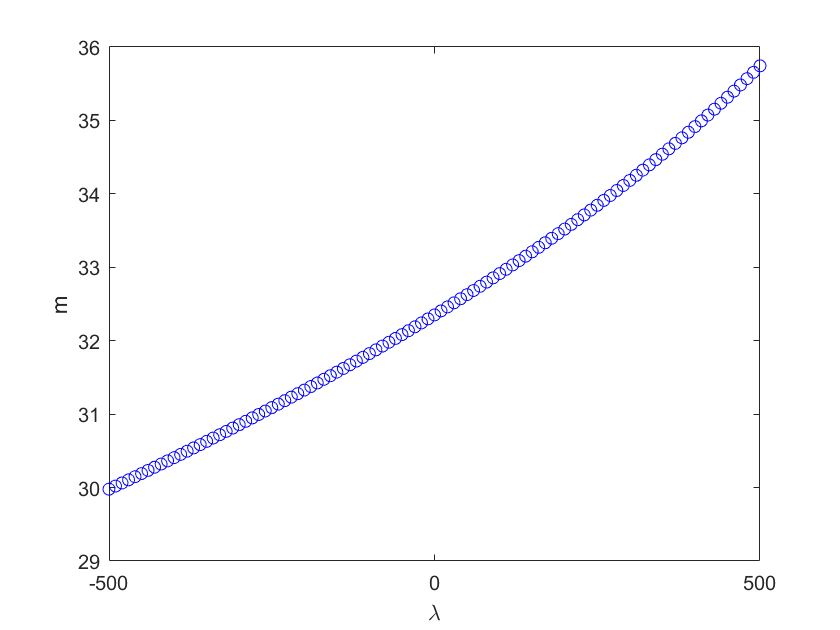
Kahn-Crothers
2D plot of the lambda values versus the number of links m.
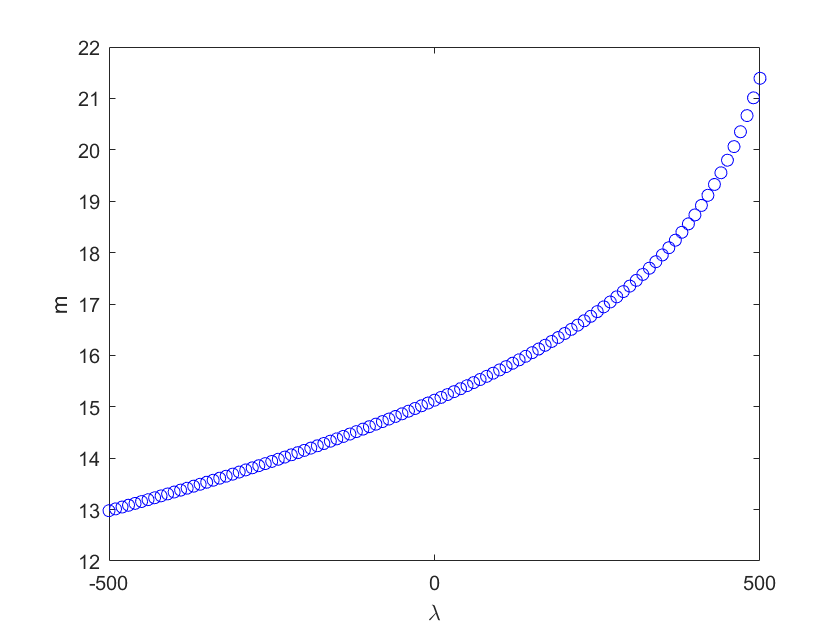
MATLAB figures saved variables: KC-LAMBDA.fig
KC-PSD.fig
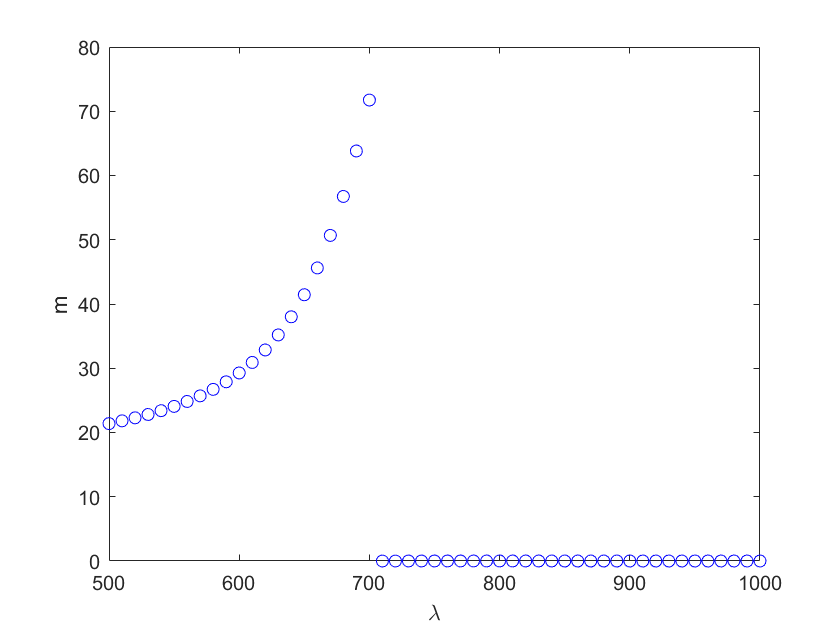
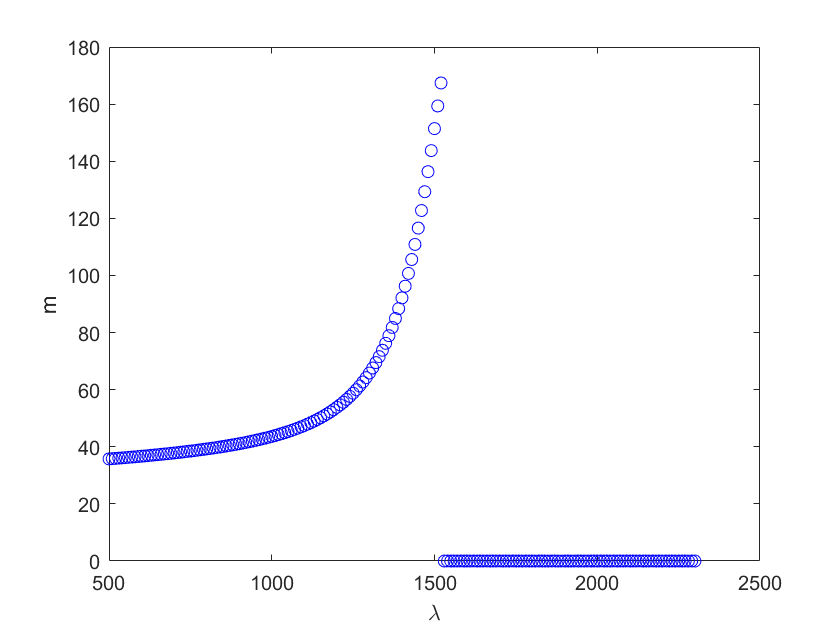
Pyne 251bp
2D plot of the lambda values versus the number of links m.
MATLAB figures saved variables: P251-LAMBDA.fig
P251-PSD.fig
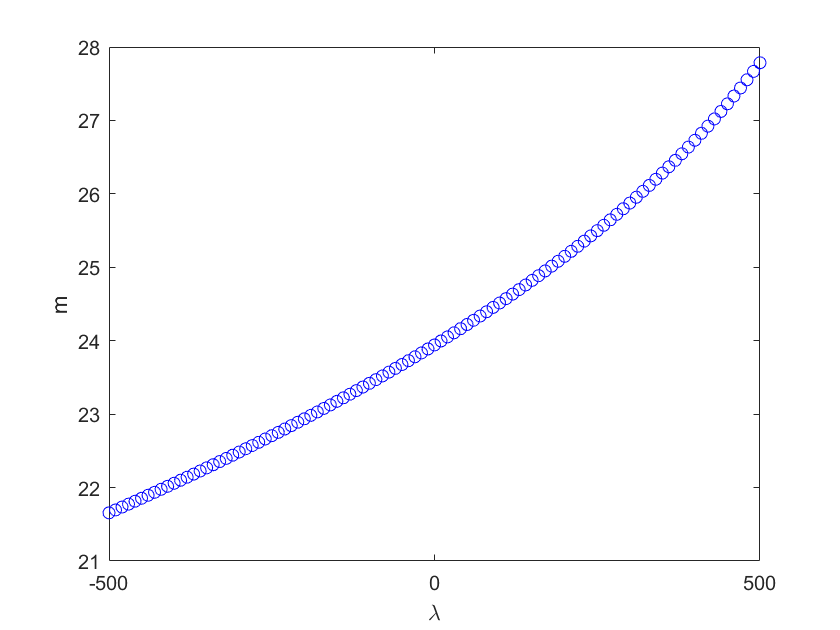
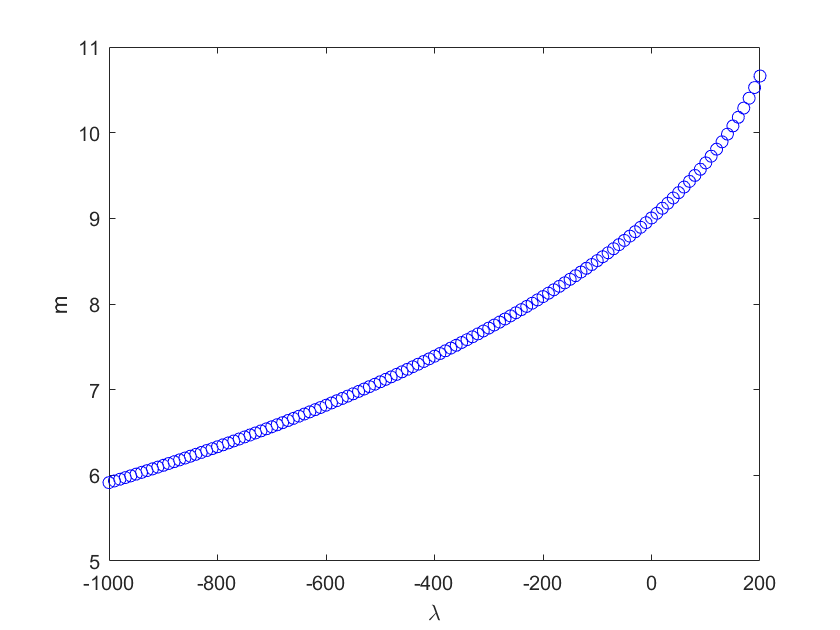
Pyne 339bp
2D plot of the lambda values versus the number of links m.
MATLAB figures saved variables: P339-LAMBDA.fig
P339-PSD.fig
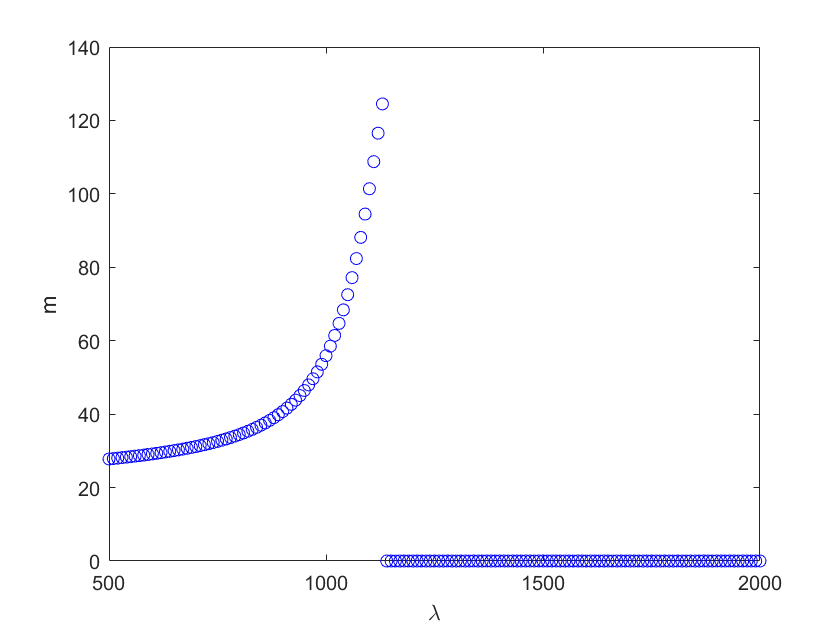
Widom
2D plot of the lambda values versus the number of links m.
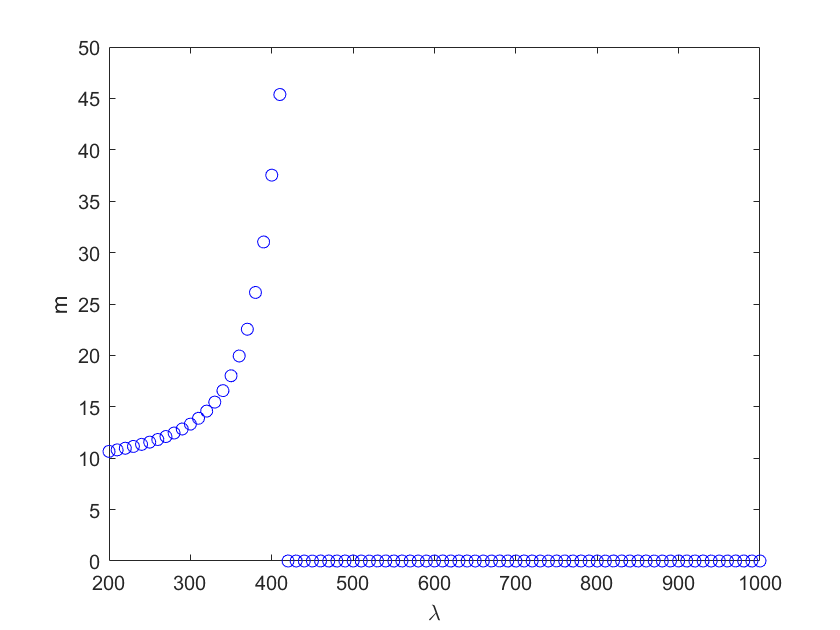
MATLAB figures saved variables: W-LAMBDA.fig
W-PSD.fig