
Computations for Pyne et al. 251 bp sequence
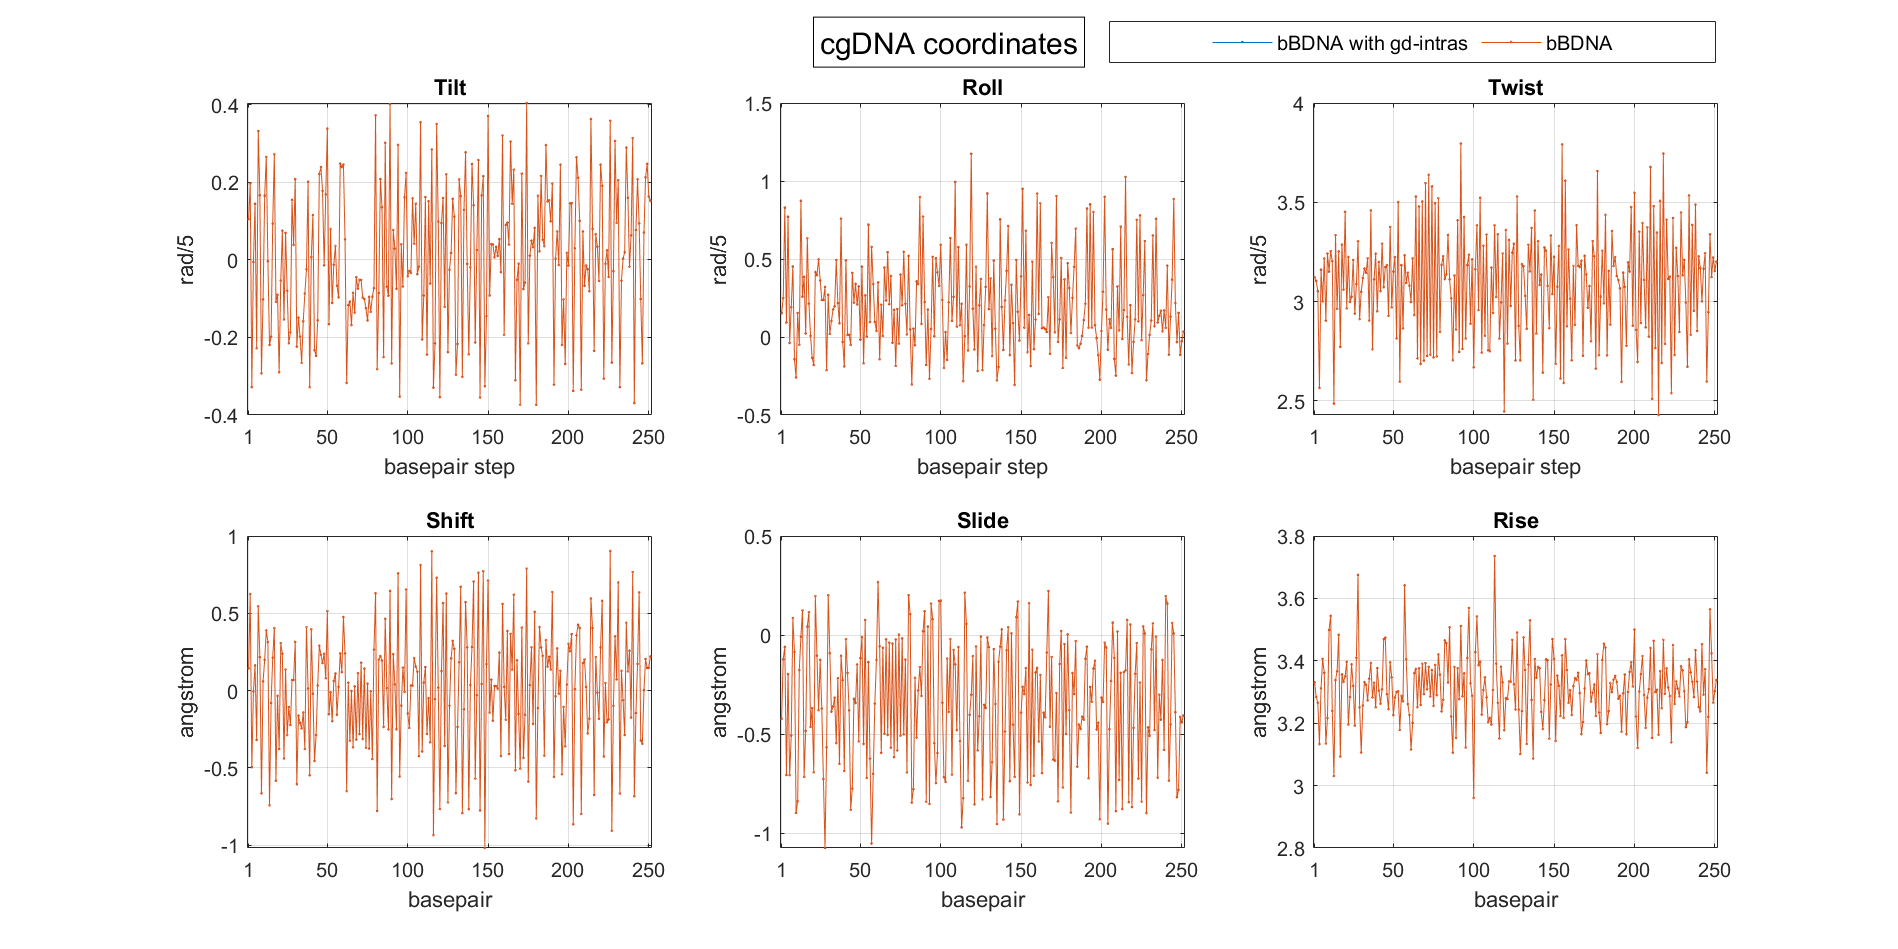
In this page we show the minimizations results for each initial guess. In the table we show the energy, the norm of the gradient of the energy function with the obtained configuration, some data of the eigenvalues and the Hessian condition number. In particular what we can observe in this case is that all the solutions have only positive eigenvalues.
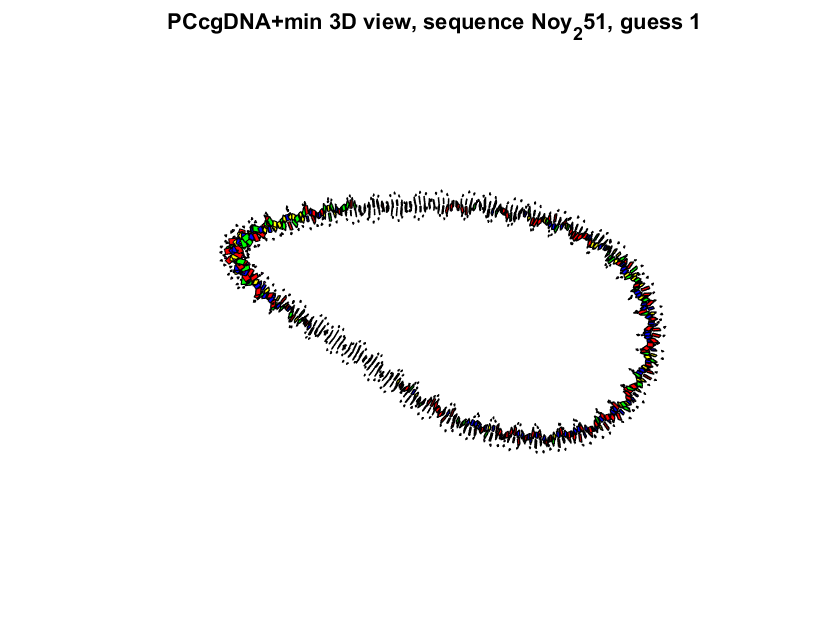
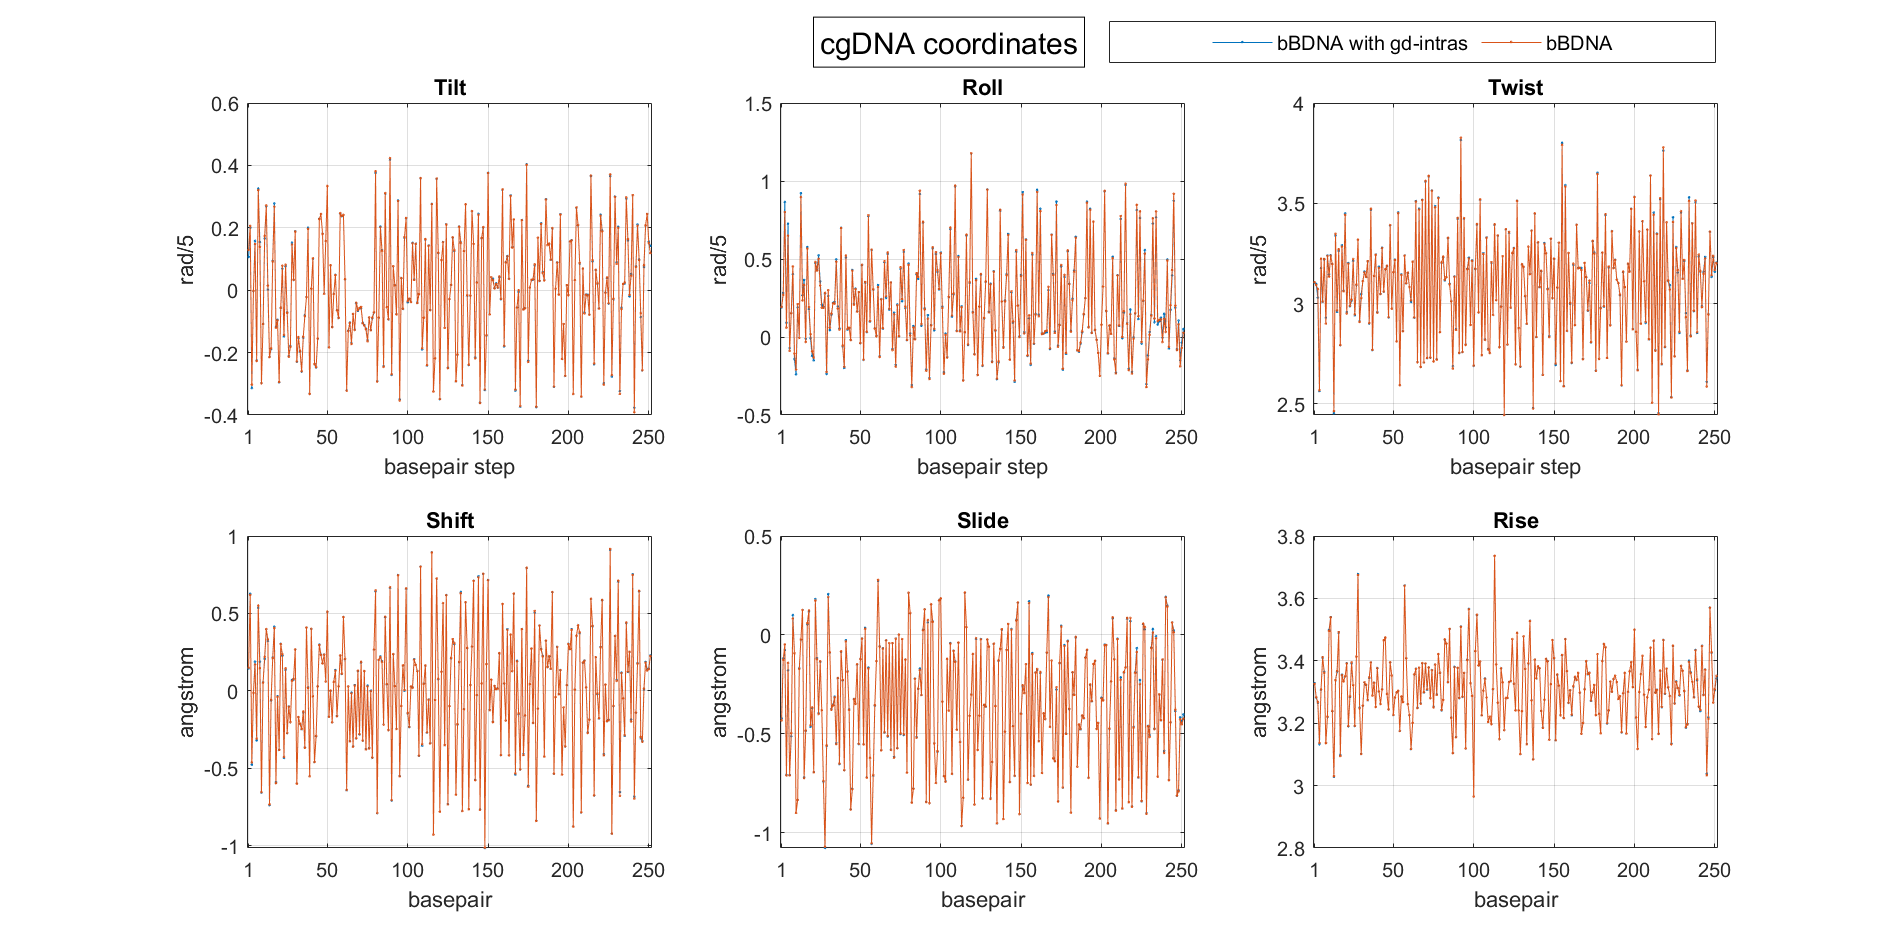
Solution for initial guess A:
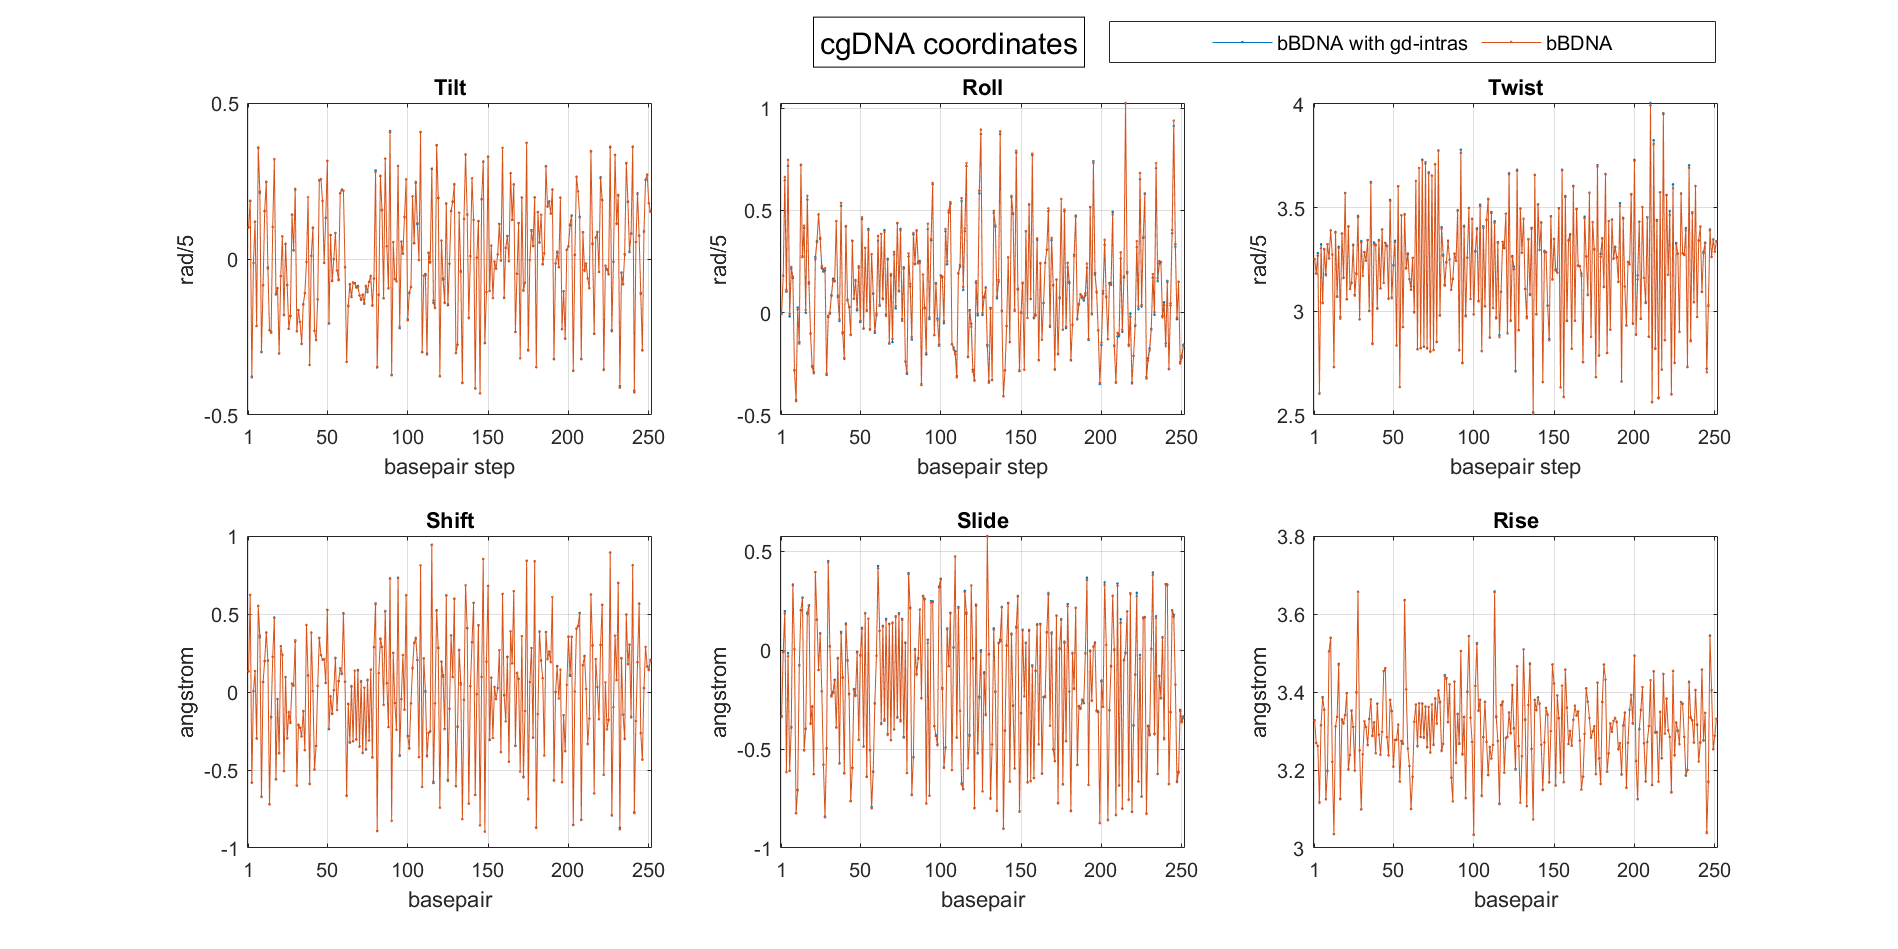
We used fminunc Matlab function with Trust Region algorithm and tolerance for the first order optimality of 1.0e − 6. The absolute difference of the two configurations obtained with the two different initial guesses is of the order of 10e −02.
| bBDNA | bBDNA with gd-intras | |
| Energy | 39.6014 | 39.5334 |
| Norm of the gradient | 0.0082 | 0.0079 |
| Min Hess eigenvalue | 2.0416e-06 | 2.1203e-07 |
| Max Hess eigenvalue | 6.7709e+04 | 6.7768e+04 |
| Median Hess eigenvalue | 11.6407 | 11.6404 |
| Number of negative eigenvalues | 0 | 0 |
| Hessian condition number | 8.4430e+10 | 8.8909e+11 |
| Number of links | 25 | 25 |
3D plot of the configuration obtained with the bBDNA initial guess.
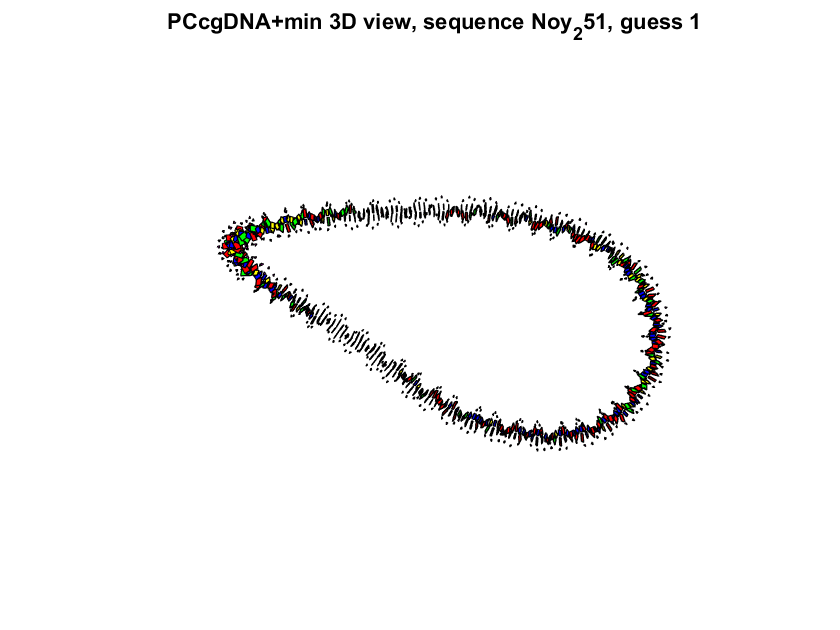
MATLAB figures saved variables: P251-3D-GUESS1-bBDNA.fig
P251-3D-GUESS1-bBDNAgd.fig
P251-2D-GUESS4.fig
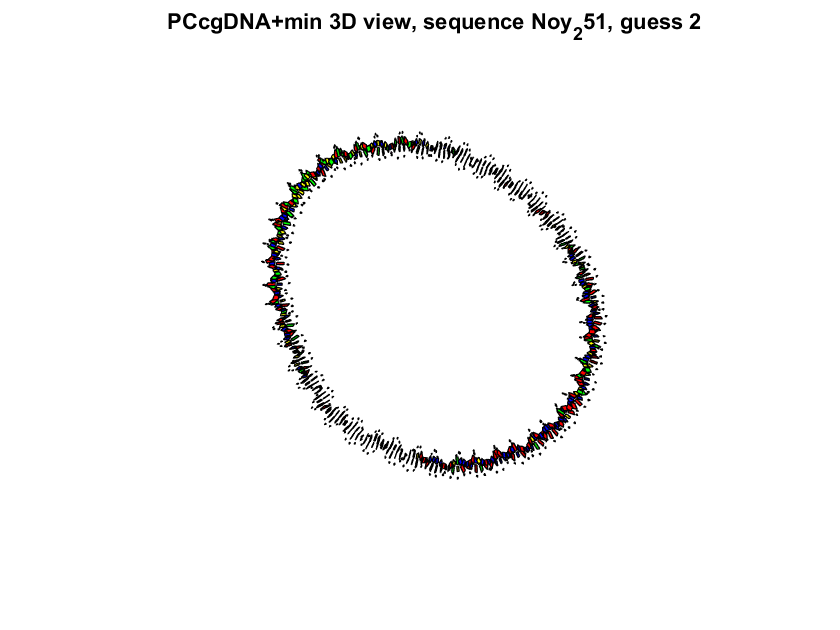
Solution for initial guess B:
We used fminunc Matlab function with Trust Region algorithm and tolerance for the first order optimality of 1.0e − 6. The absolute difference of the two configurations obtained with the two different initial guesses is of the order of 10e −02.
| bBDNA | bBDNA with gd-intras | |
| Energy | 16.4158 | 16.4159 |
| Norm of the gradient | 0.0332 | 0.0333 |
| Min Hess eigenvalue | 5.3207e-07 | 5.8142e-07 |
| Max Hess eigenvalue | 6.0911e+04 | 6.7323e+04 |
| Median Hess eigenvalue | 11.6002 | 11.6011 |
| Number of negative eigenvalues | 0 | 0 |
| Hessian condition number | 7.9421e+10 | 8.1229e+11 |
| Number of links | 24 | 24 |
3D plot of the configuration obtained with the bBDNA initial guess.

MATLAB figures and saved variables:
P251-3D-GUESS2-bBDNA.fig
P251-3D-GUESS2-bBDNAgd.fig
P251-2D-GUESS2.fig
Solution for initial guess C:
We used fminunc Matlab function with Trust Region algorithm and tolerance for the first order optimality of 1.0e − 6. The absolute difference of the two configurations obtained with the two different initial guesses is of the order of 10e −02.
| bBDNA | bBDNA with gd-intras | |
| Energy | 17.0876 | 17.1798 |
| Norm of the gradient | 0.0232 | 0.0234 |
| Min Hess eigenvalue | 7.9233e-07 | 7.9302e-07 |
| Max Hess eigenvalue | 7.2311e+04 | 7.2308e+04 |
| Median Hess eigenvalue | 11.6631 | 11.6632 |
| Number of negative eigenvalues | 0 | 0 |
| Hessian condition number | 3.6720e+11 | 8.9902e+11 |
| Number of links | 24 | 24 |
3D plot of the configuration obtained with the bBDNA initial guess.
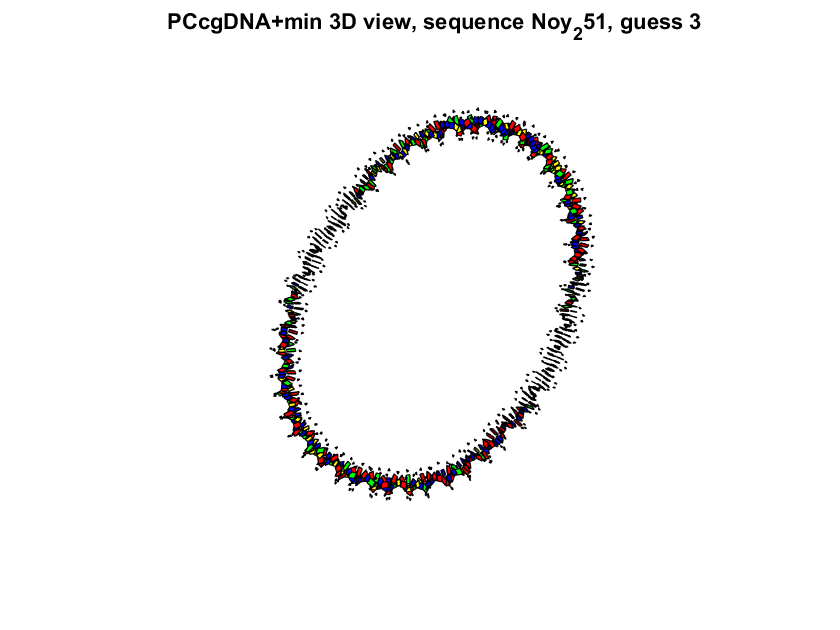
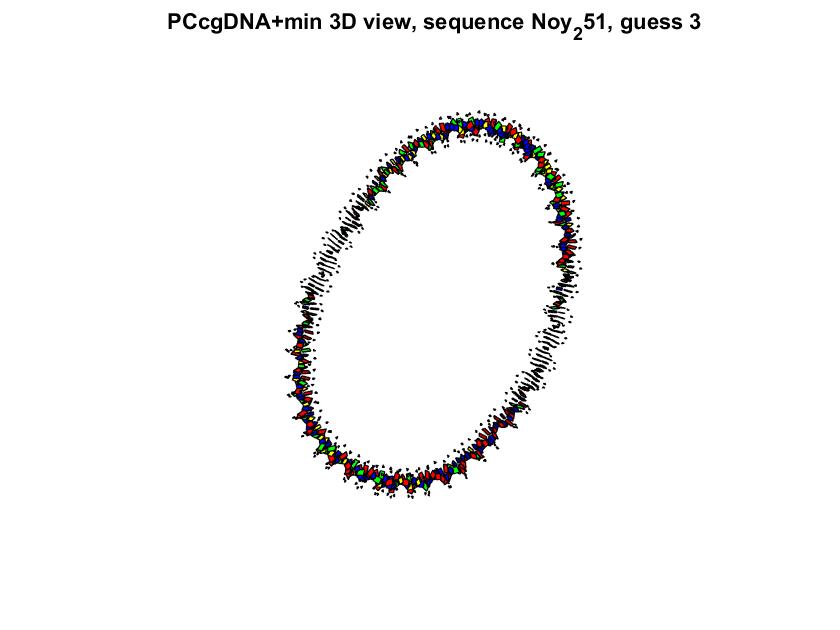

MATLAB figures and saved variables:
P251-3D-GUESS3-bBDNA.fig
P251-3D-GUESS3-bBDNAgd.fig
P251-2D-GUESS3.fig
Solution for initial guess D:
We used fminunc Matlab function with Trust Region algorithm and tolerance for the first order optimality of 1.0e − 6. The absolute difference of the two configurations obtained with the two different initial guesses is of the order of 10e −02.
| bBDNA | bBDNA with gd-intras | |
| Energy | 16.6328 | 16.3974 |
| Norm of the gradient | 0.0572 | 0.0424 |
| Min Hess eigenvalue | 1.5211e-07 | 2.1331e-07 |
| Max Hess eigenvalue | 6.7081e+04 | 6.7083e+04 |
| Median Hess eigenvalue | 11.6248 | 11.6250 |
| Number of negative eigenvalues | 0 | 0 |
| Hessian condition number | 9.9887e+10 | 9.9887e+11 |
| Number of links | 24 | 24 |
3D plot of the configuration obtained with the bBDNA initial guess.
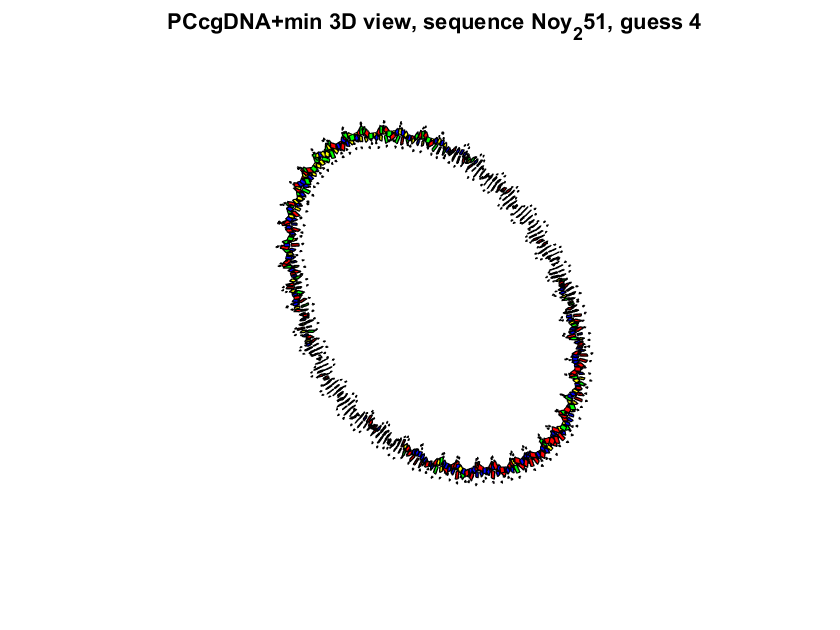

MATLAB figures and saved variables:
P251-3D-GUESS4-bBDNA.fig
P251-3D-GUESS4-bBDNAgd.fig
P251-2D-GUESS4.fig