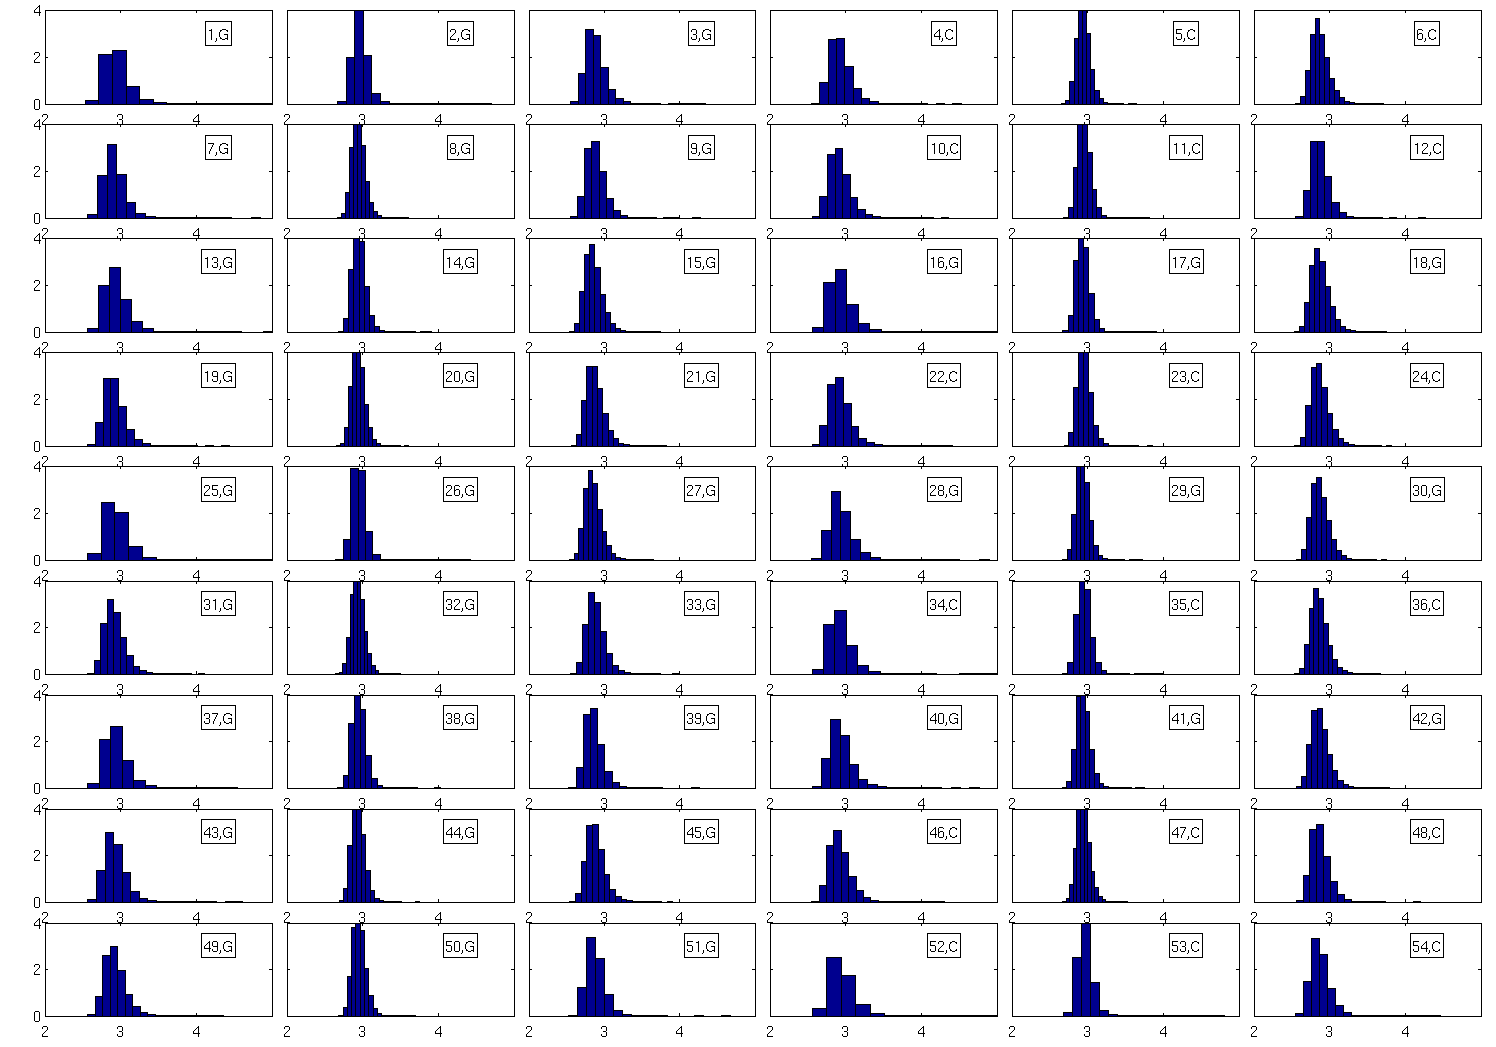
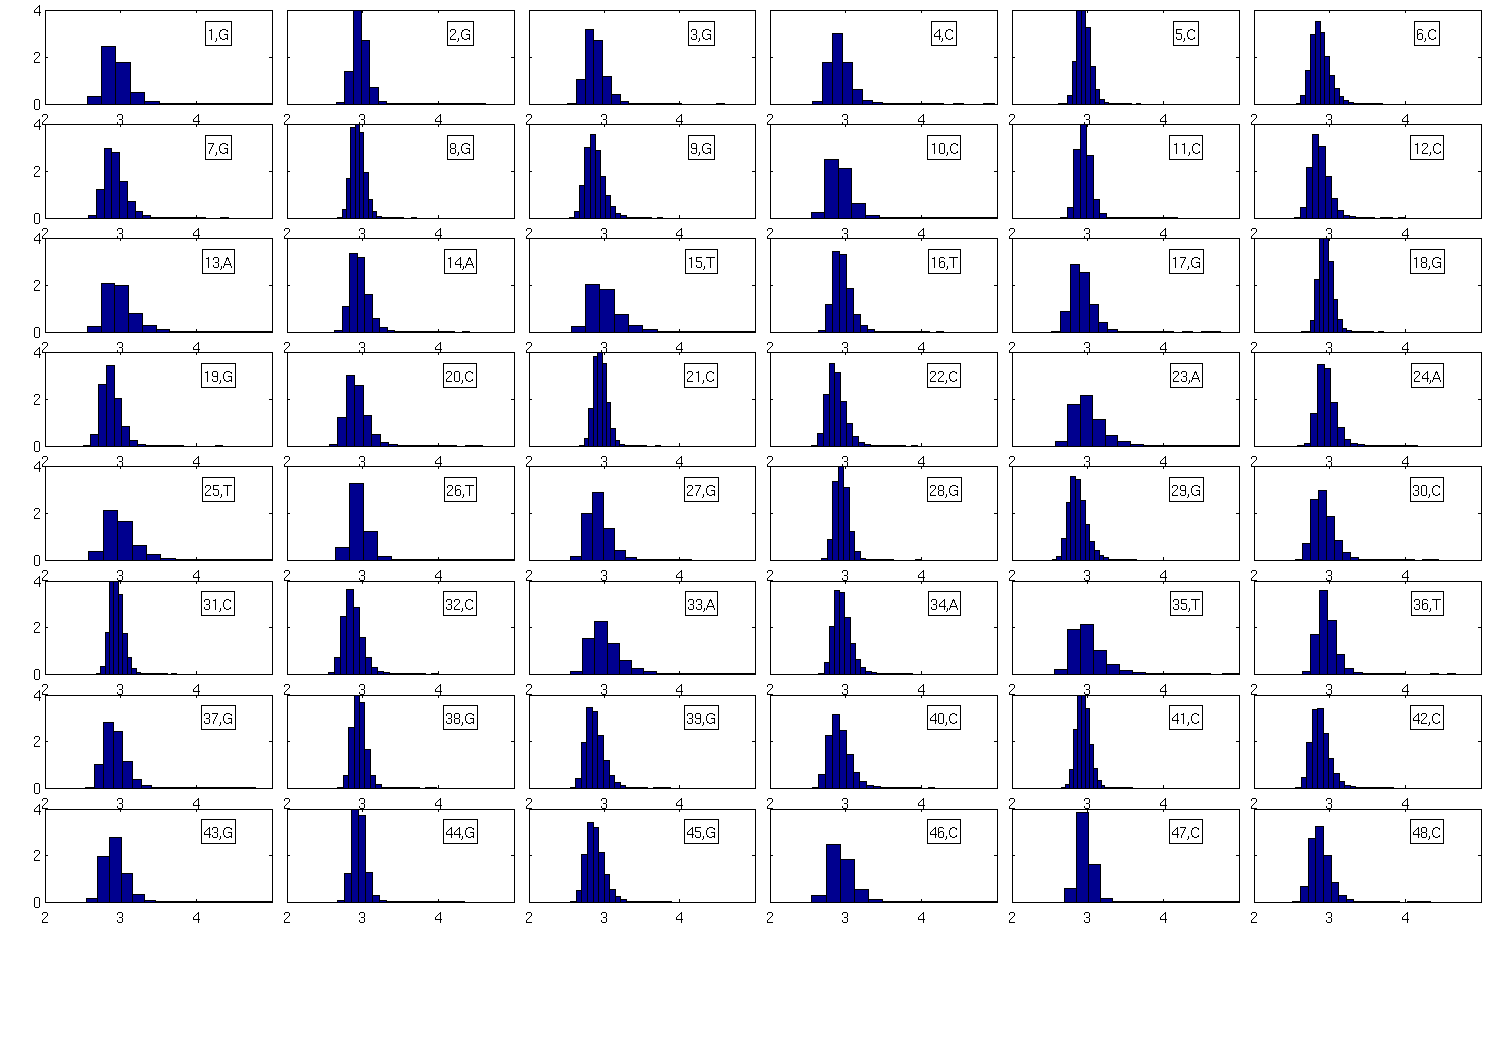
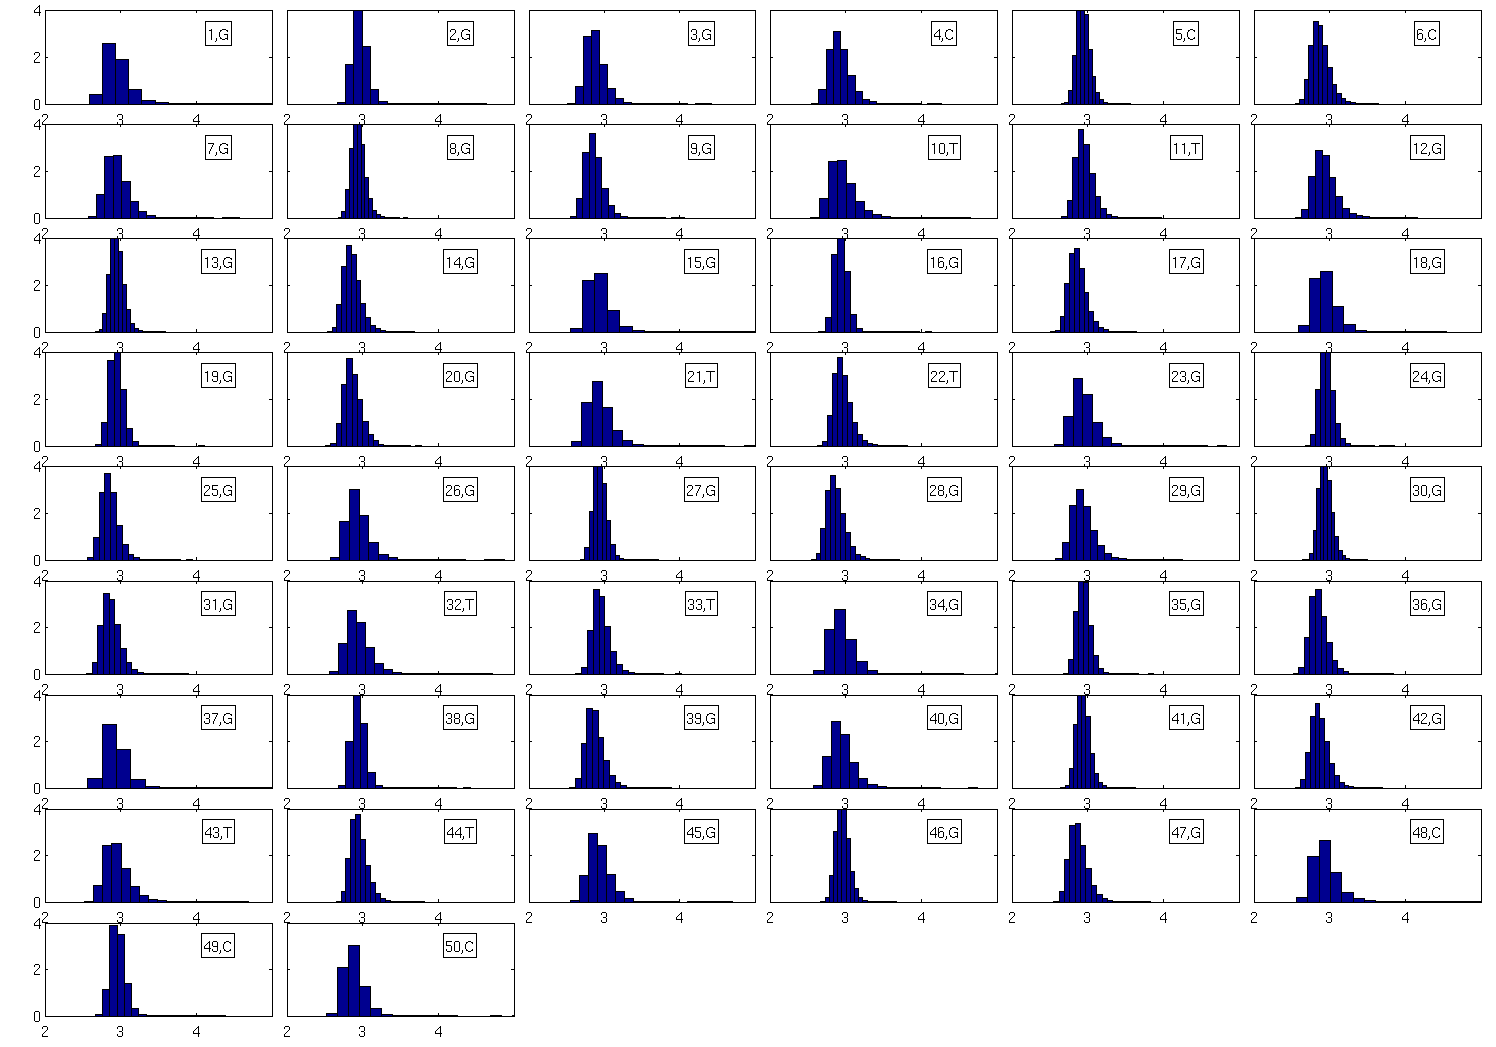
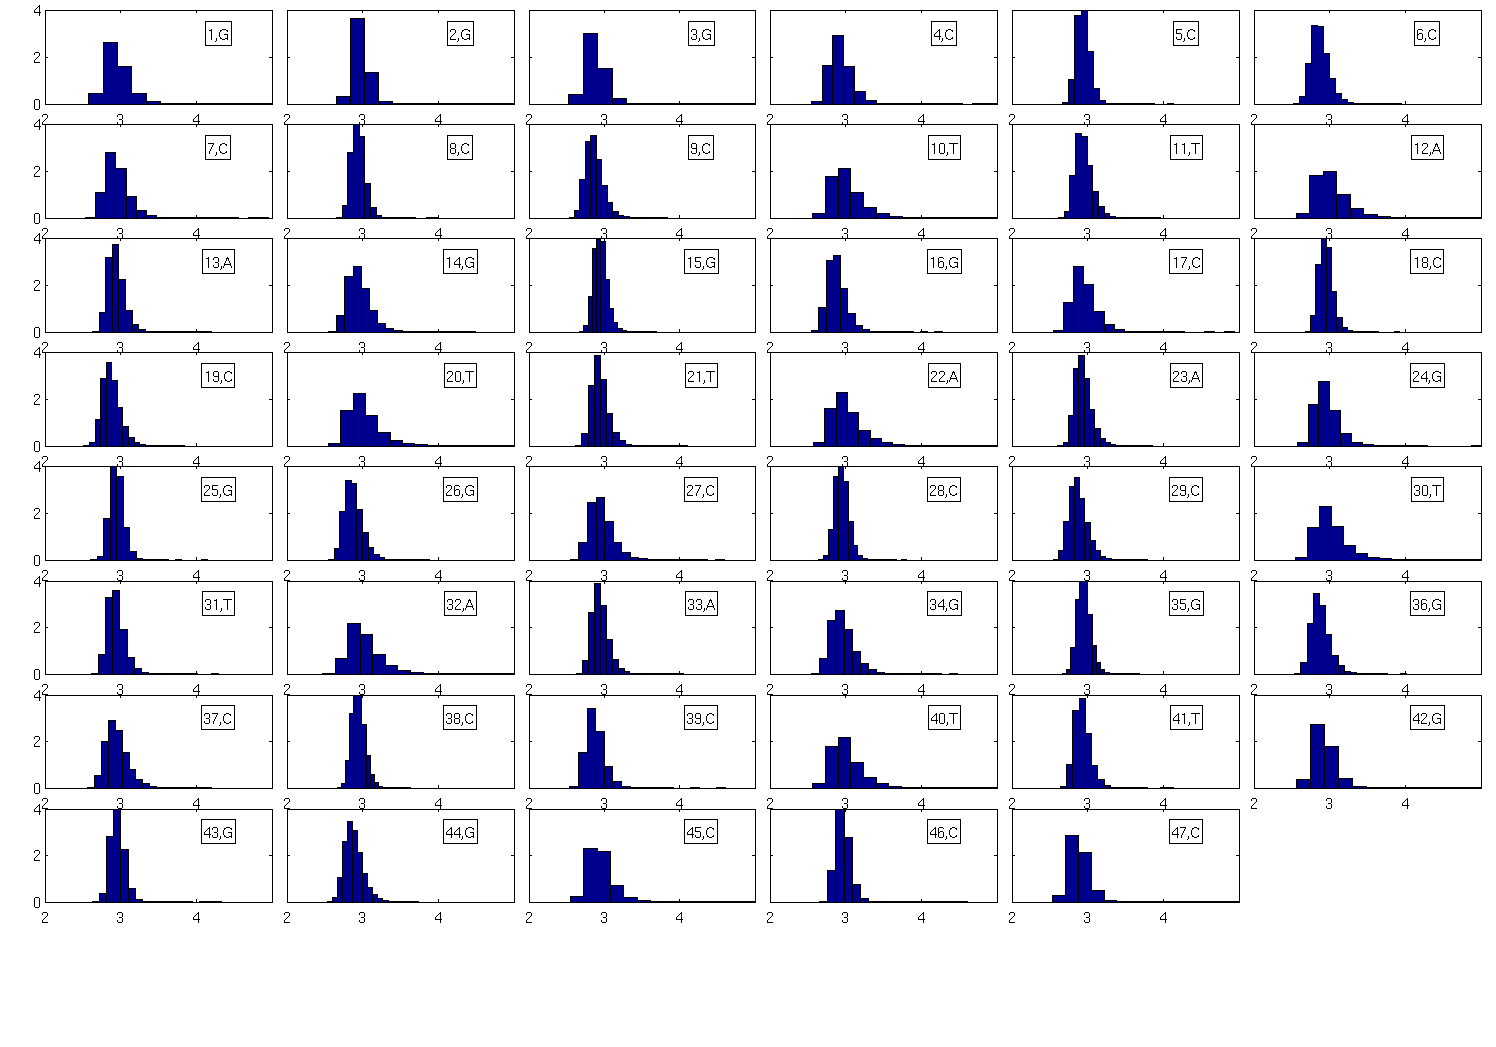
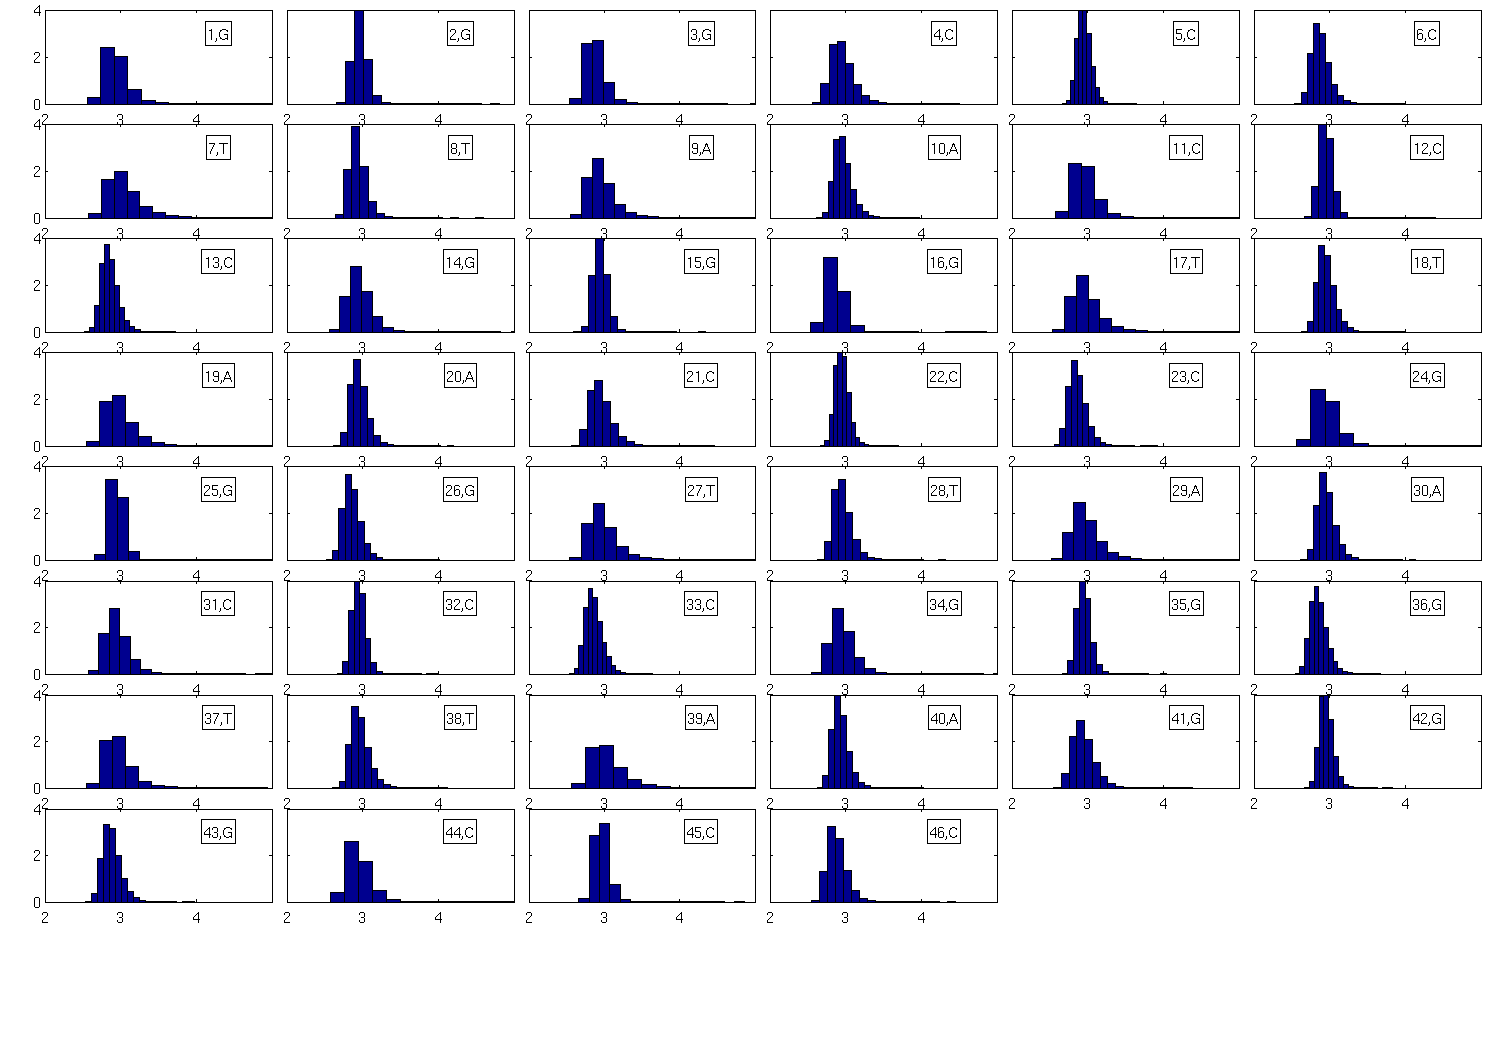
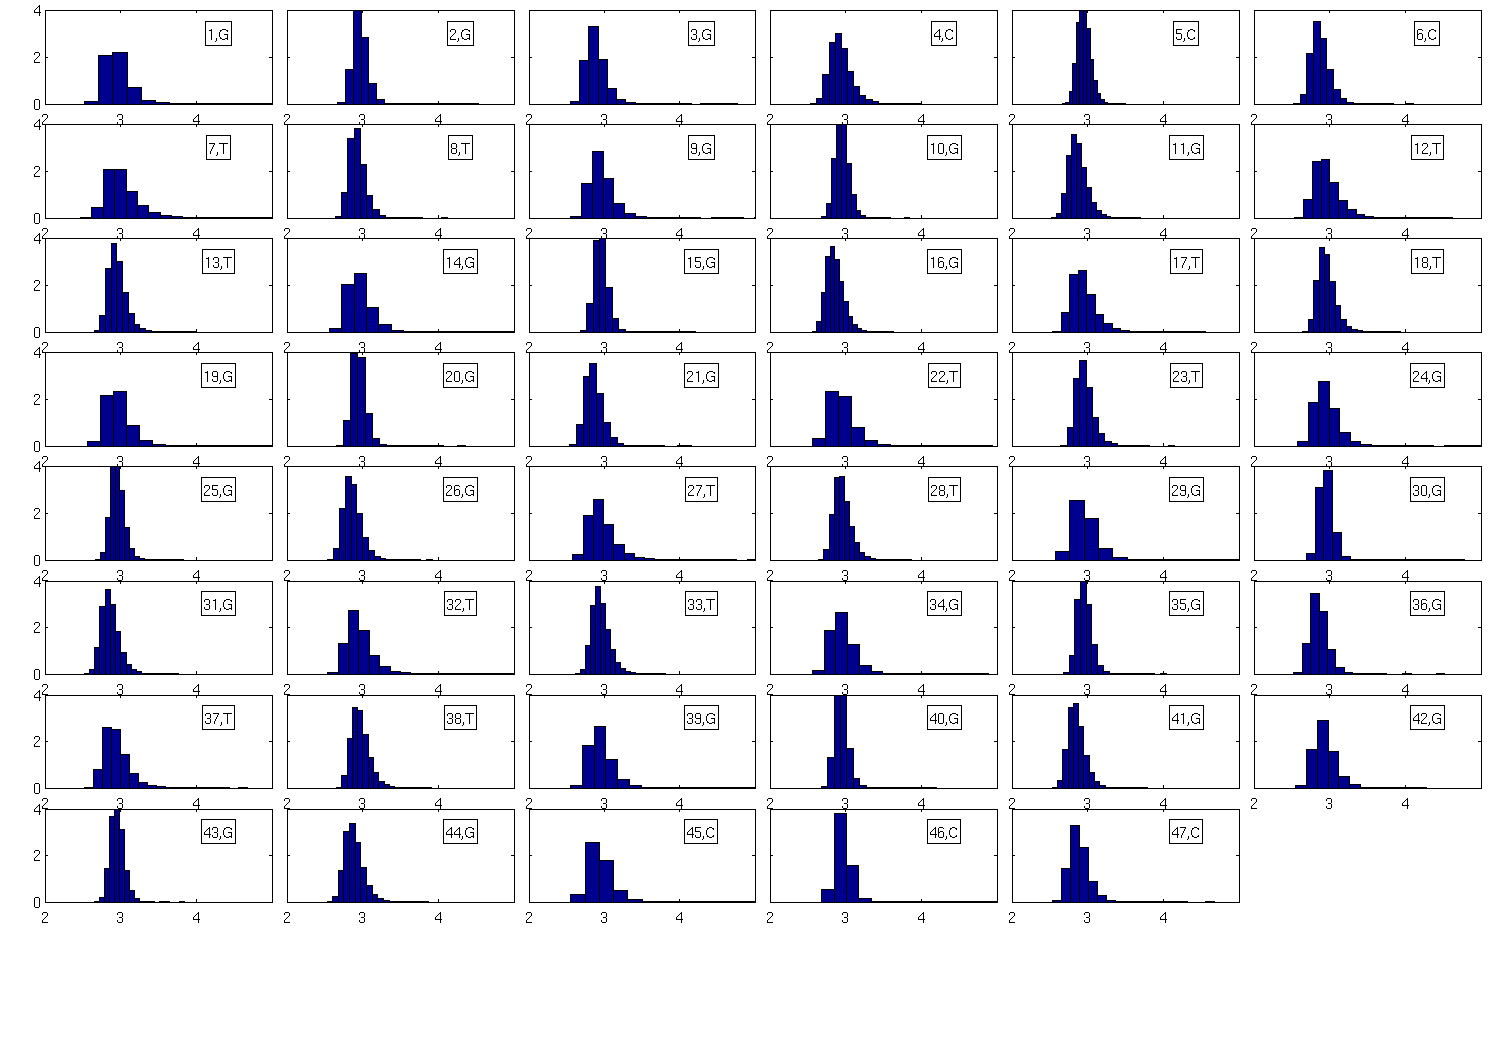
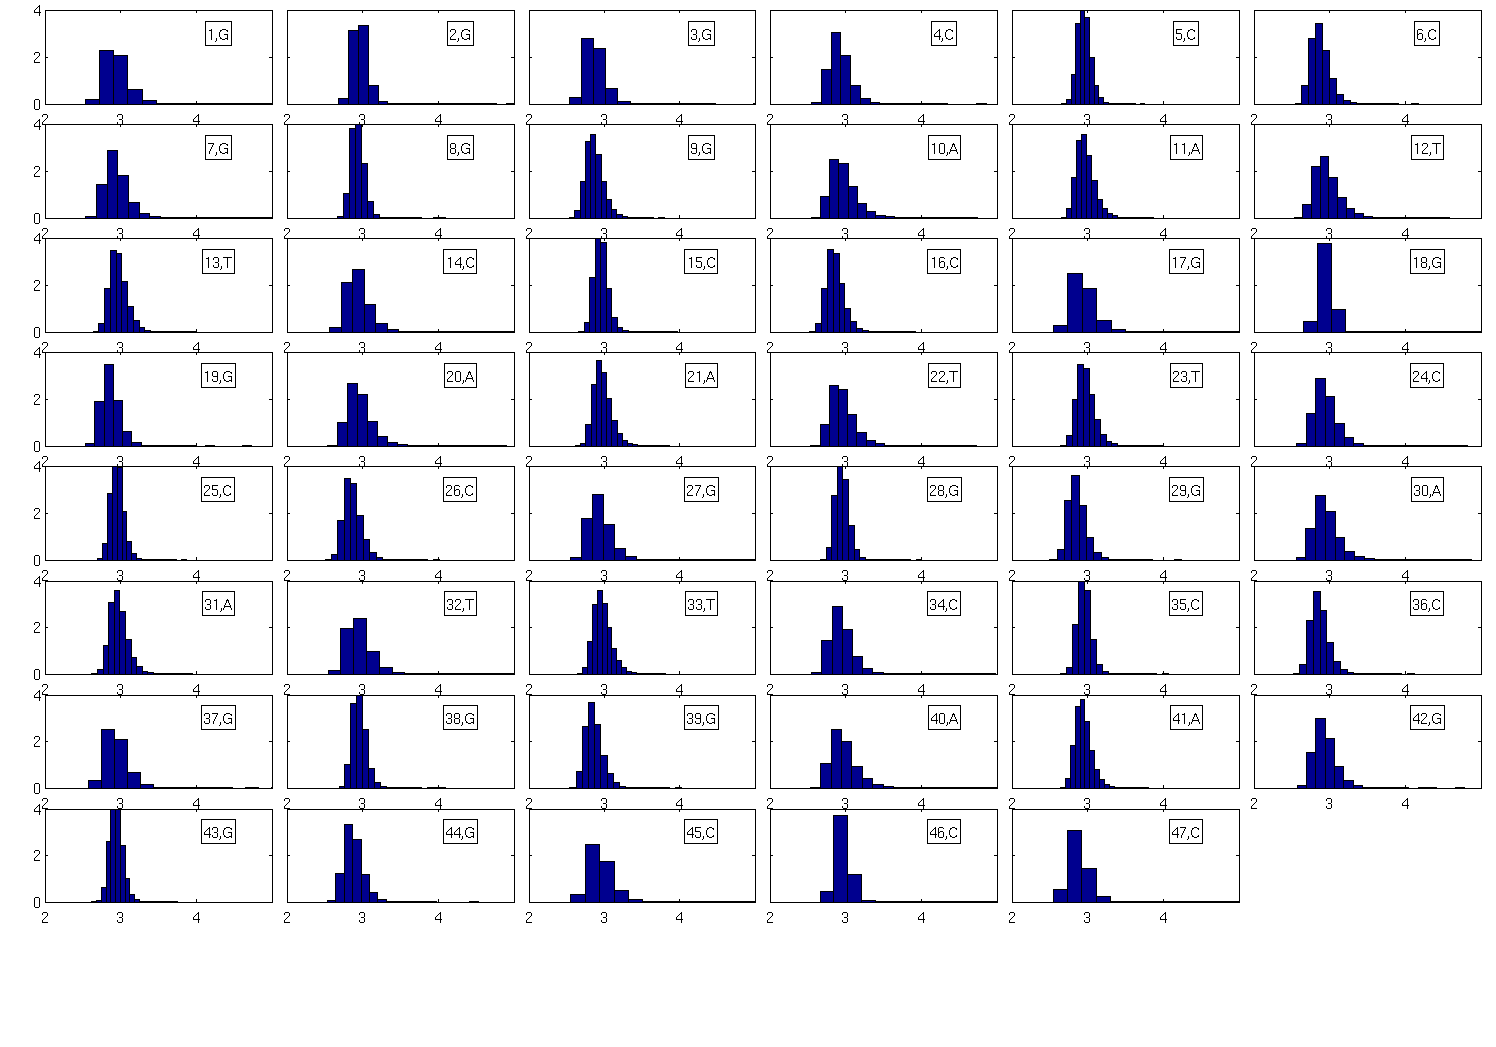
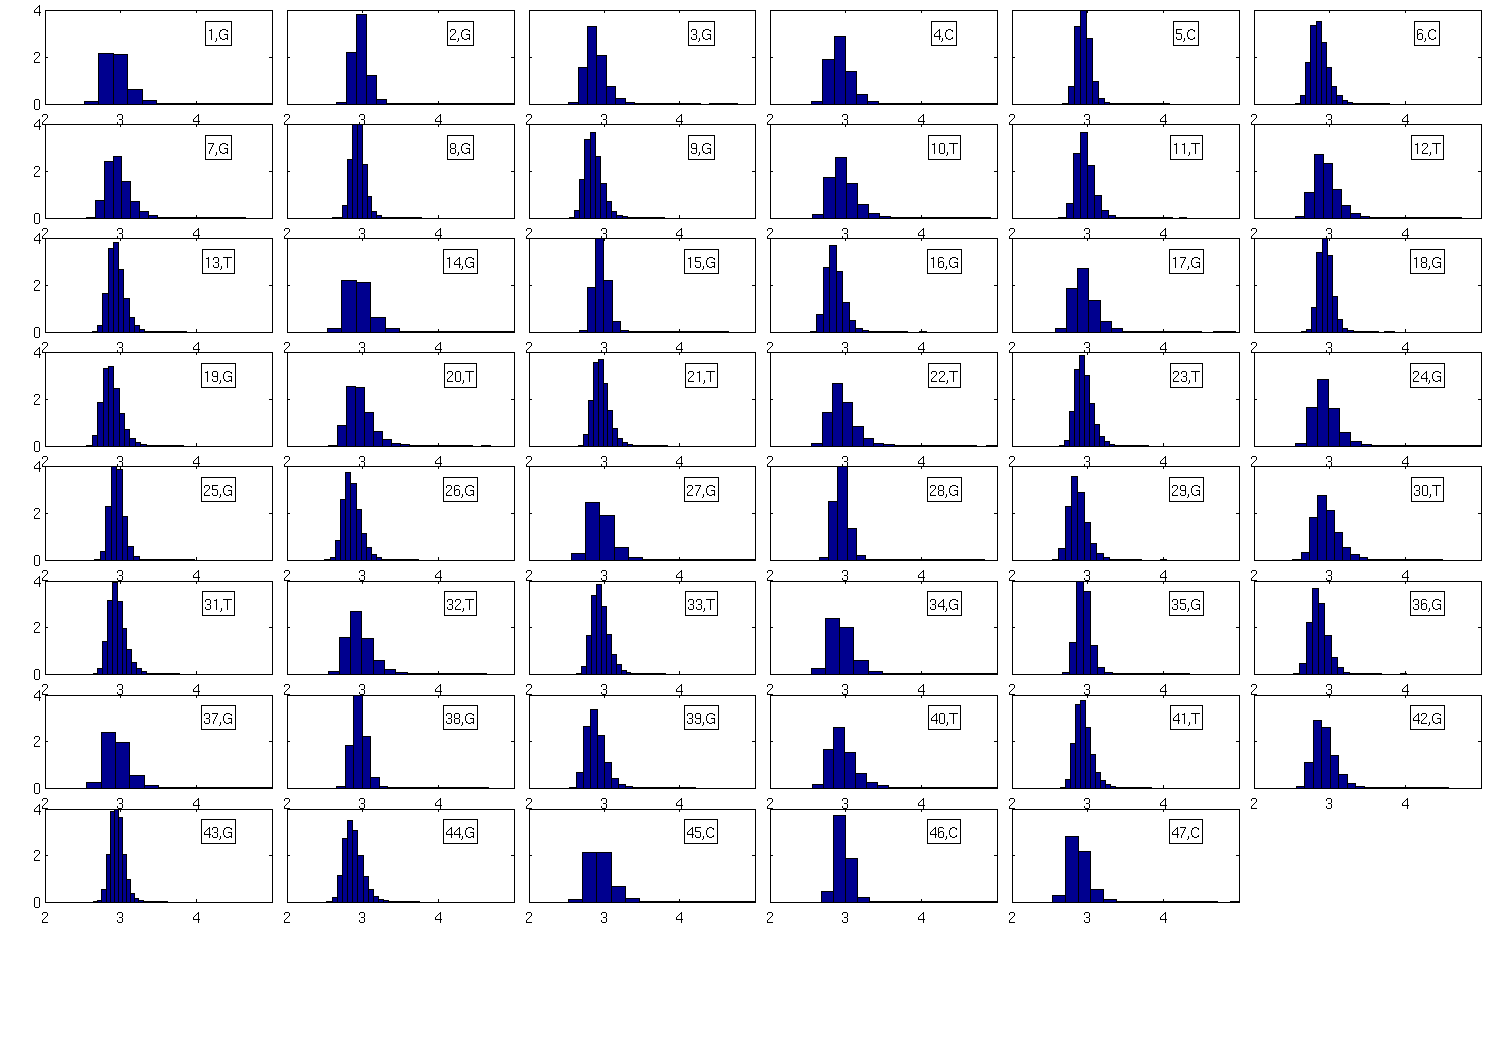
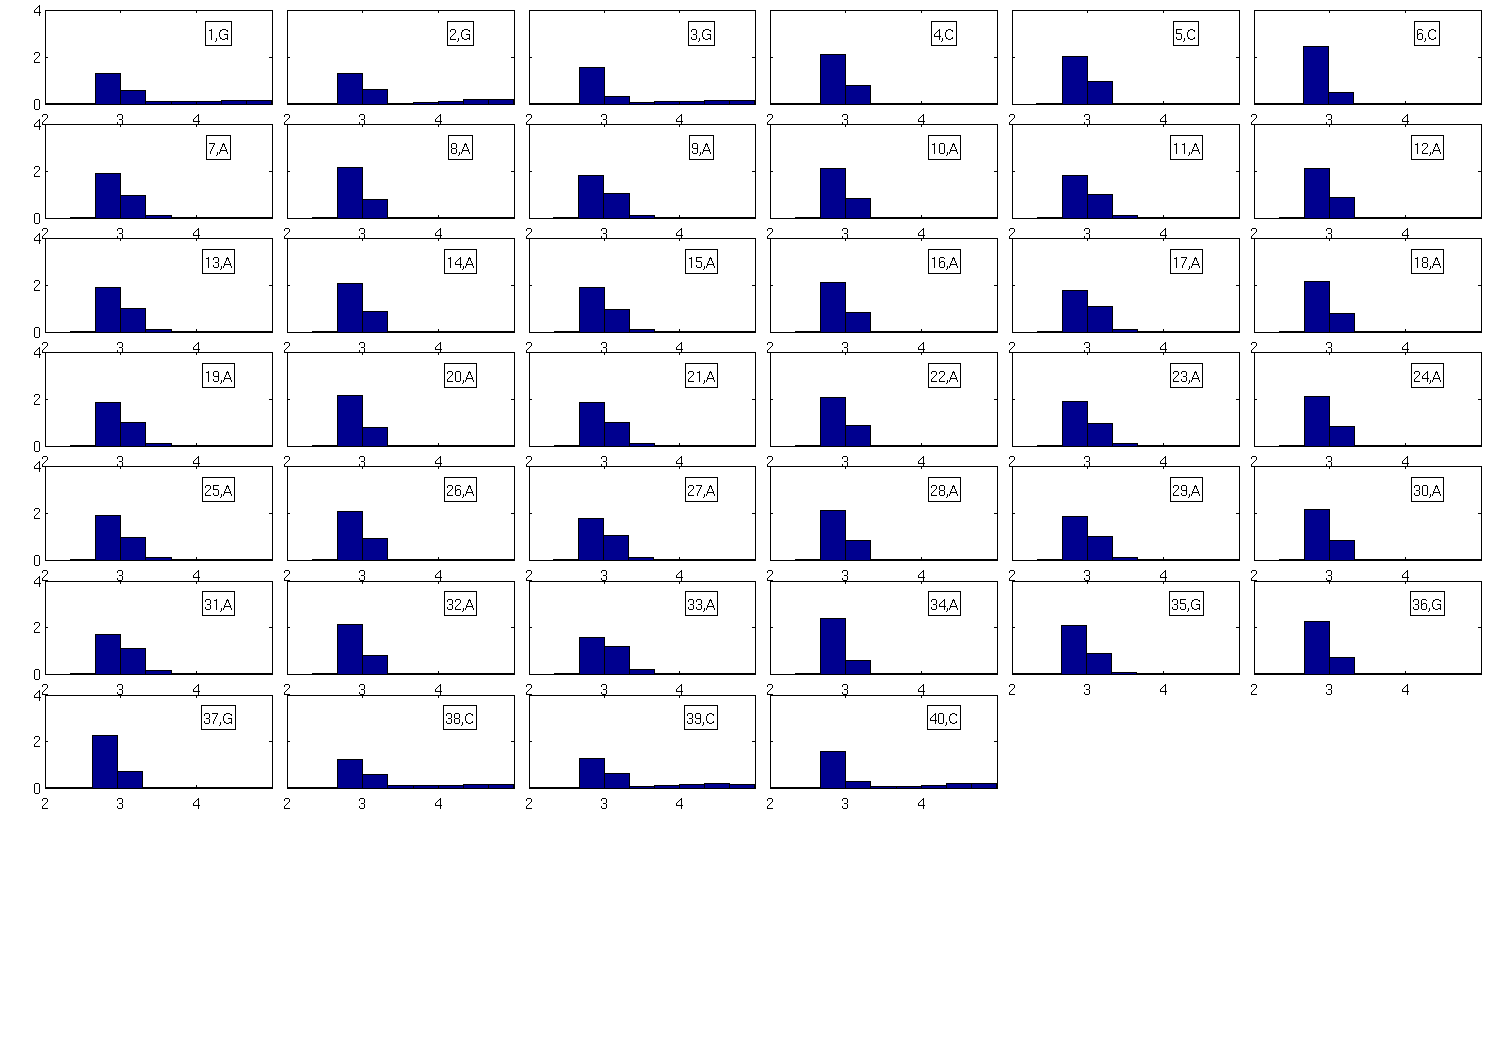
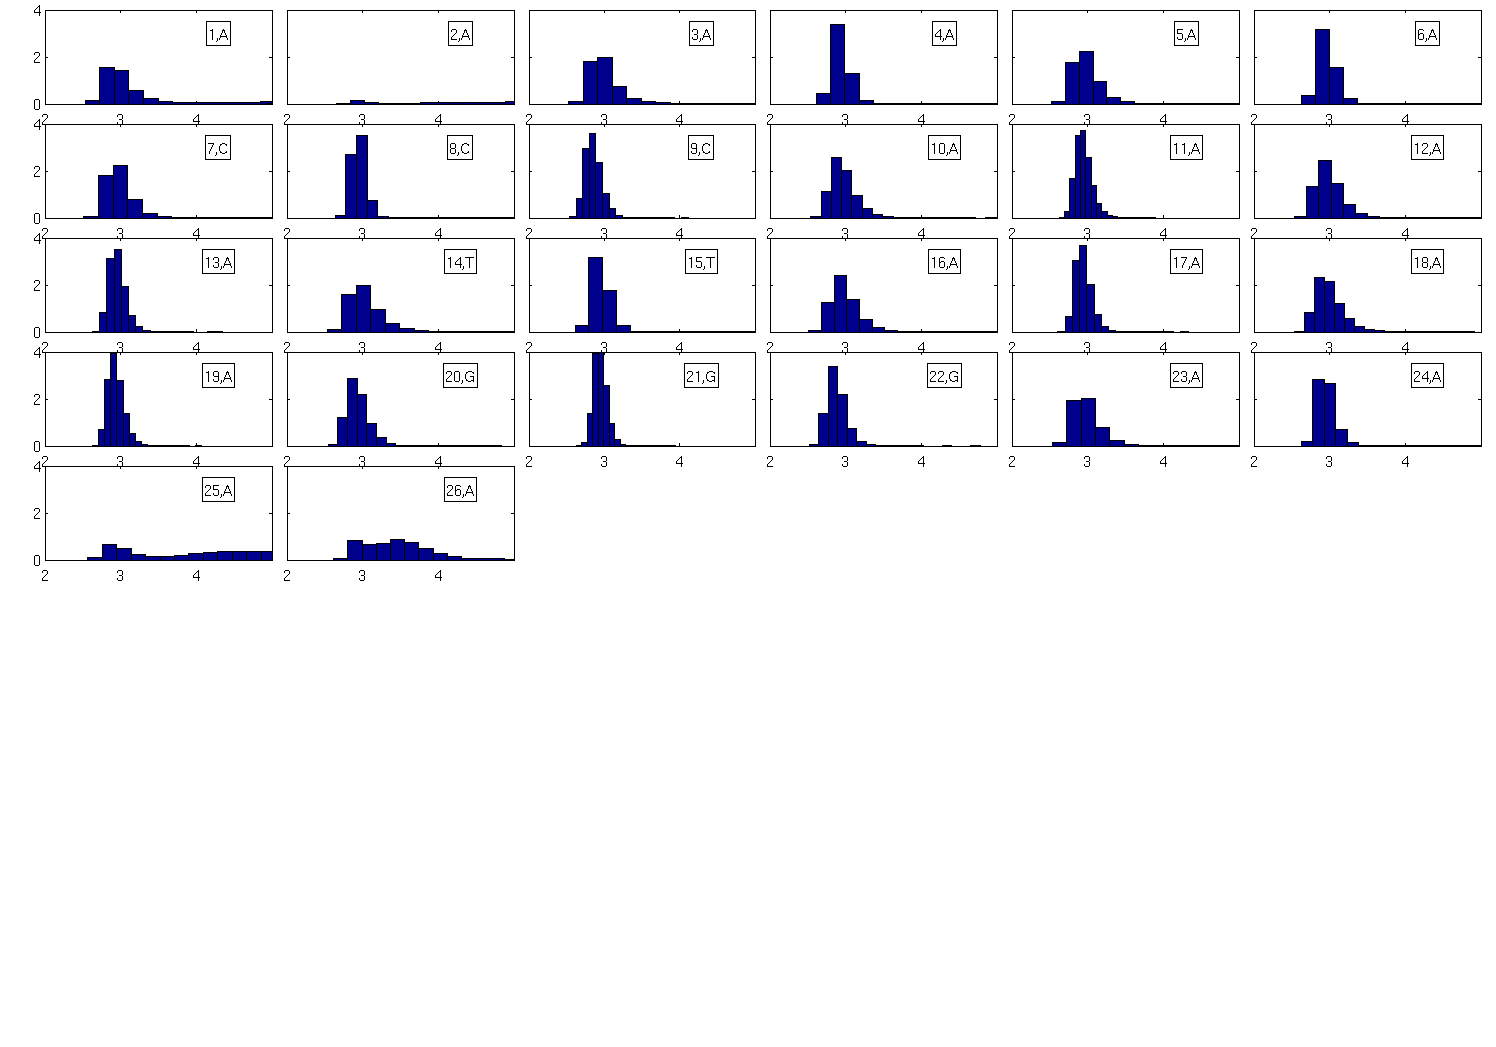
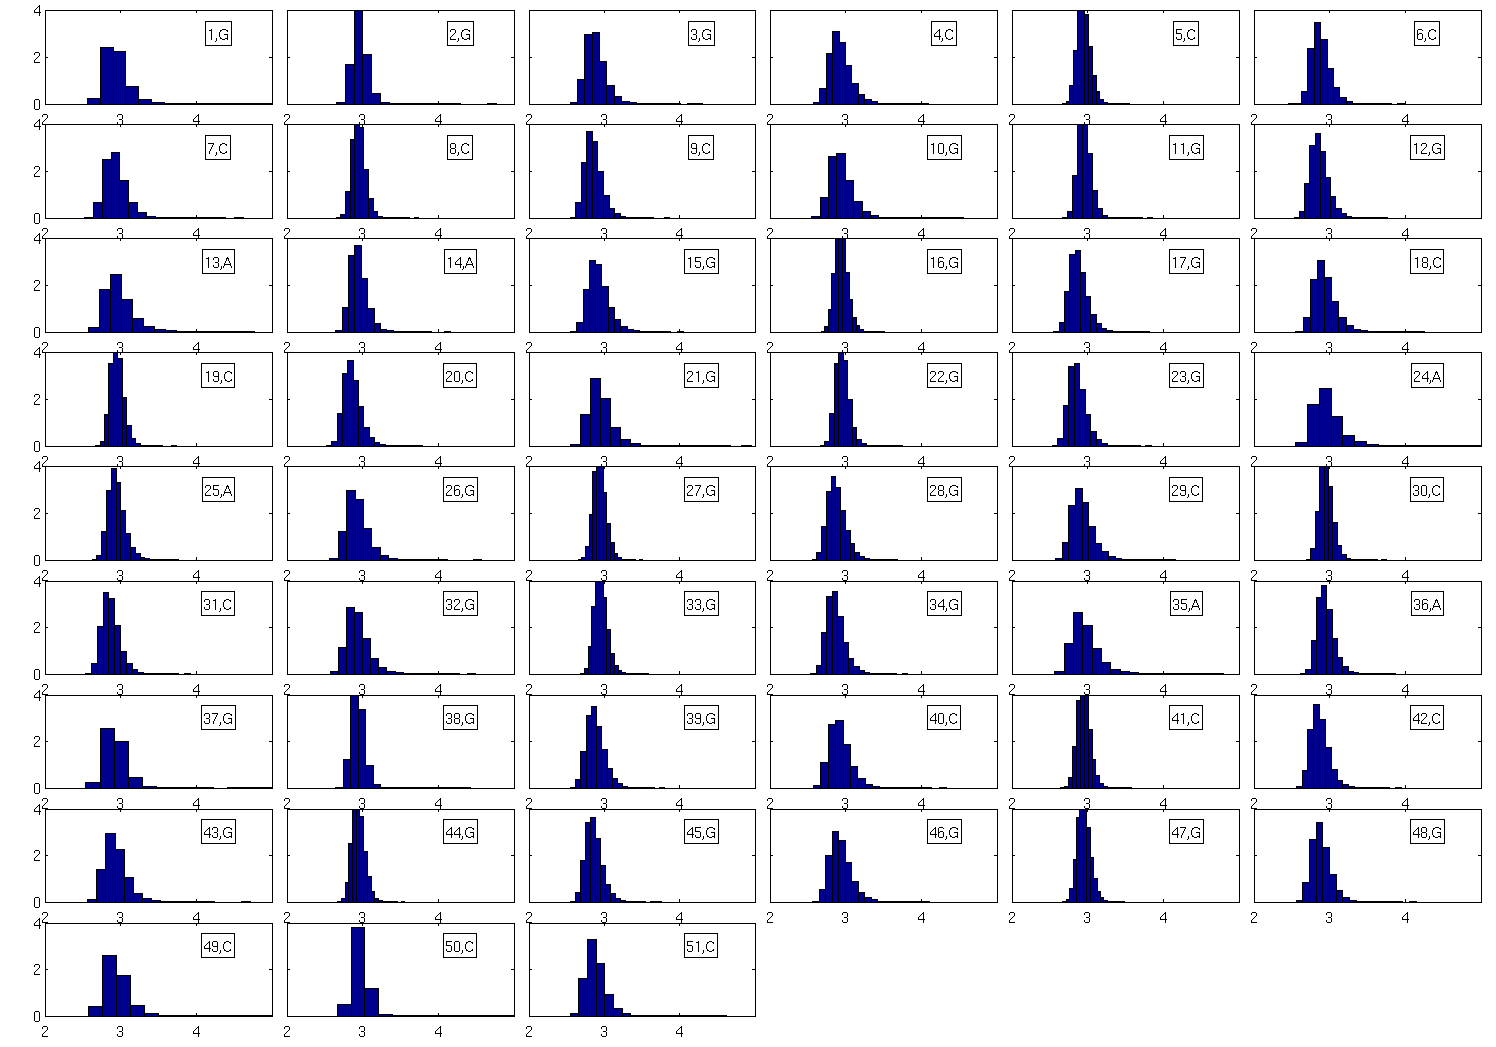
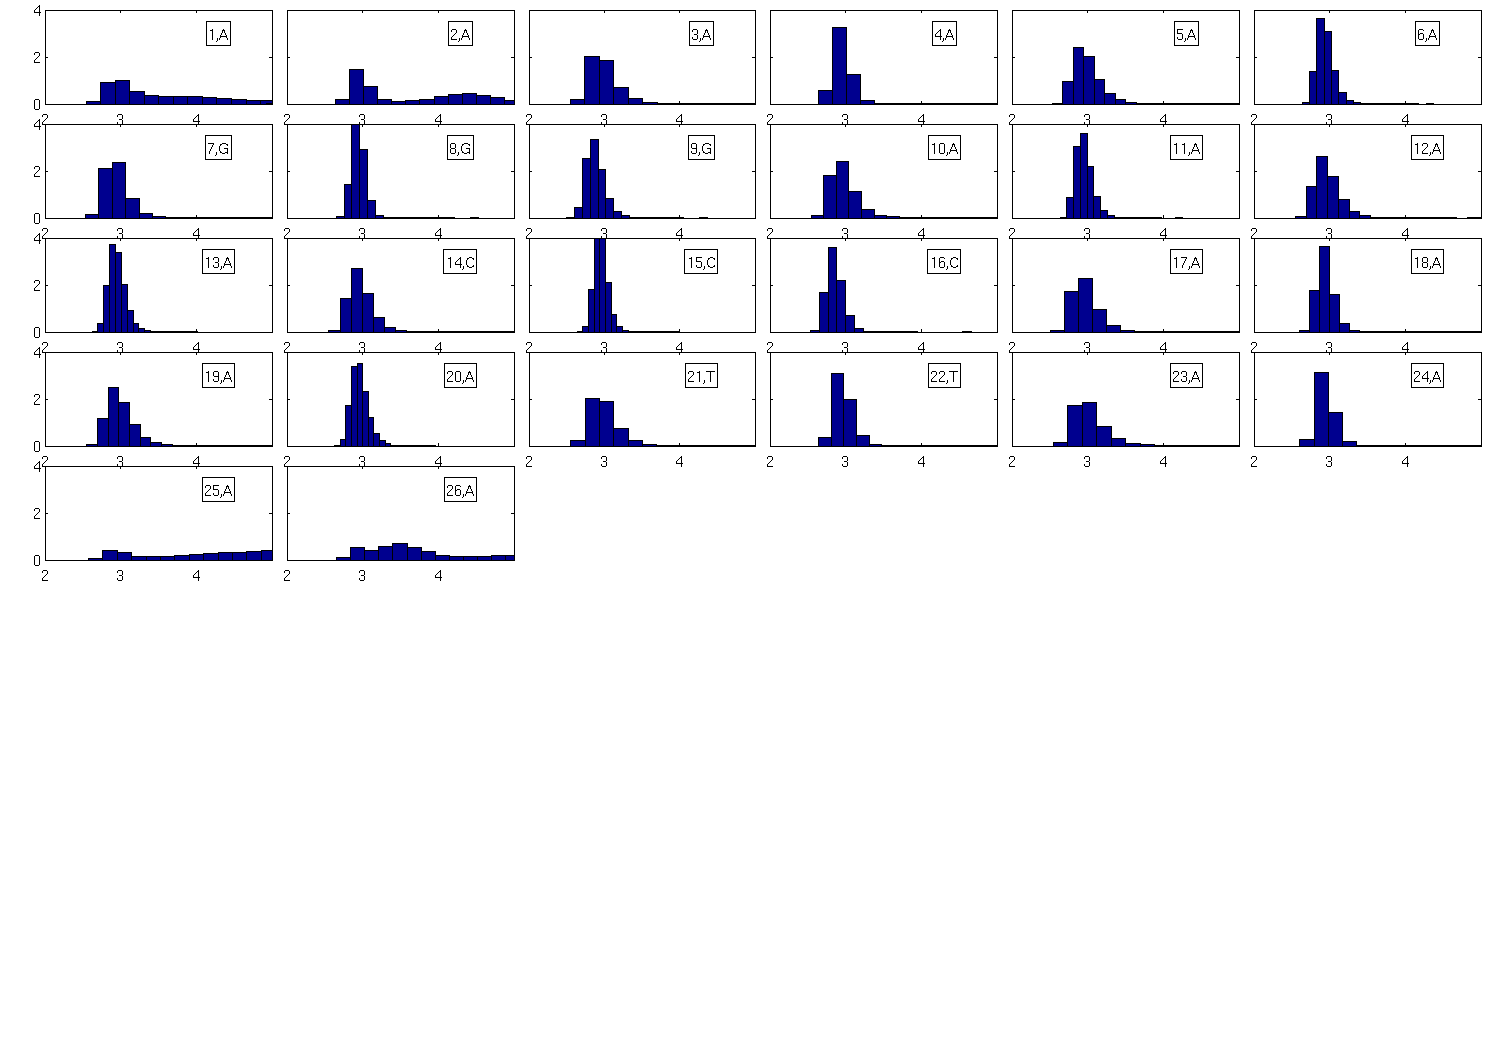
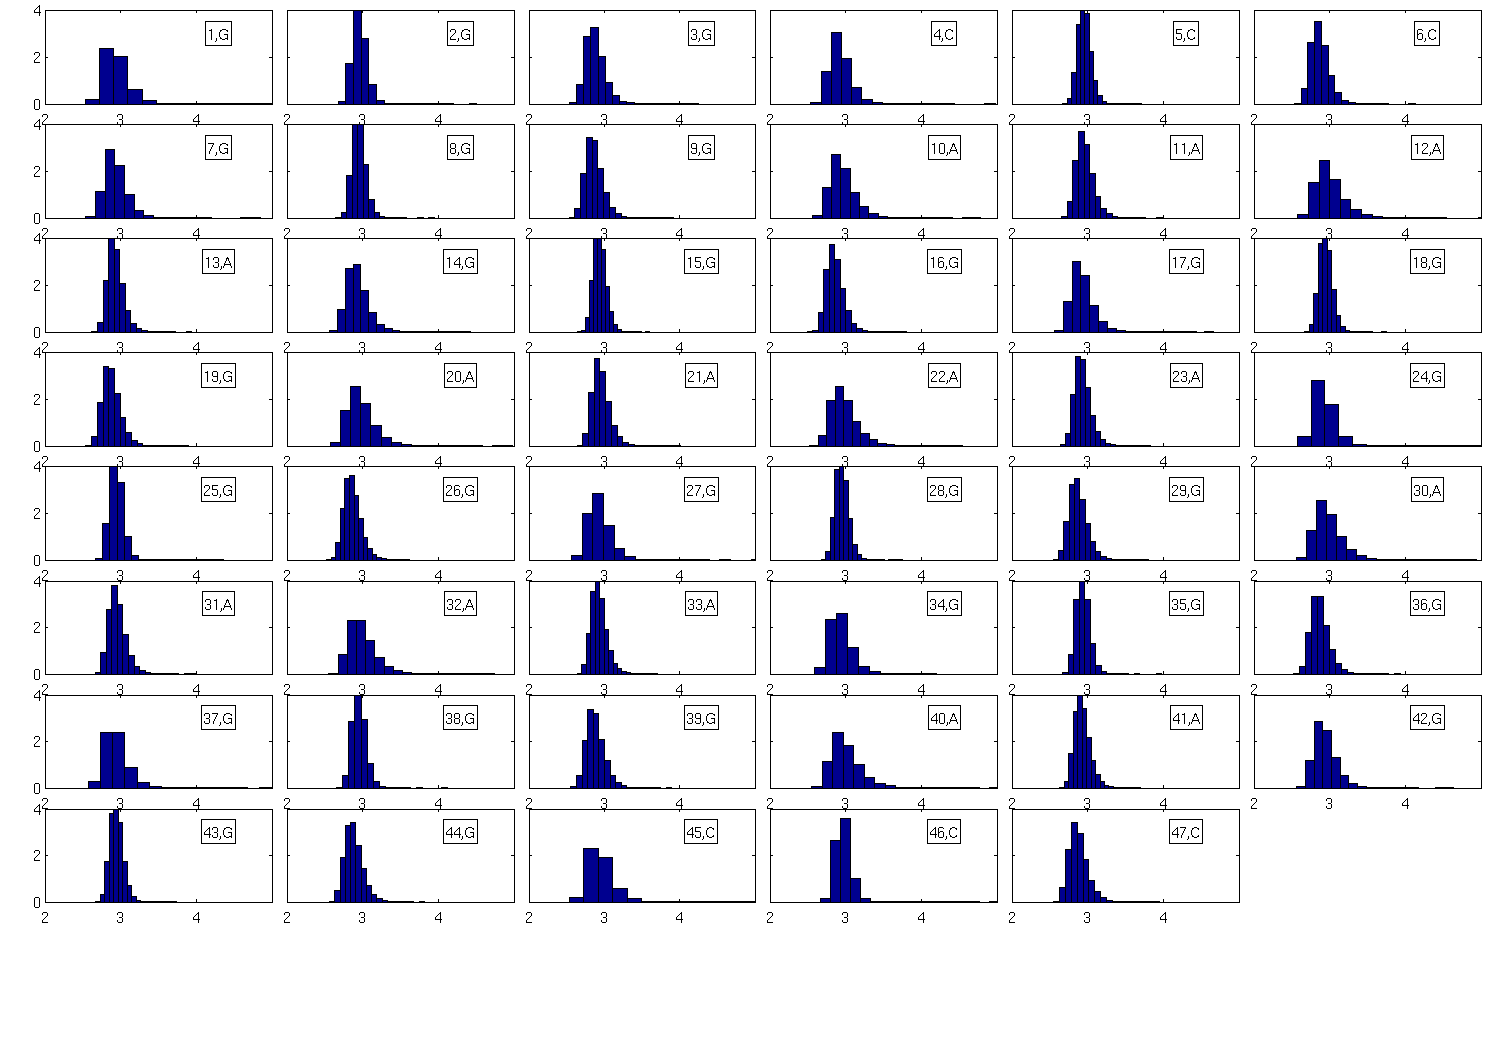
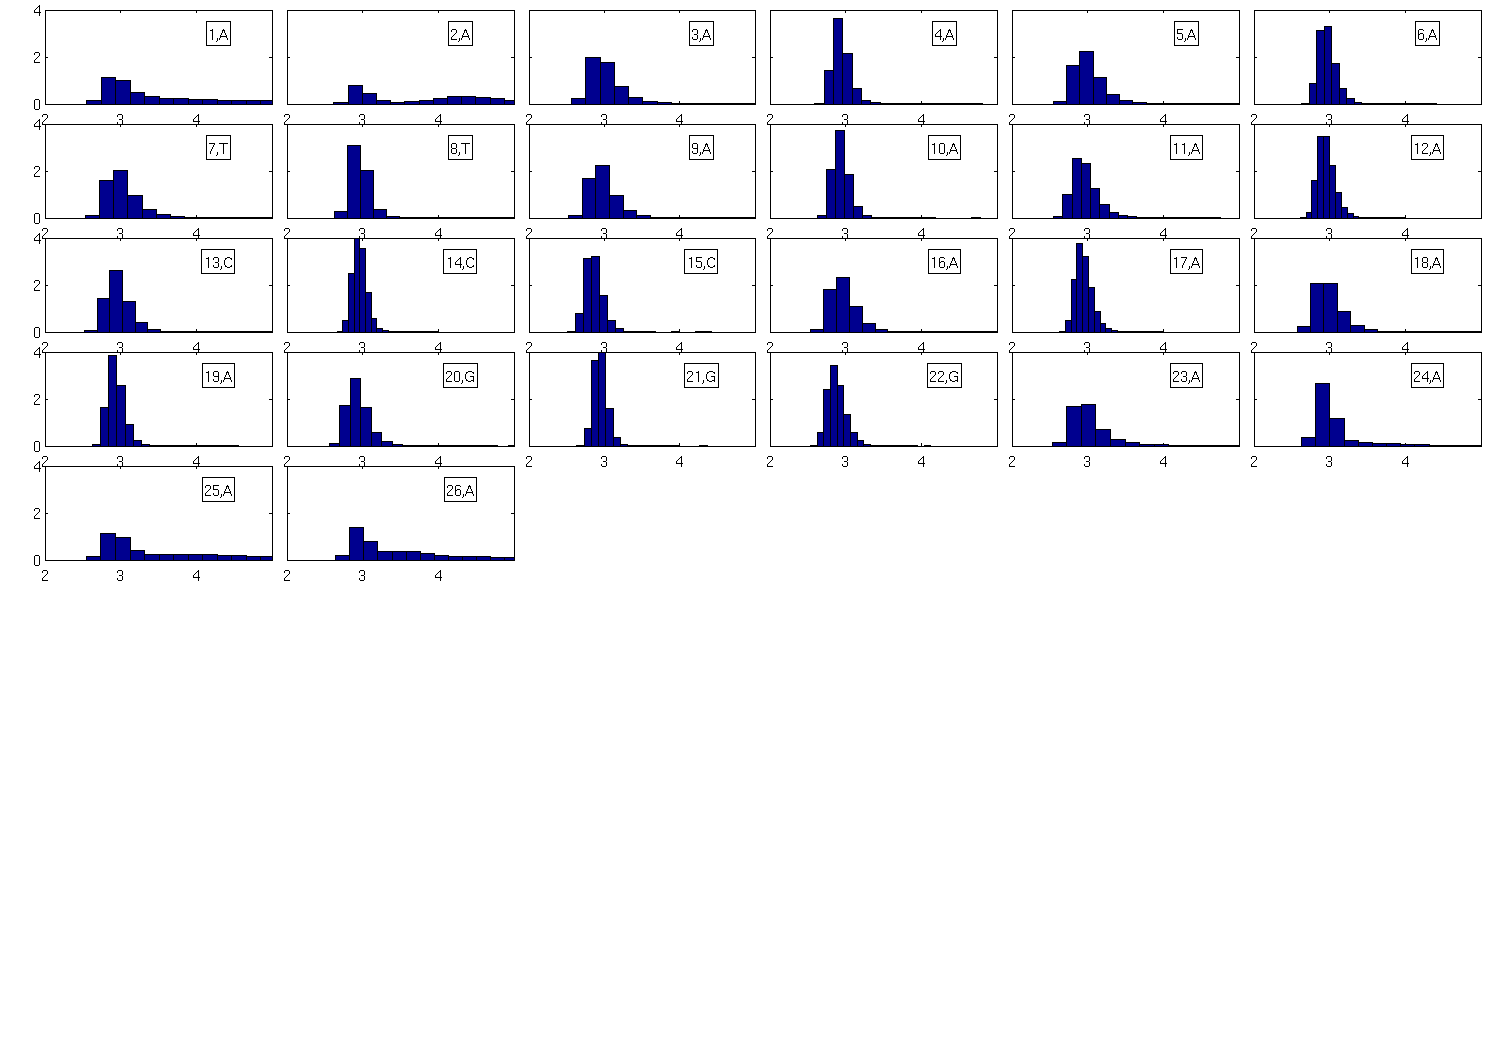
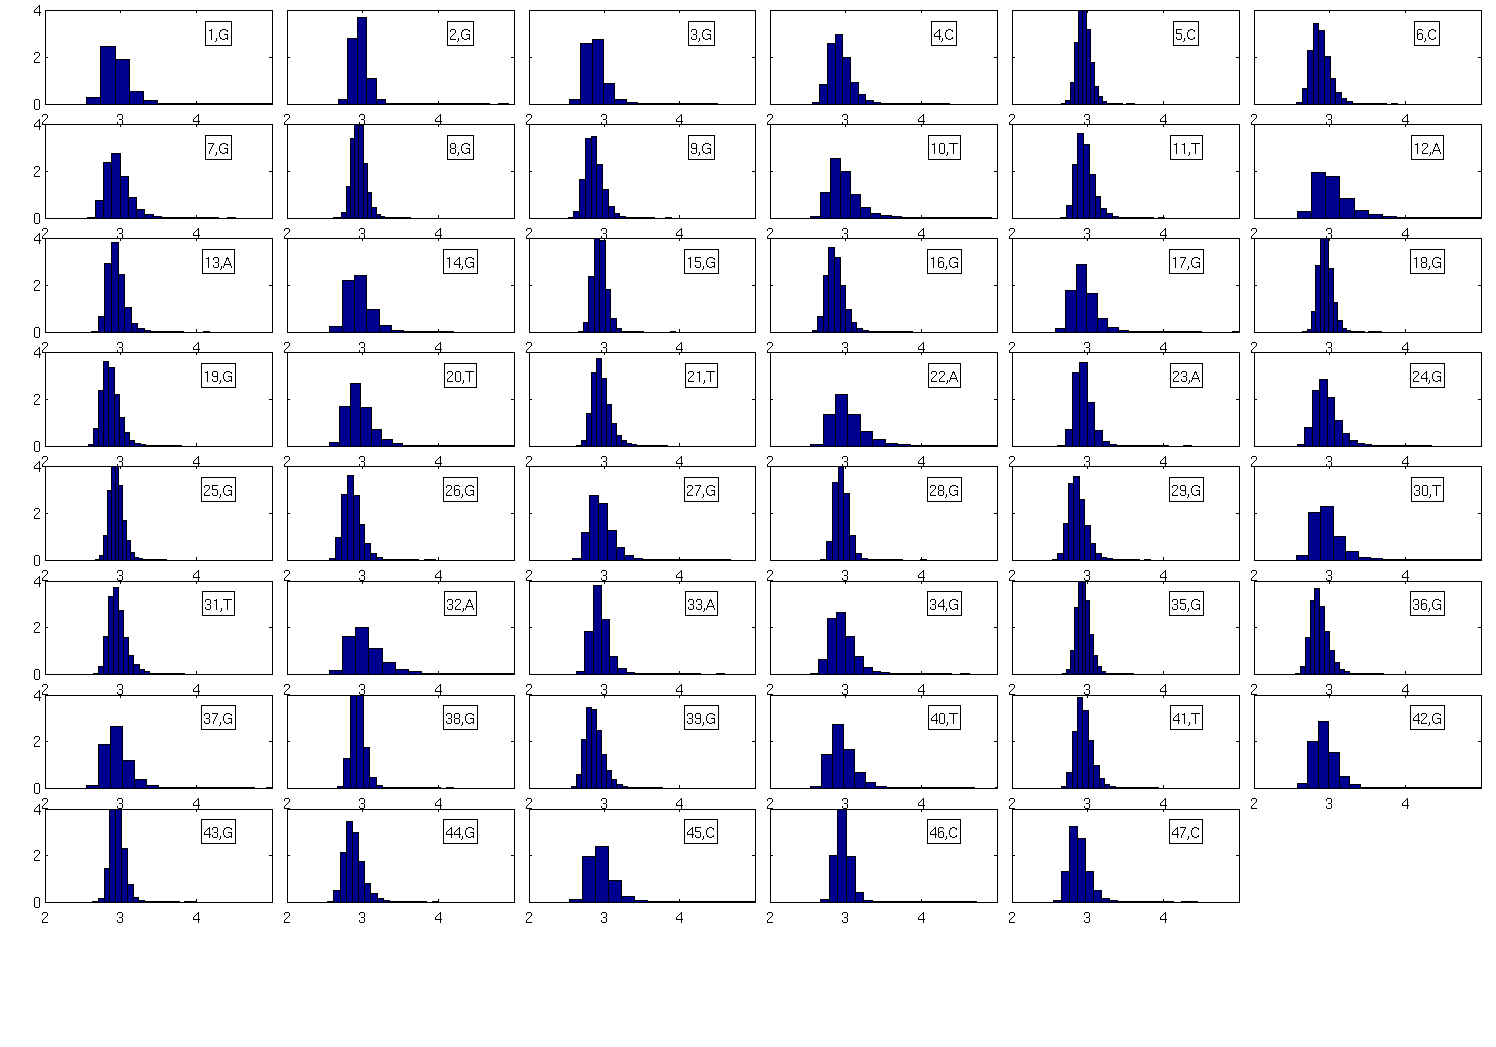
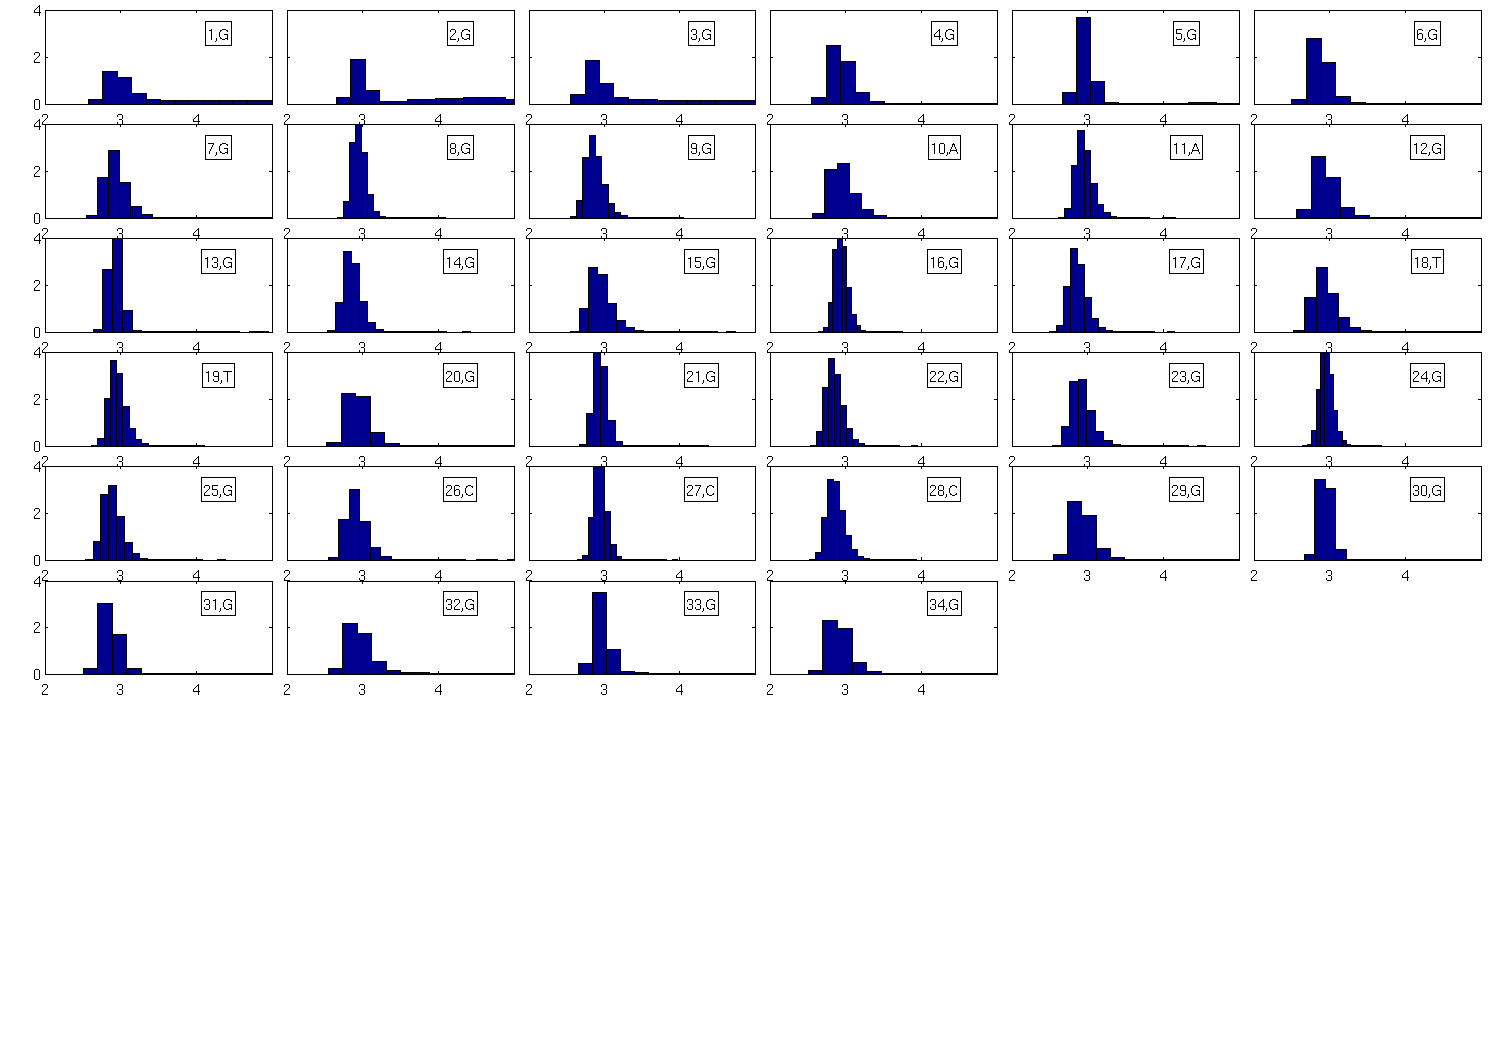
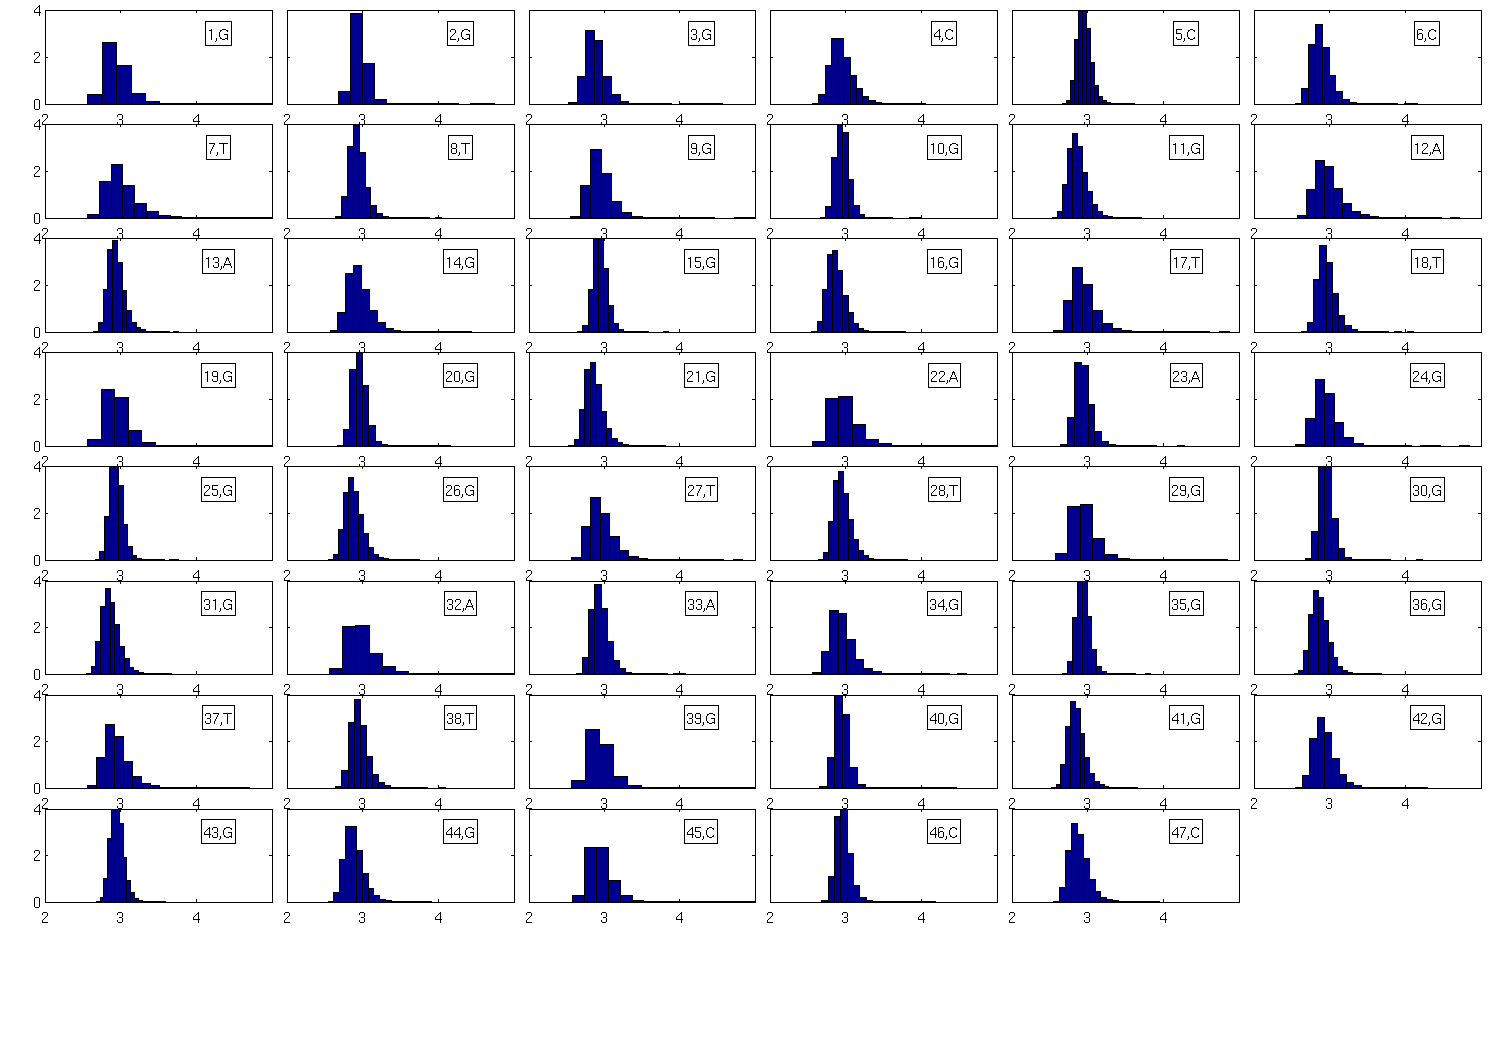
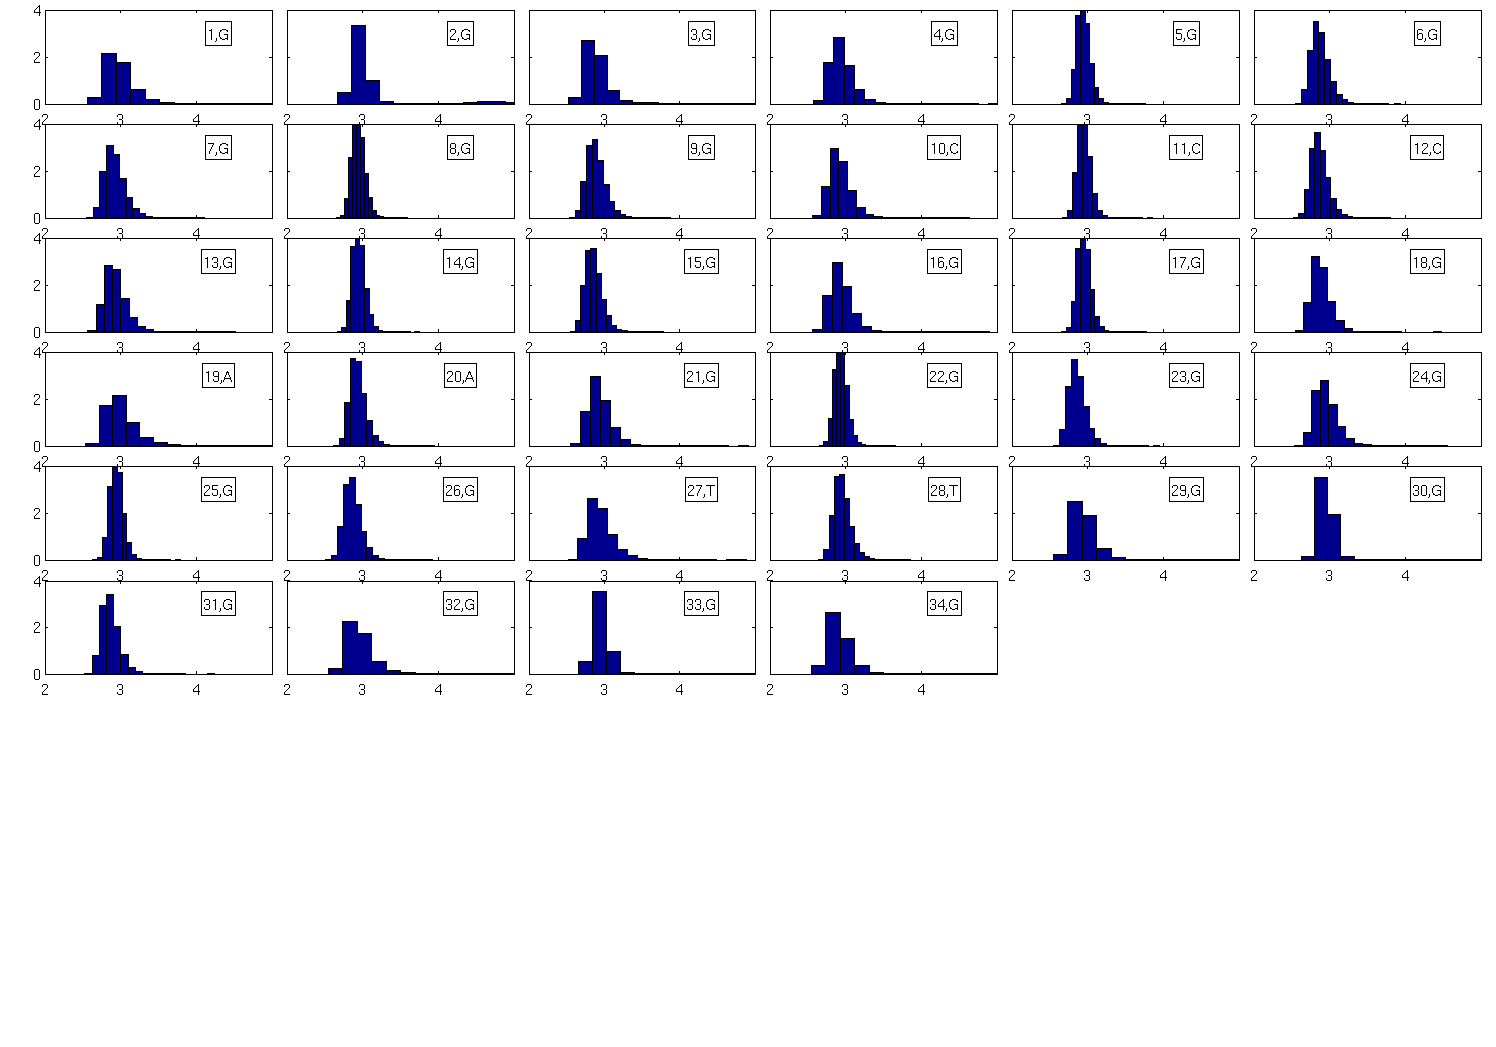
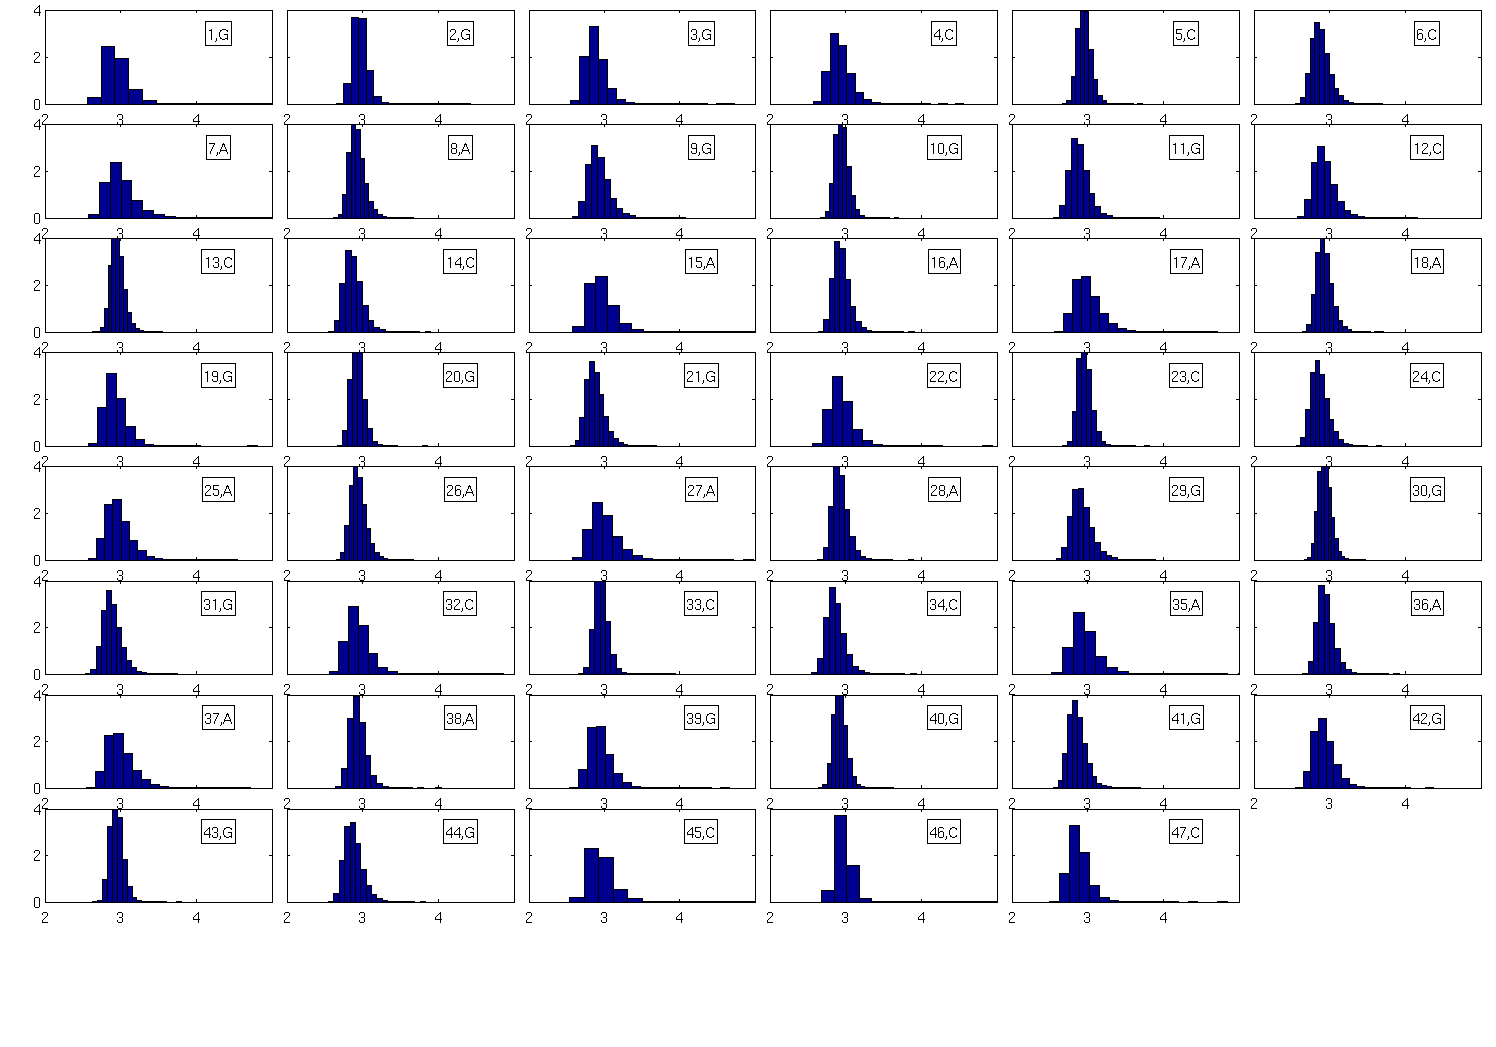
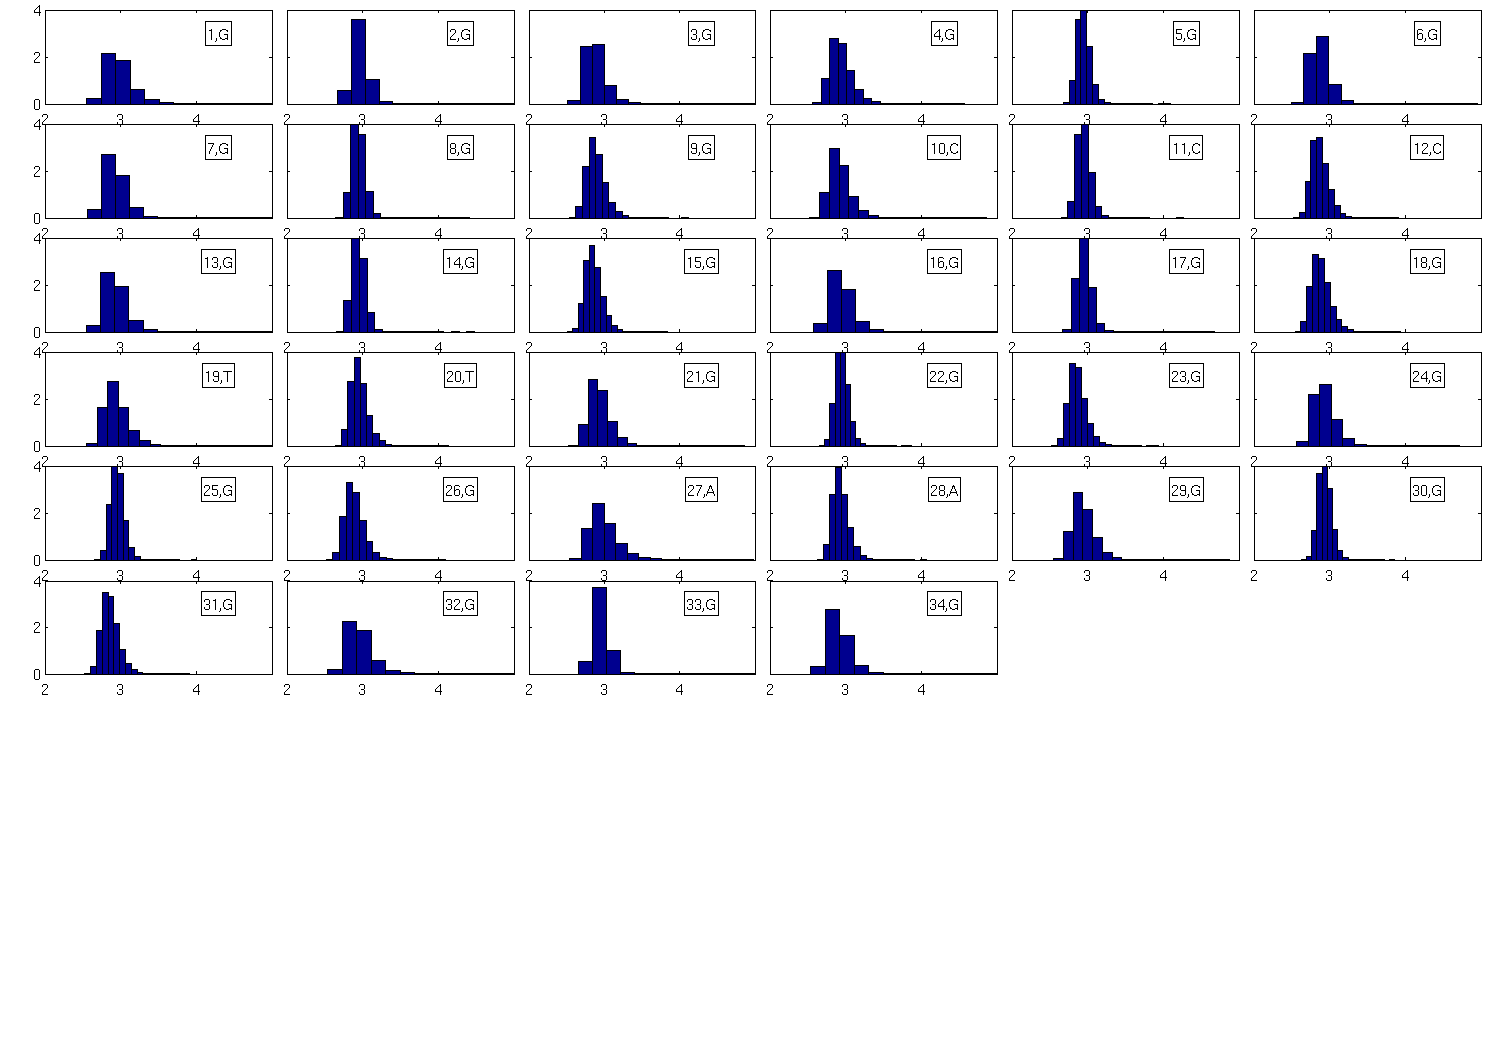
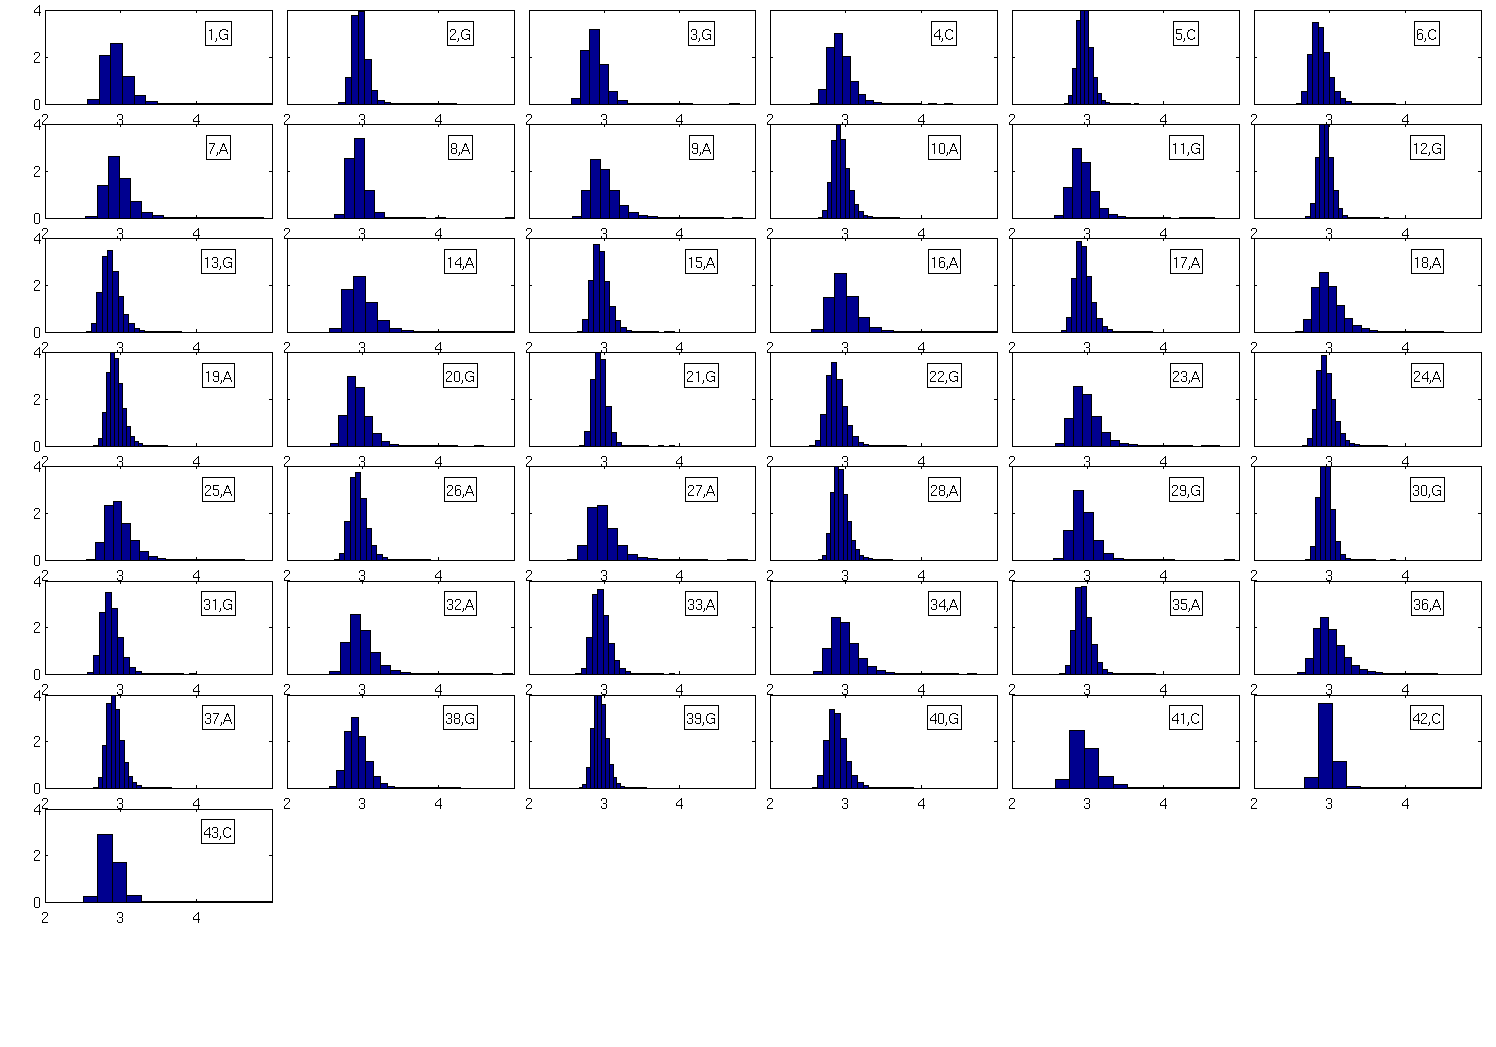
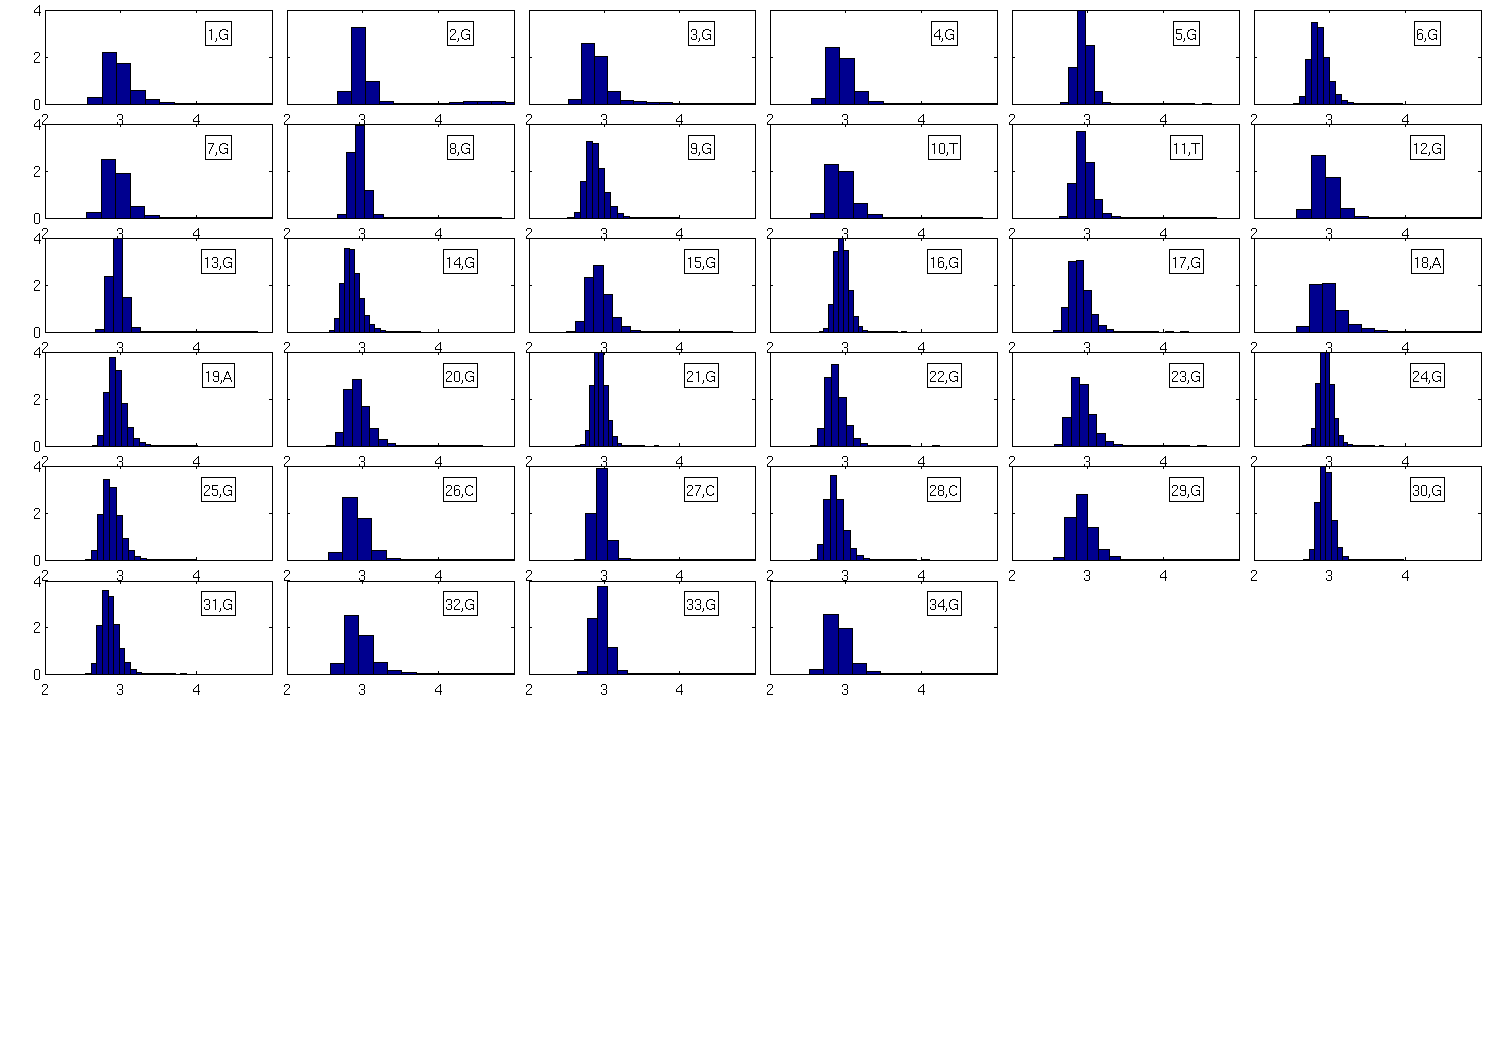
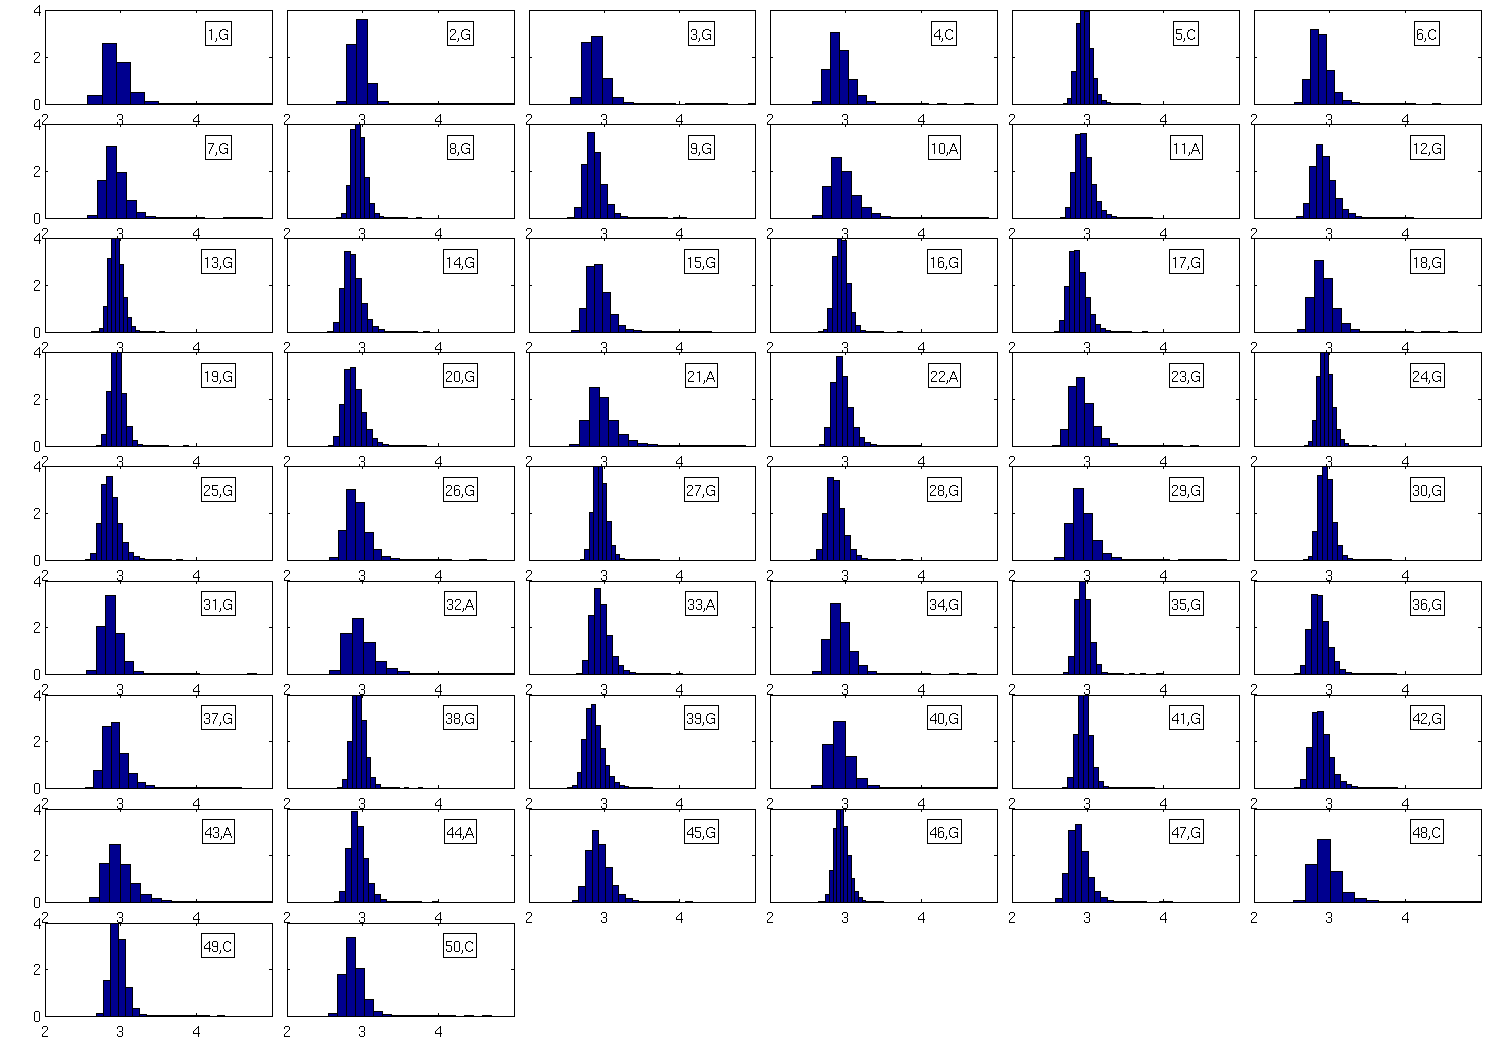
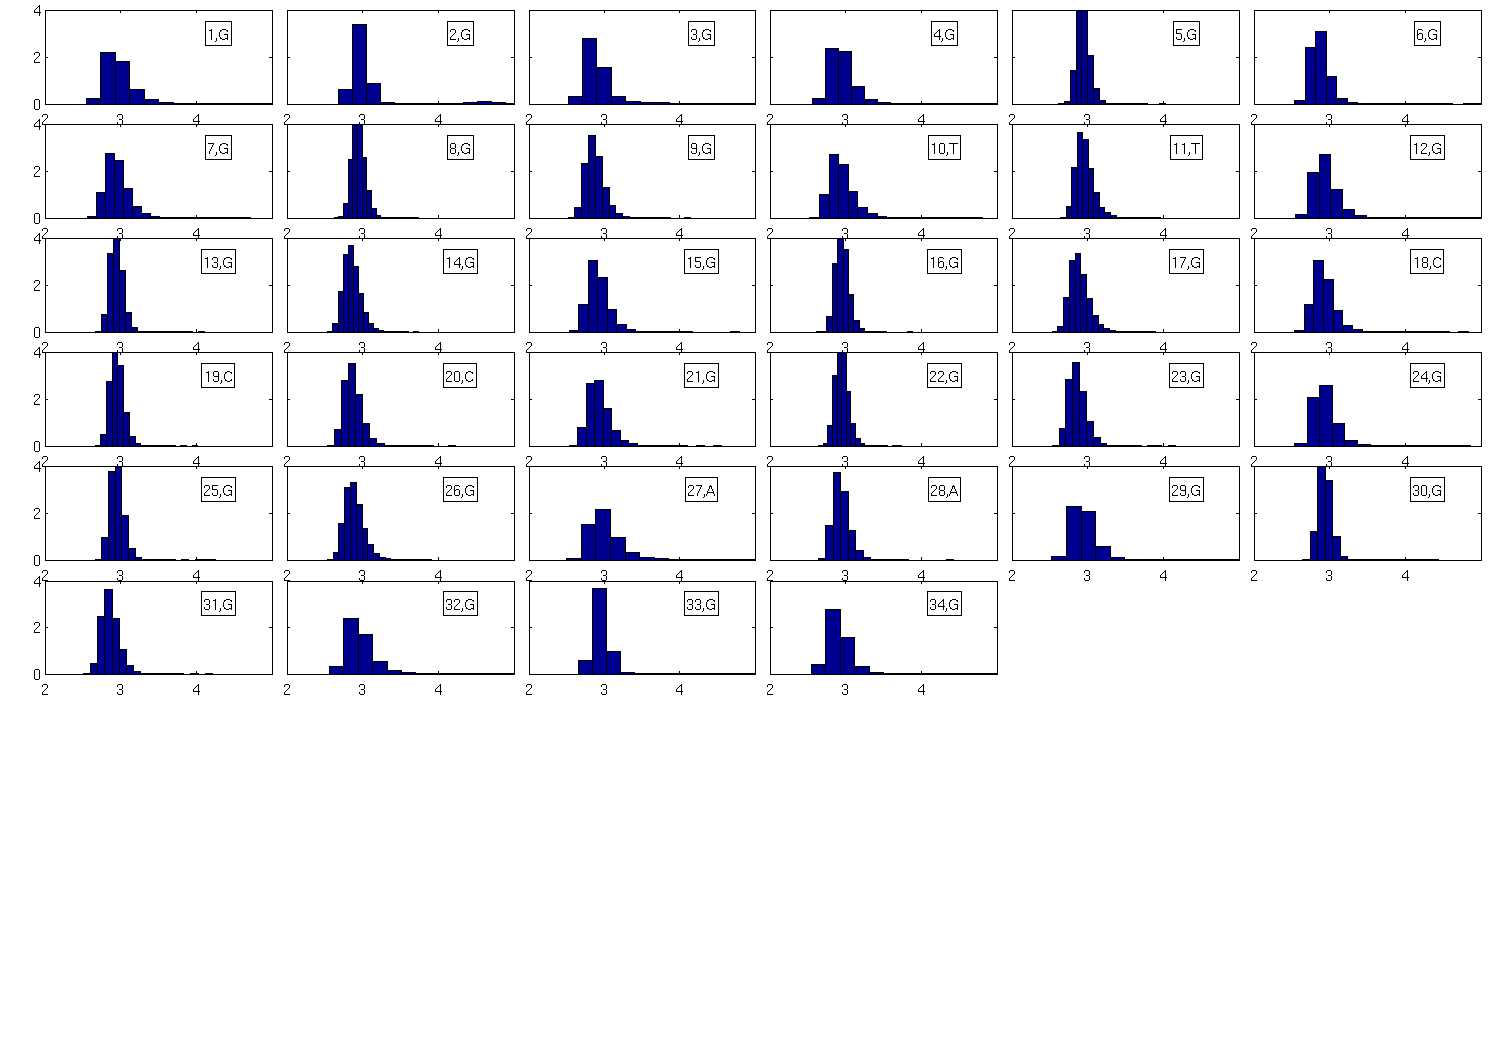
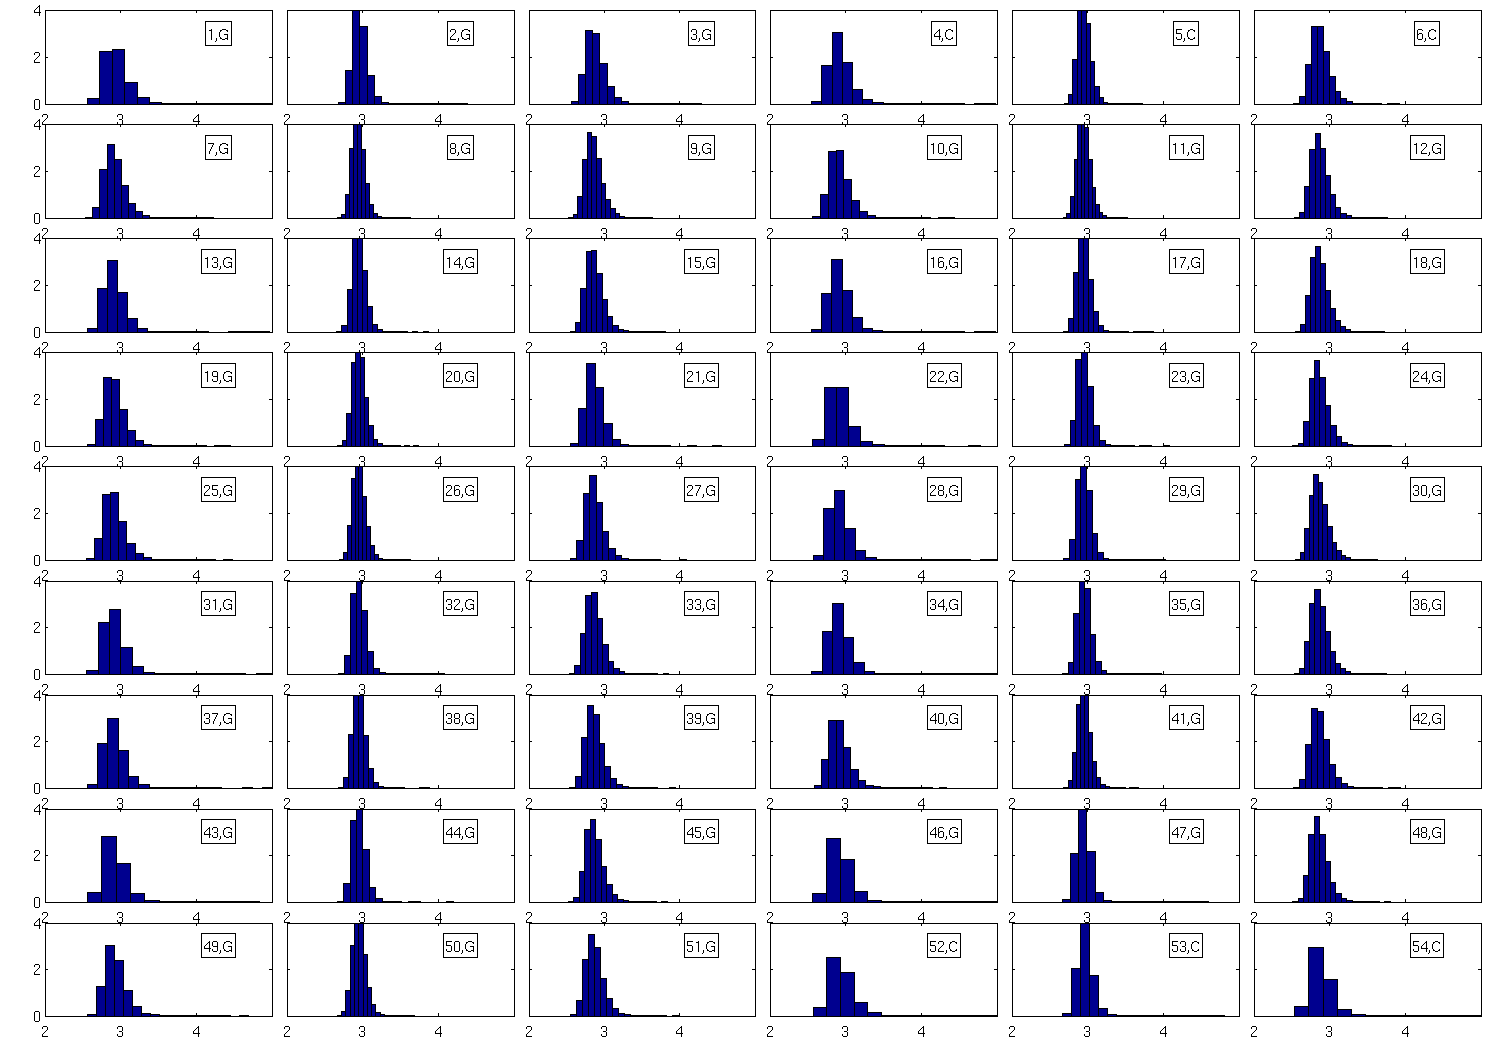
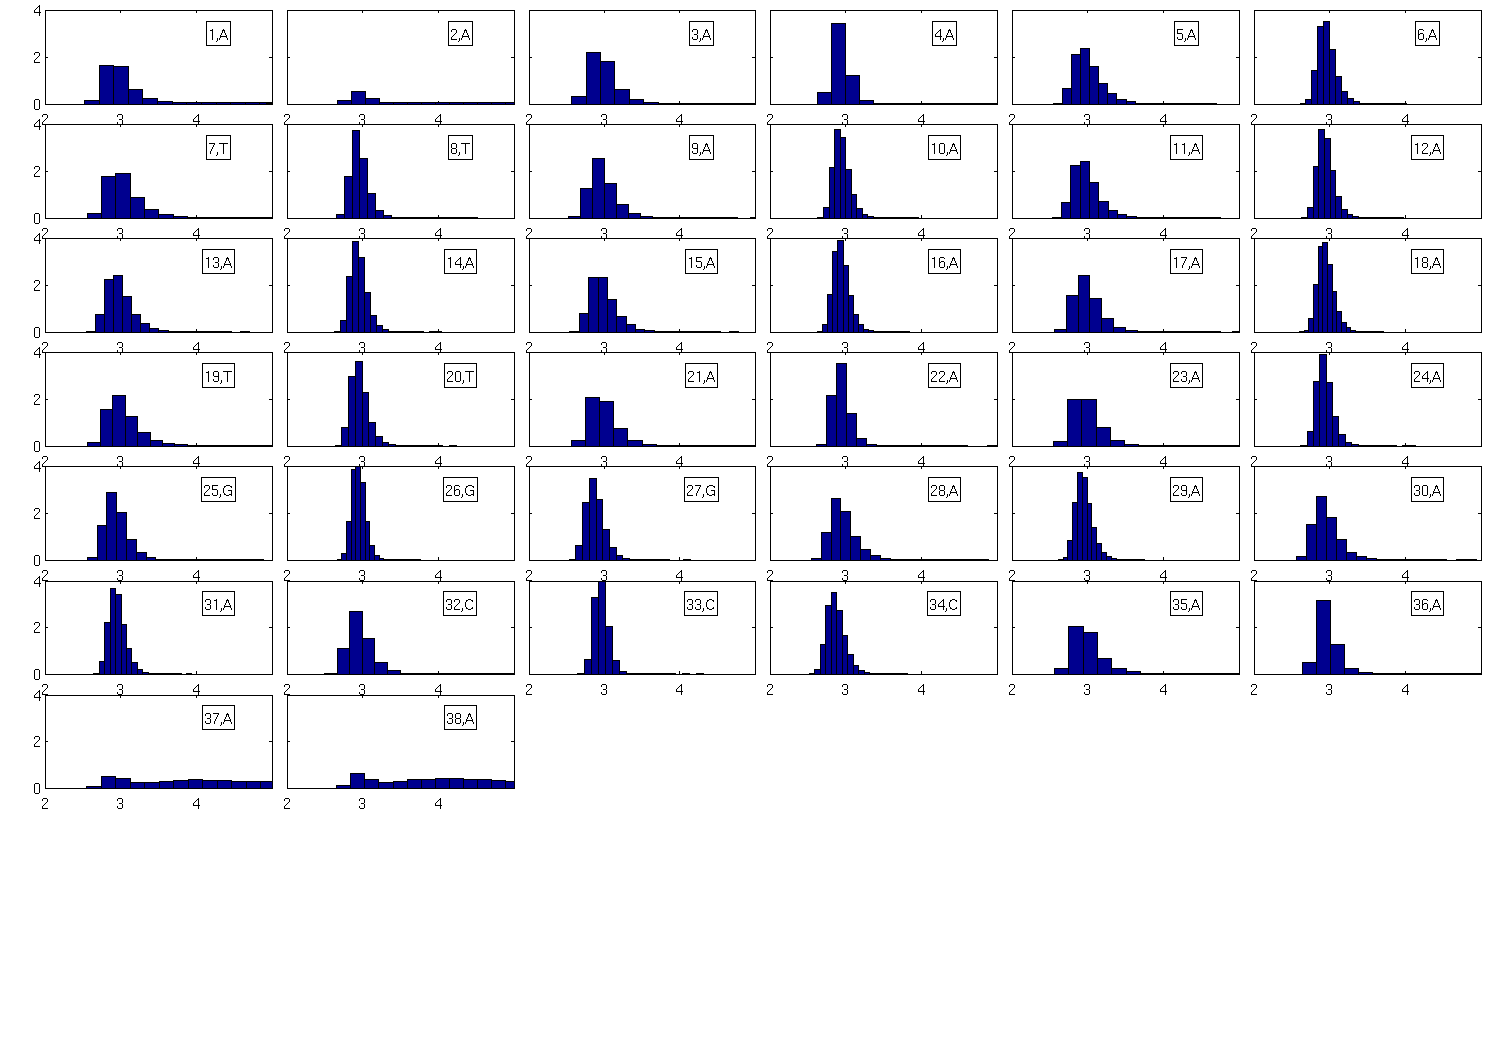
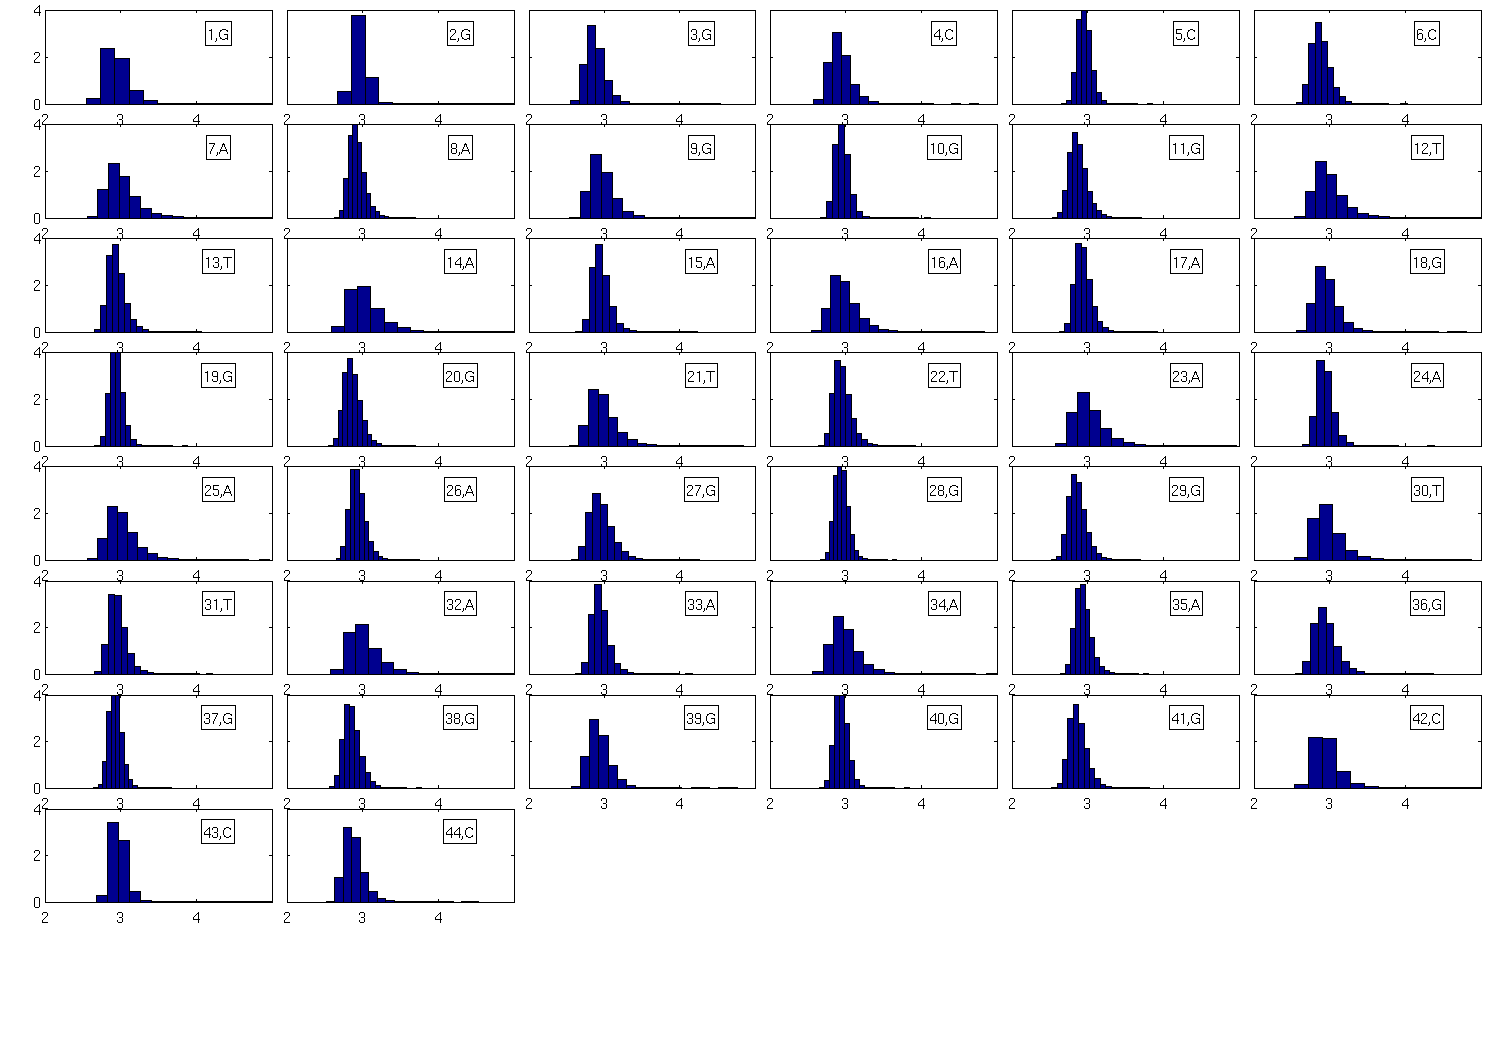
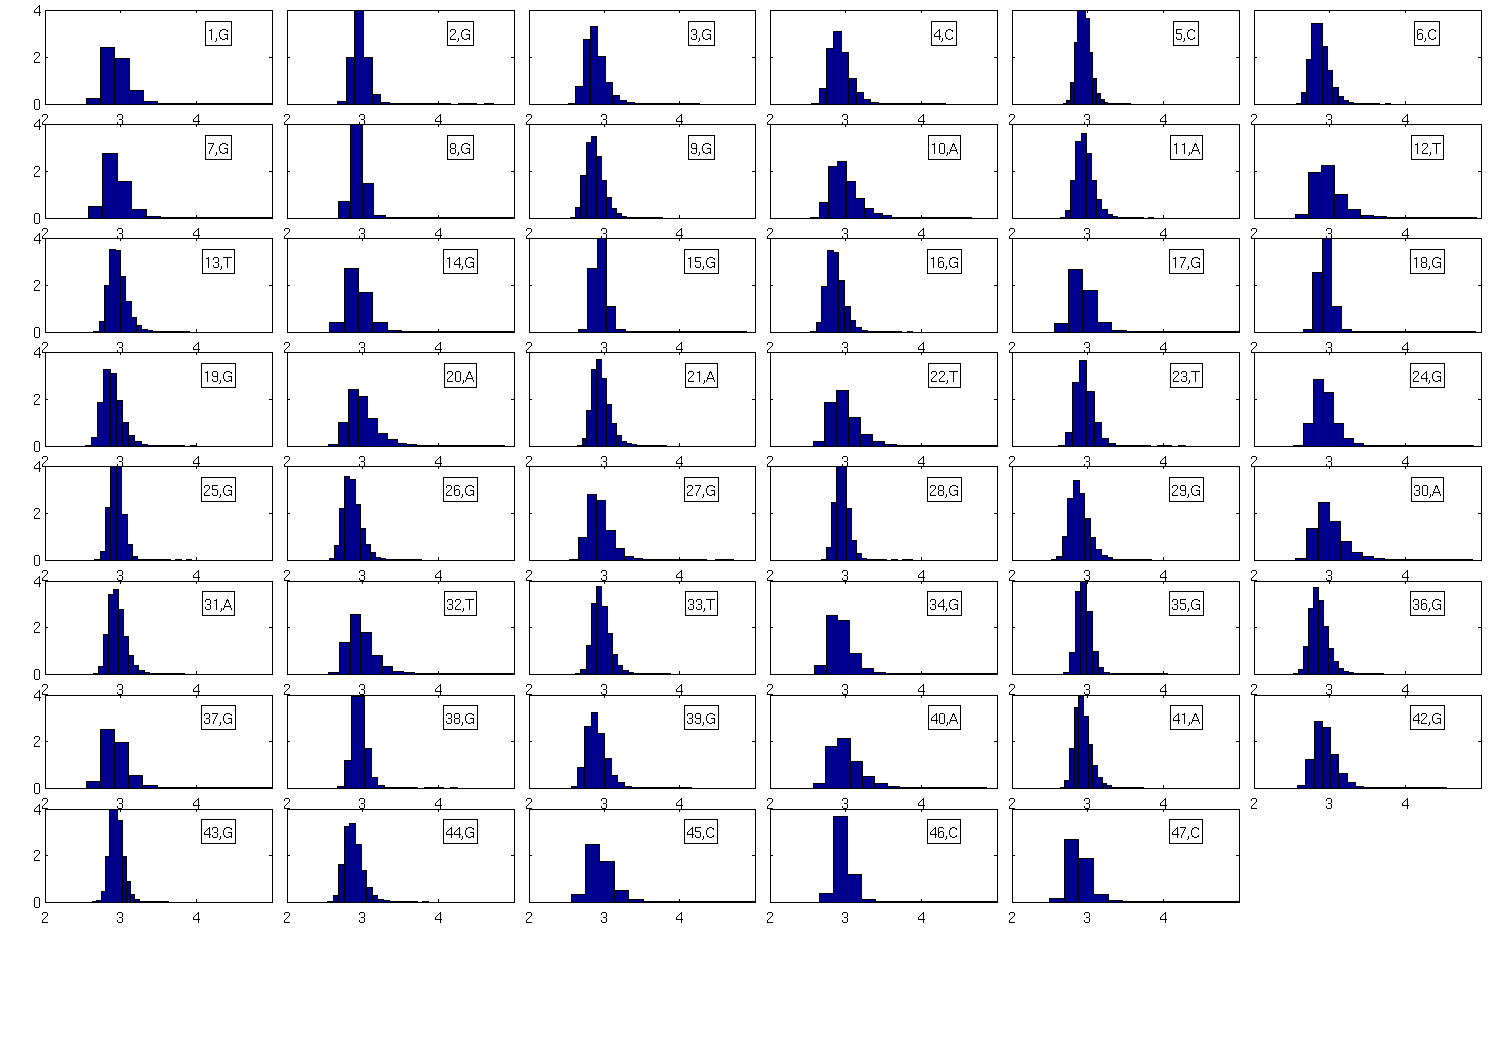
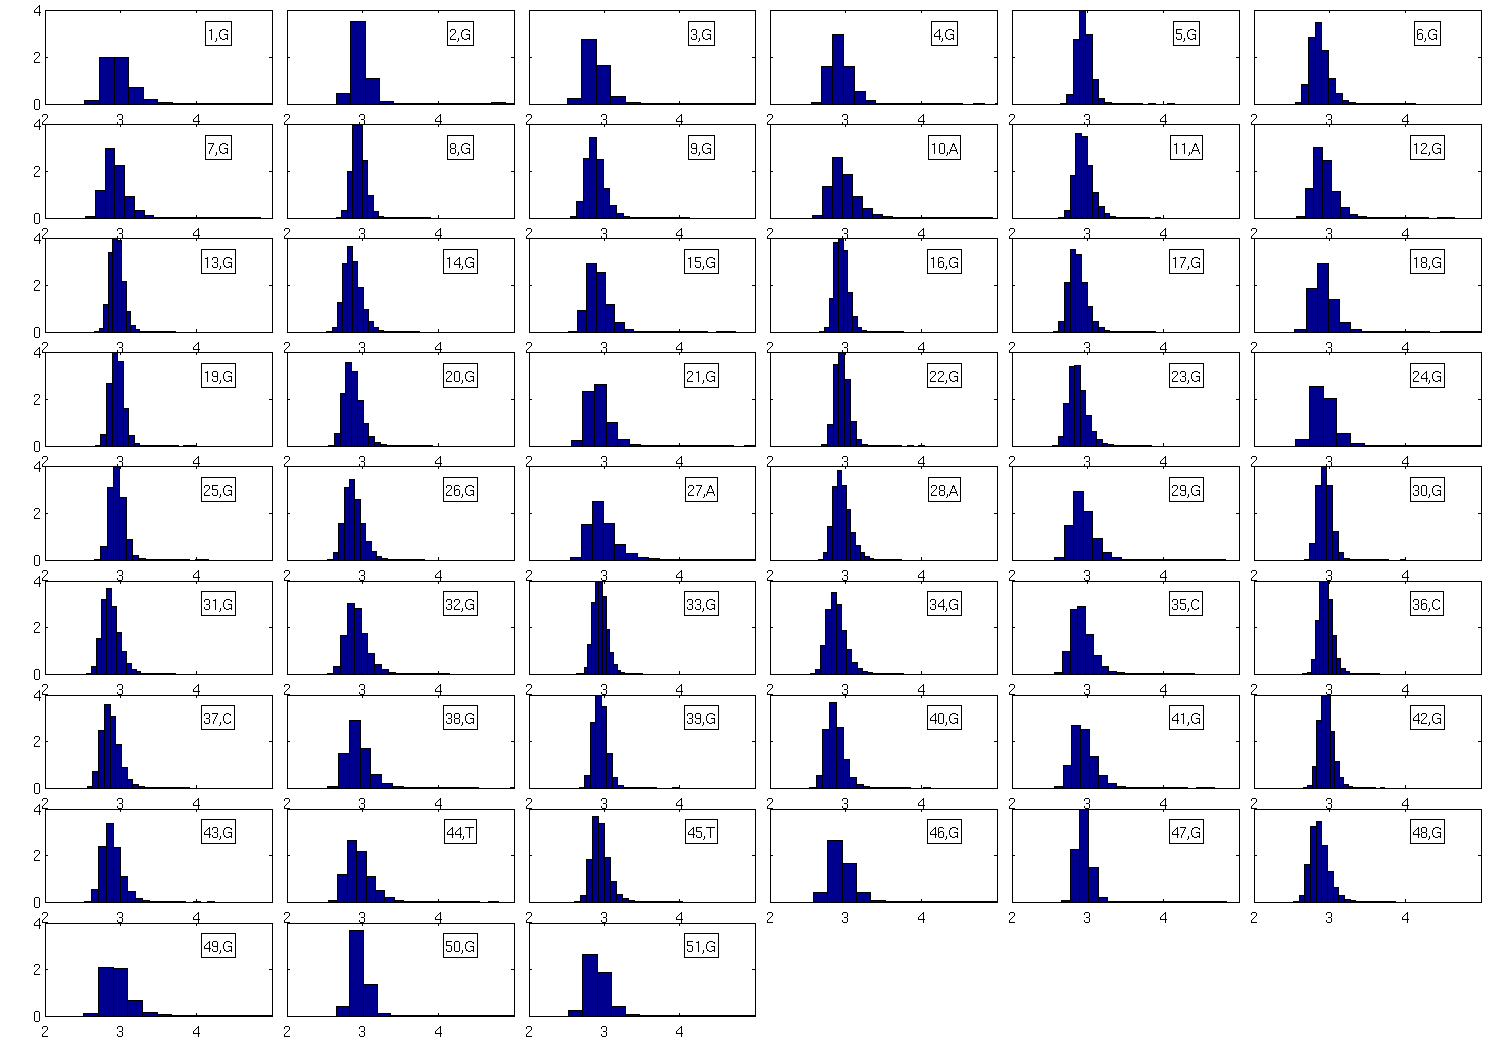
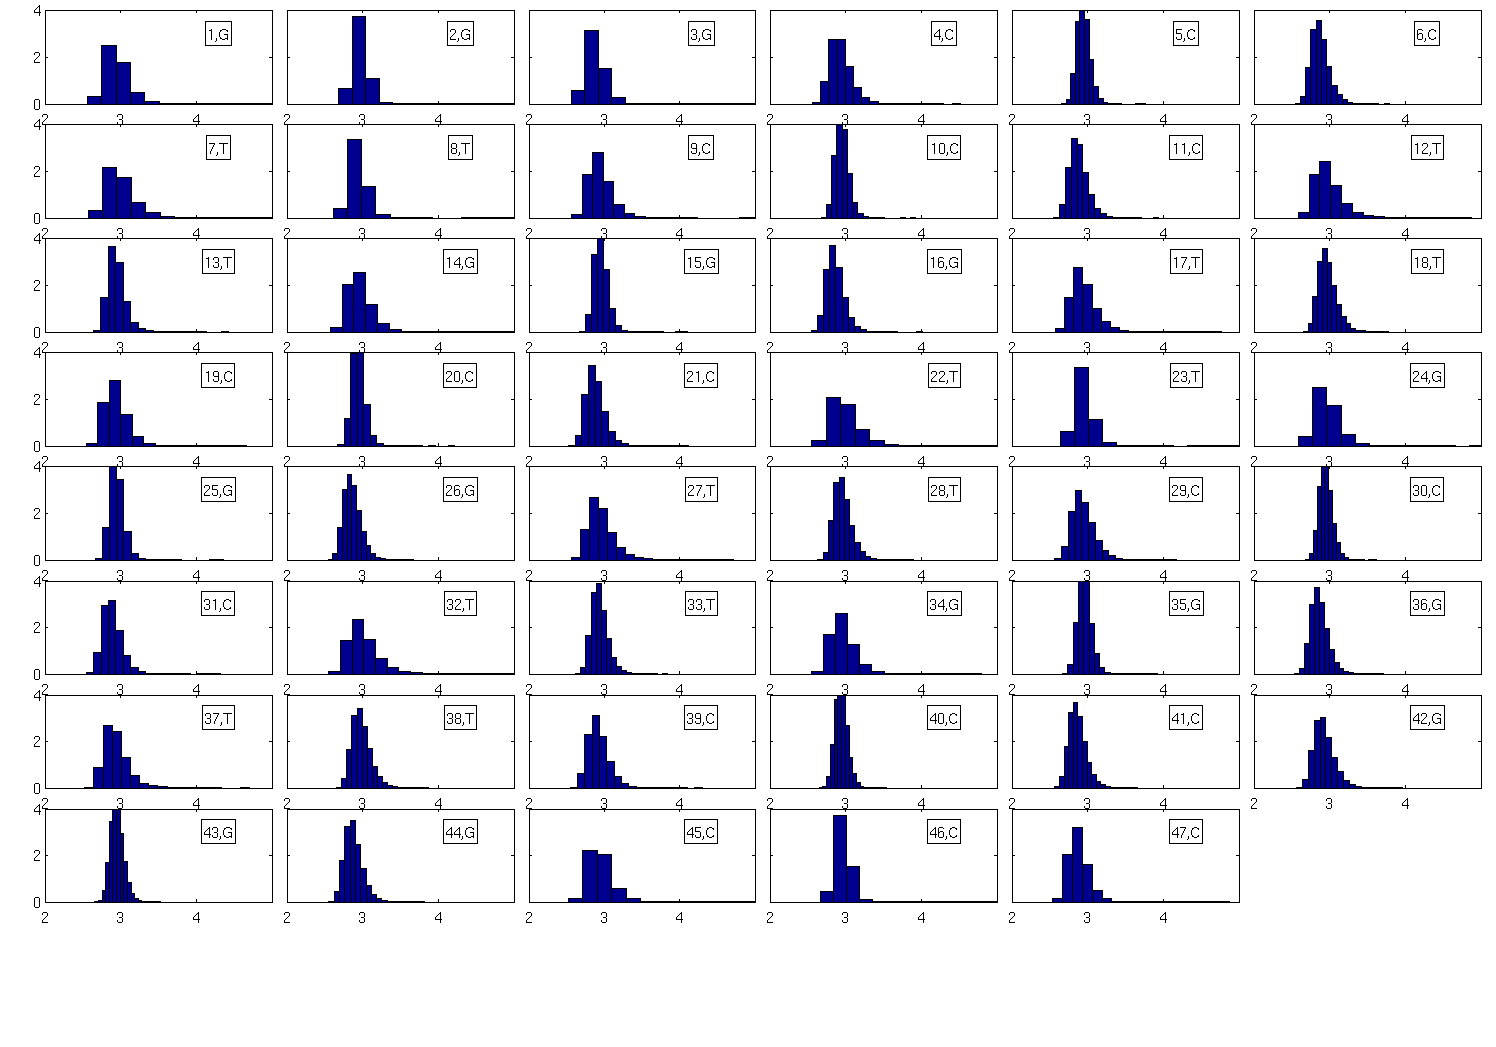
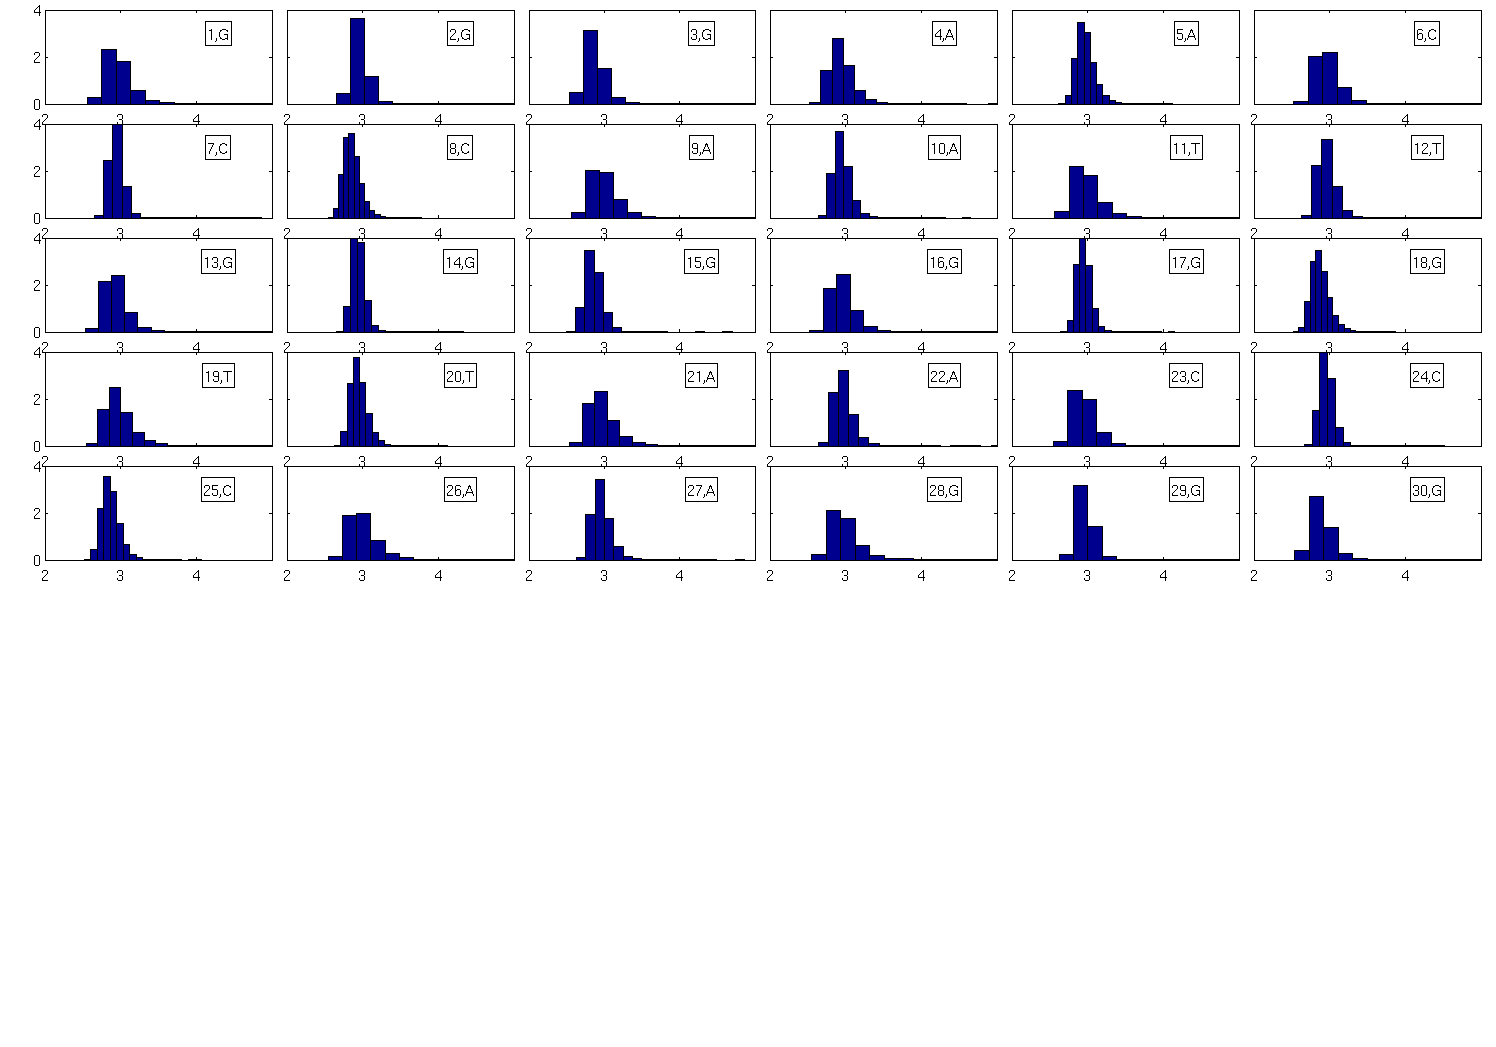
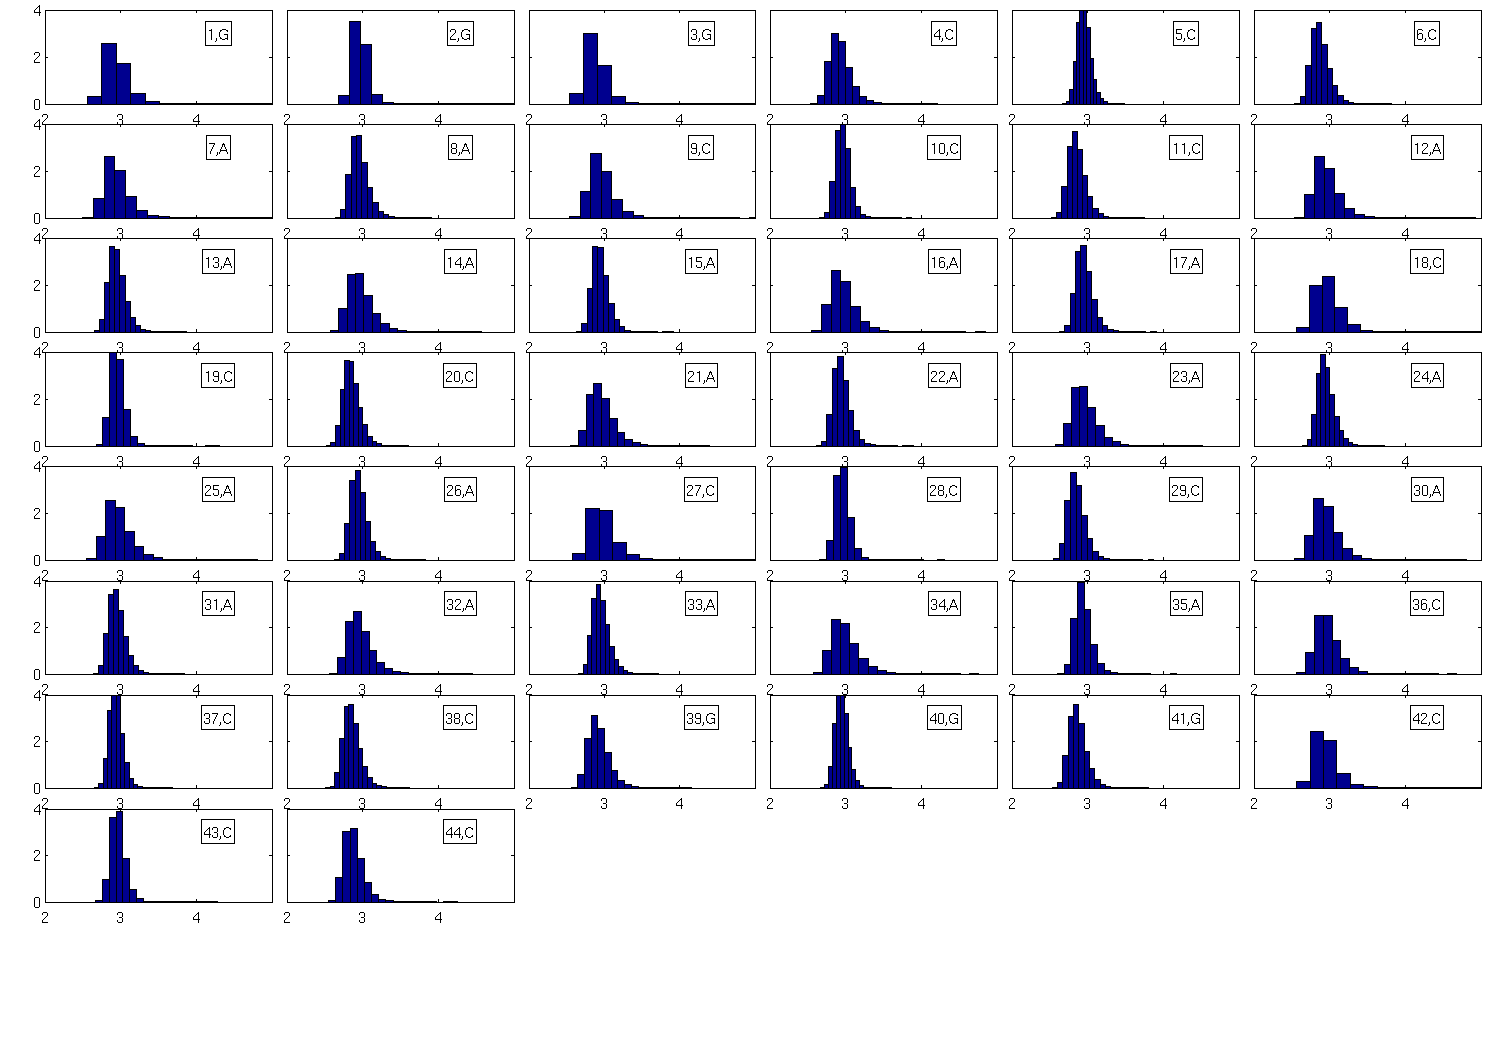
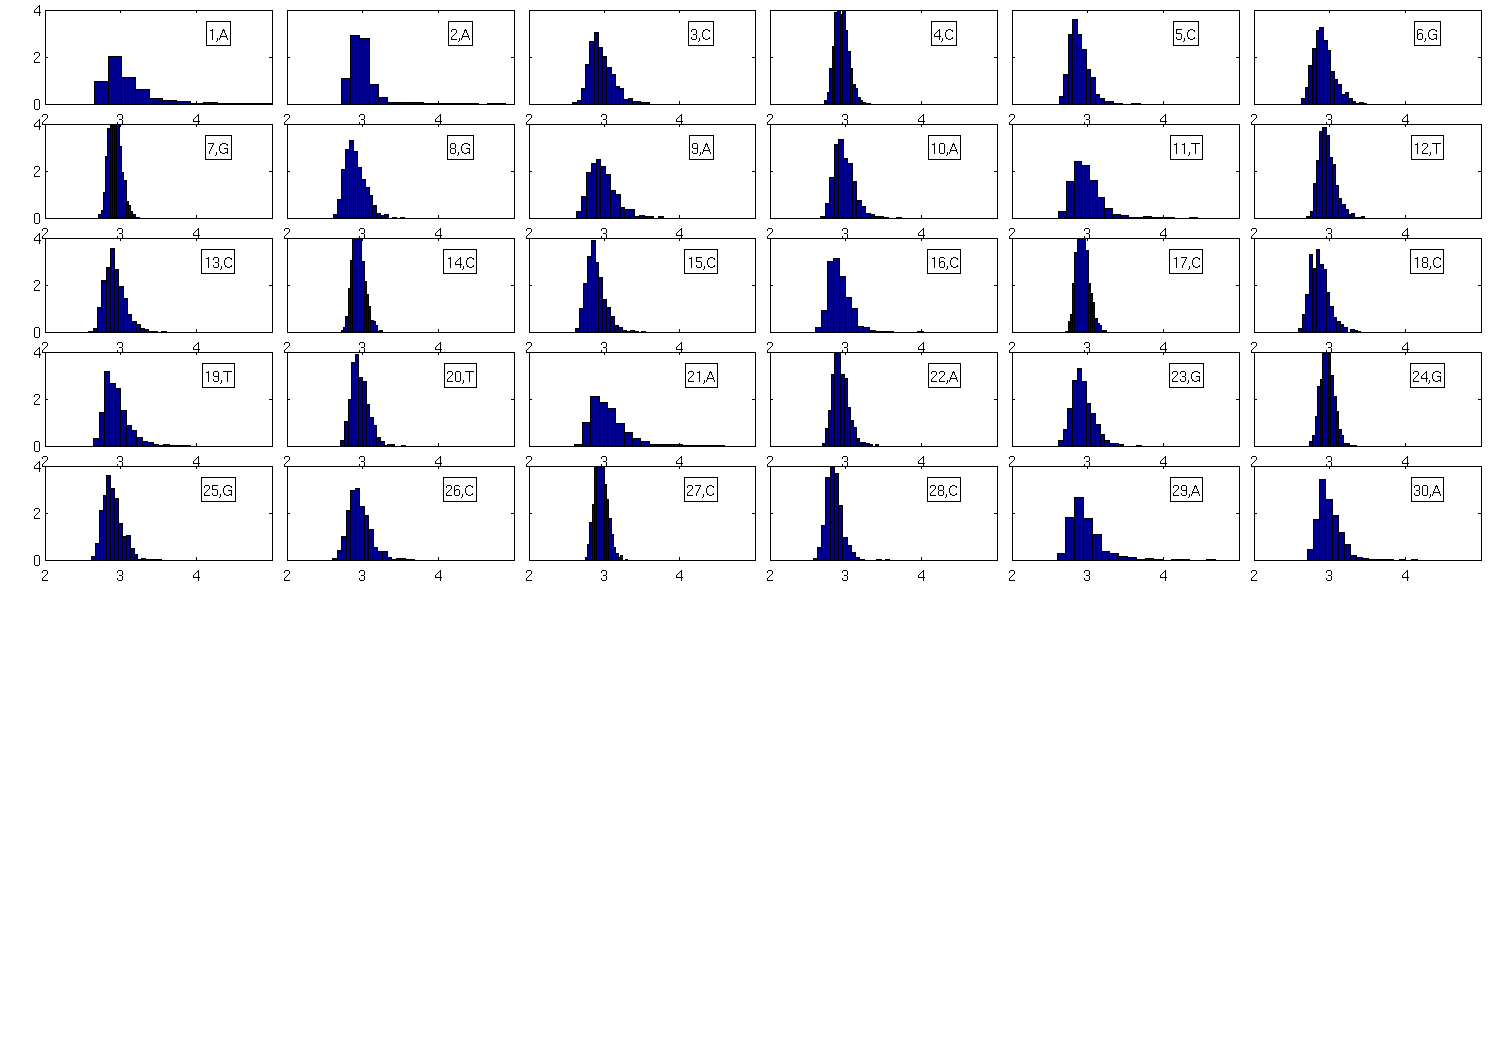
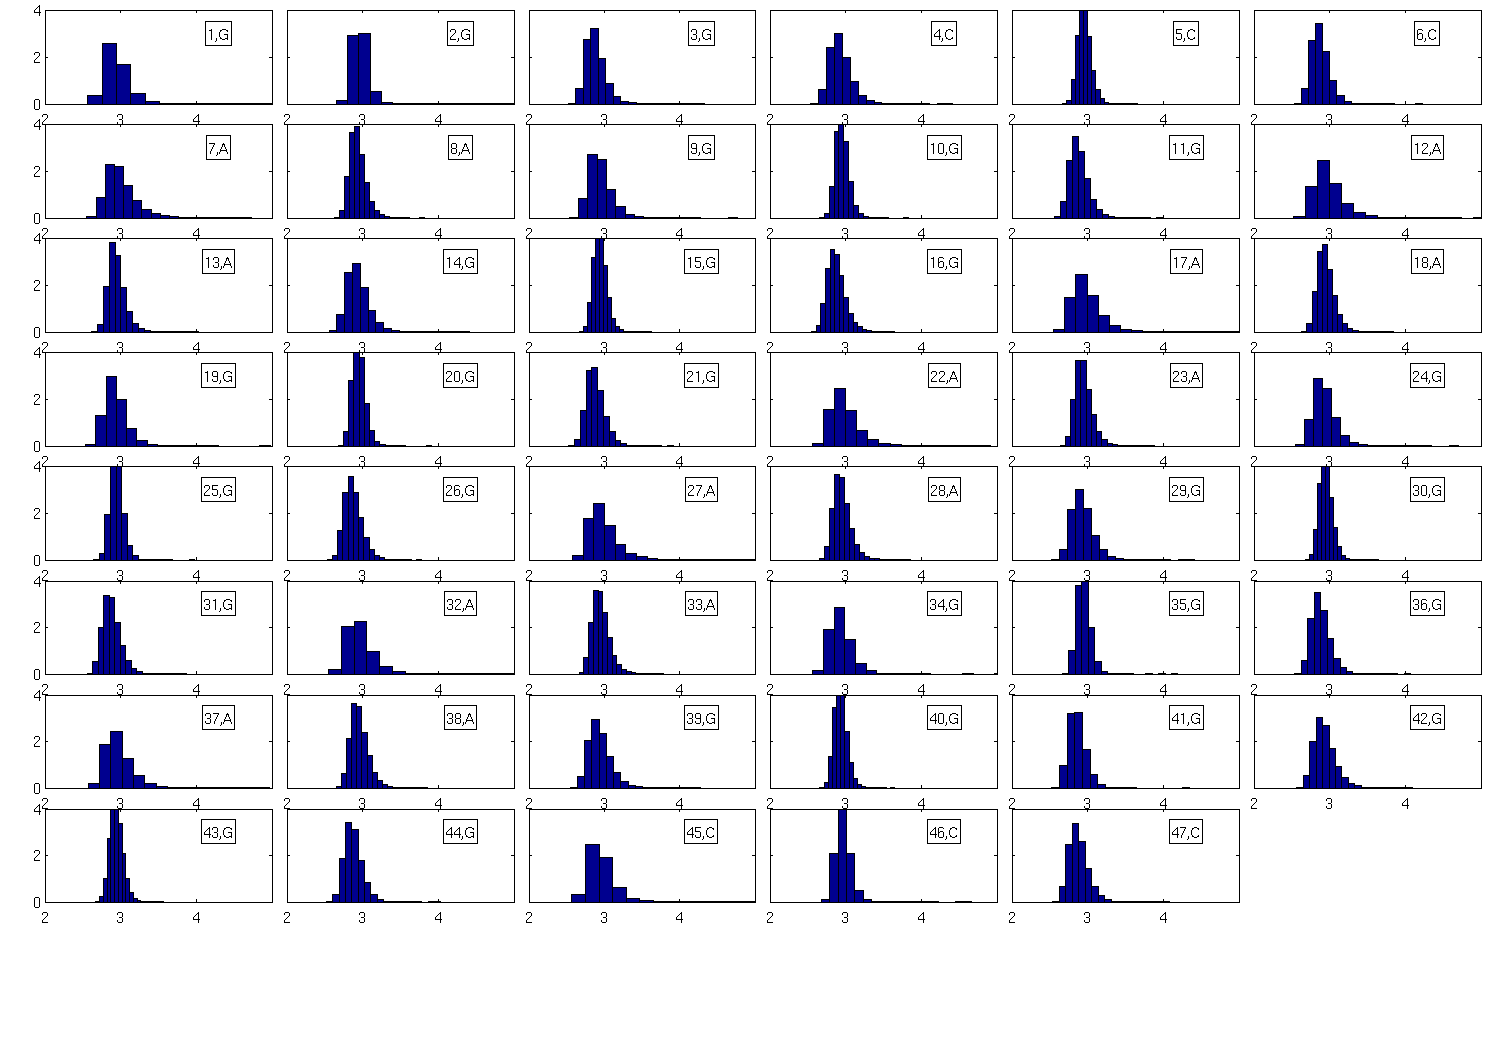
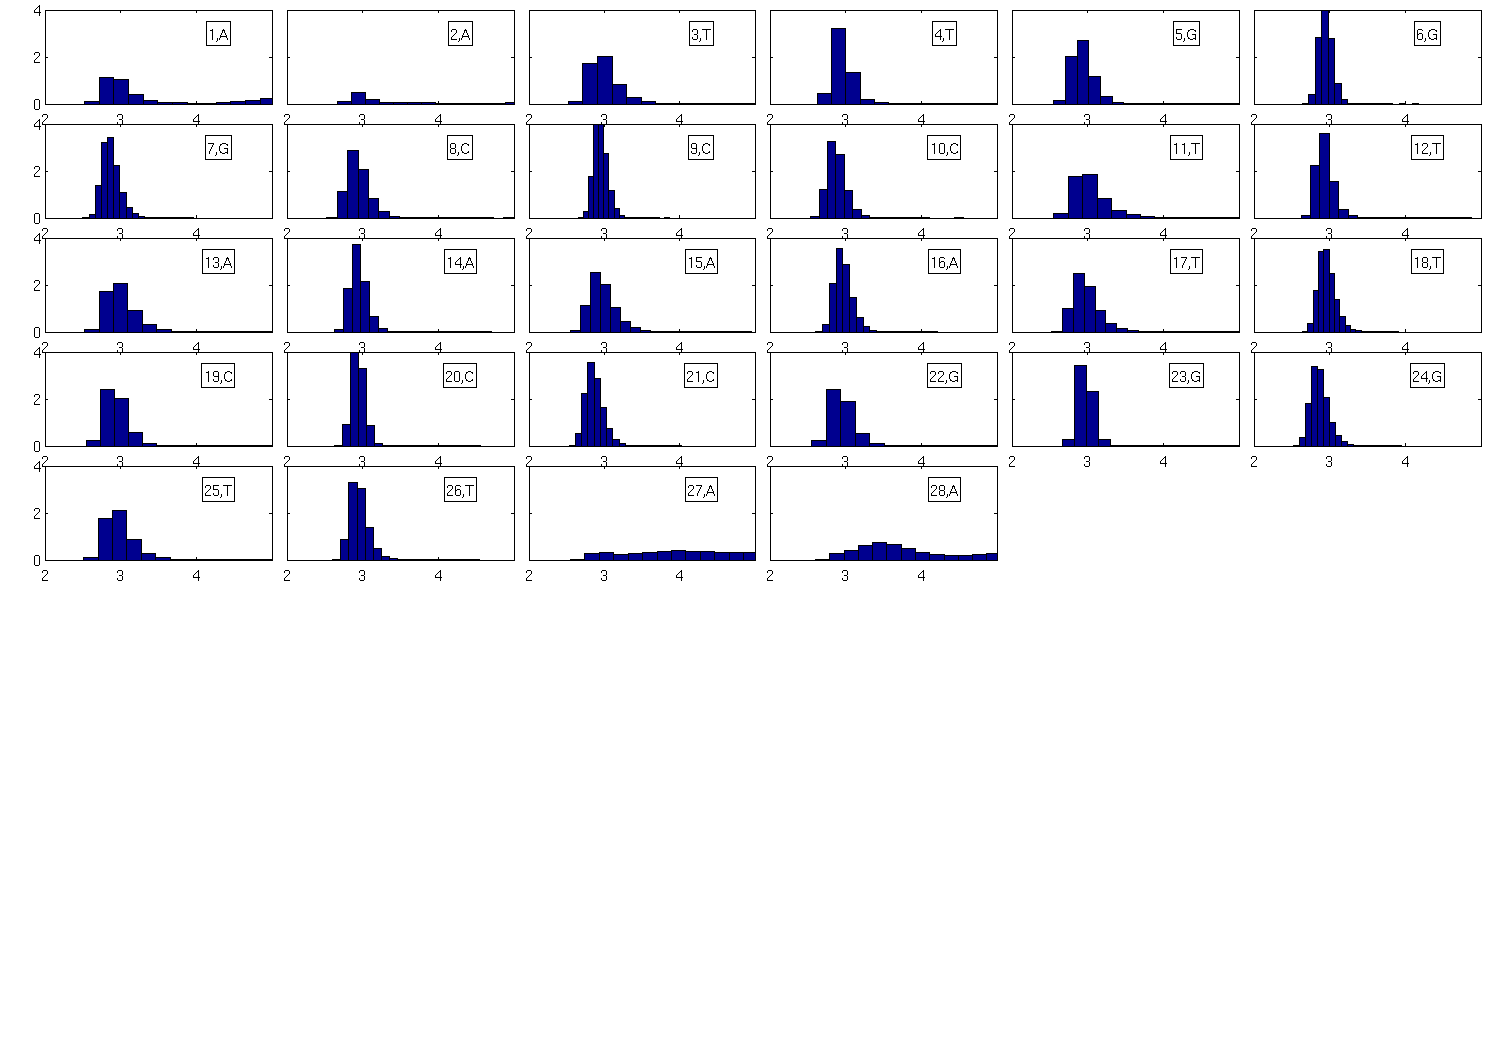
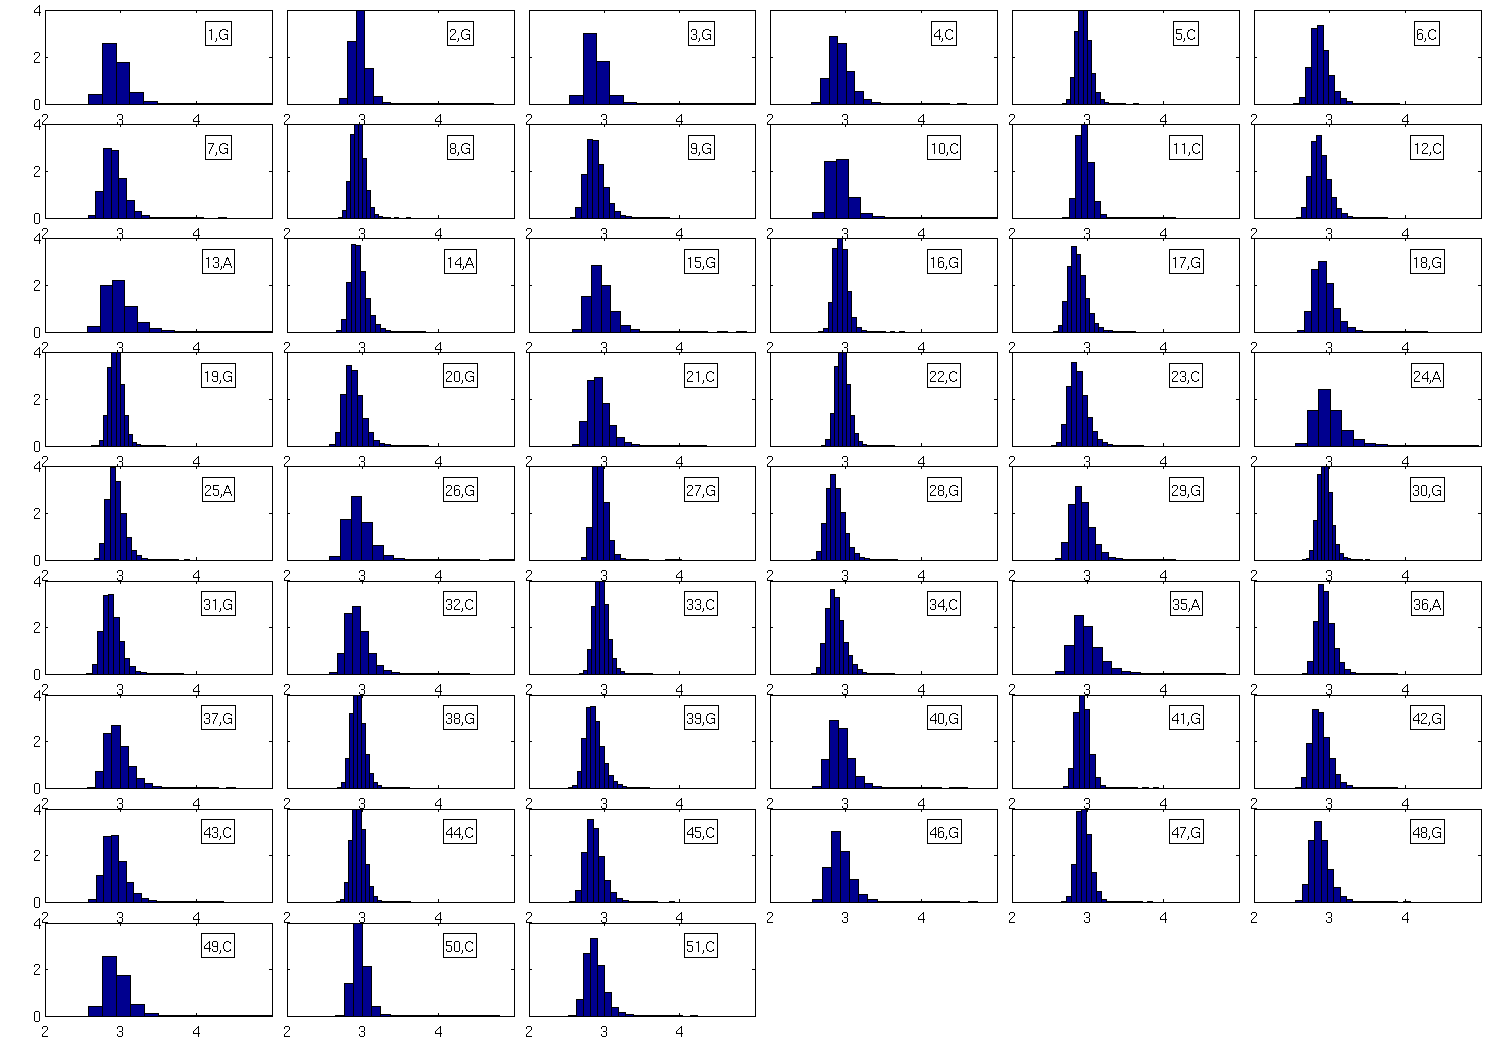
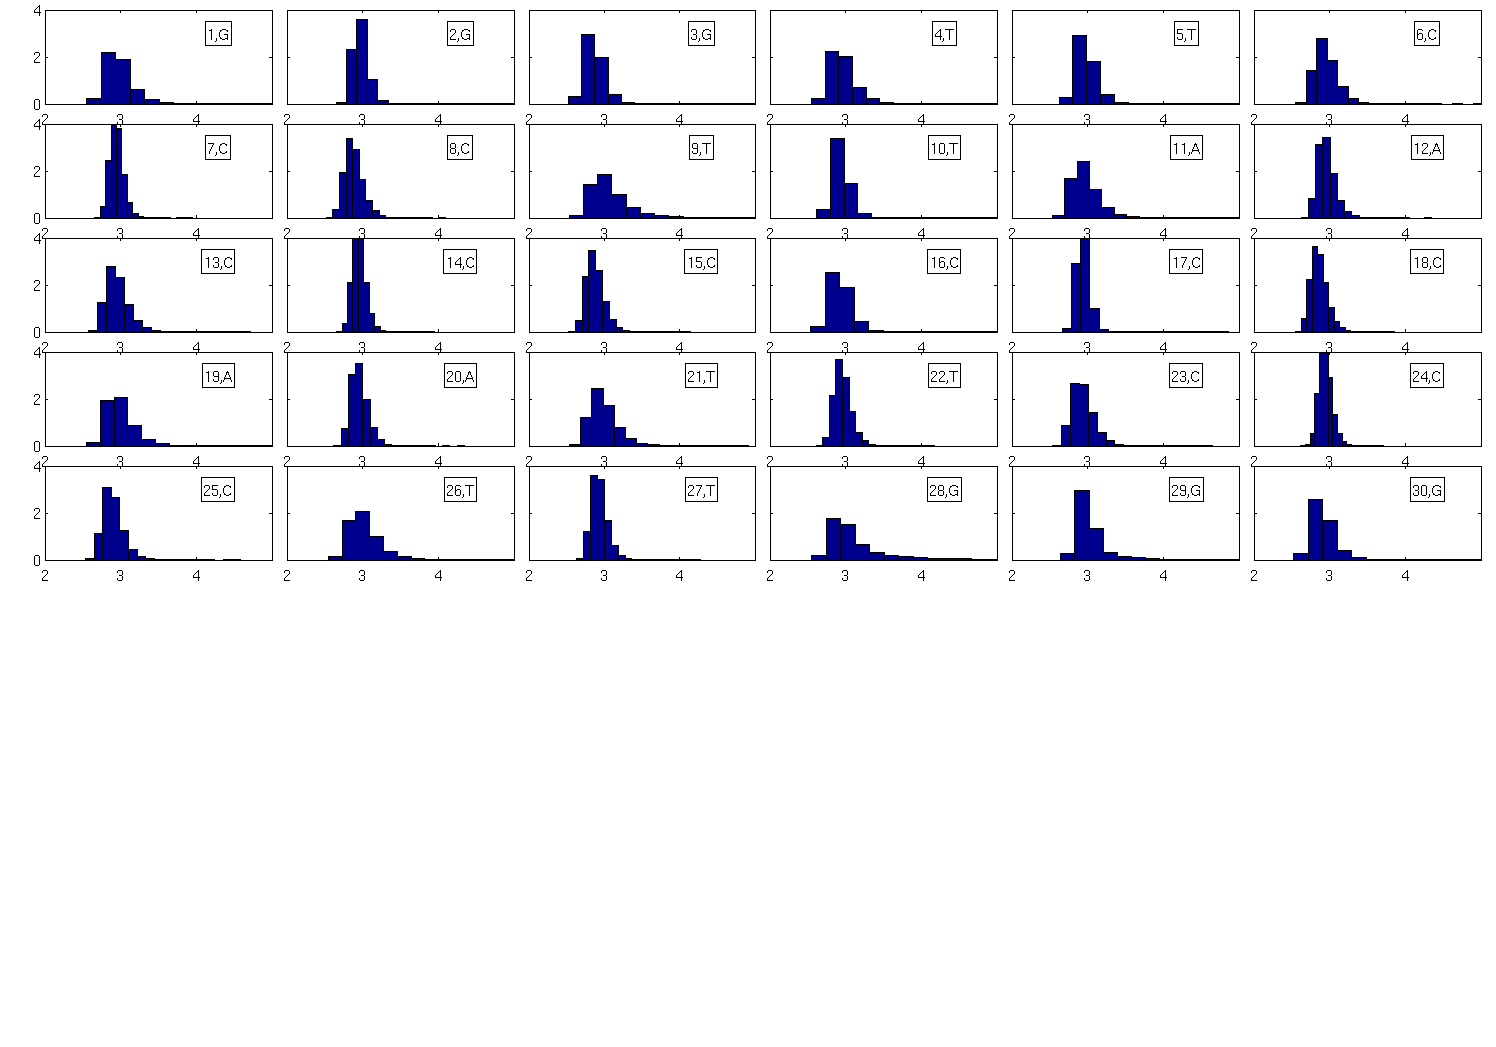
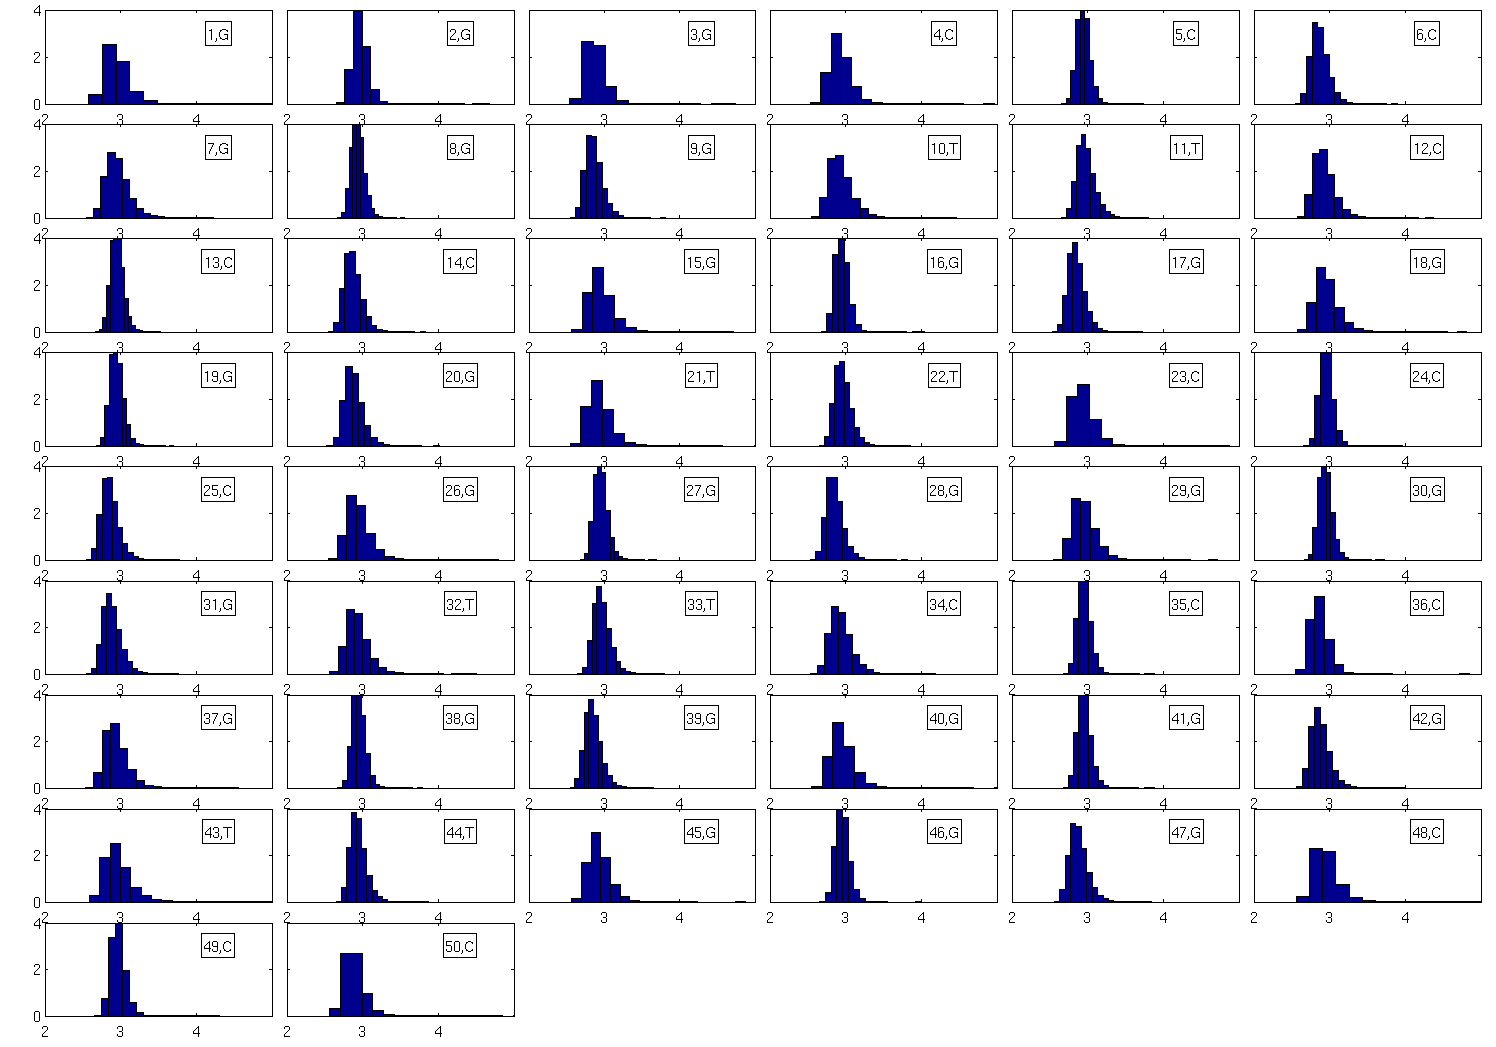
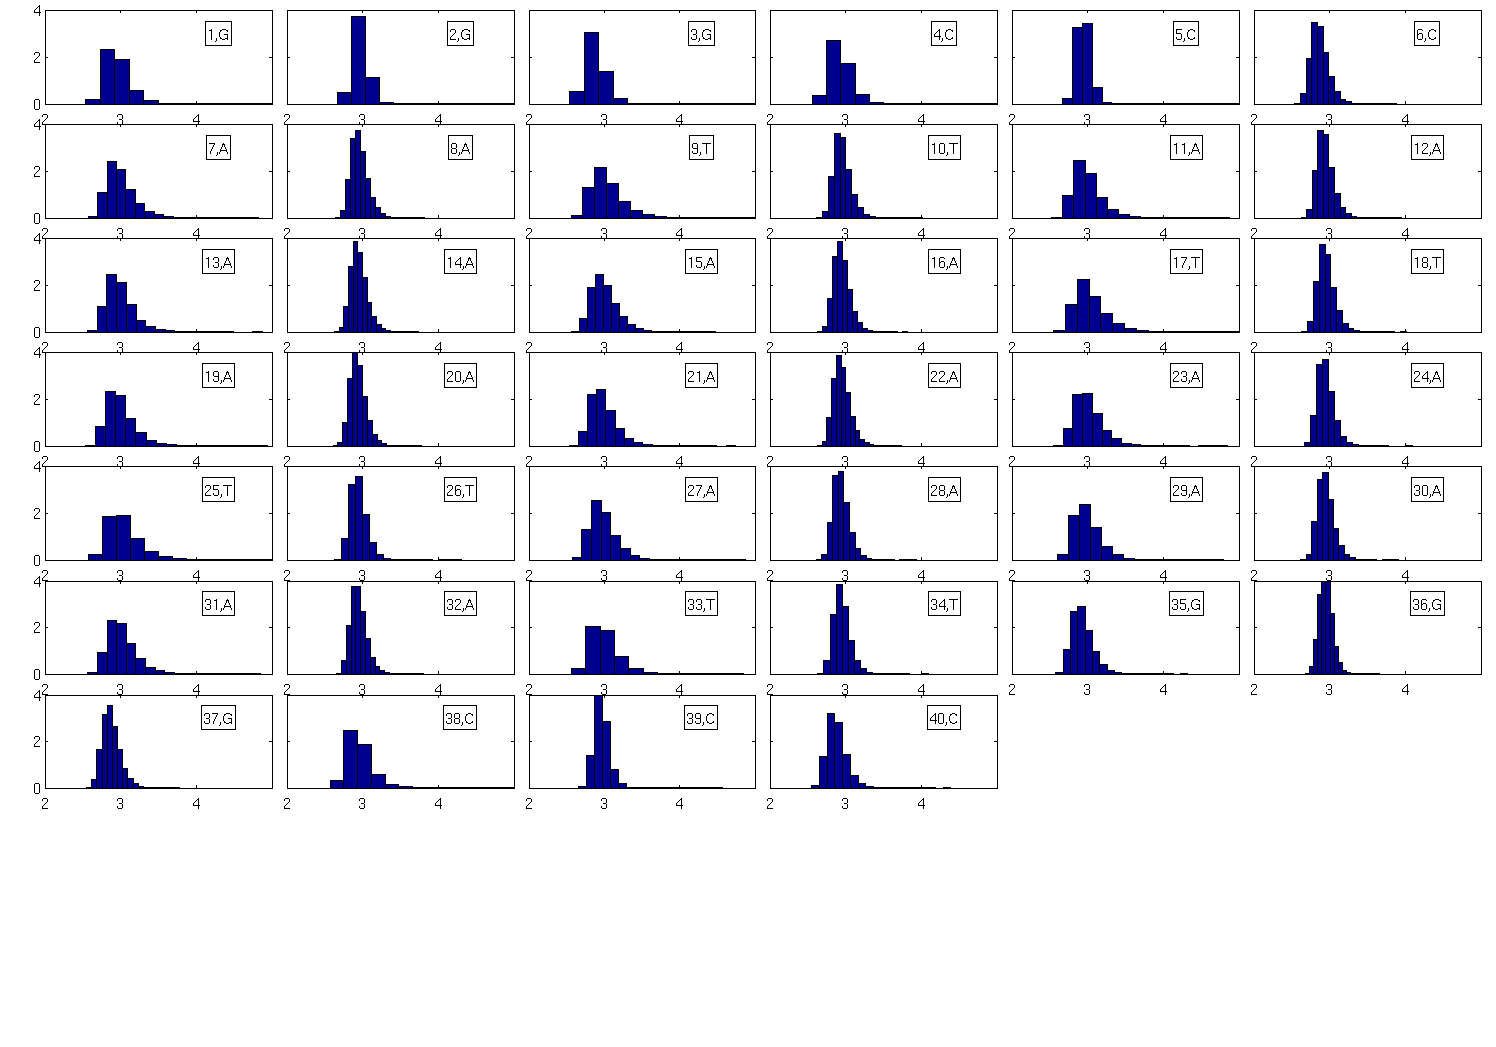
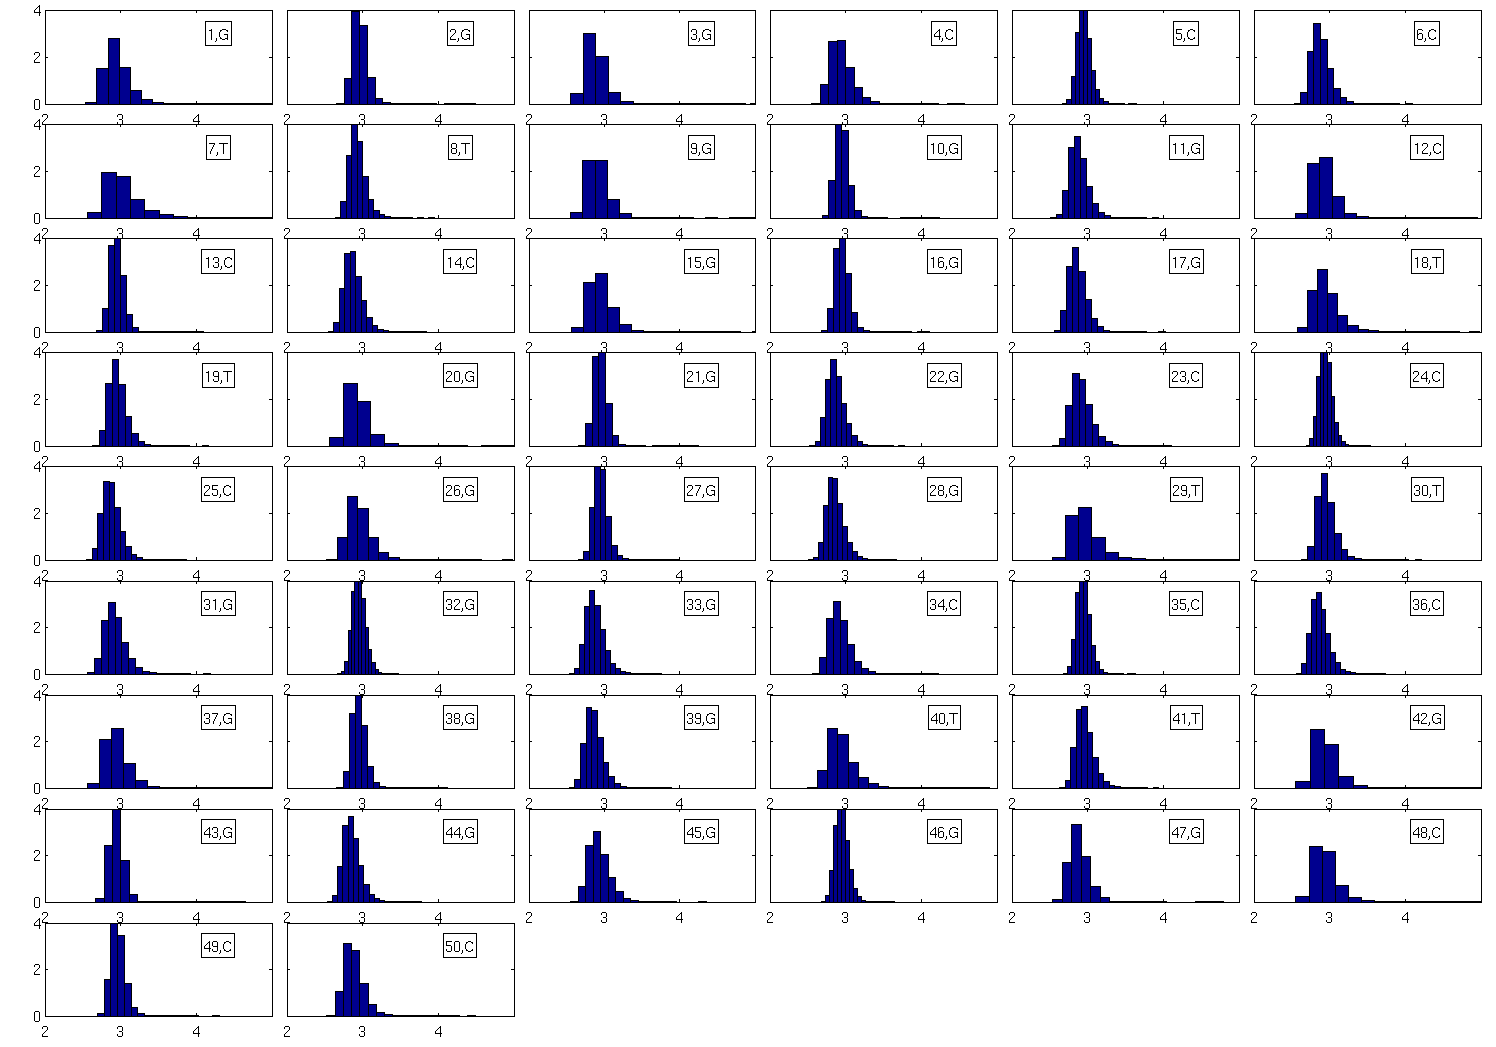
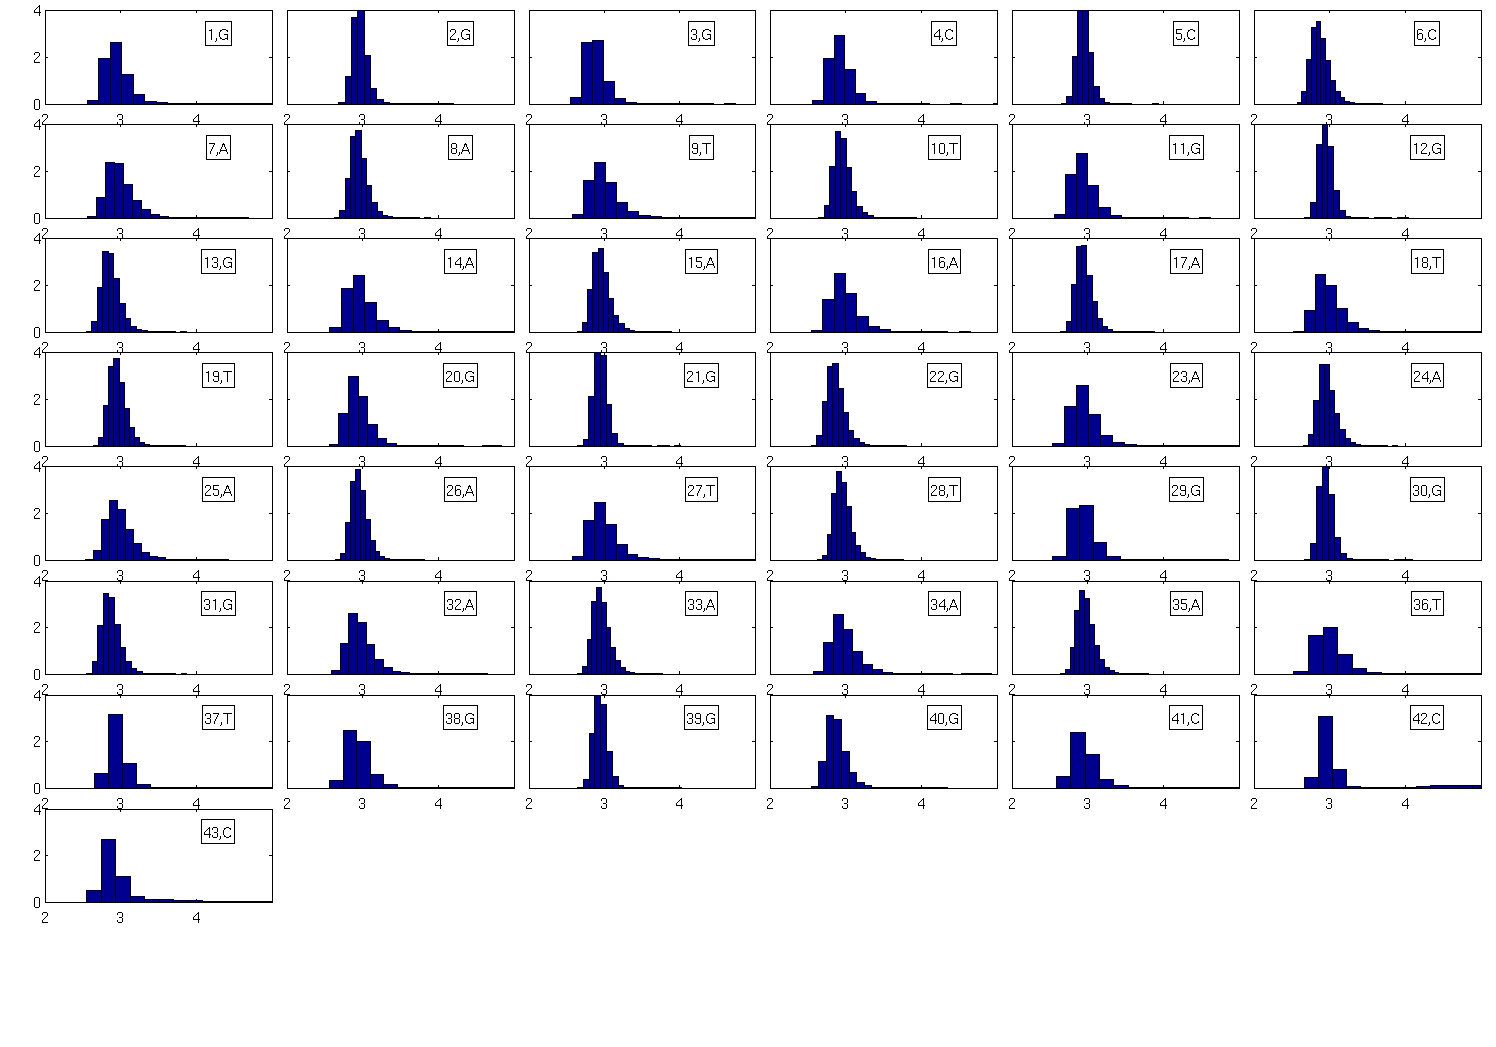
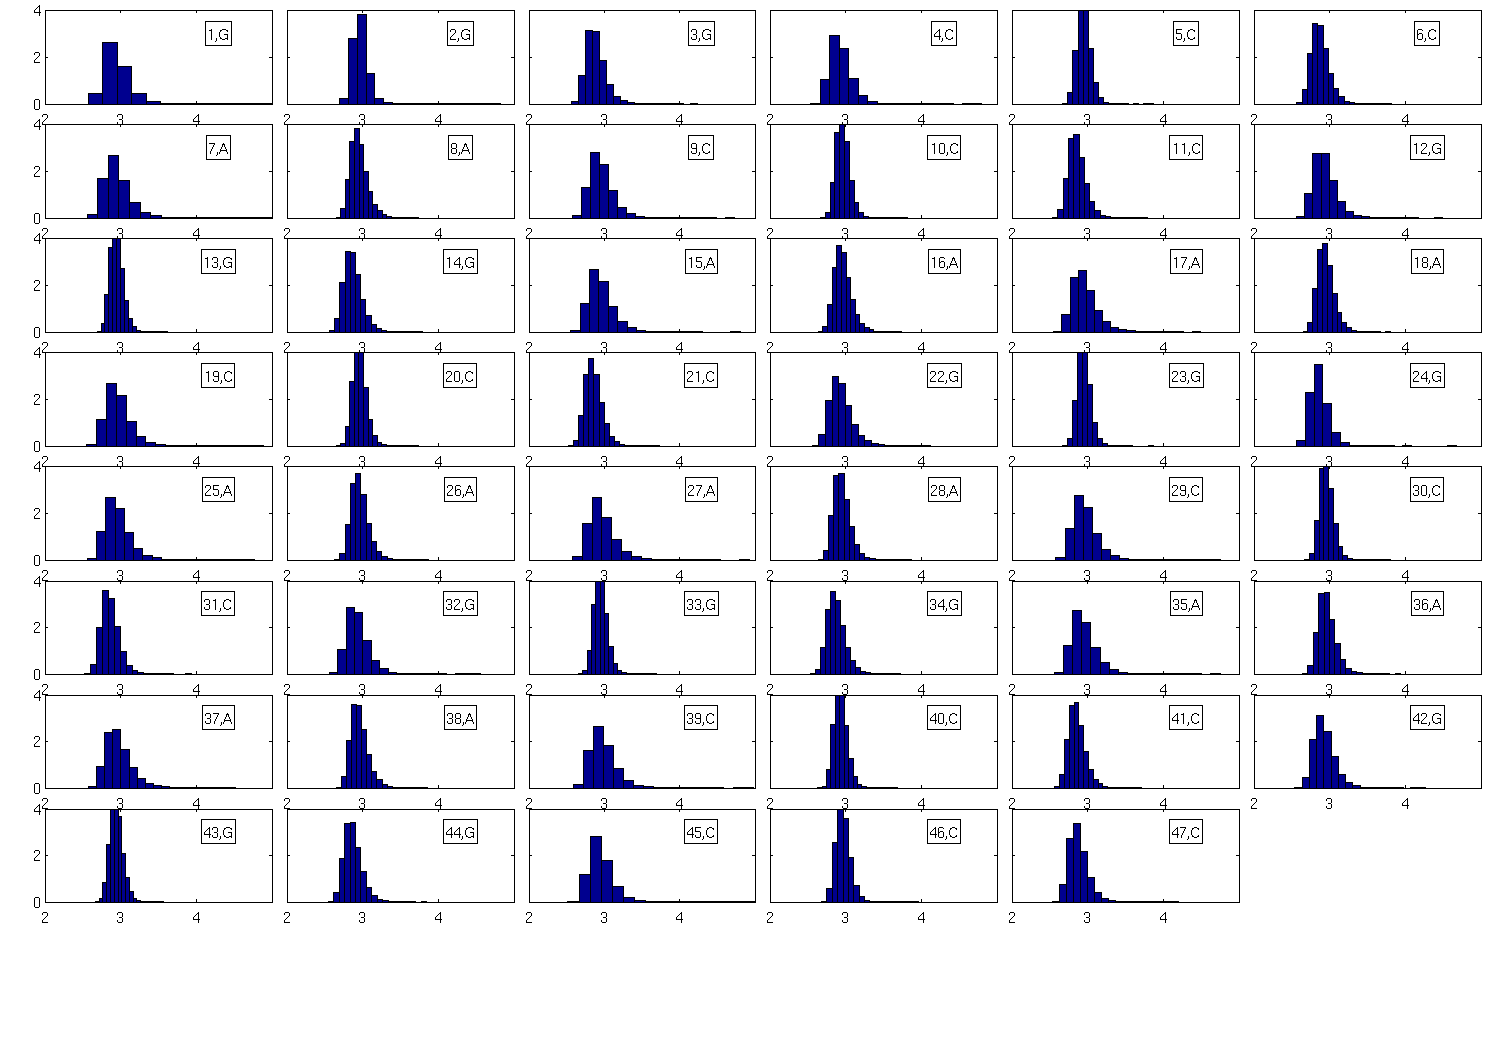
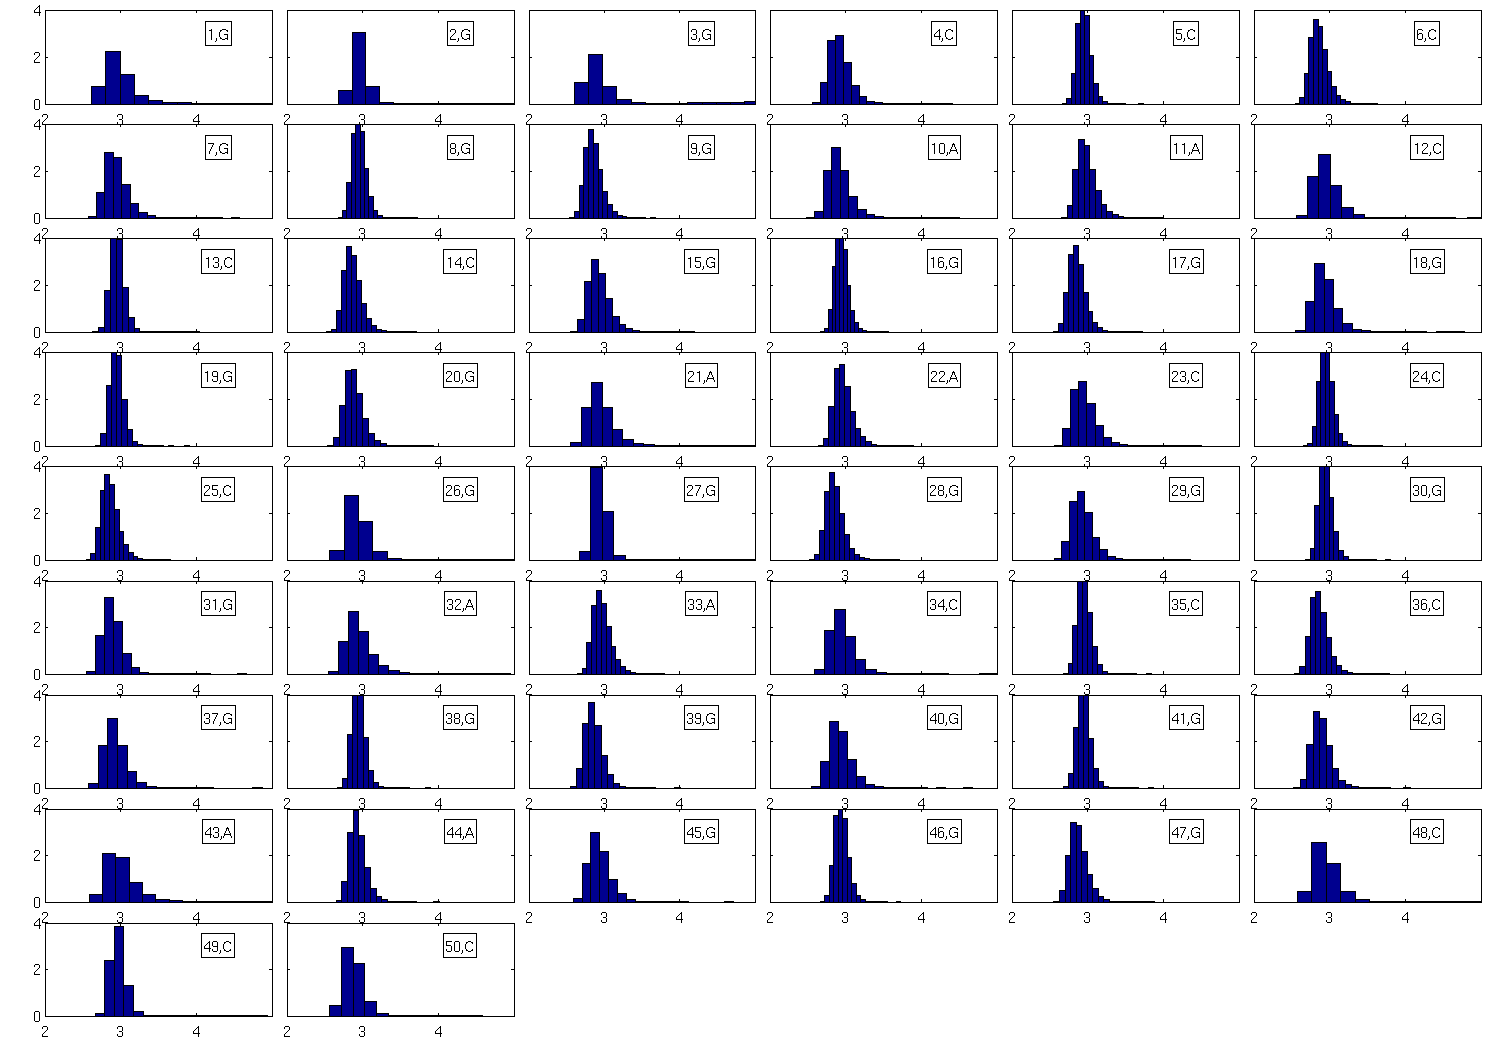
Hydrogen bond filtering
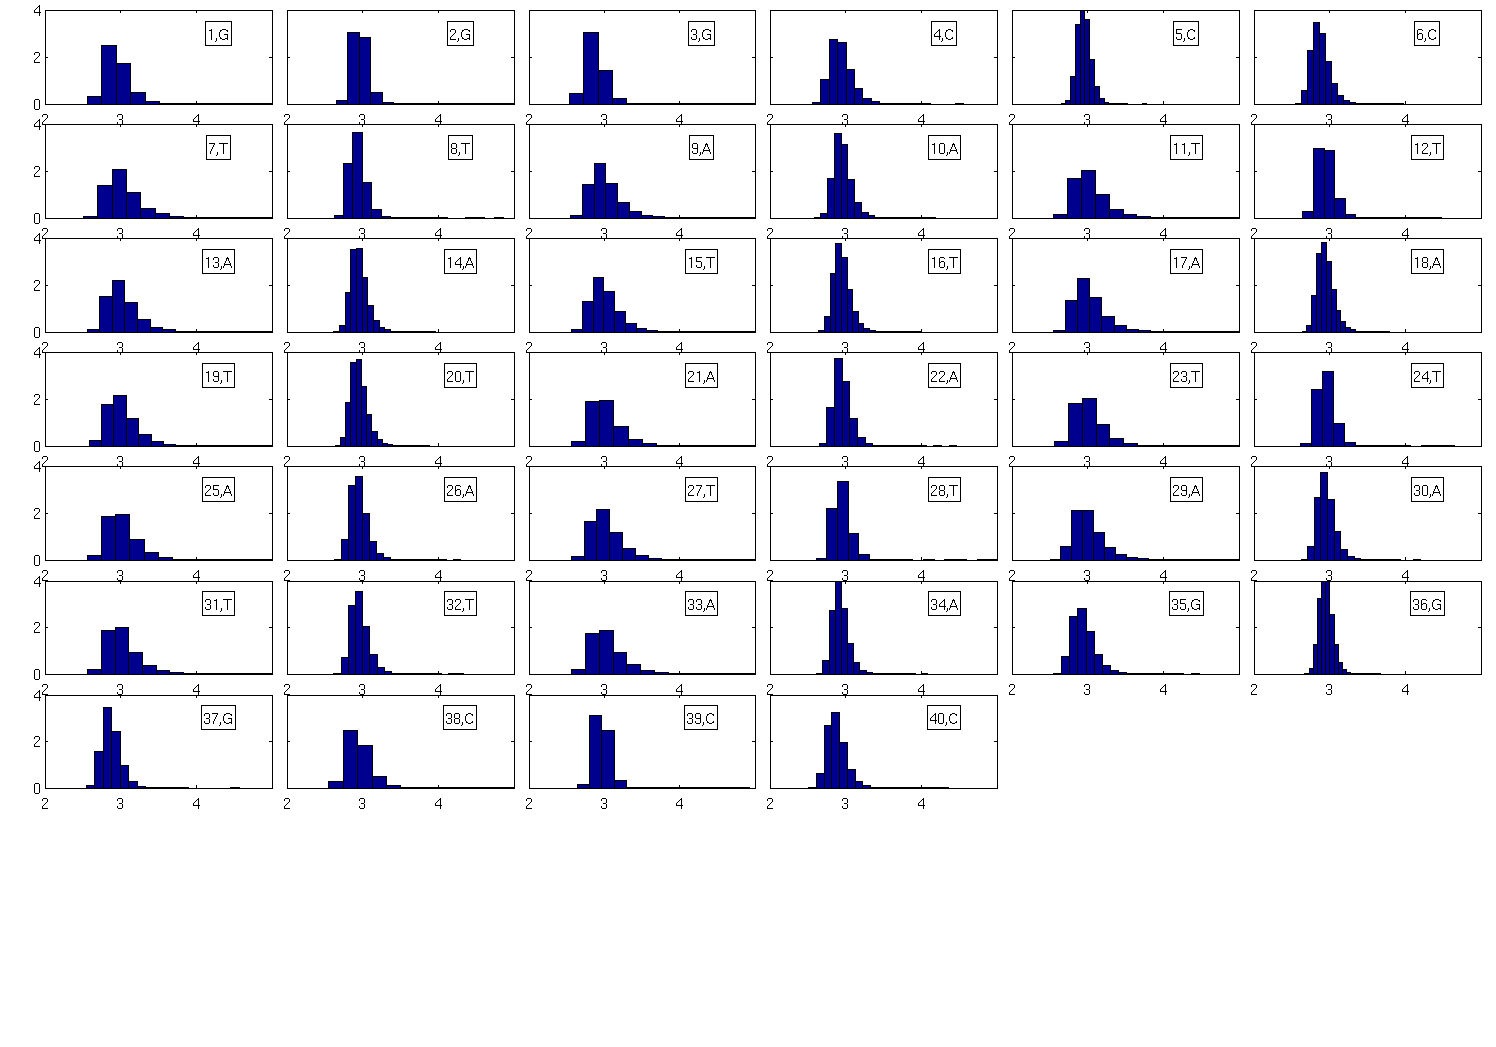
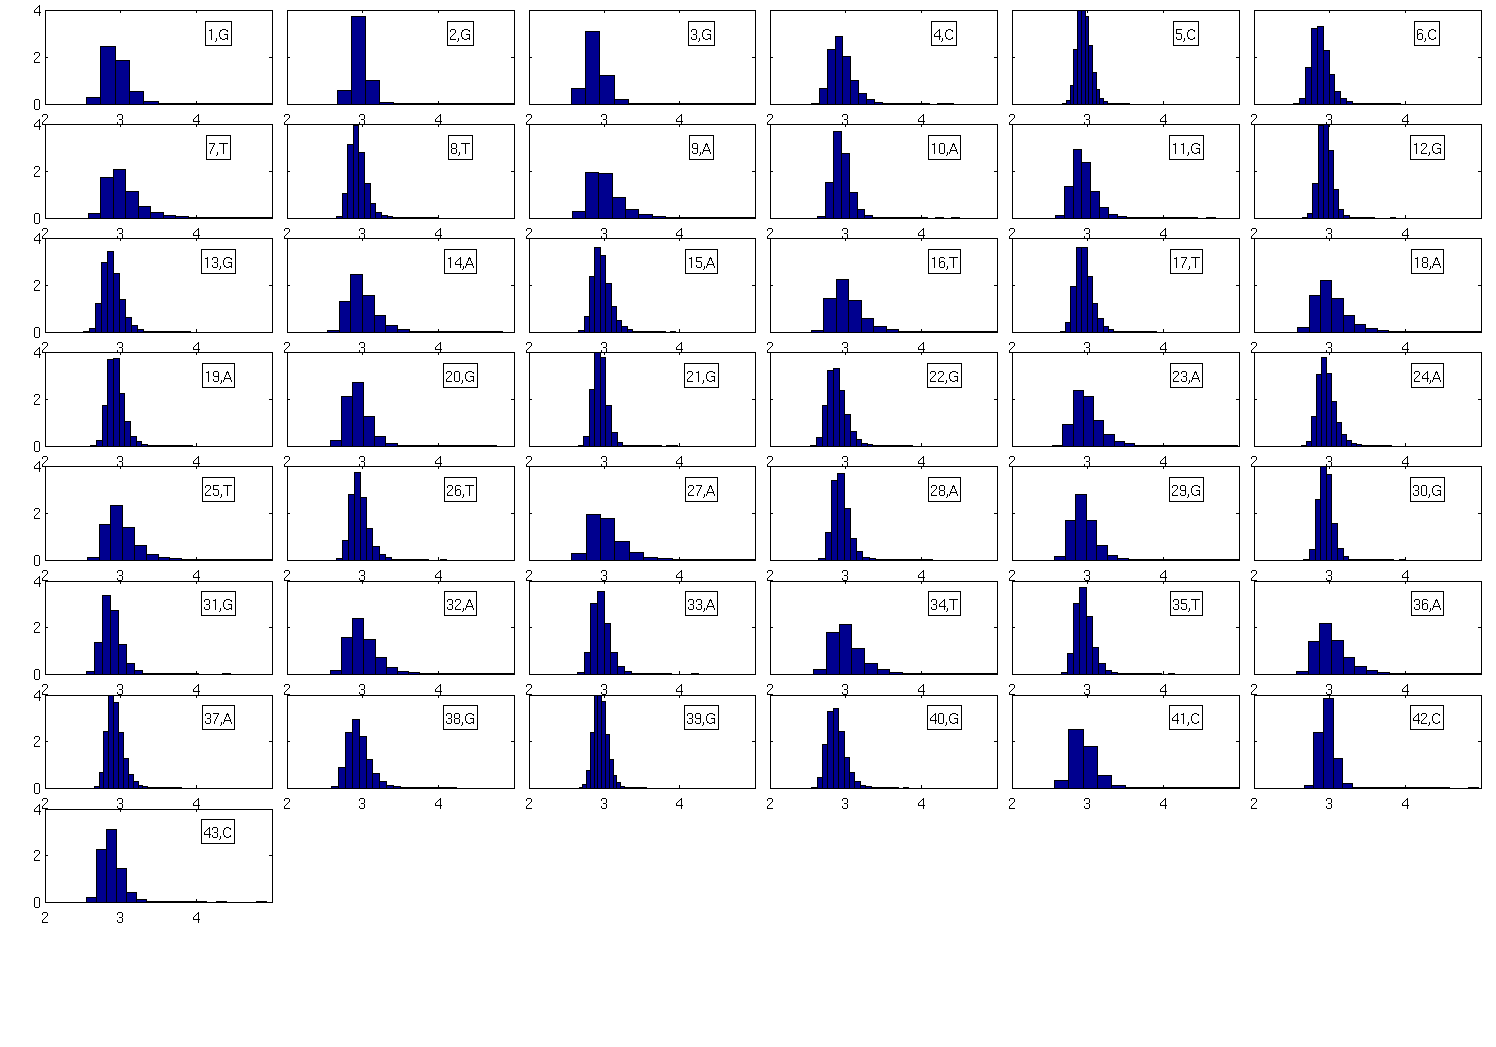
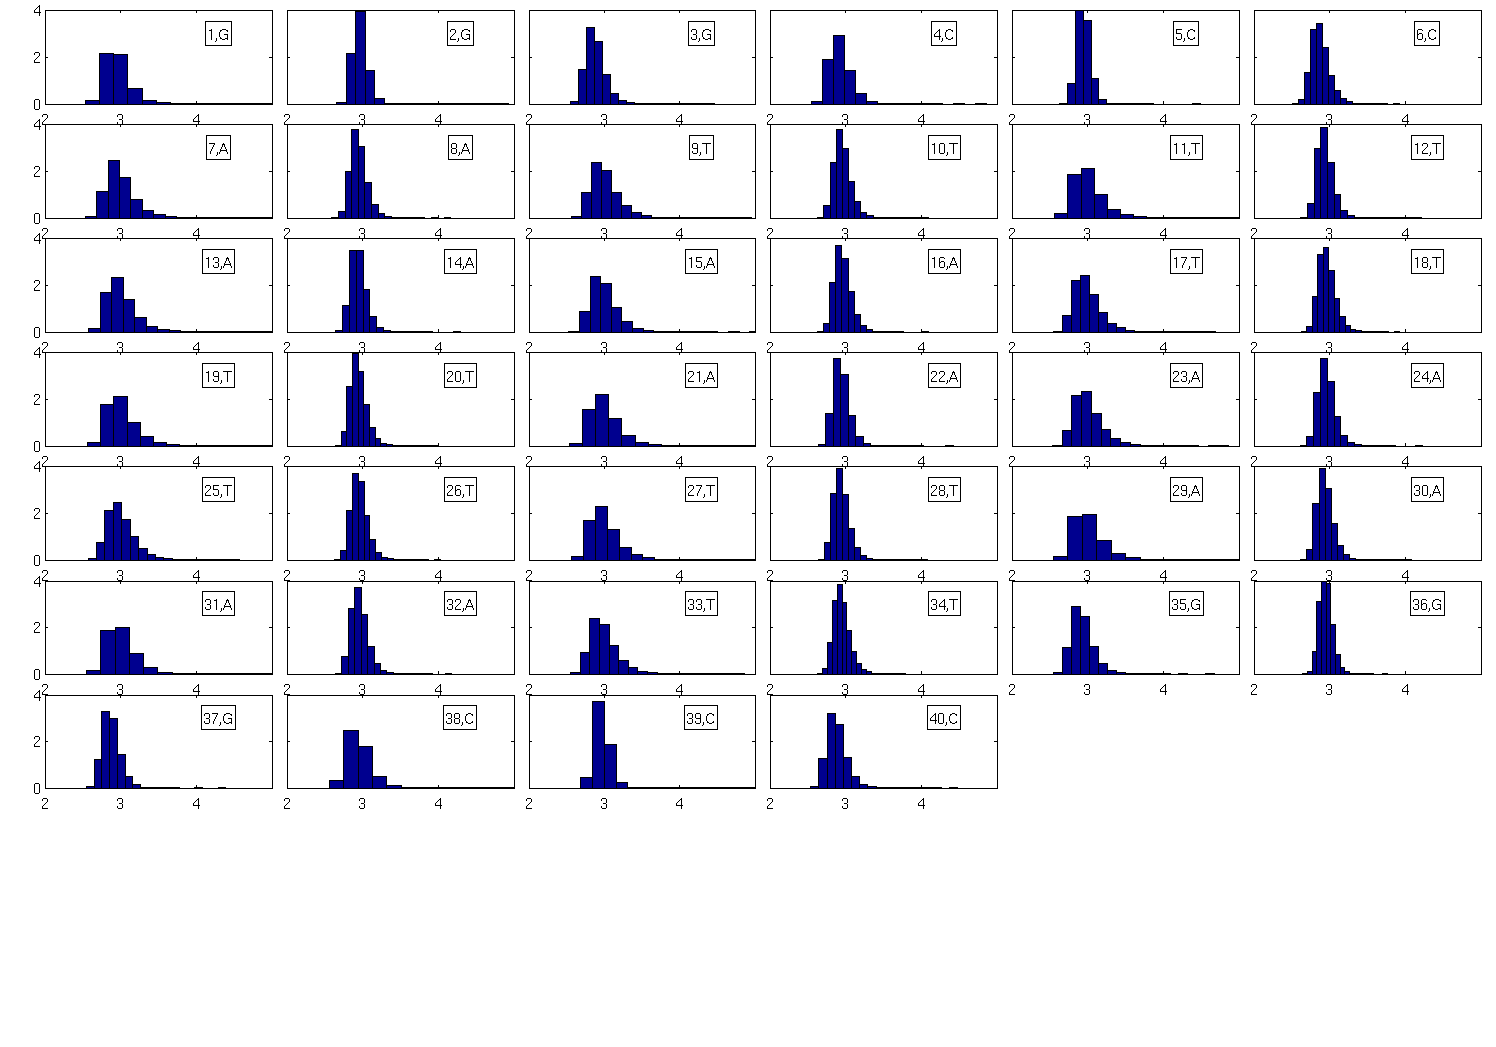
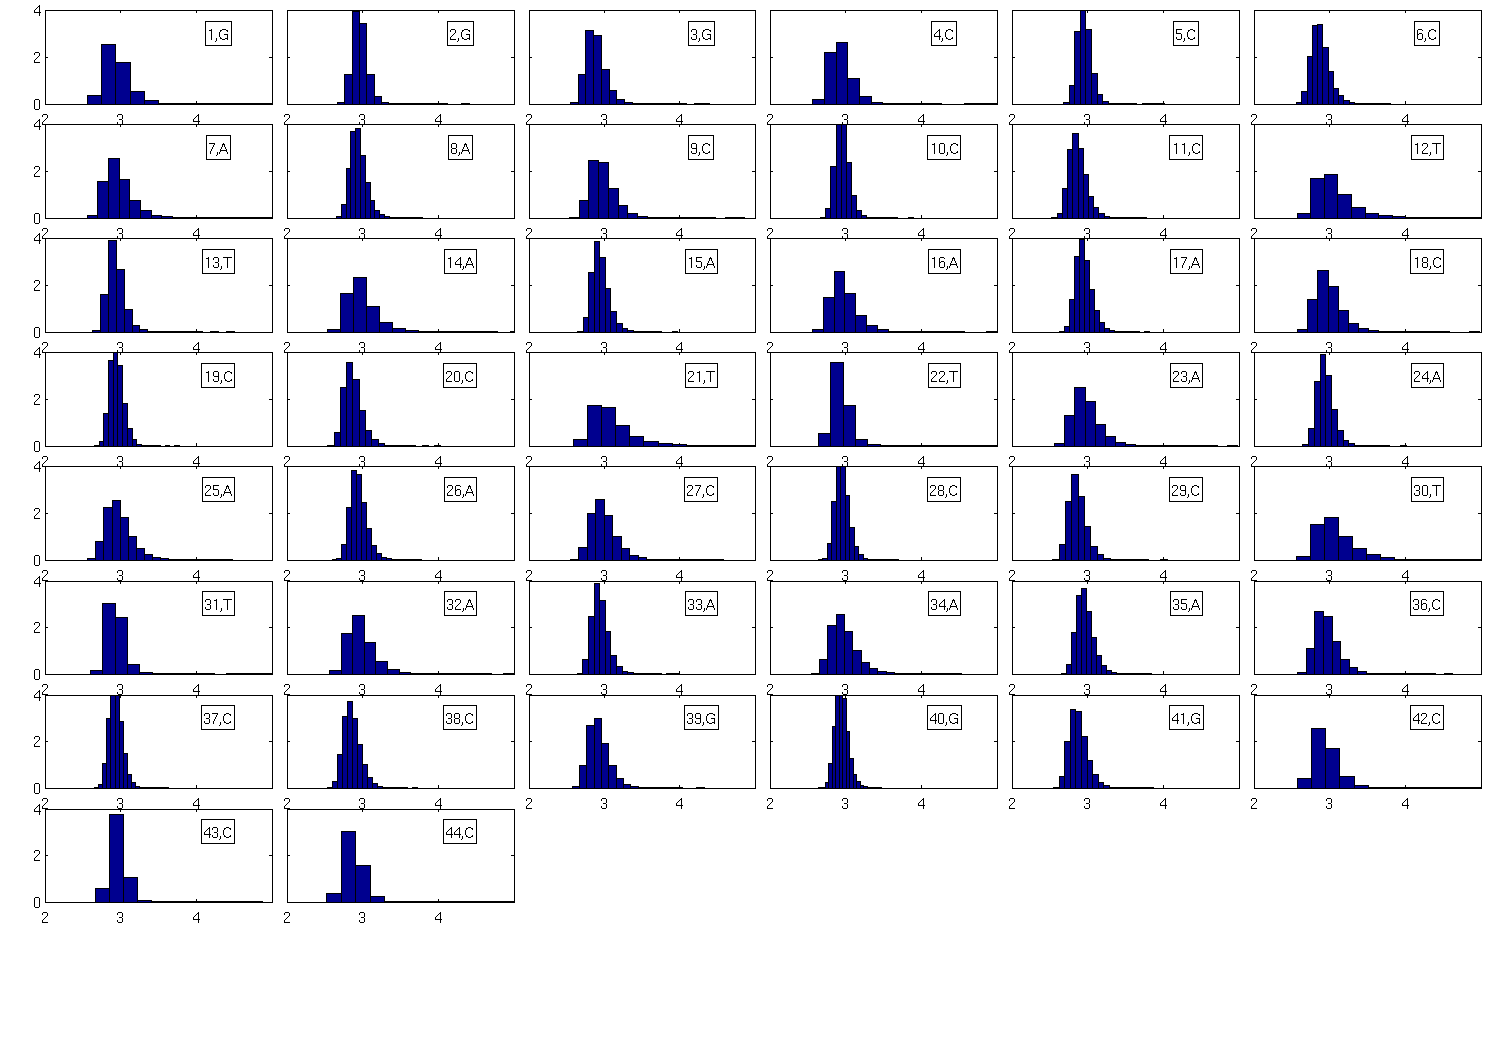
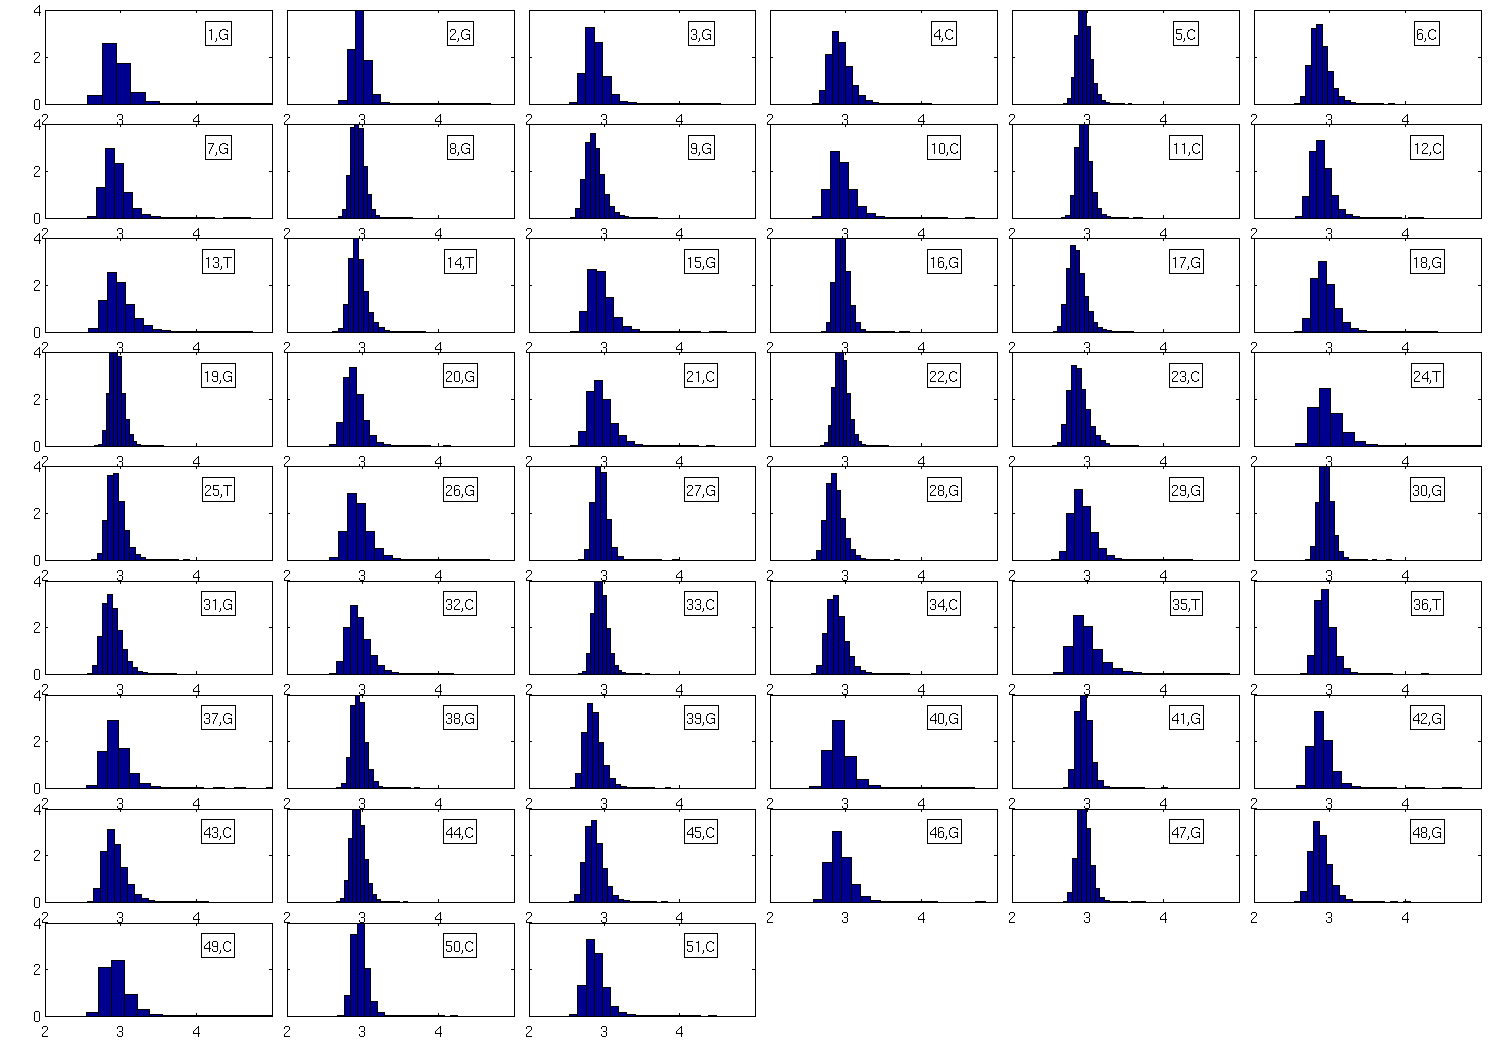
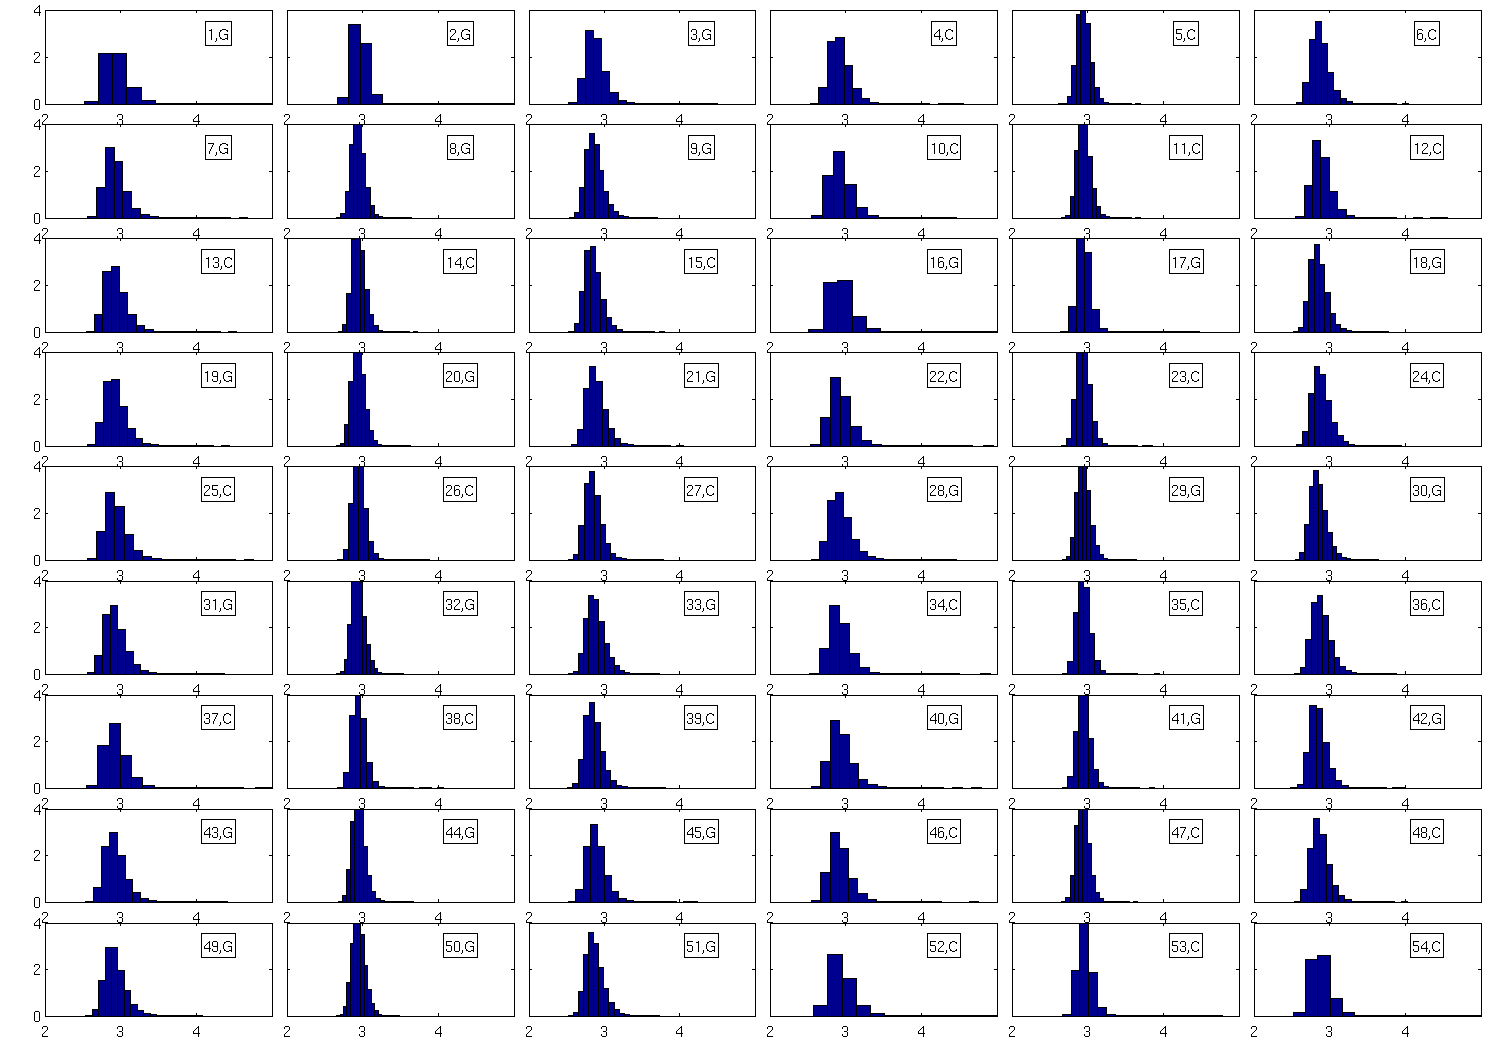
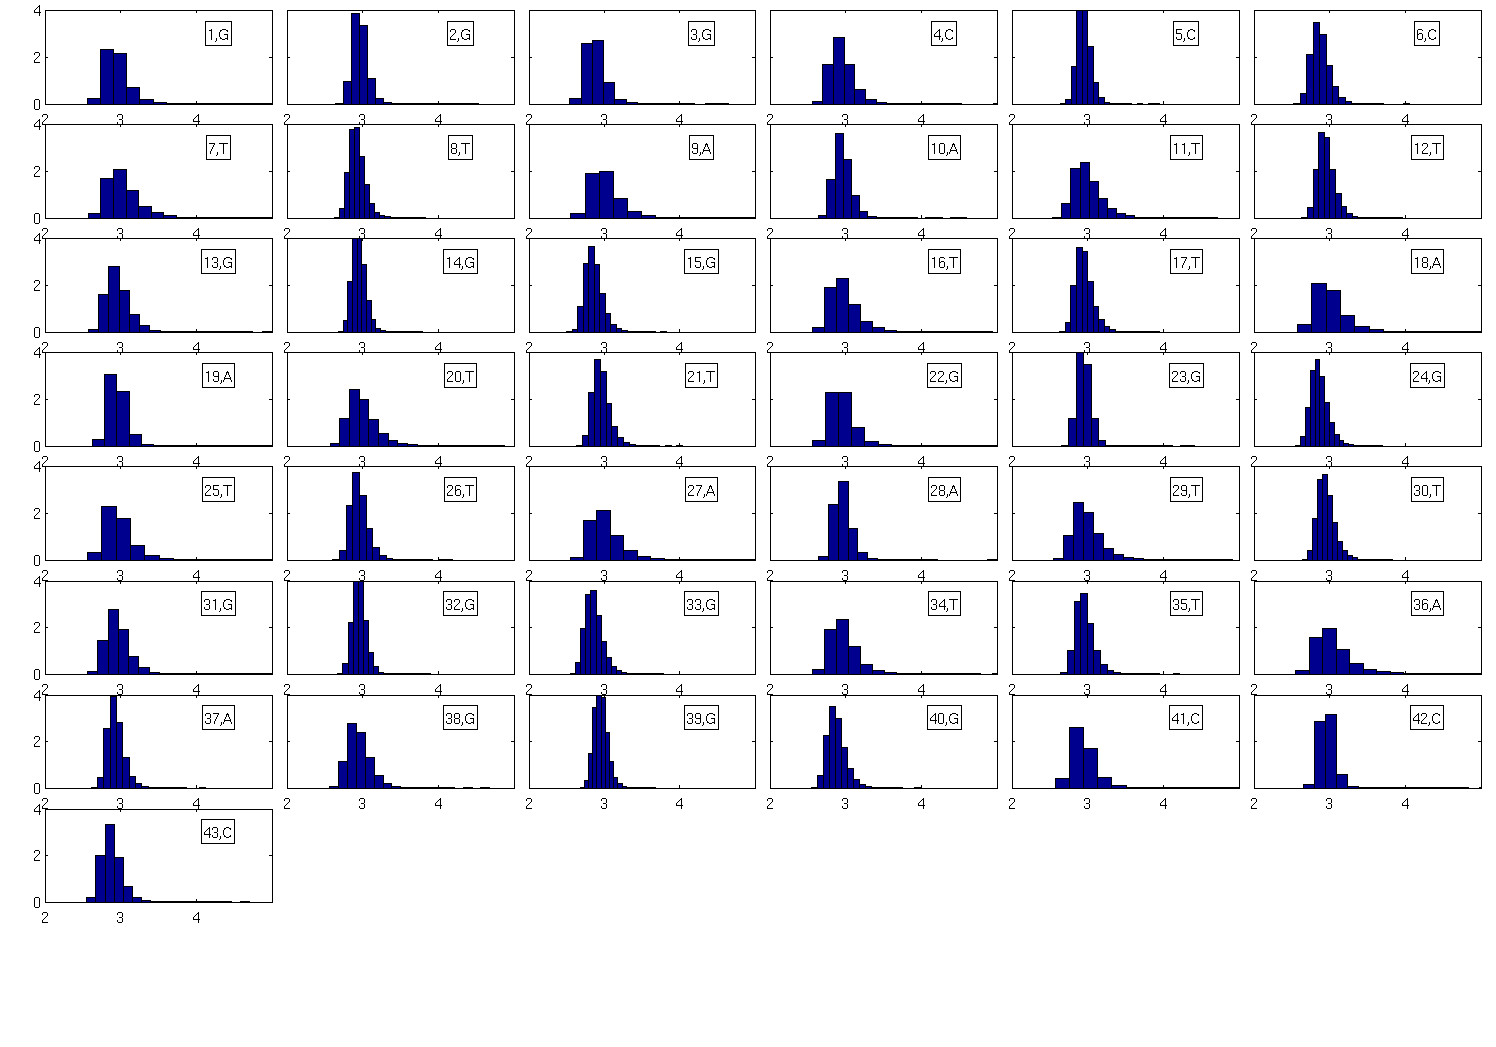
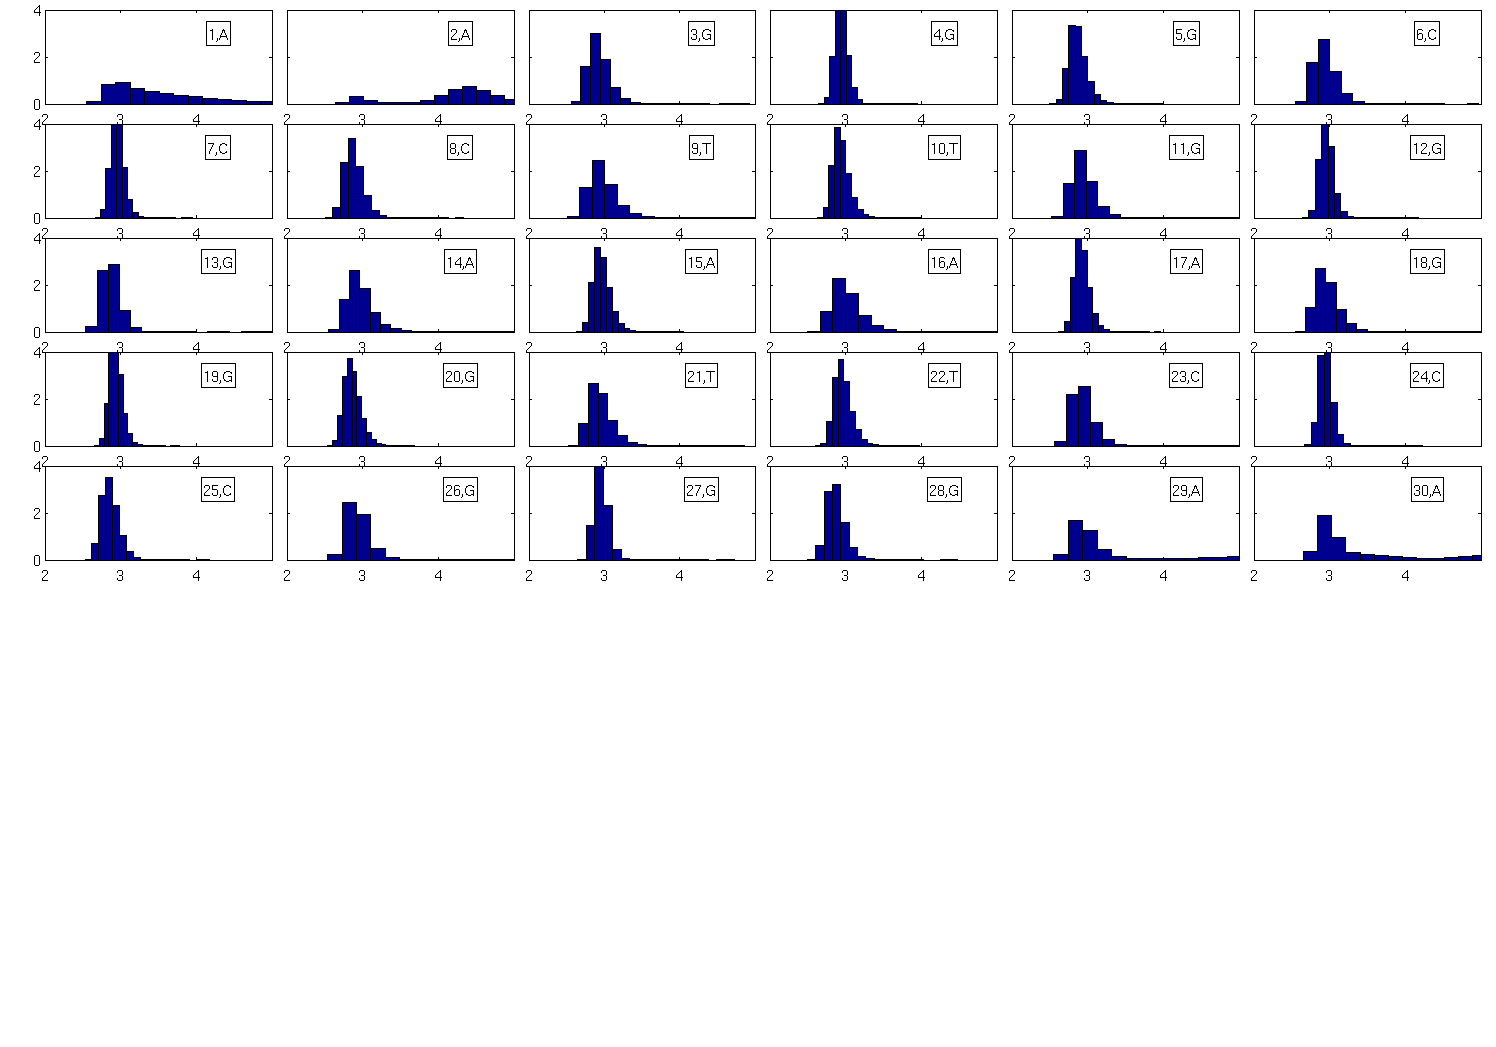
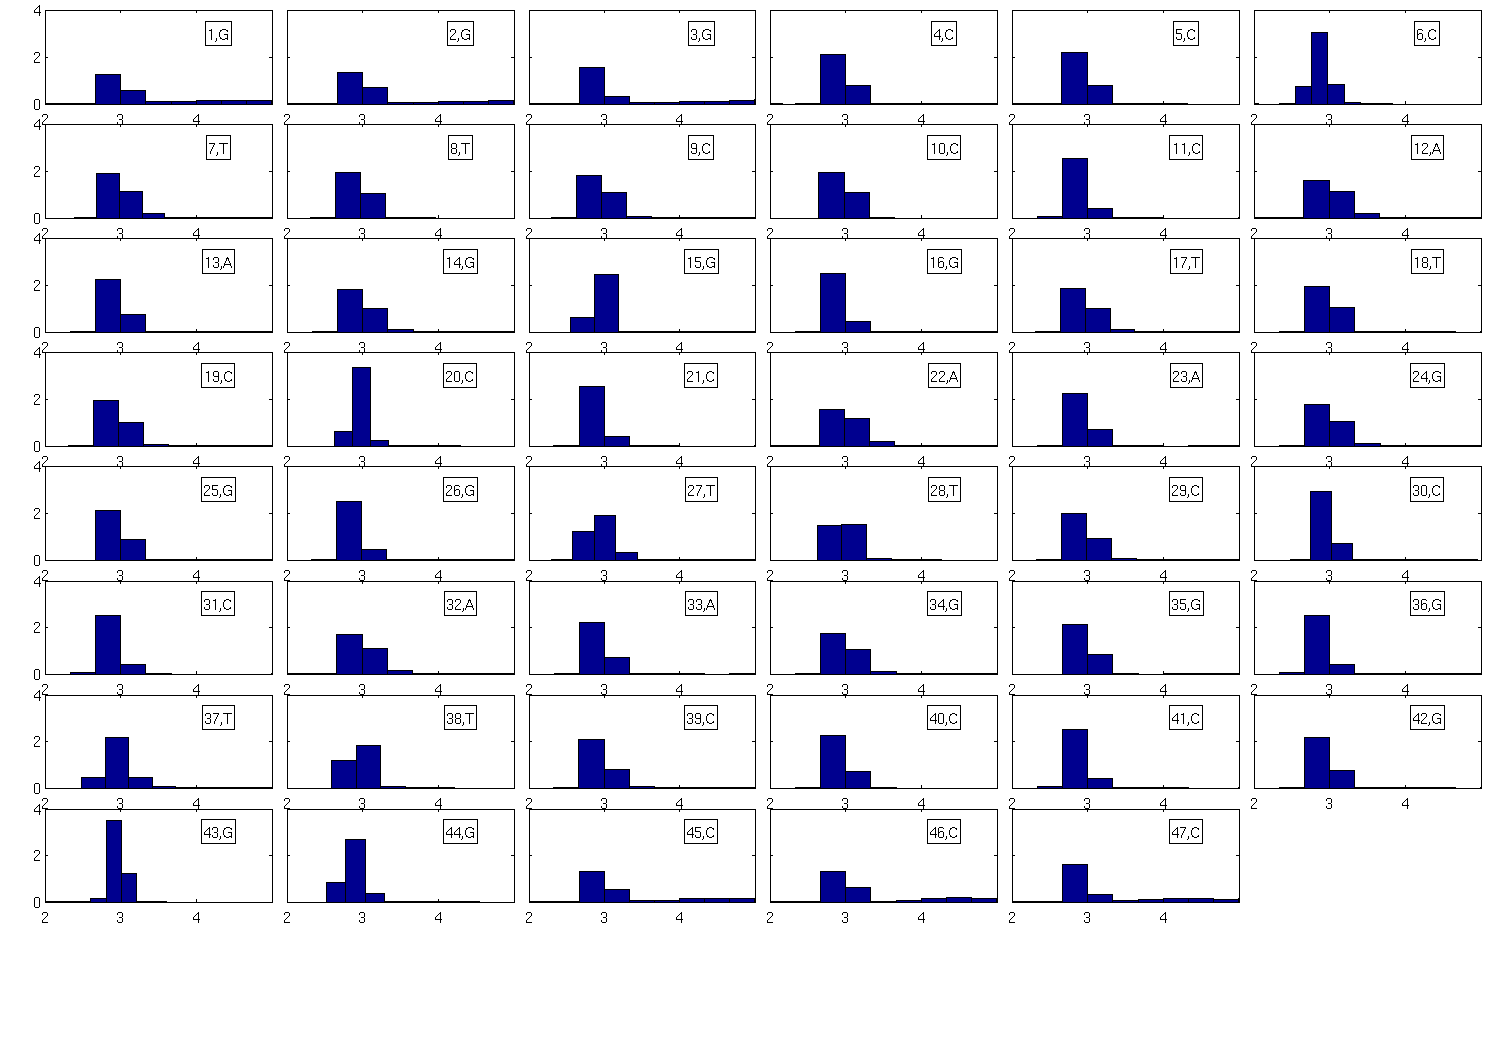
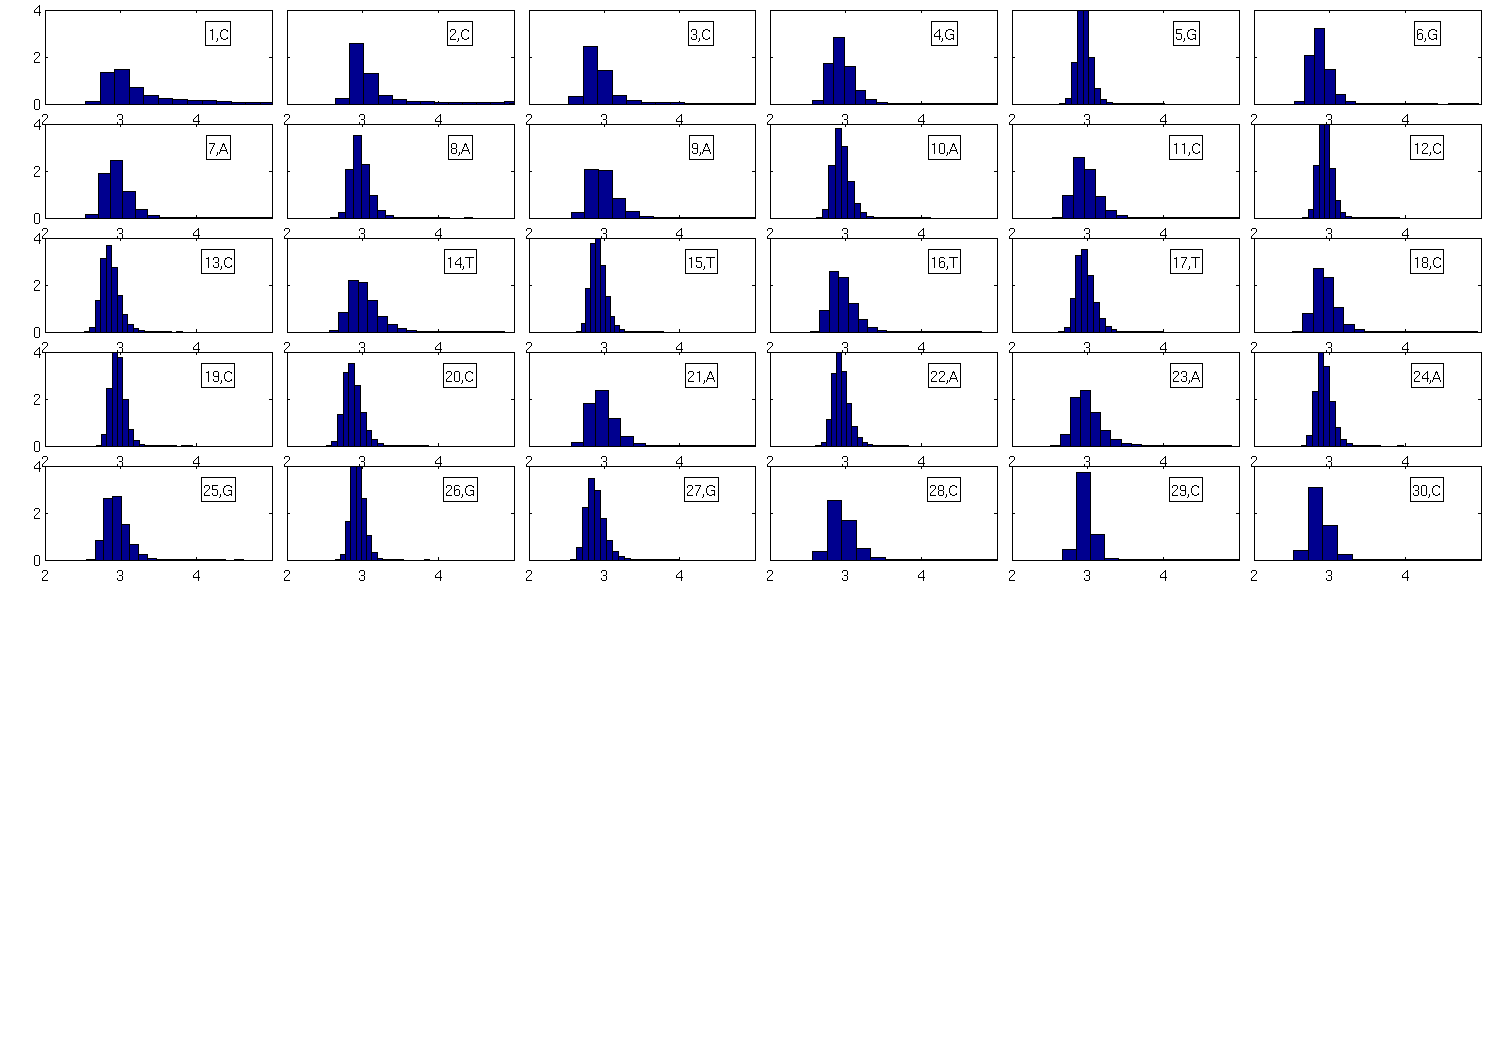
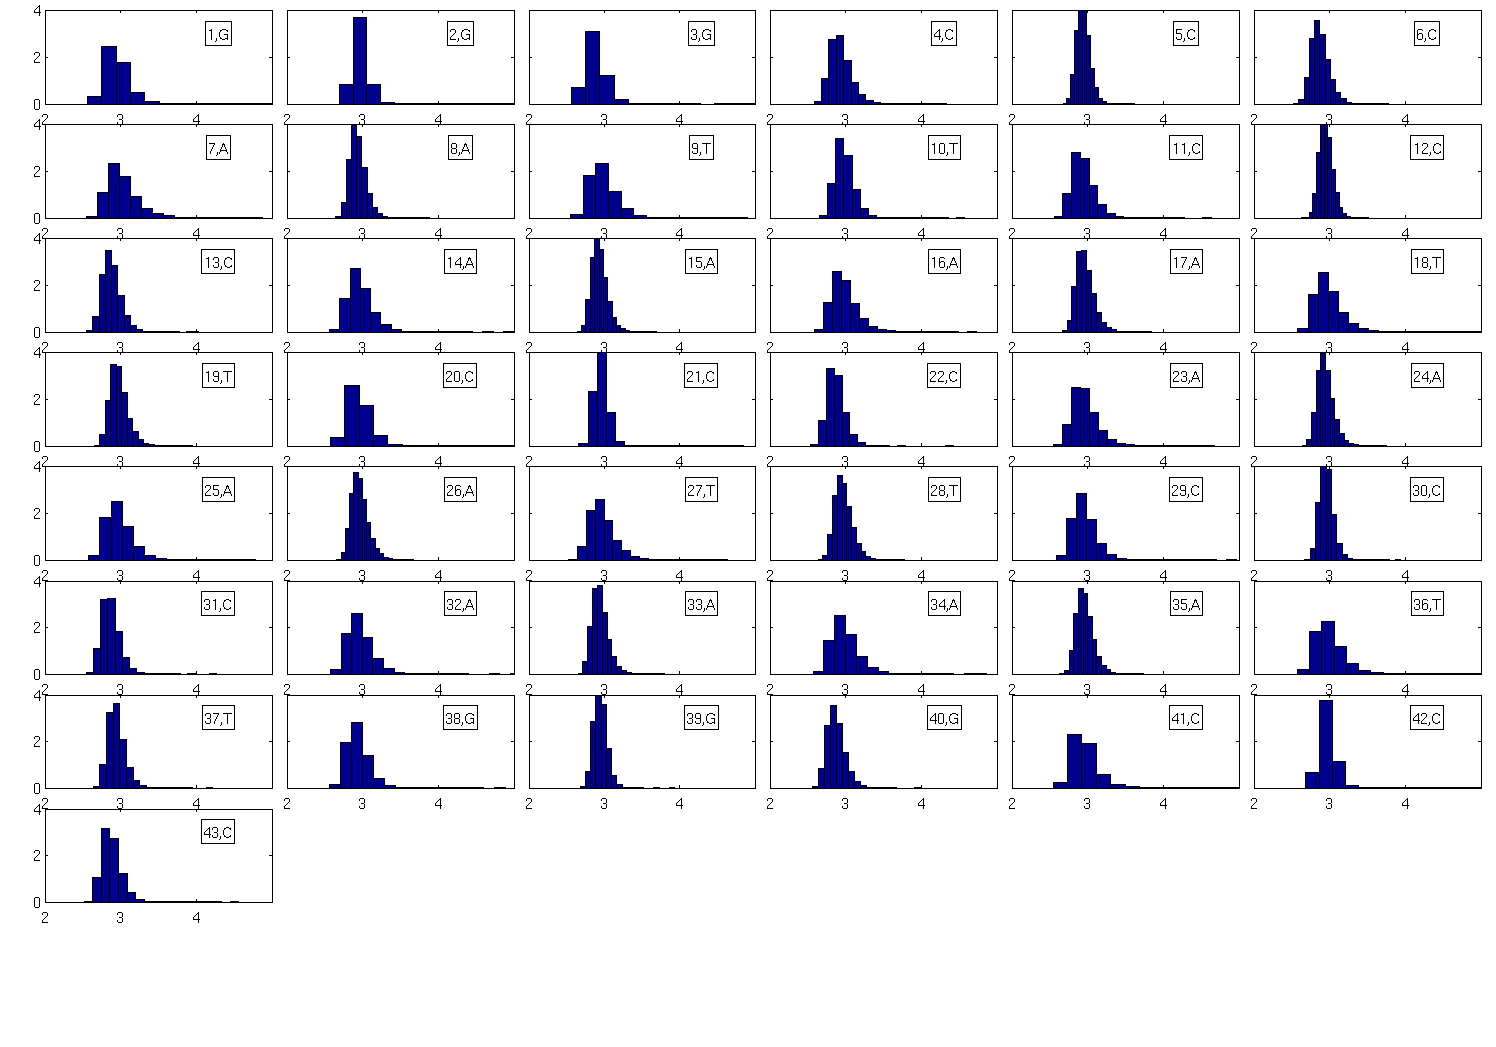
Plots histograms of hydrogen bond lengths (in Å) for the sequences 1-56 from the training data set. For each sequence, the panels corresponding to individual hydrogen bonds are ordered from left to right and from bottom to top. The index of the hydrogen bond and the corresponding base are indicated on each panel.
For fitting our model parameters only data from the MD snapshots of DNA without broken hydrogen bonds was used. We consider a hydrogen bond broken if the distance between the corresponding atoms is above 4 Å.