
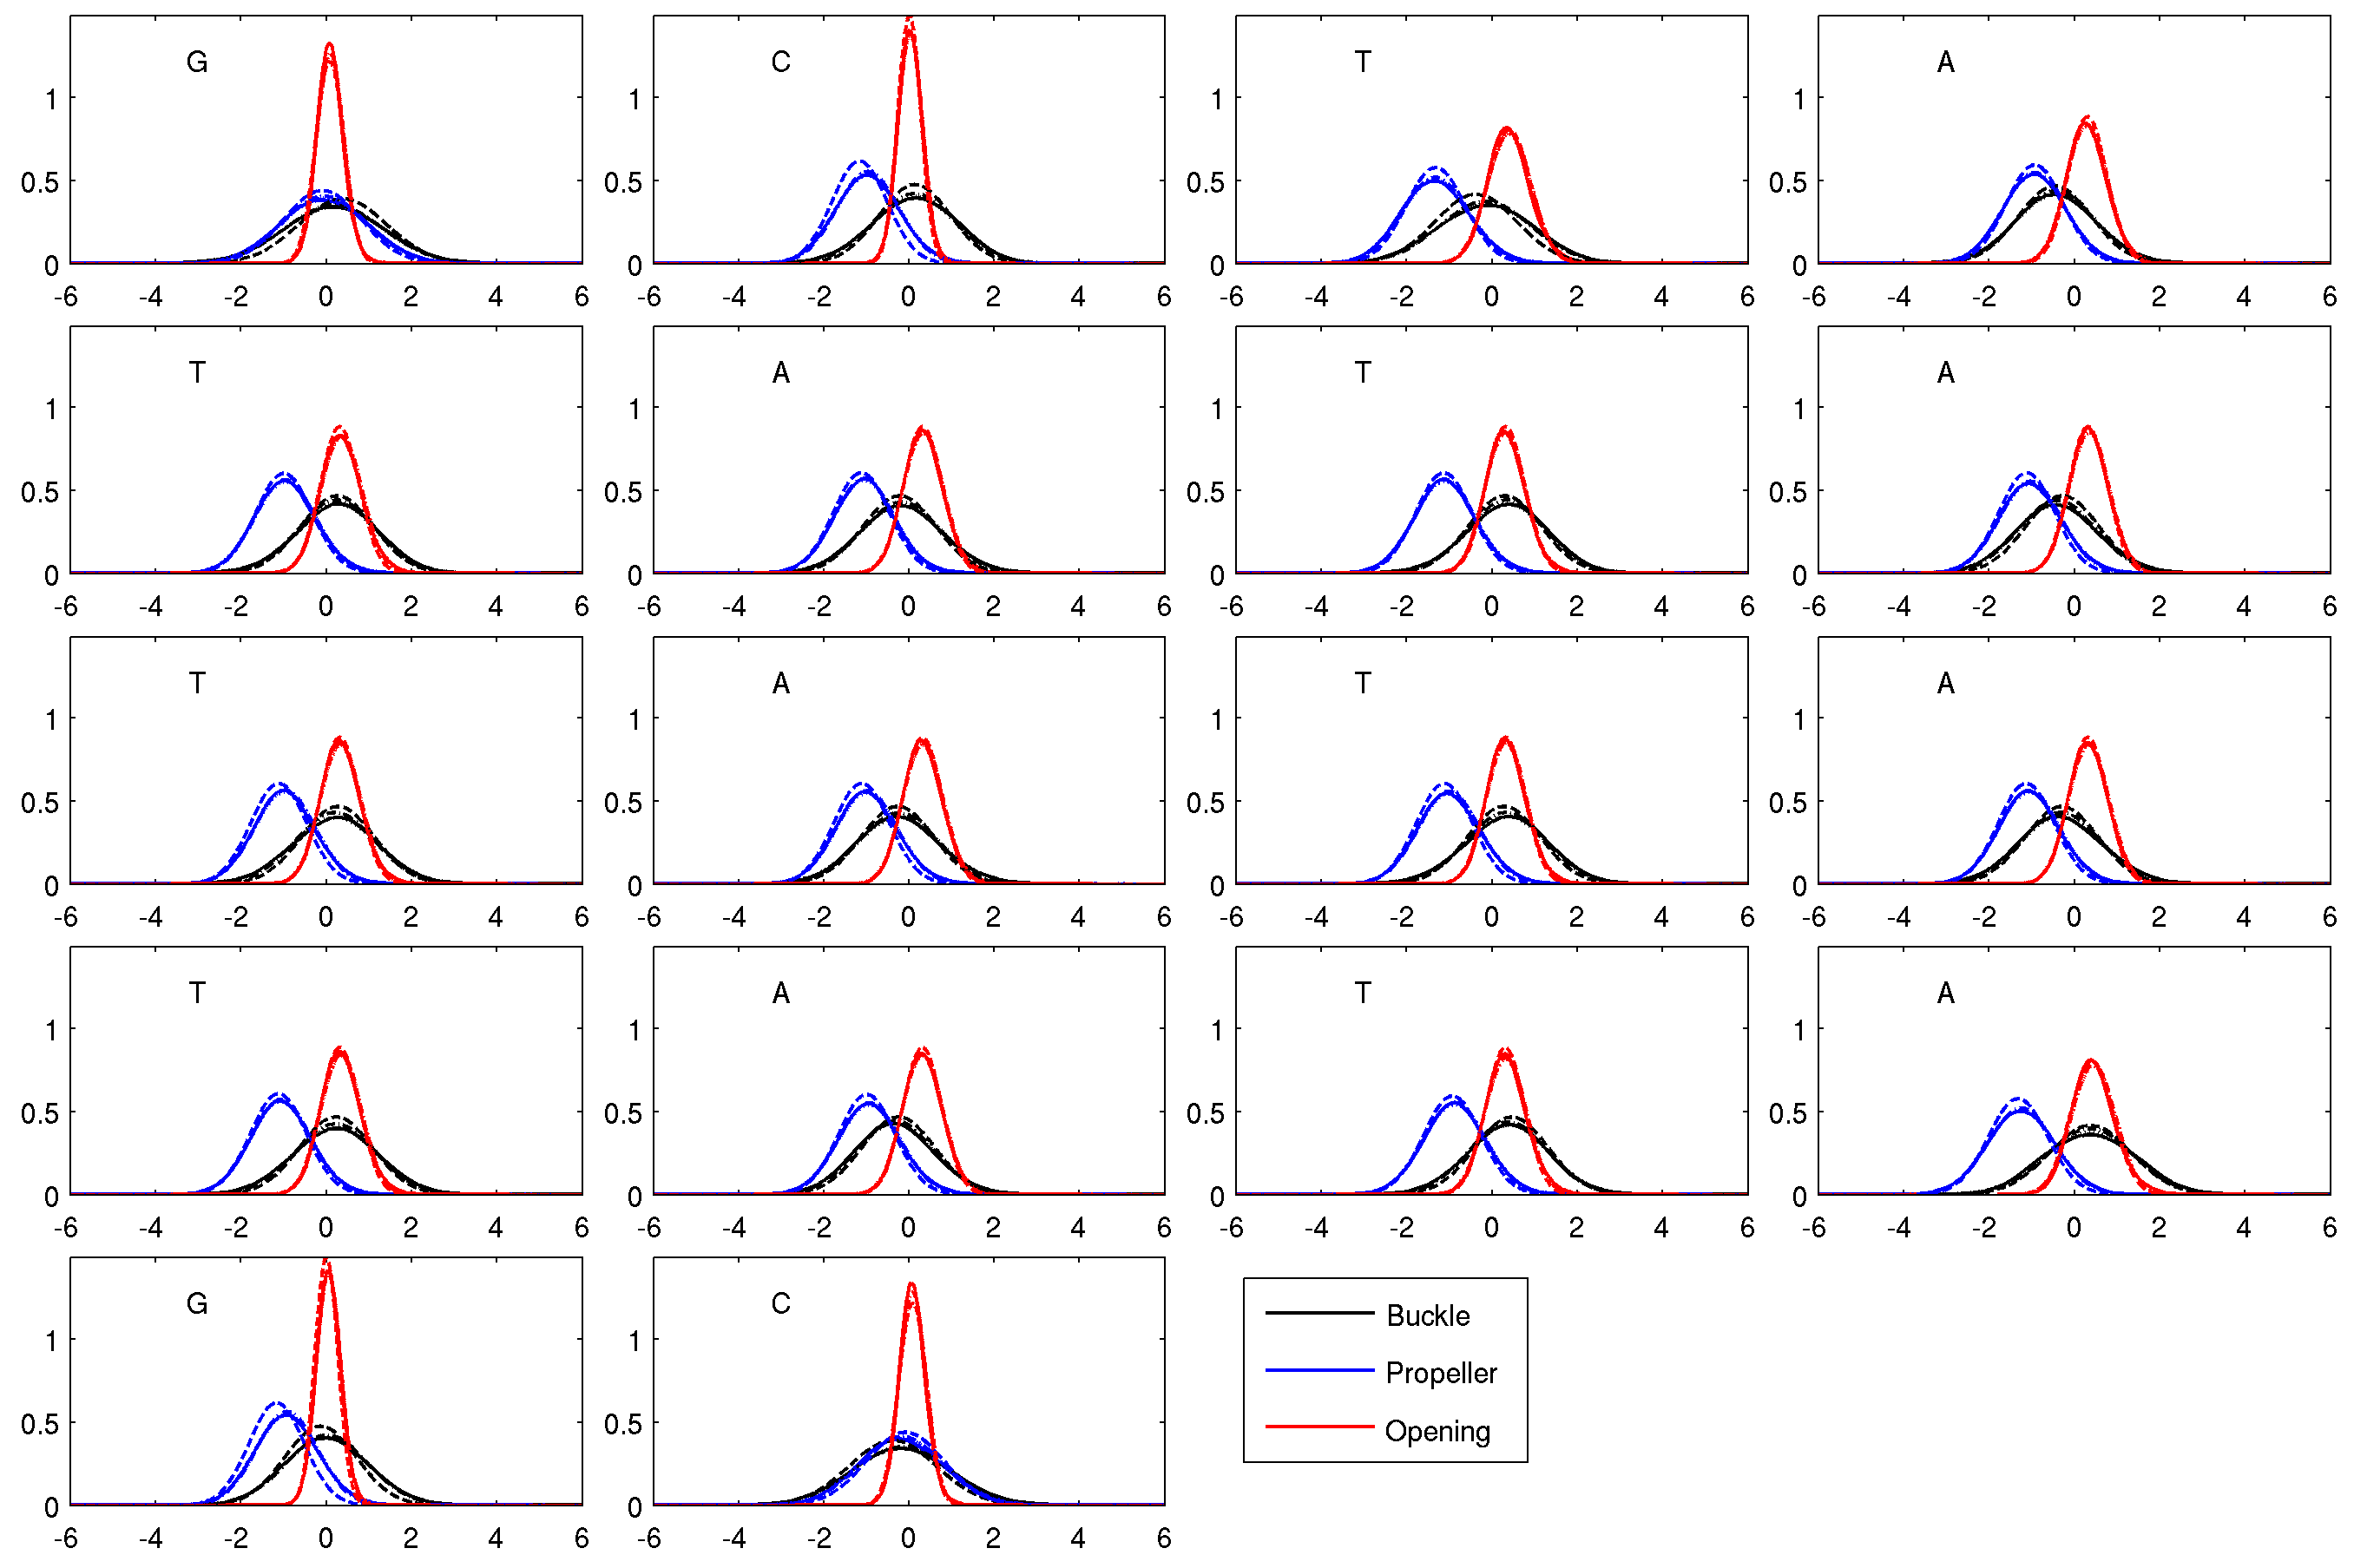
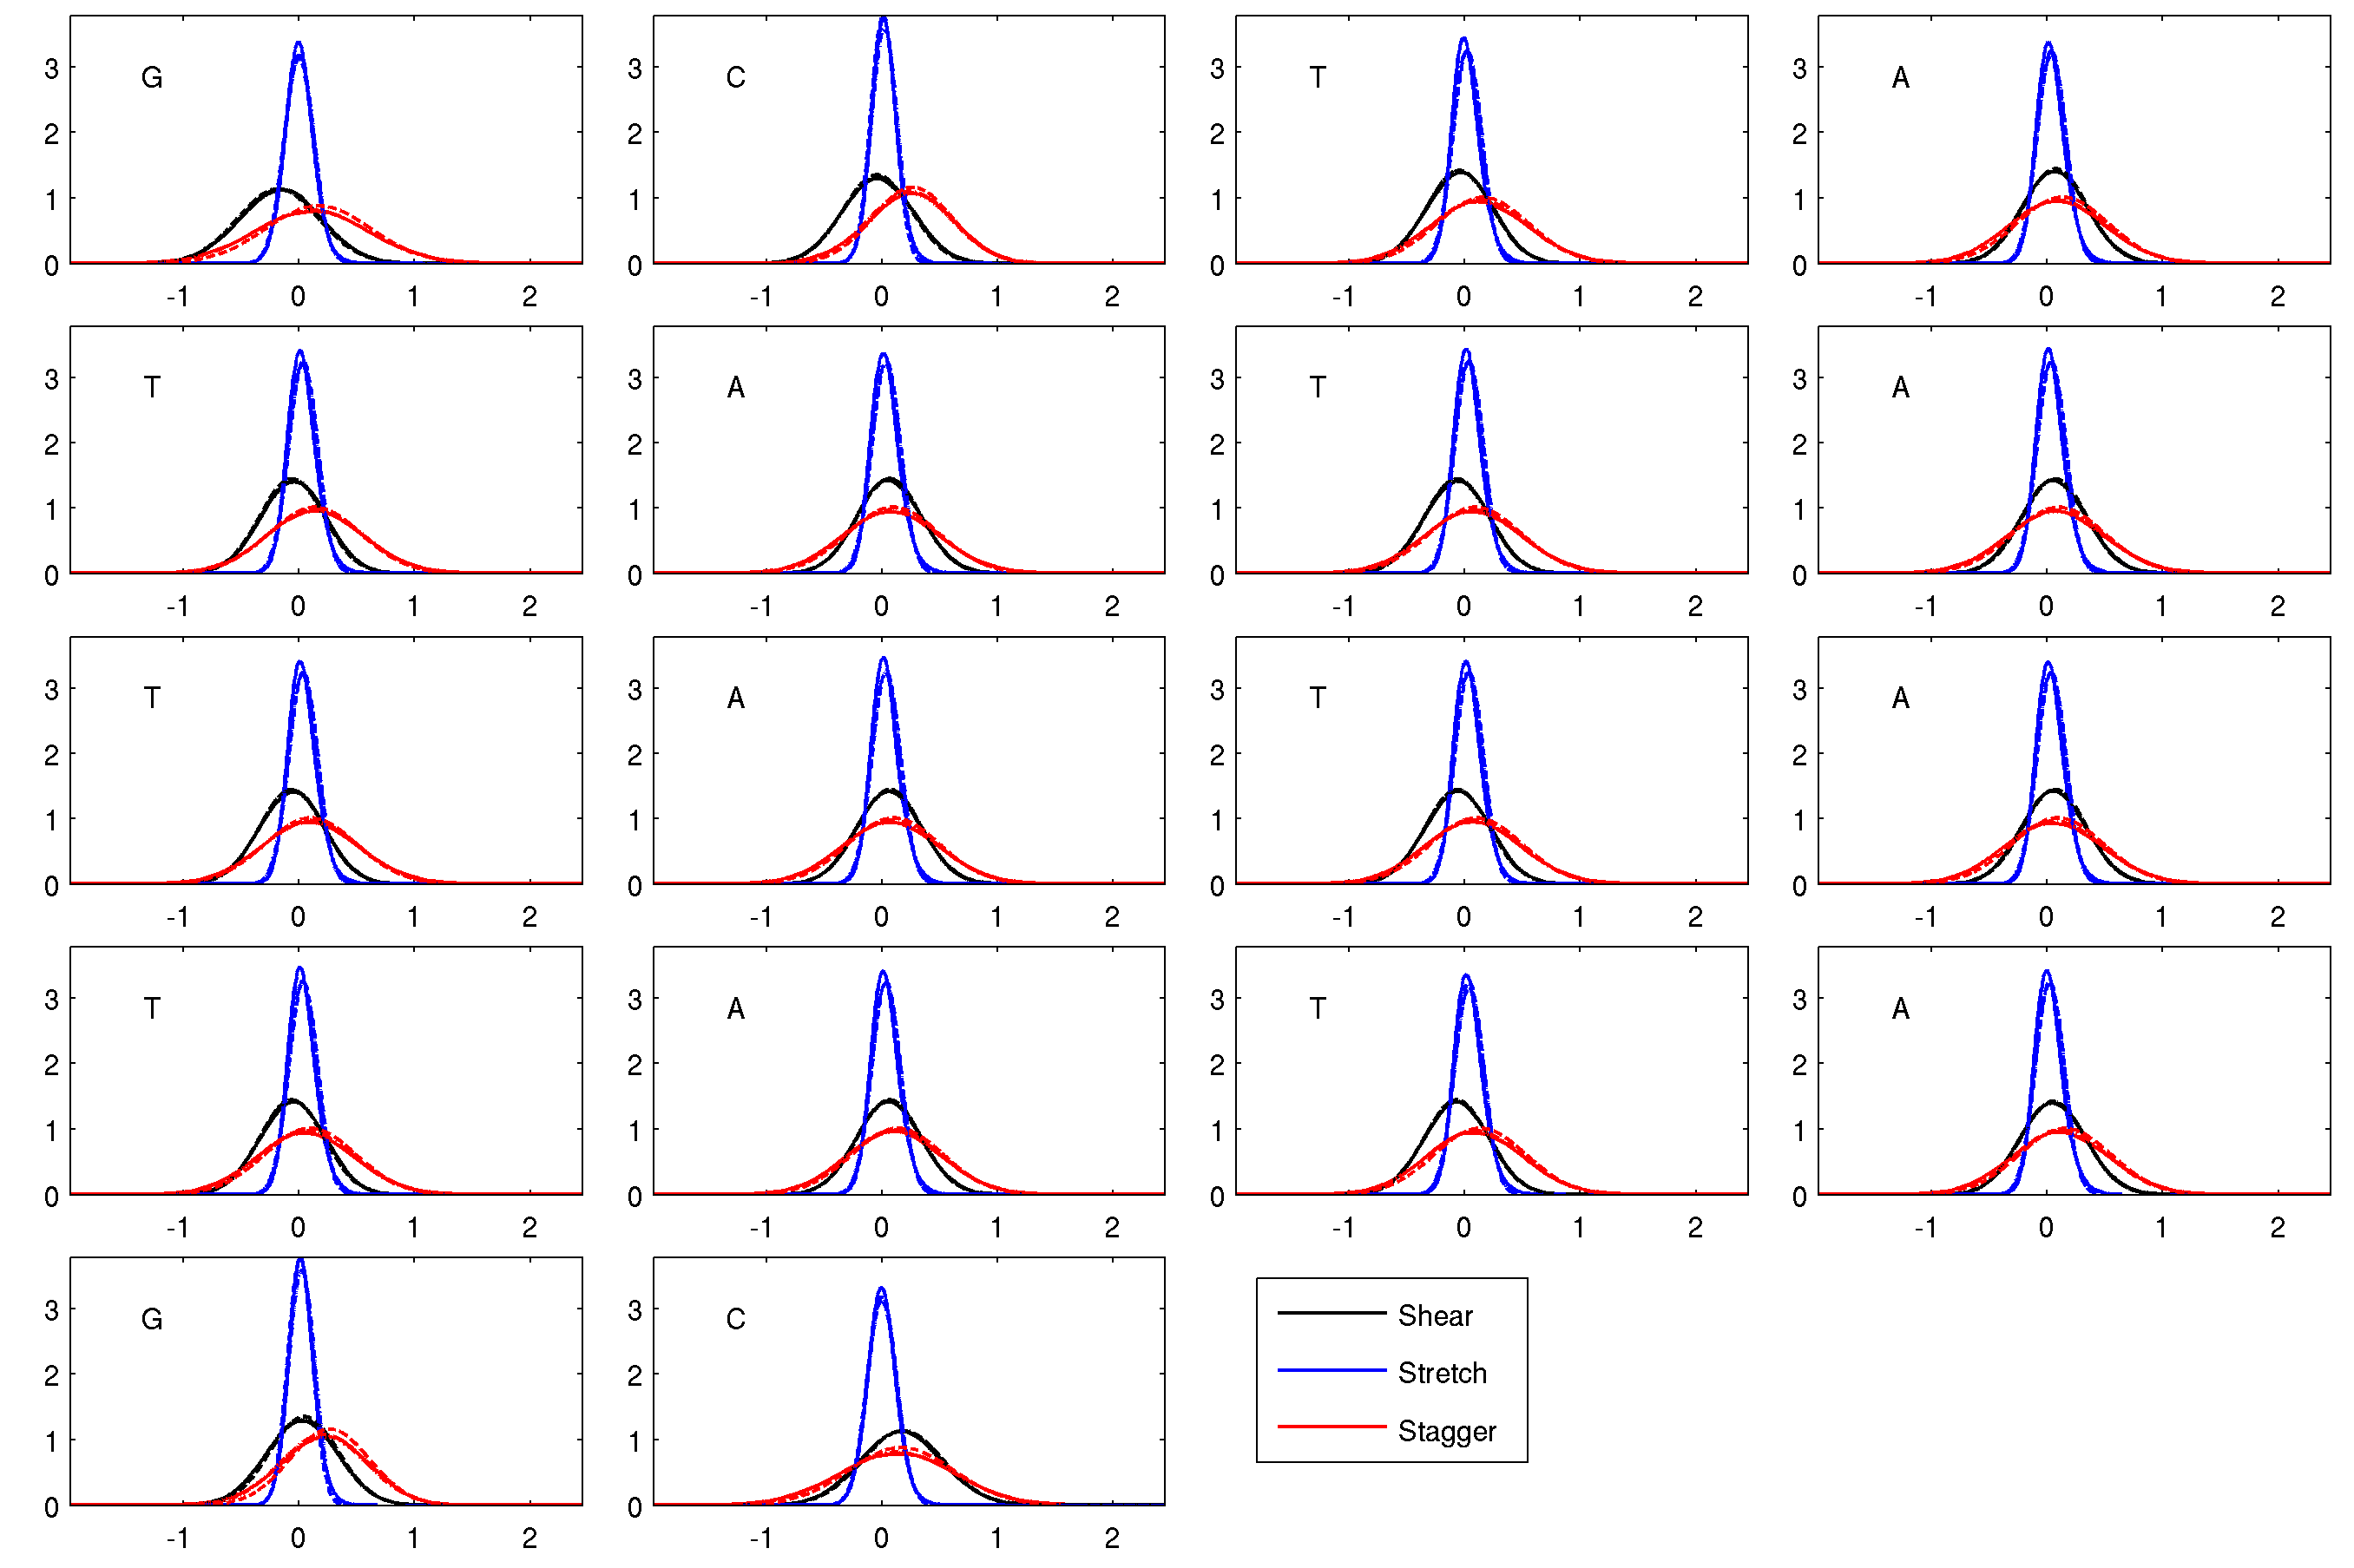
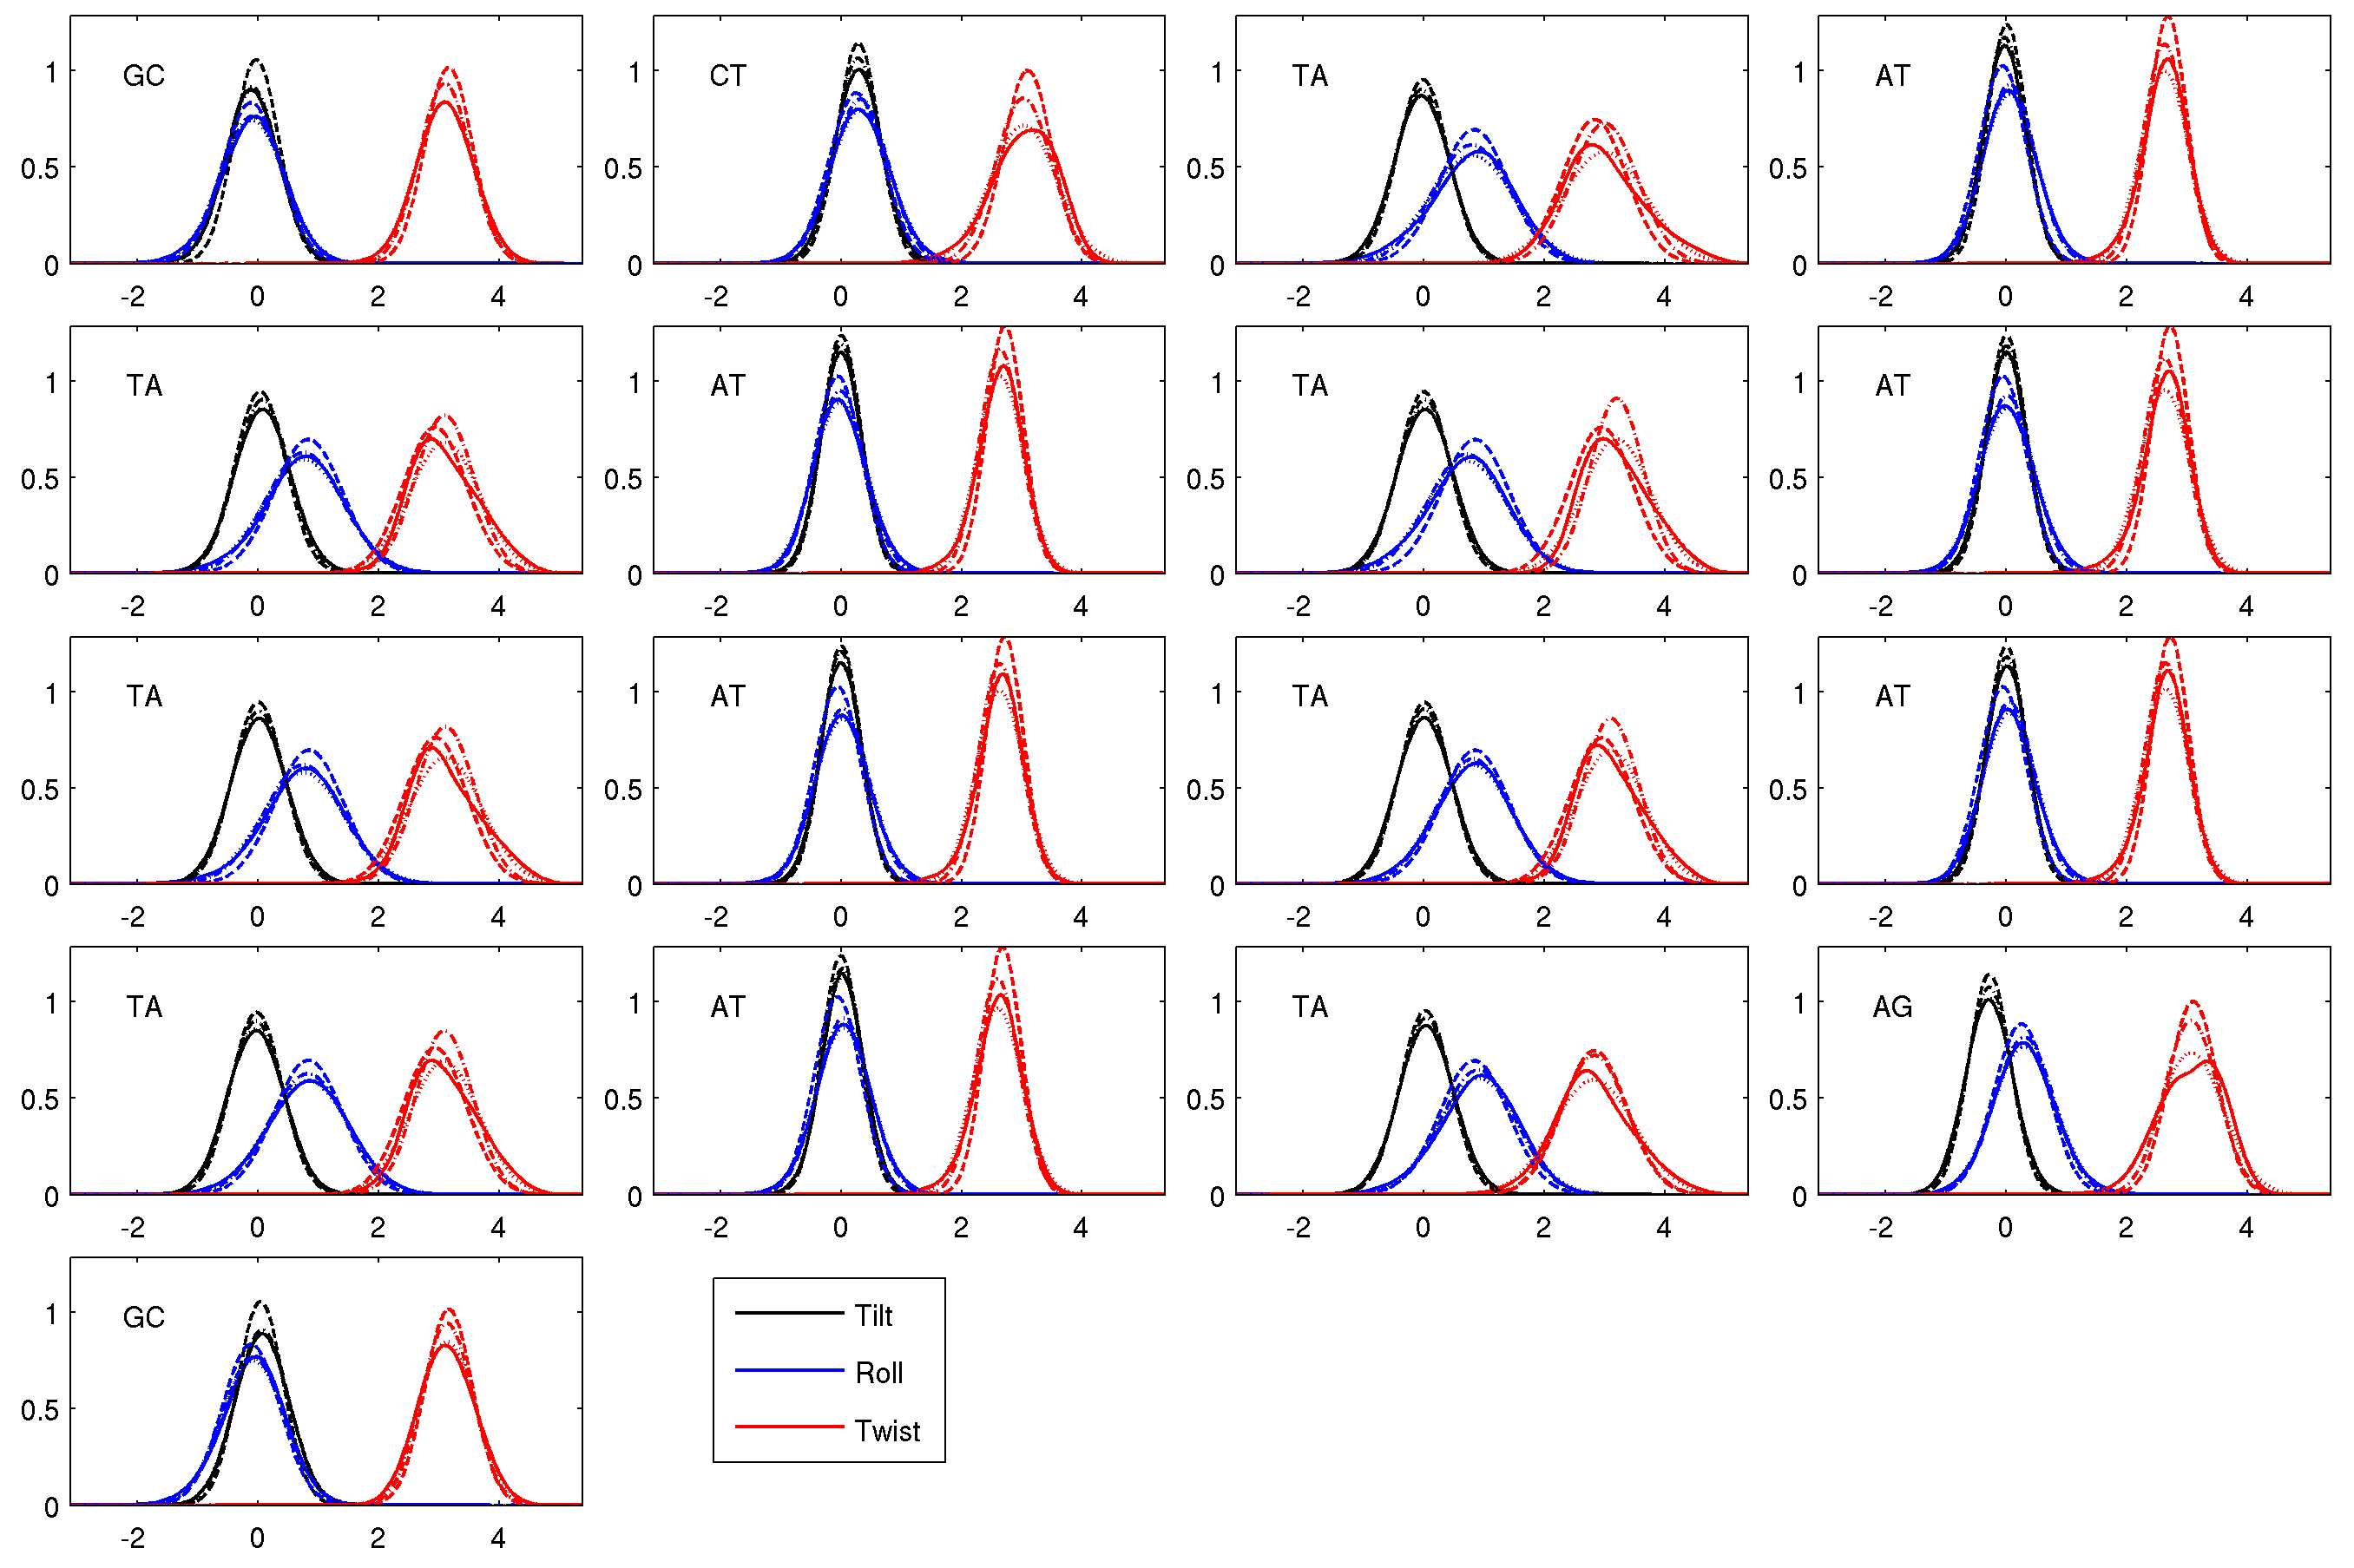
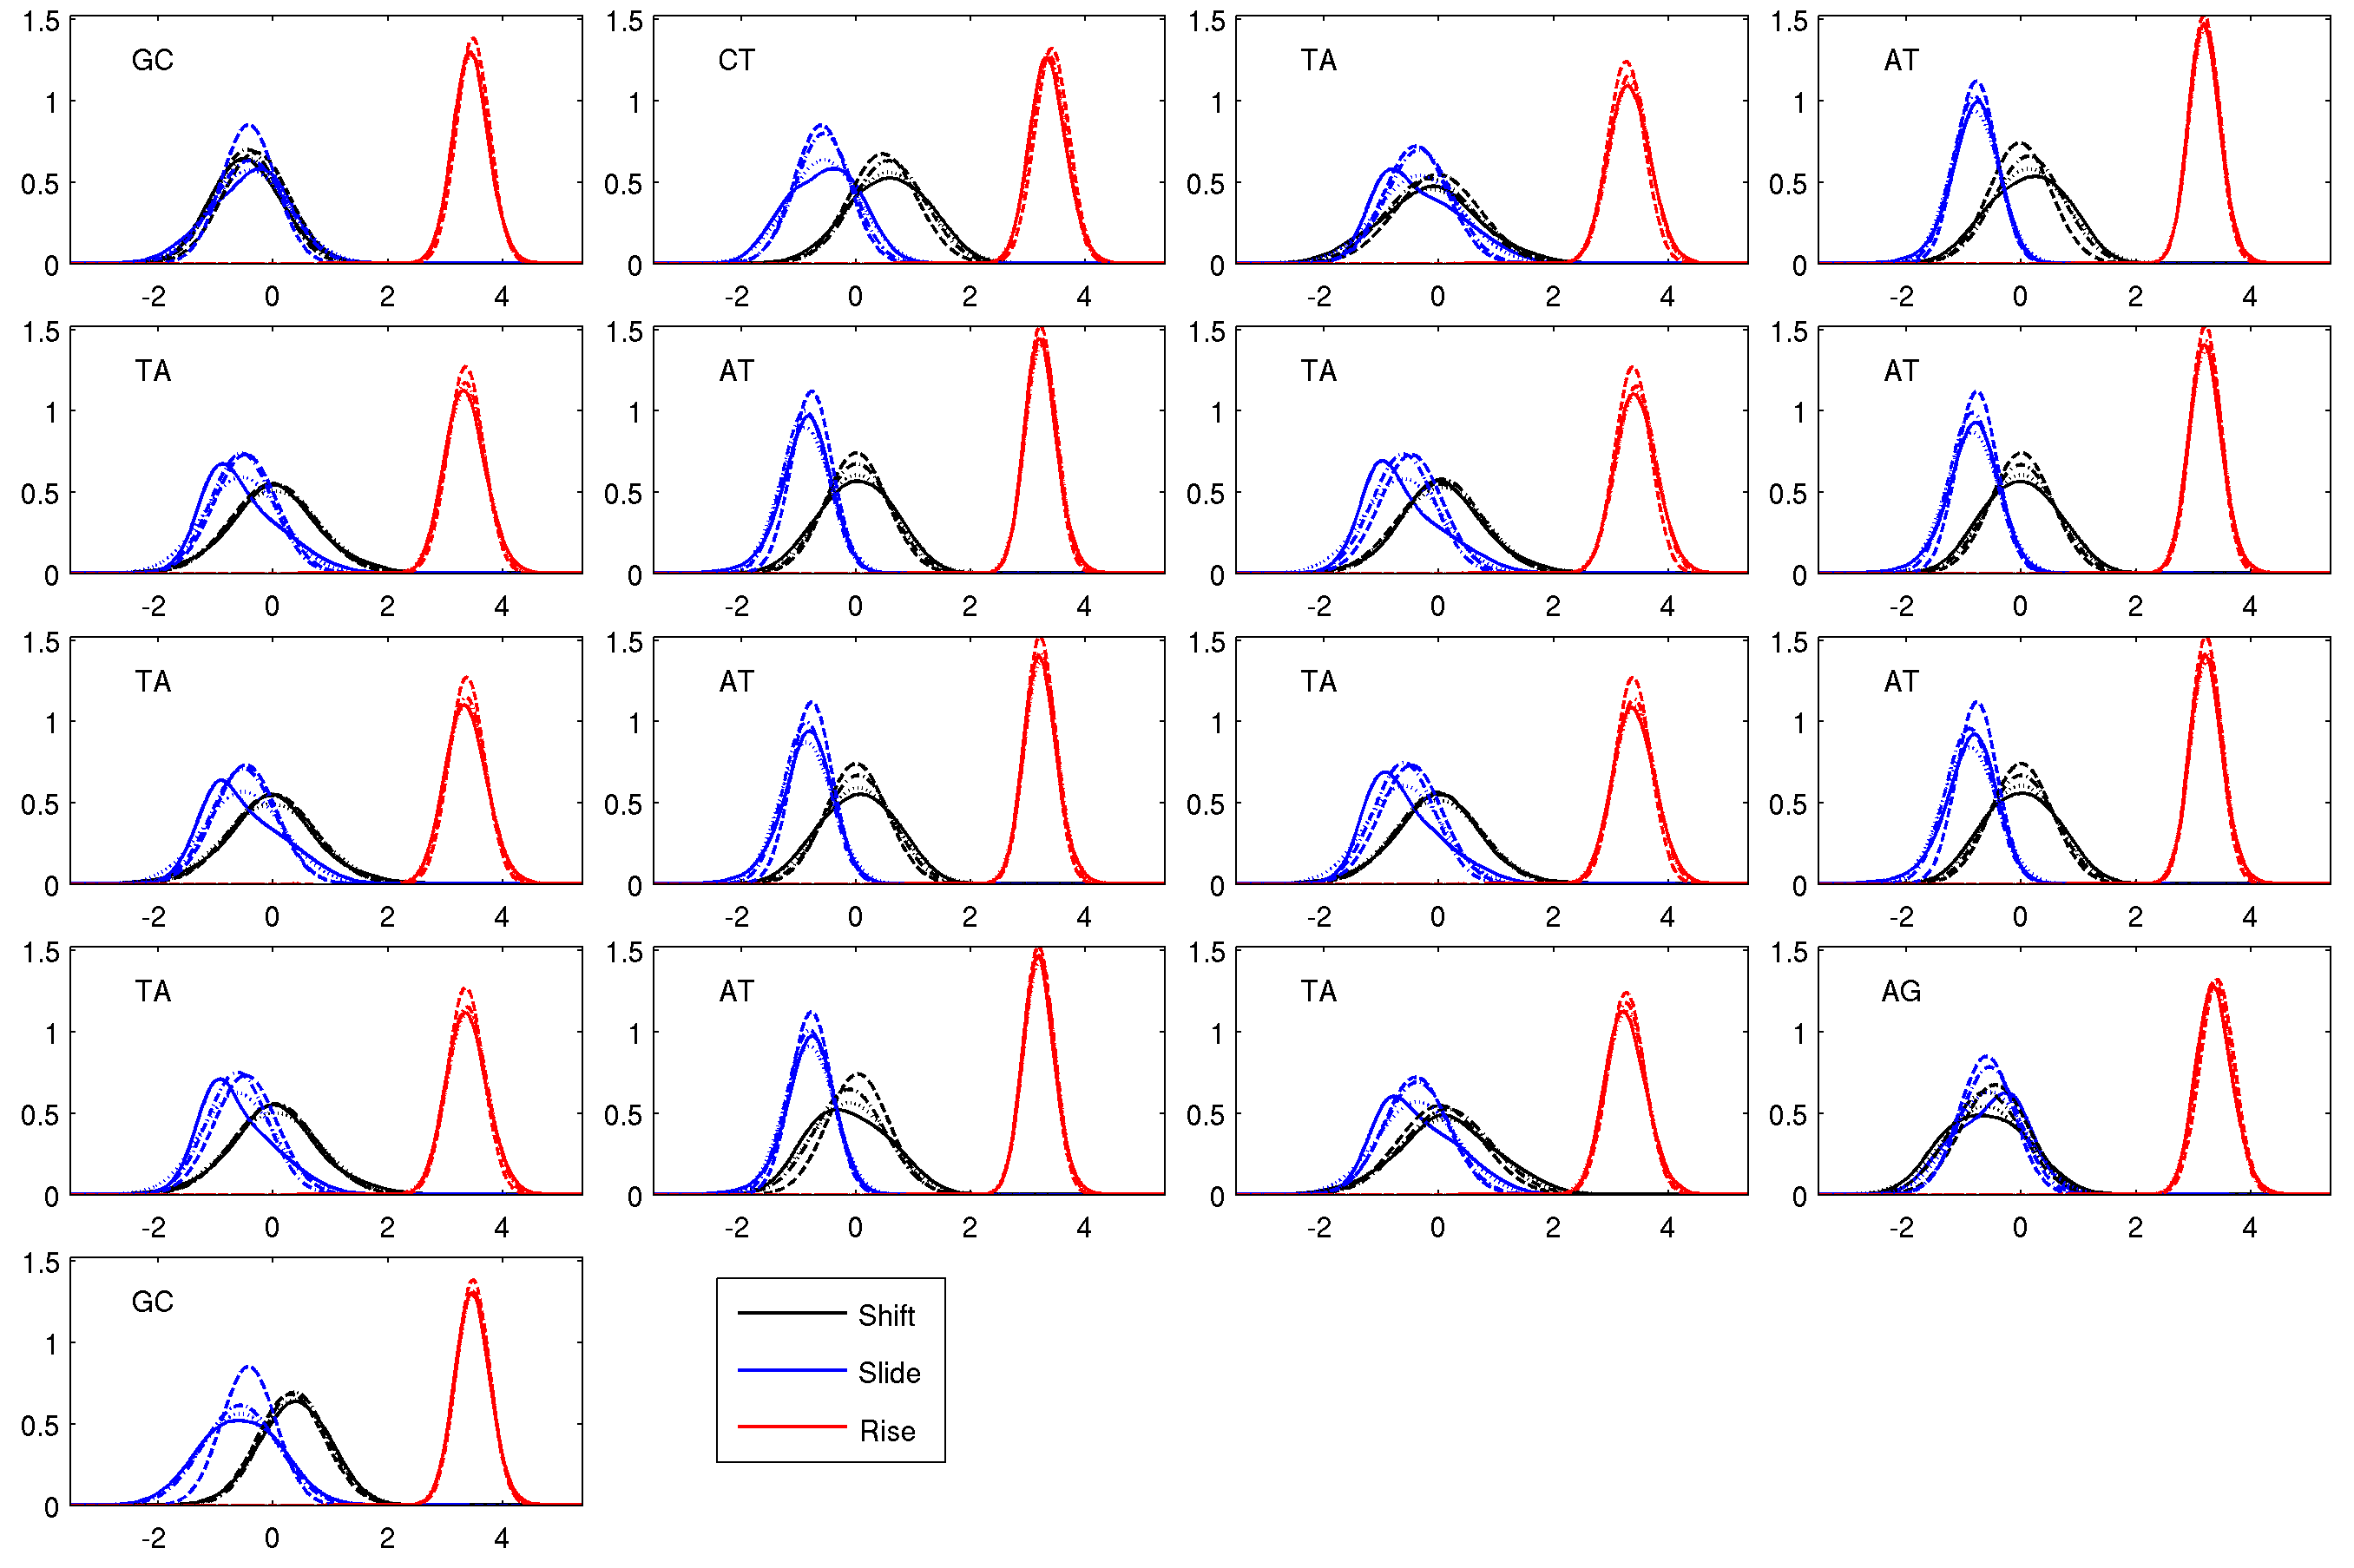
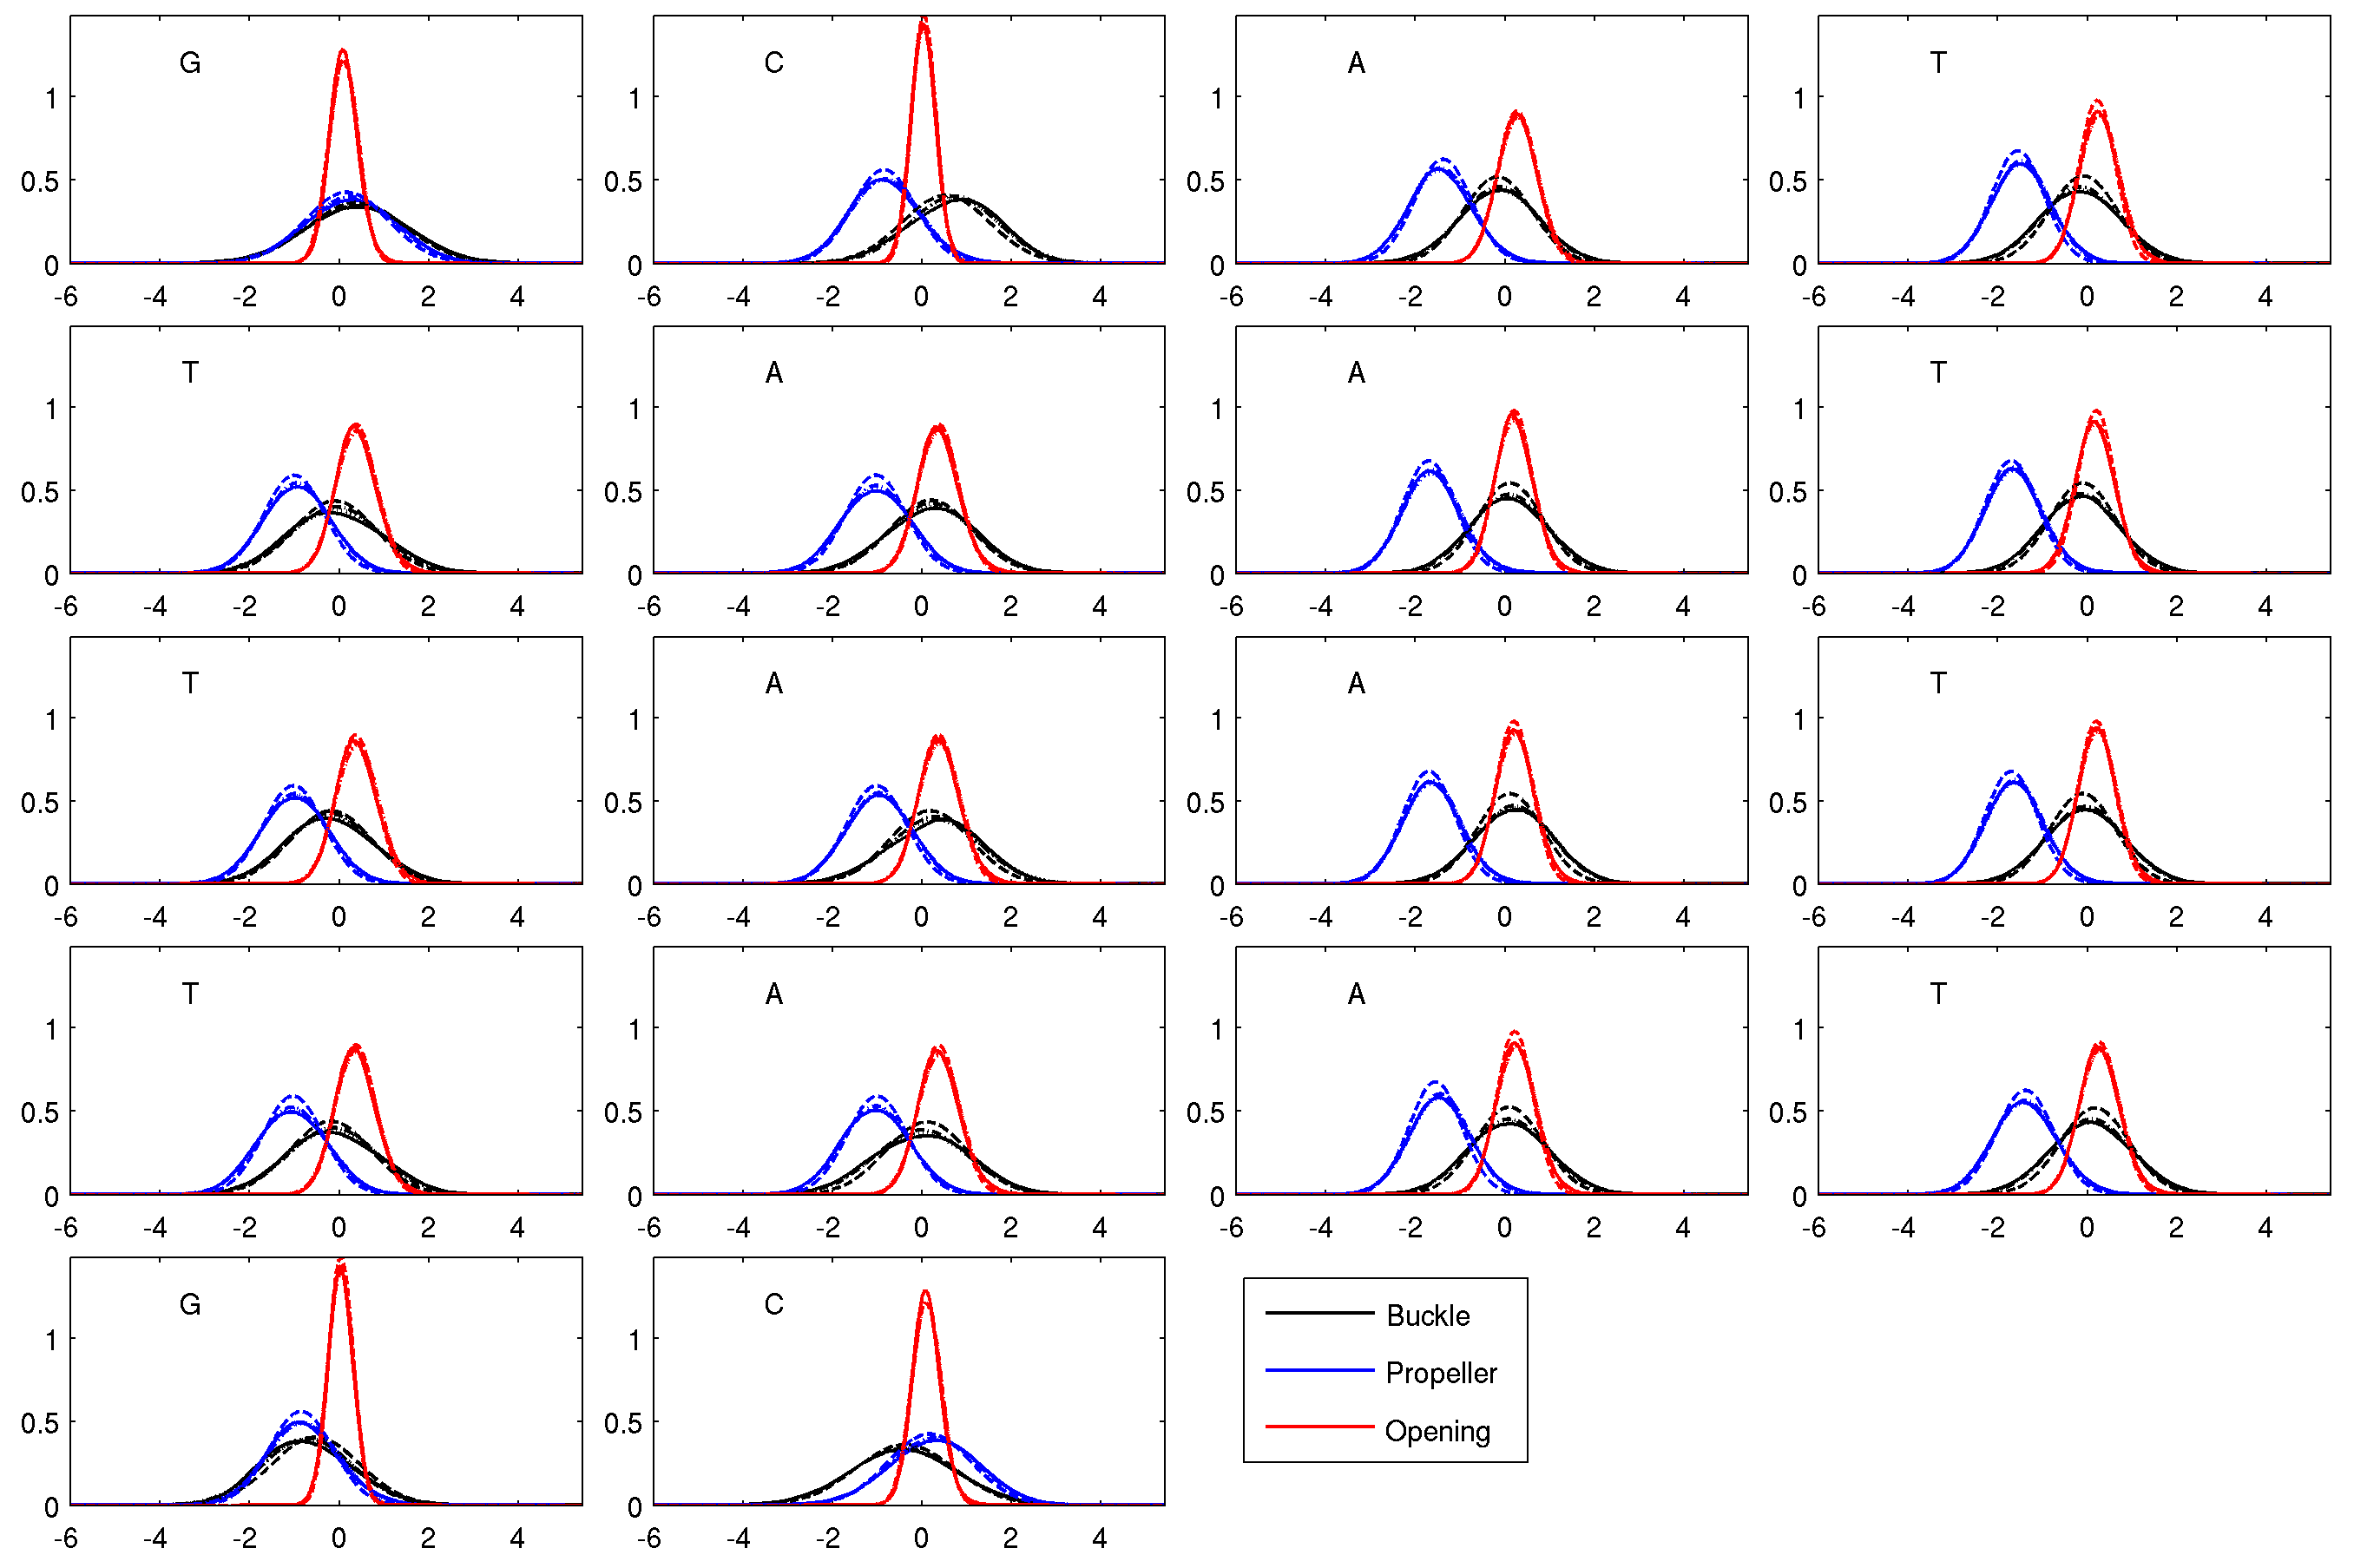
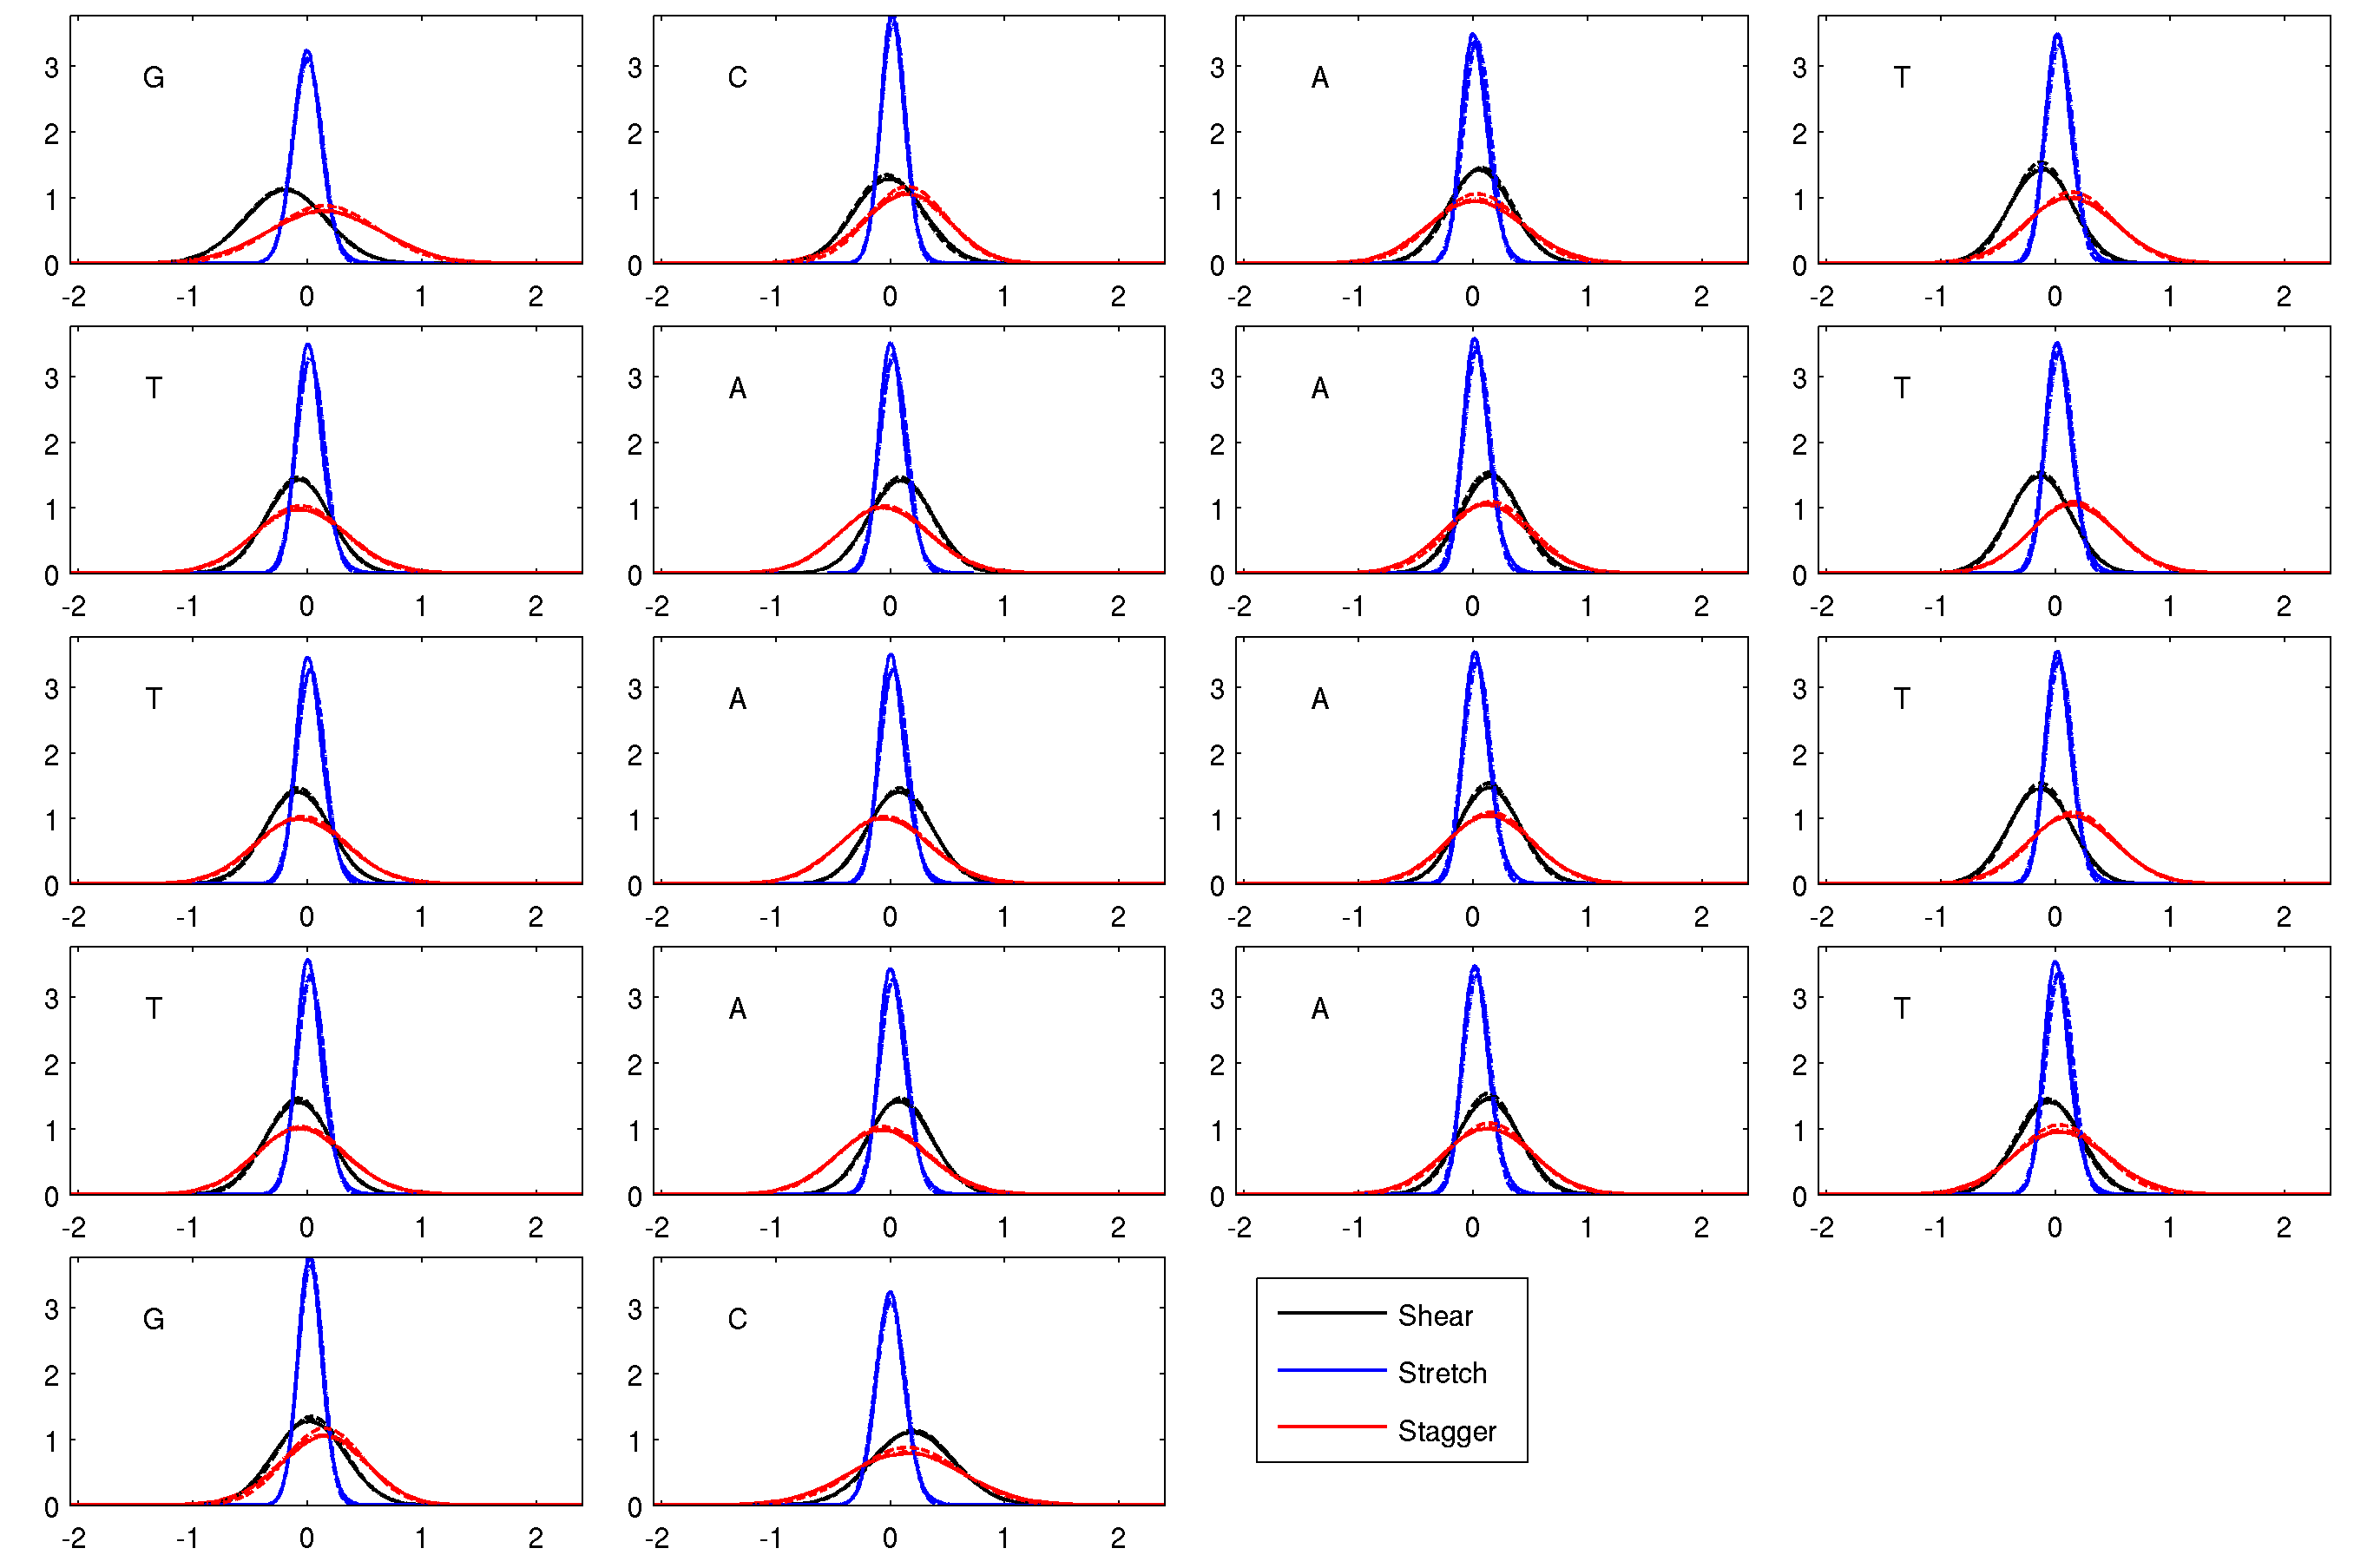
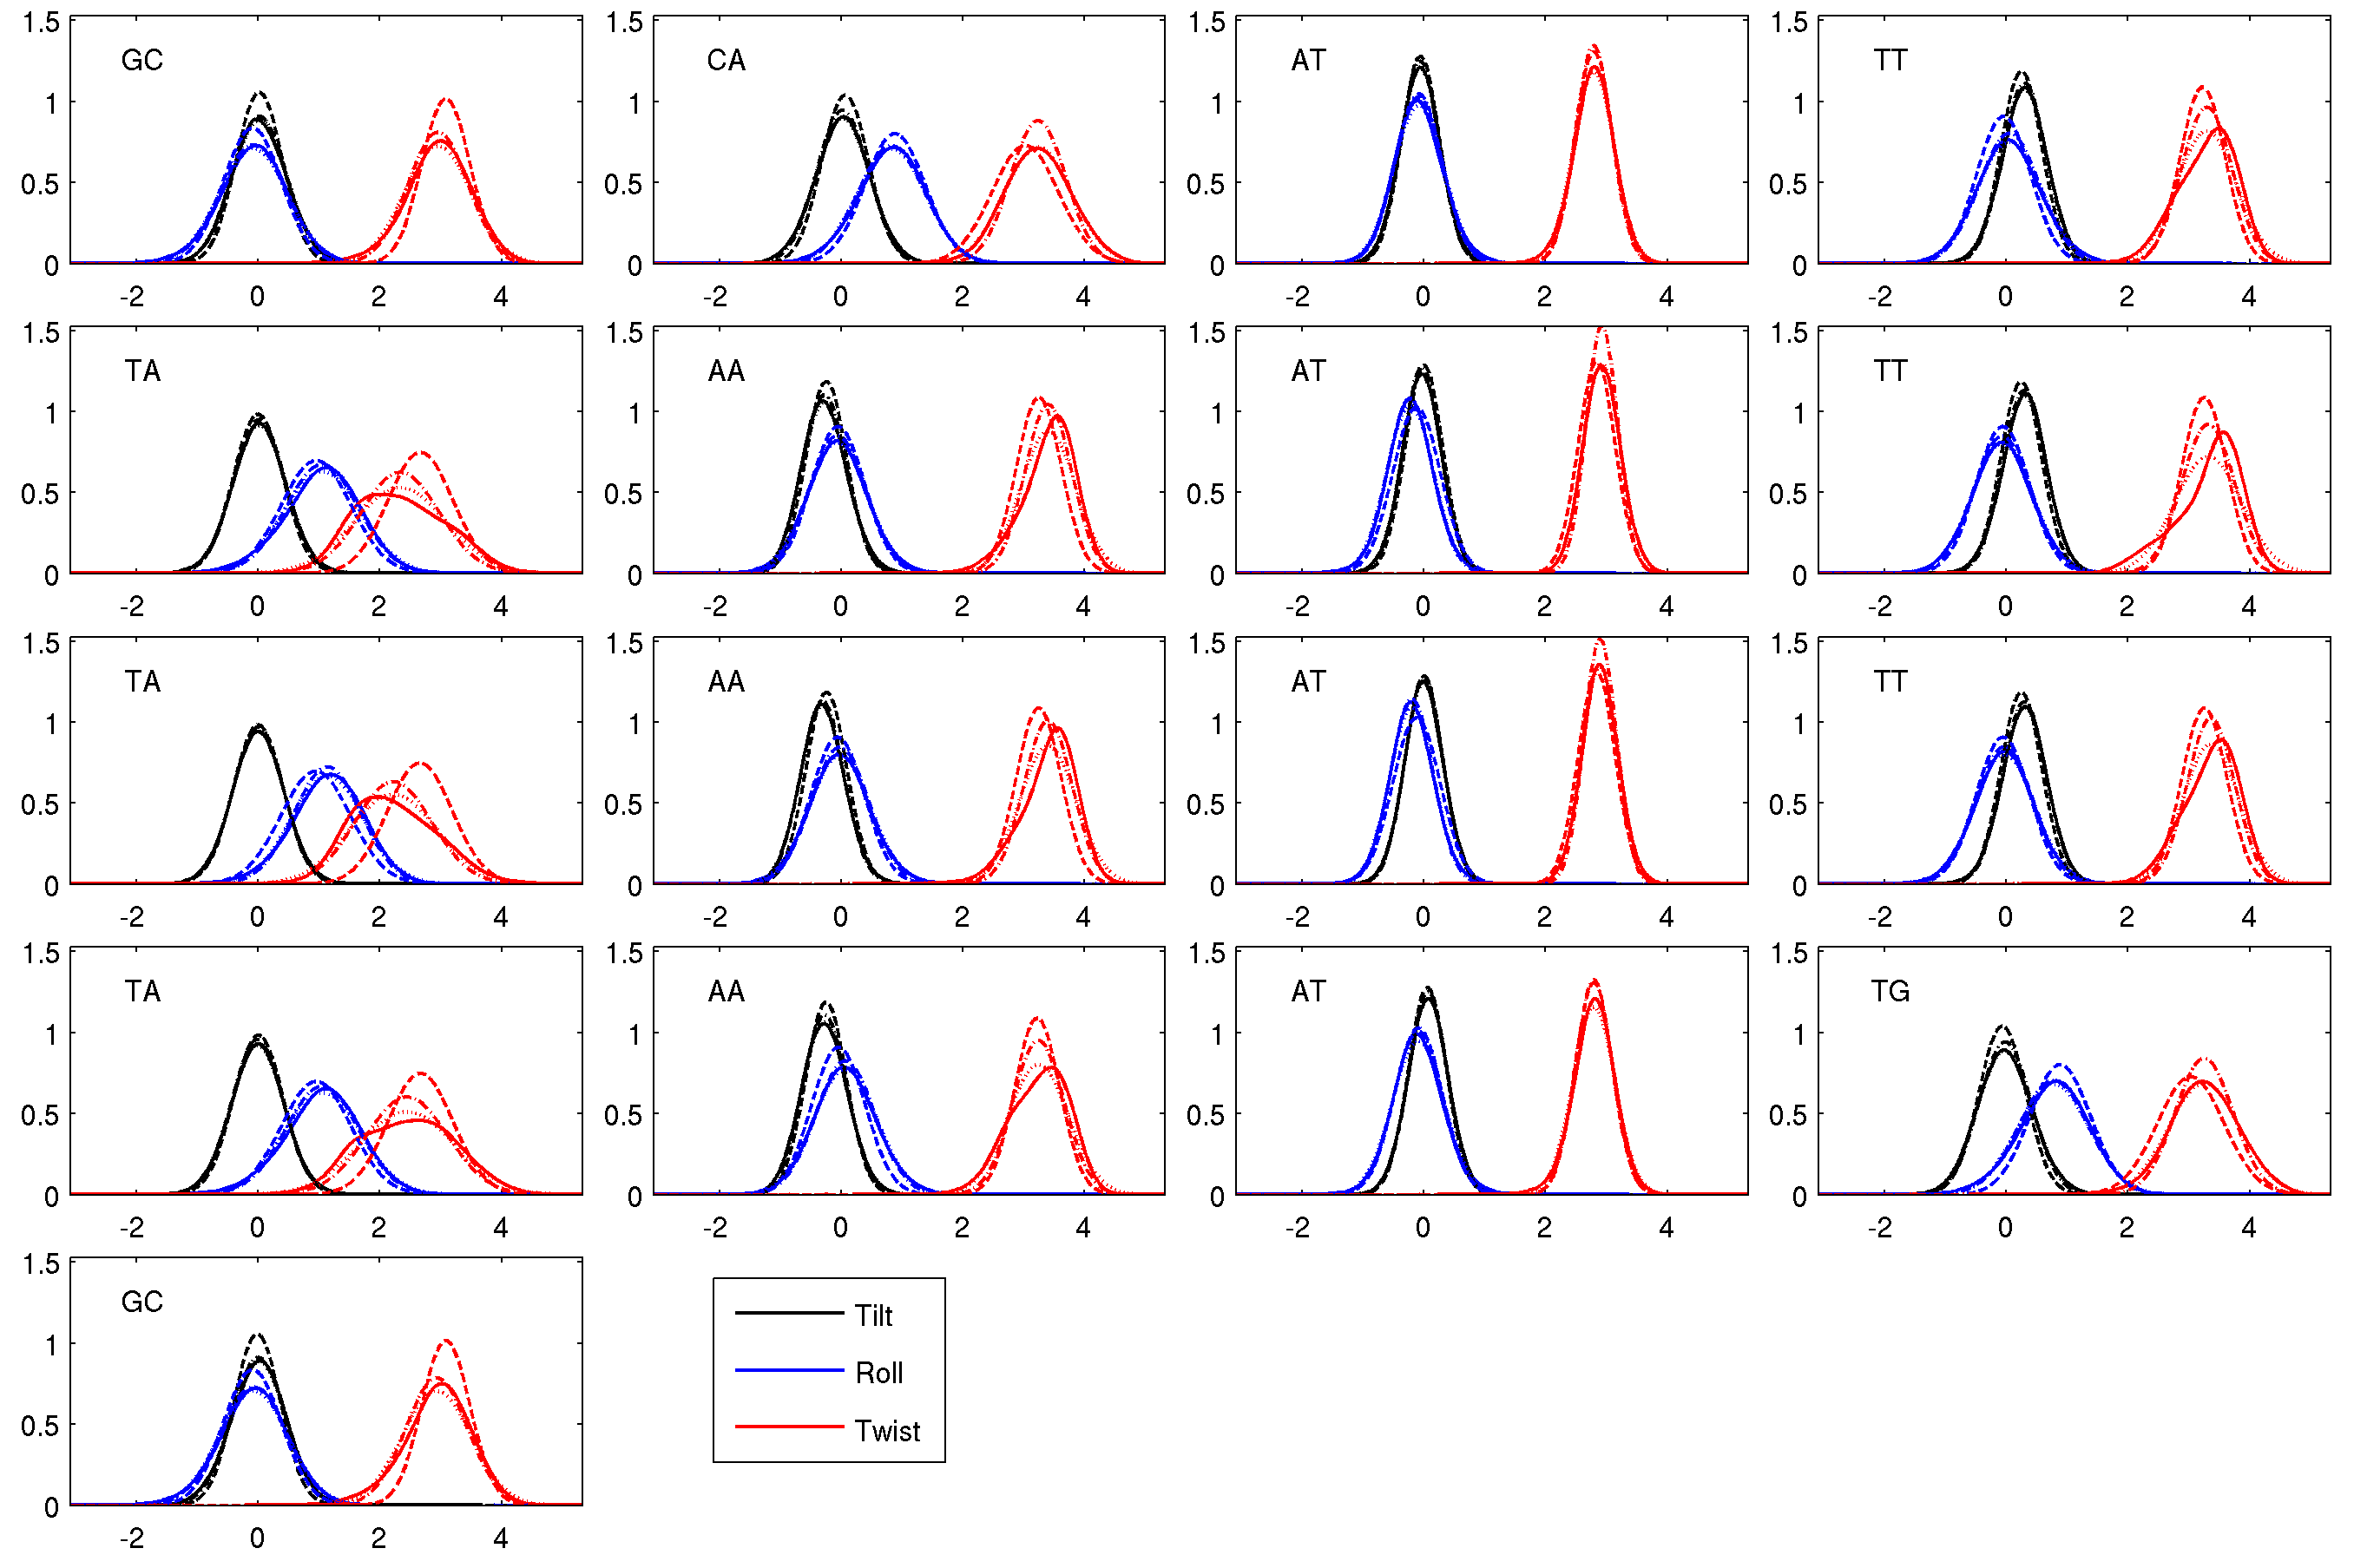
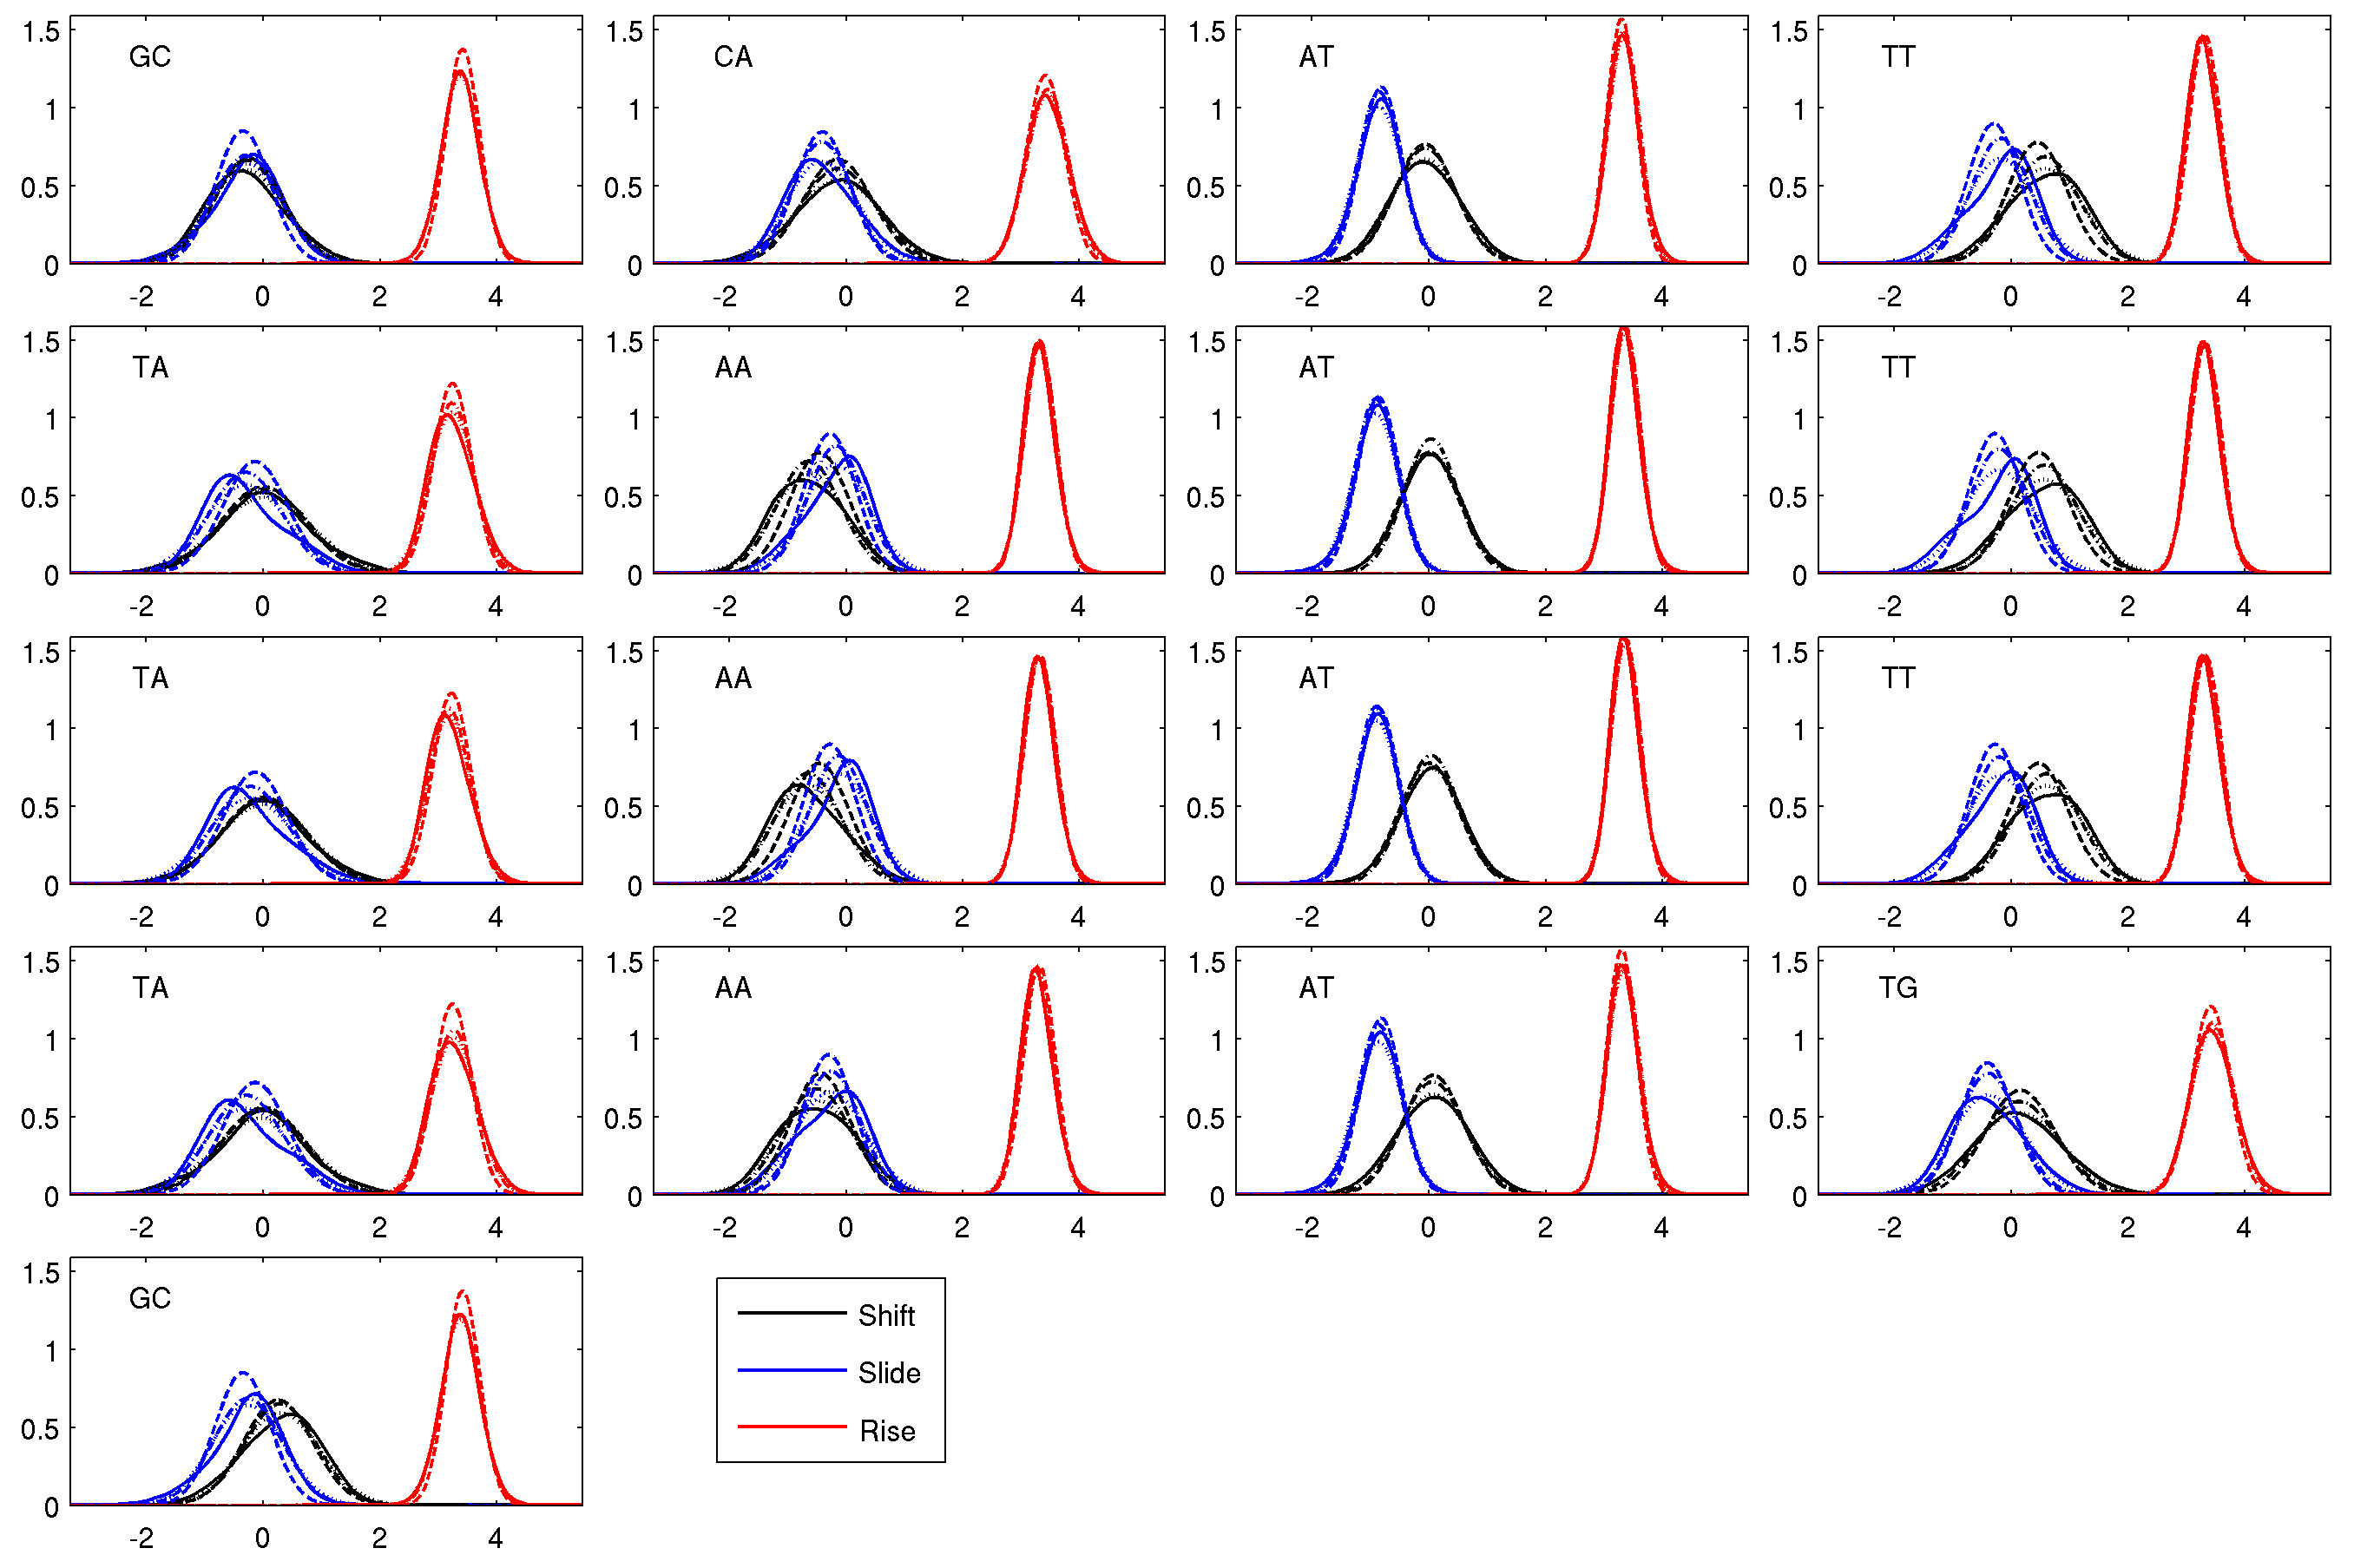
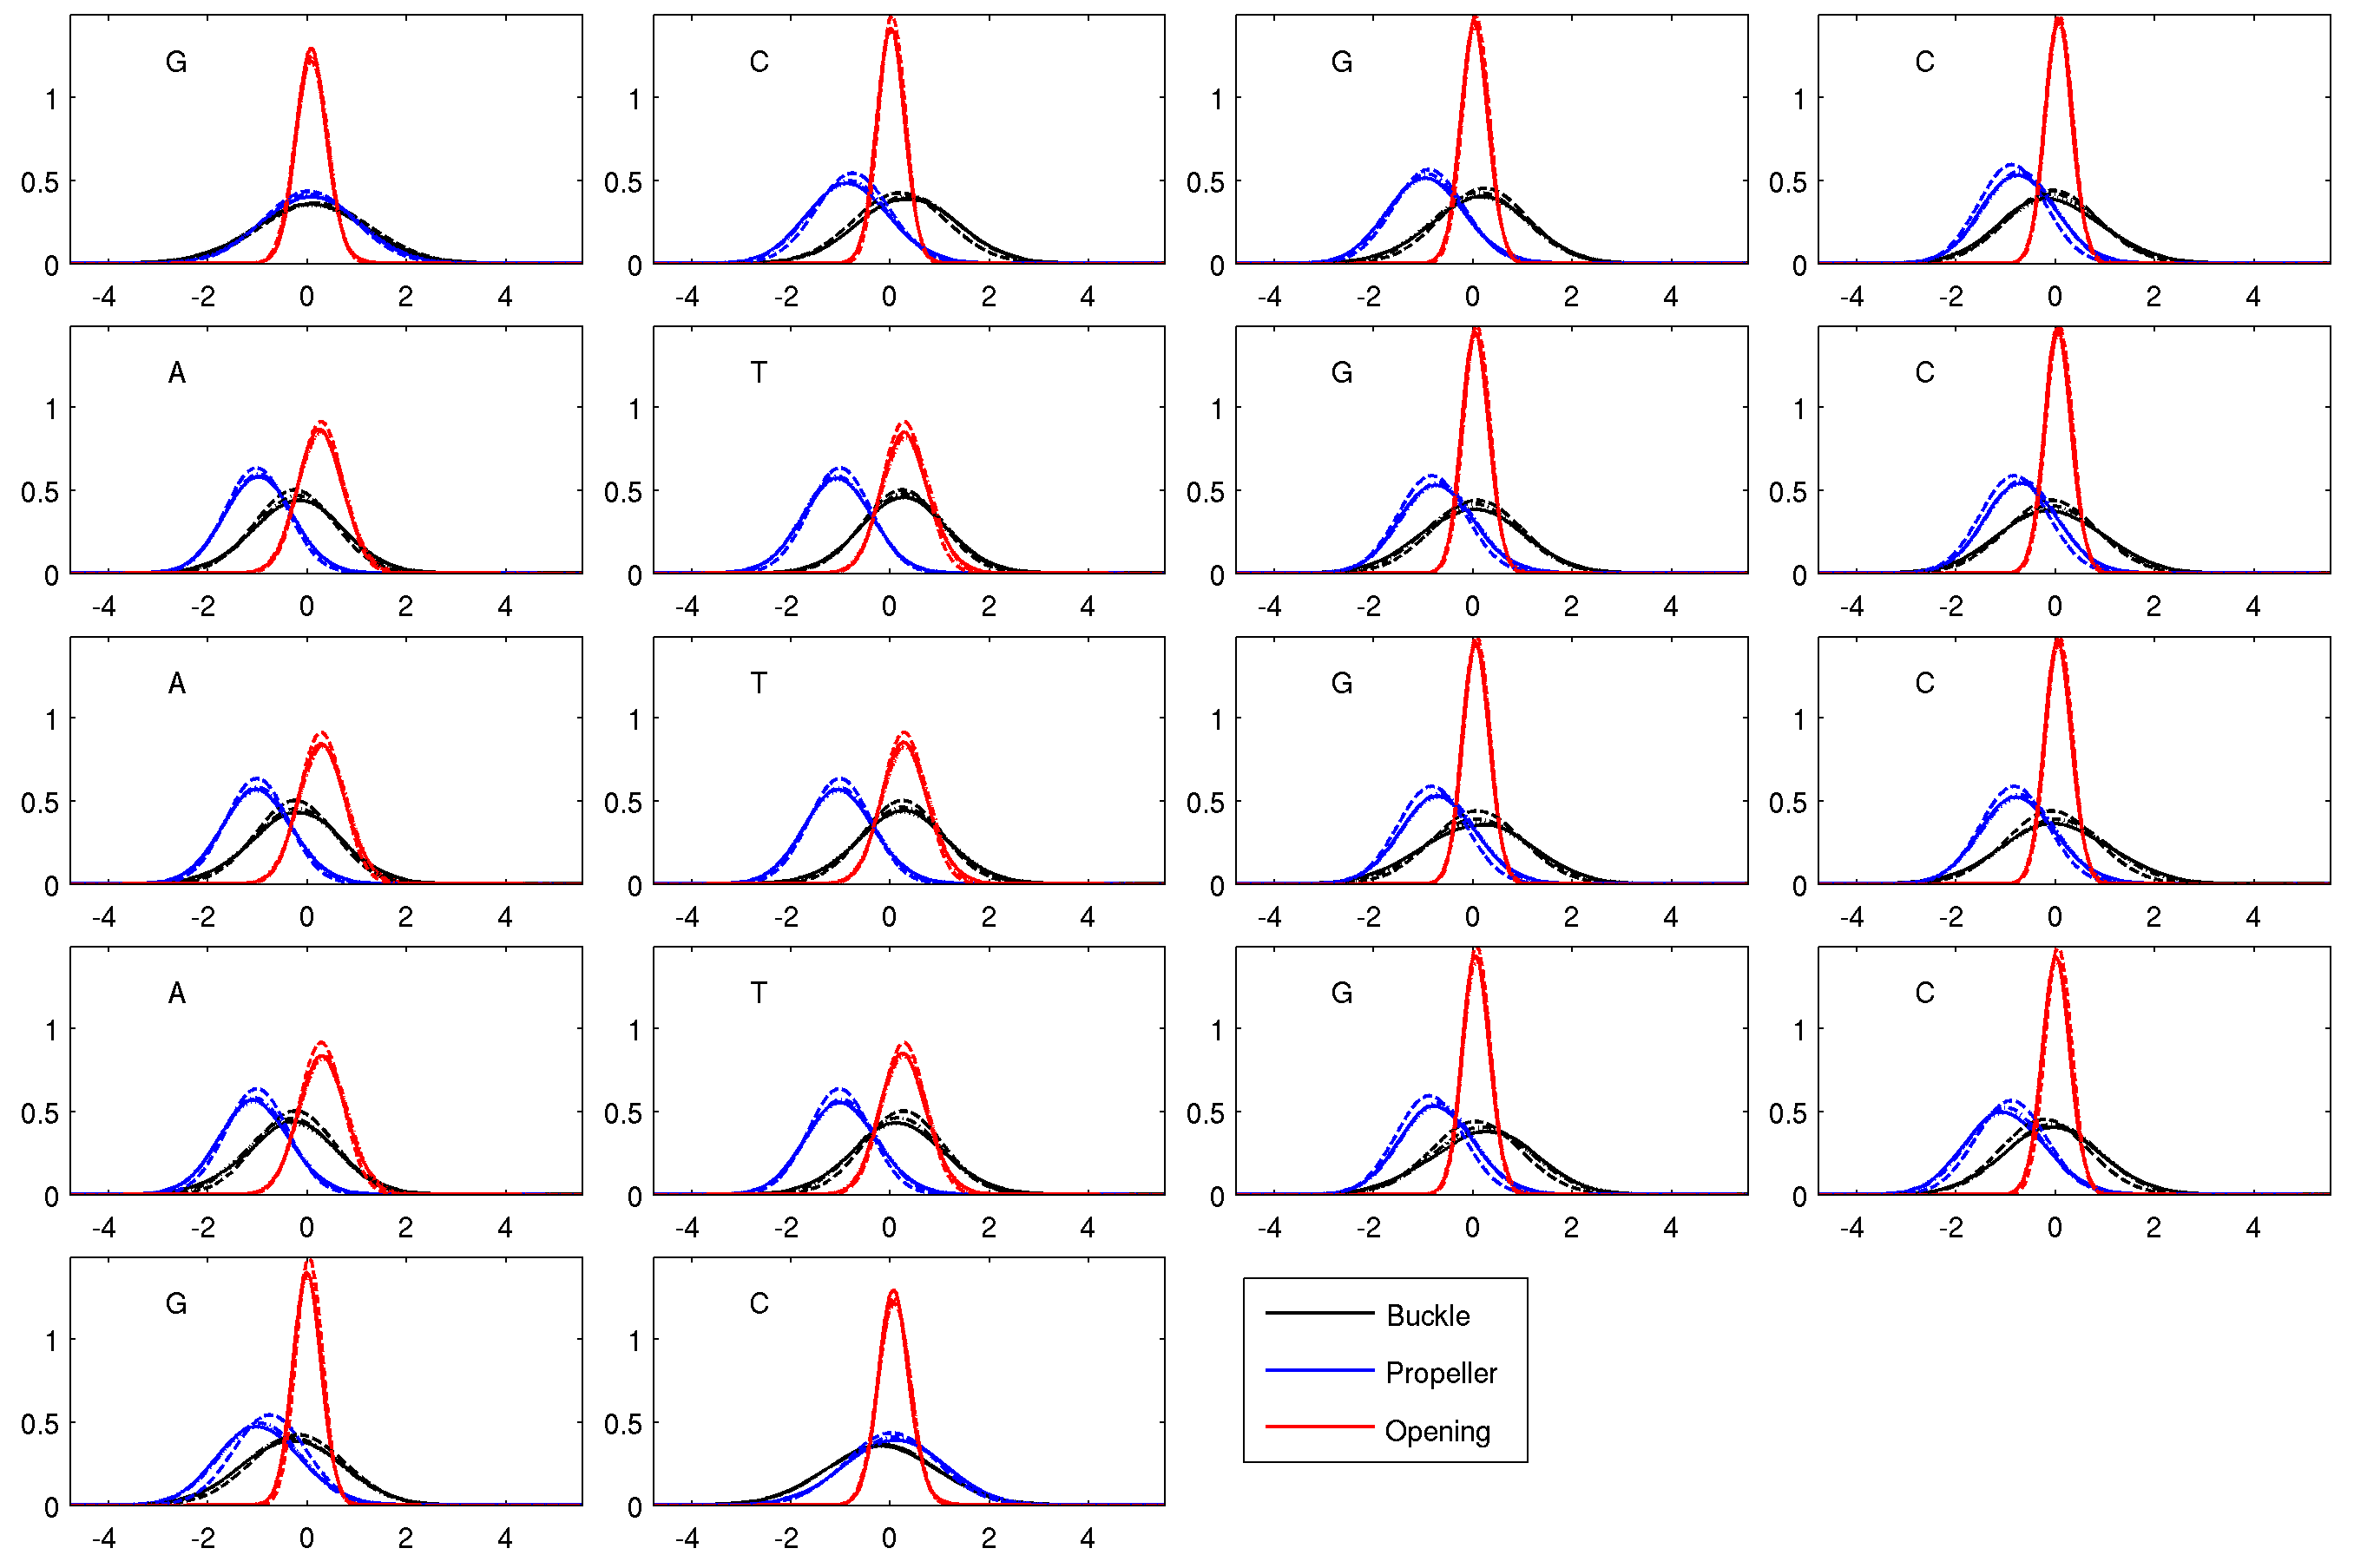
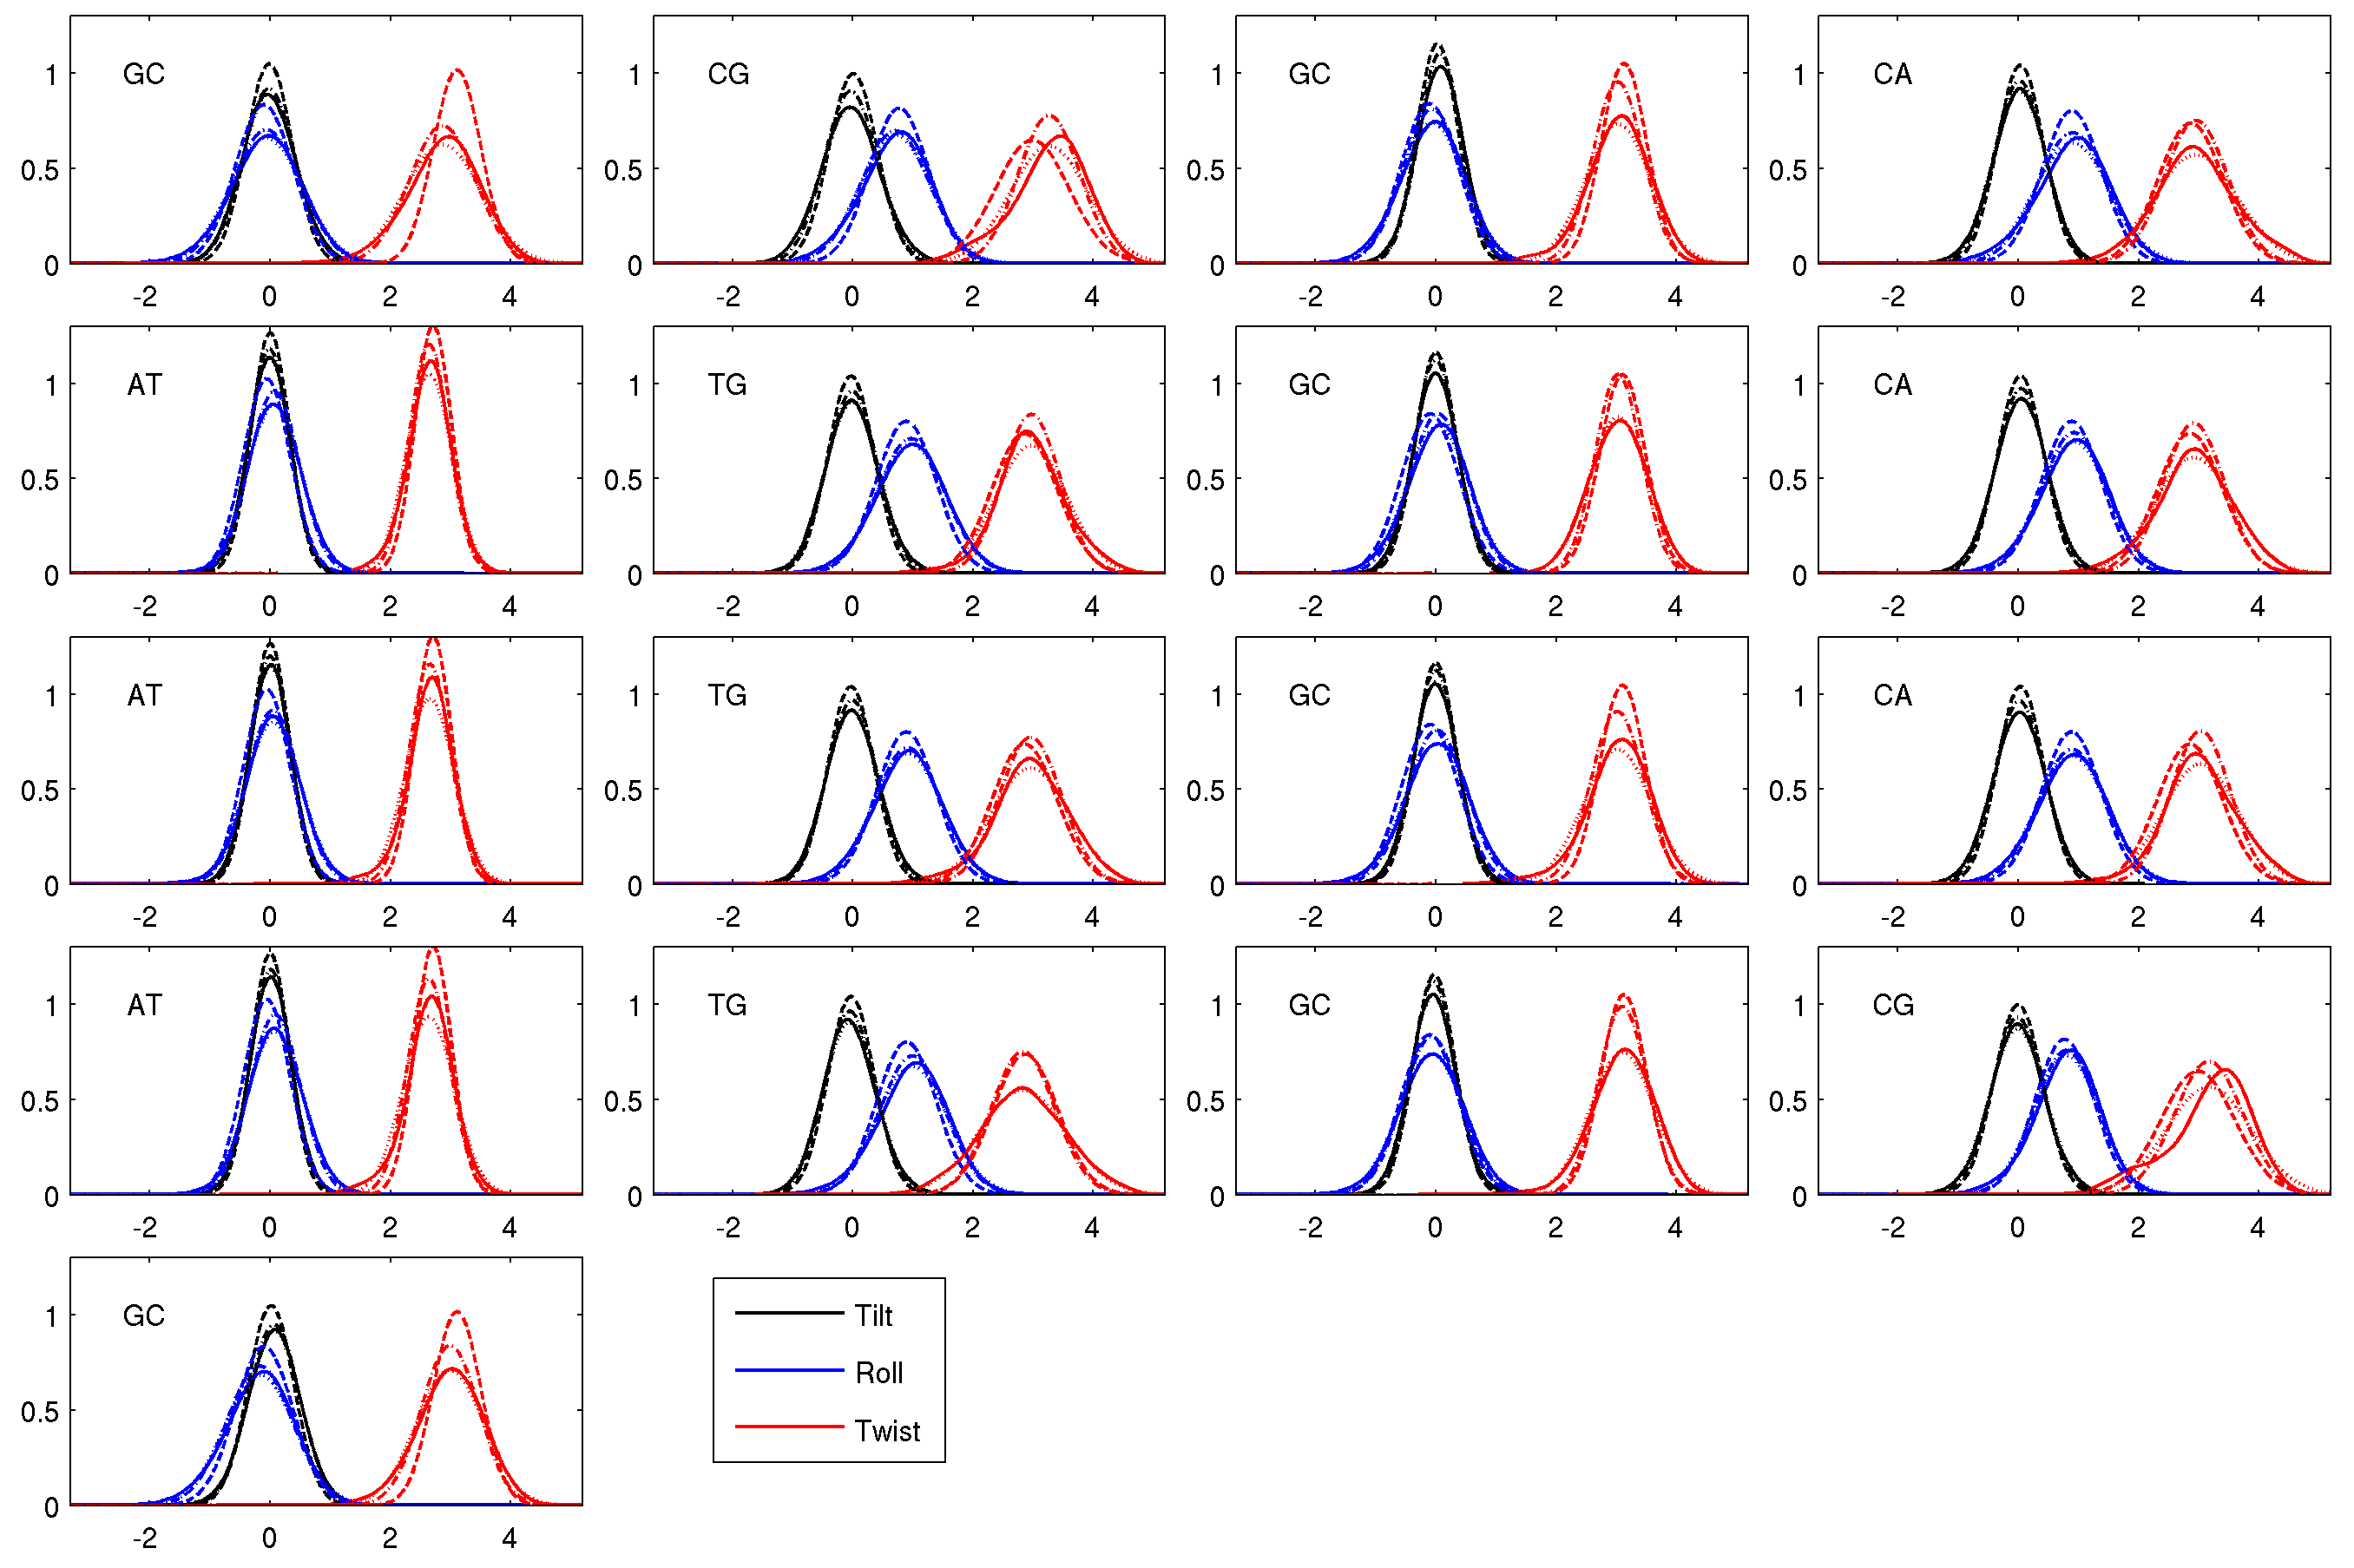
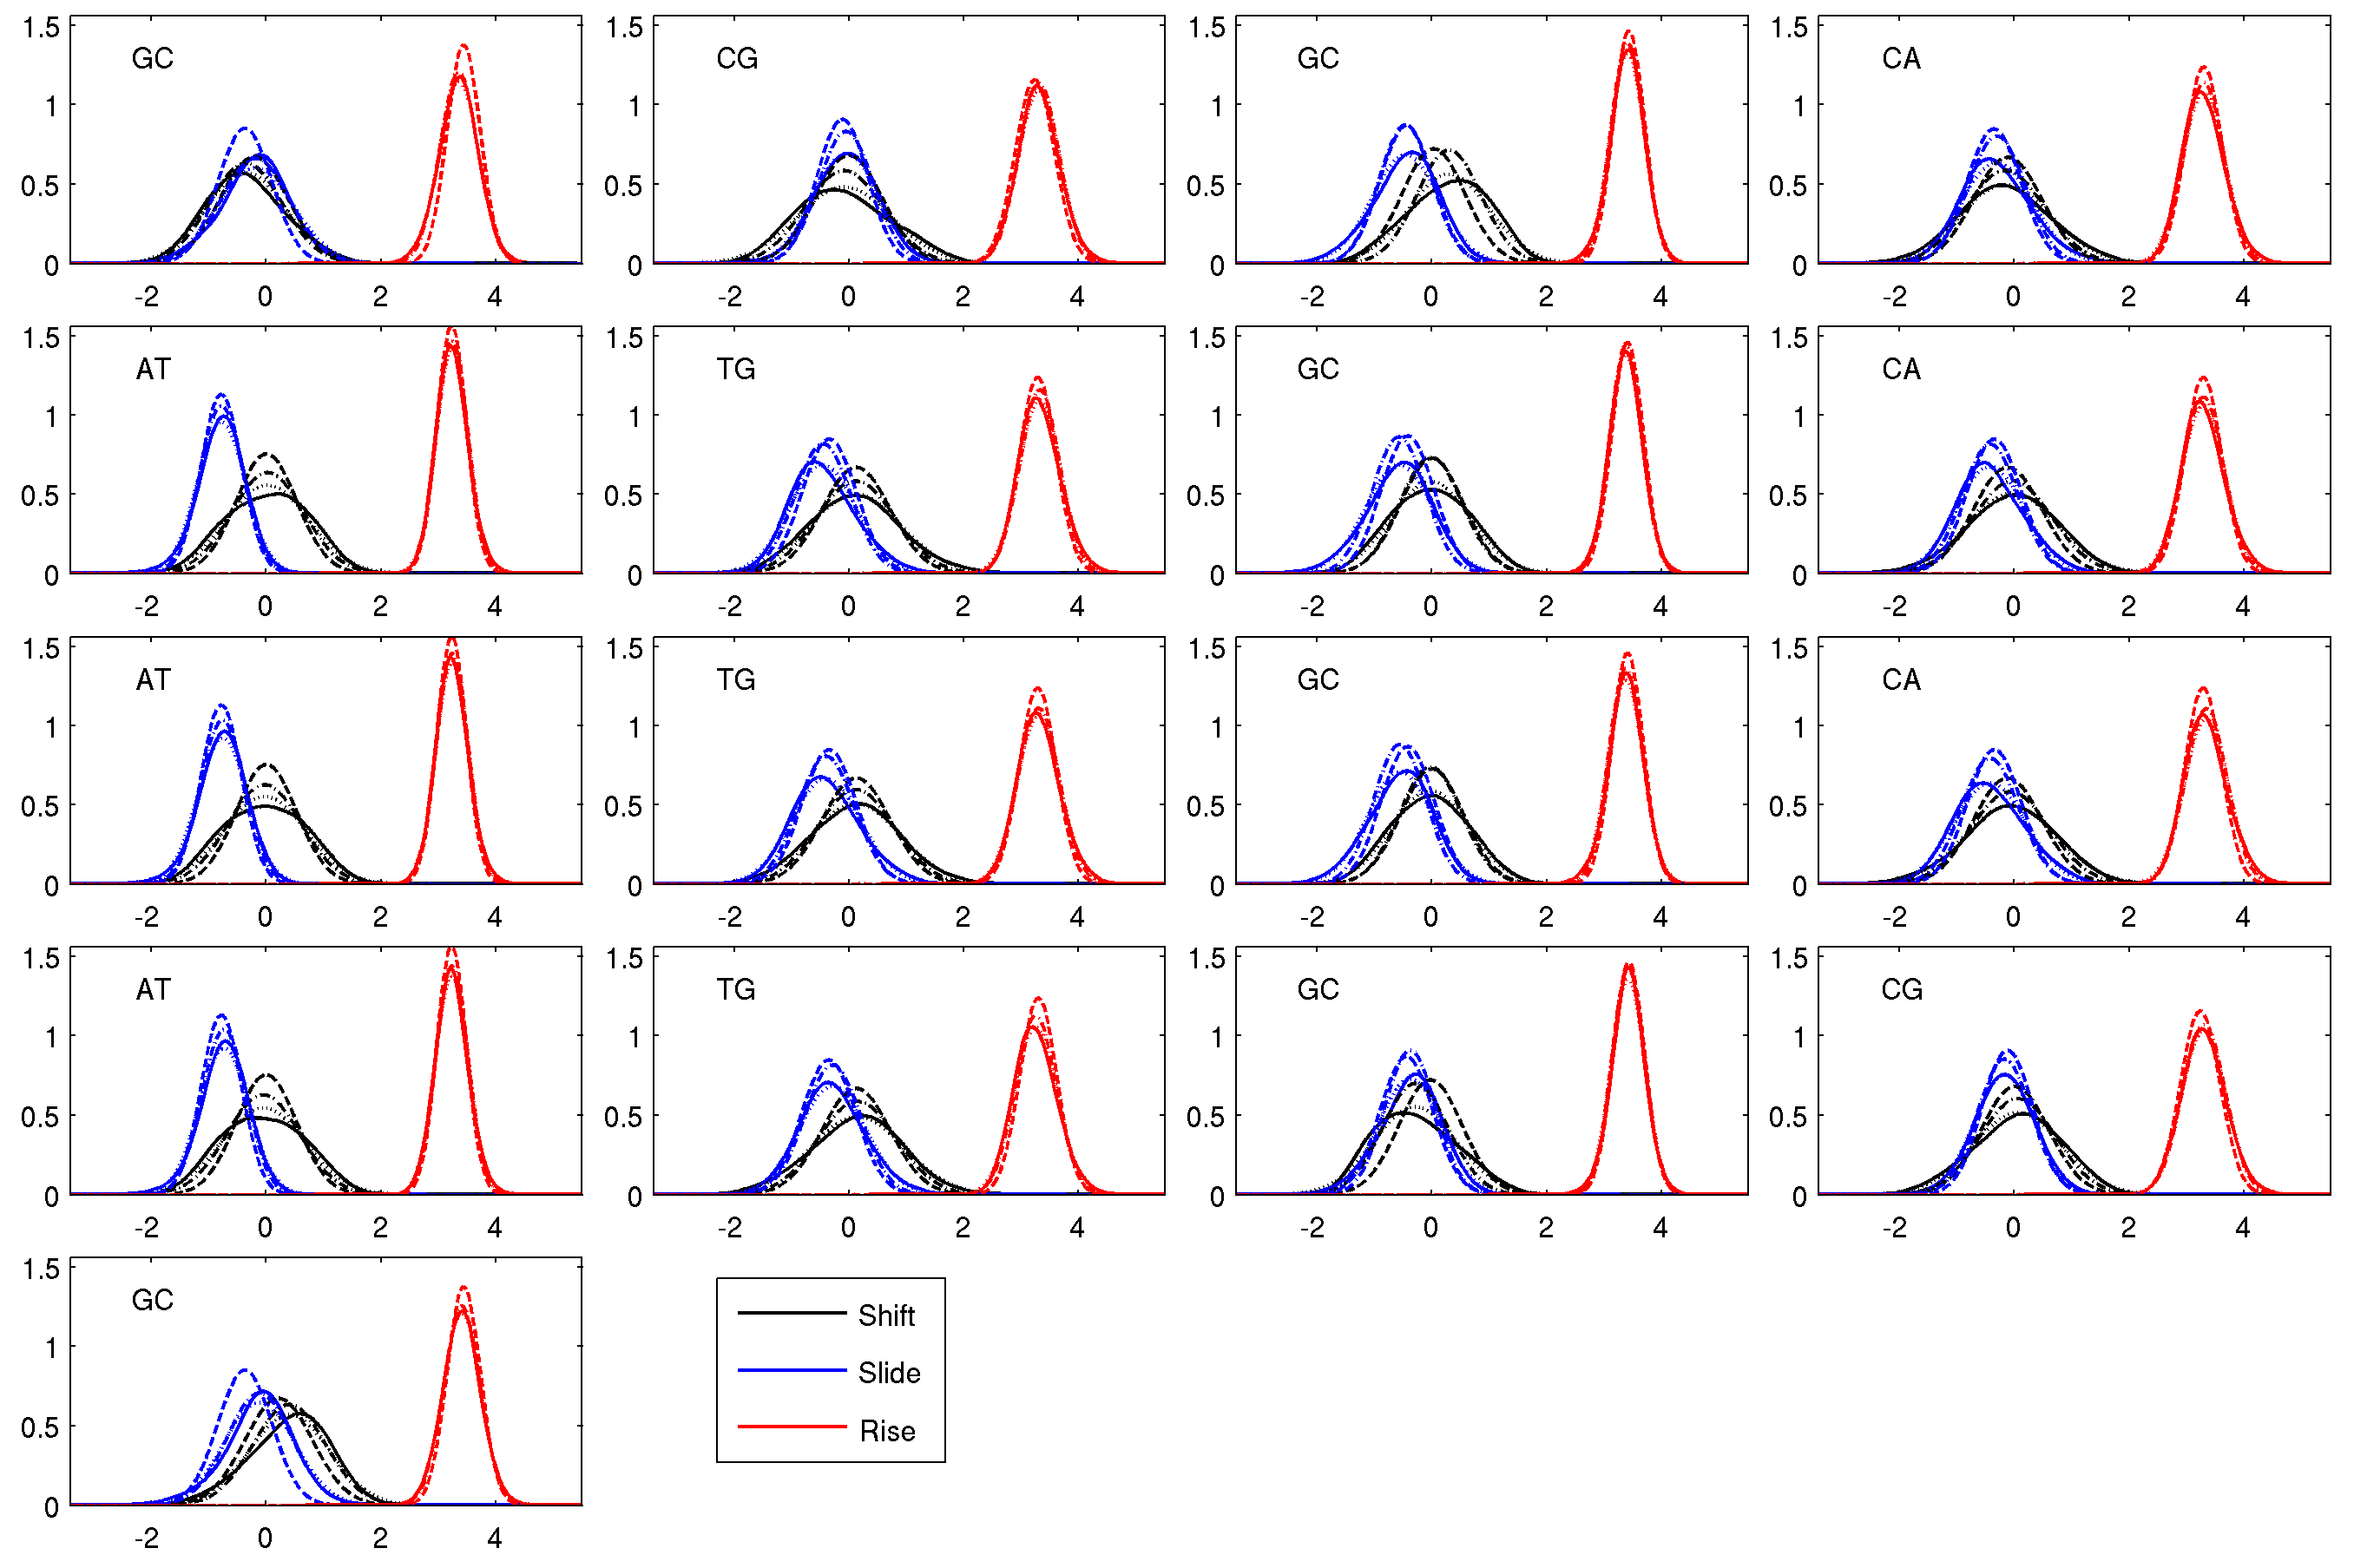
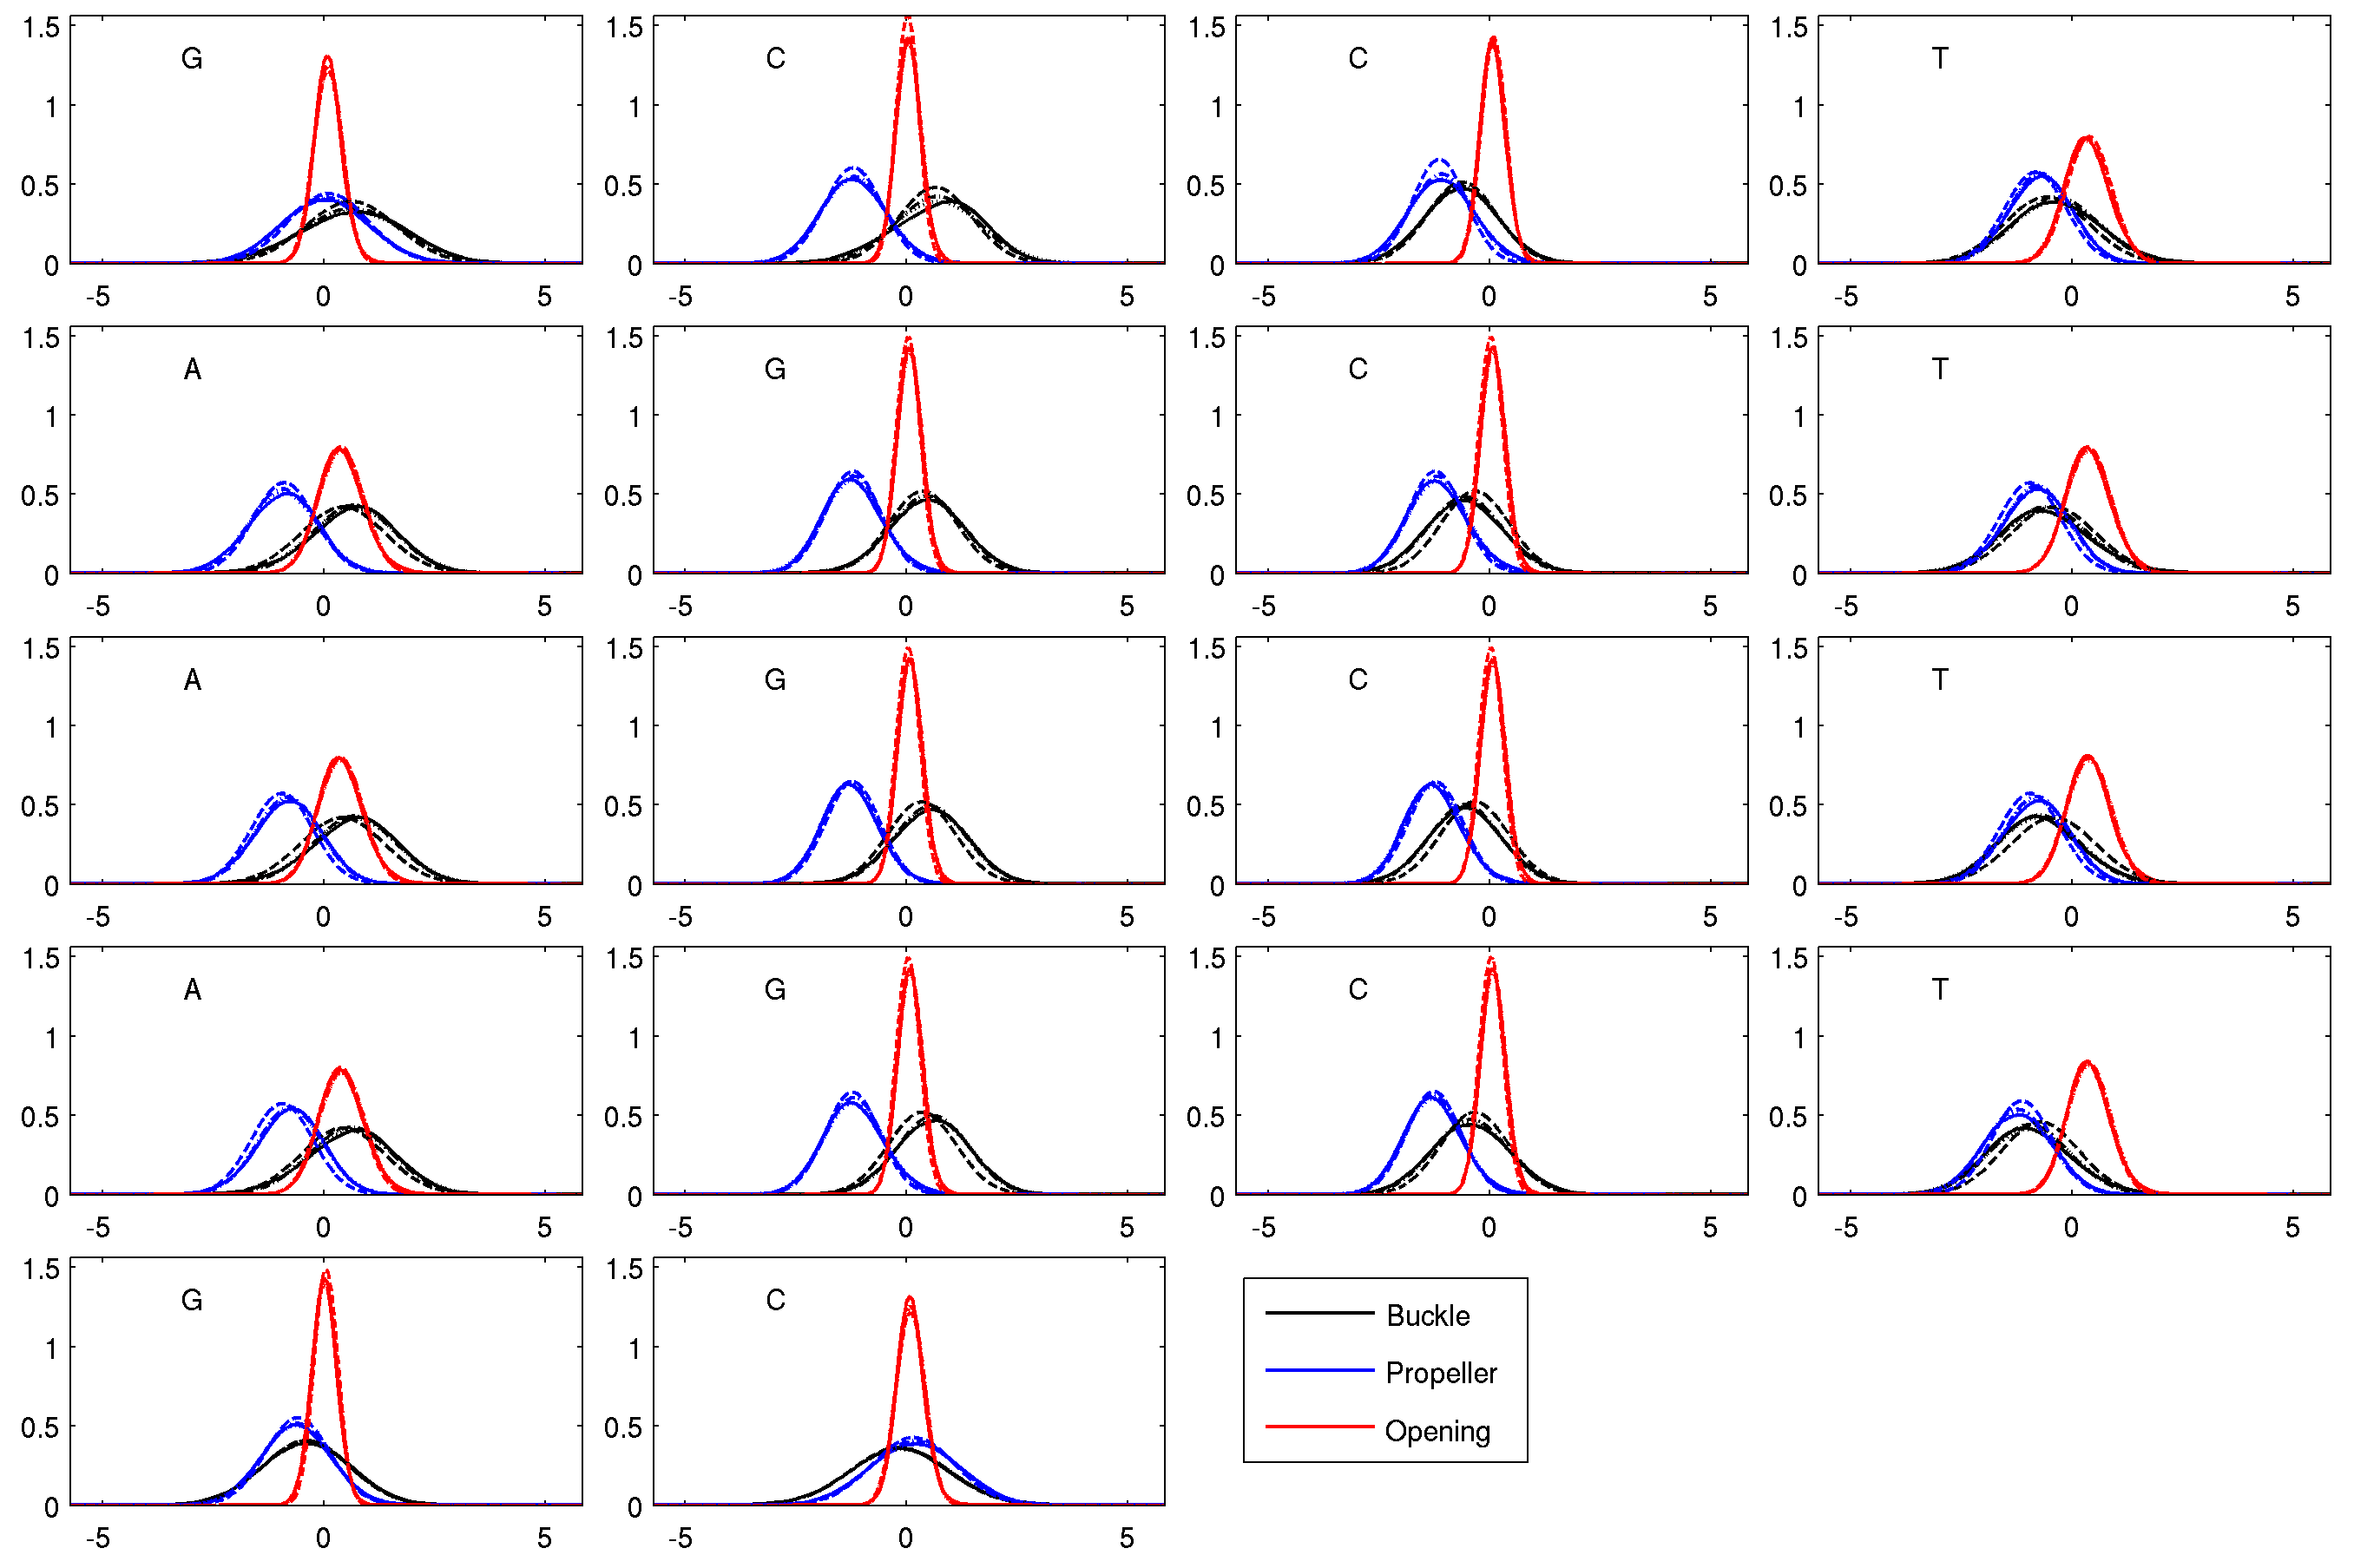
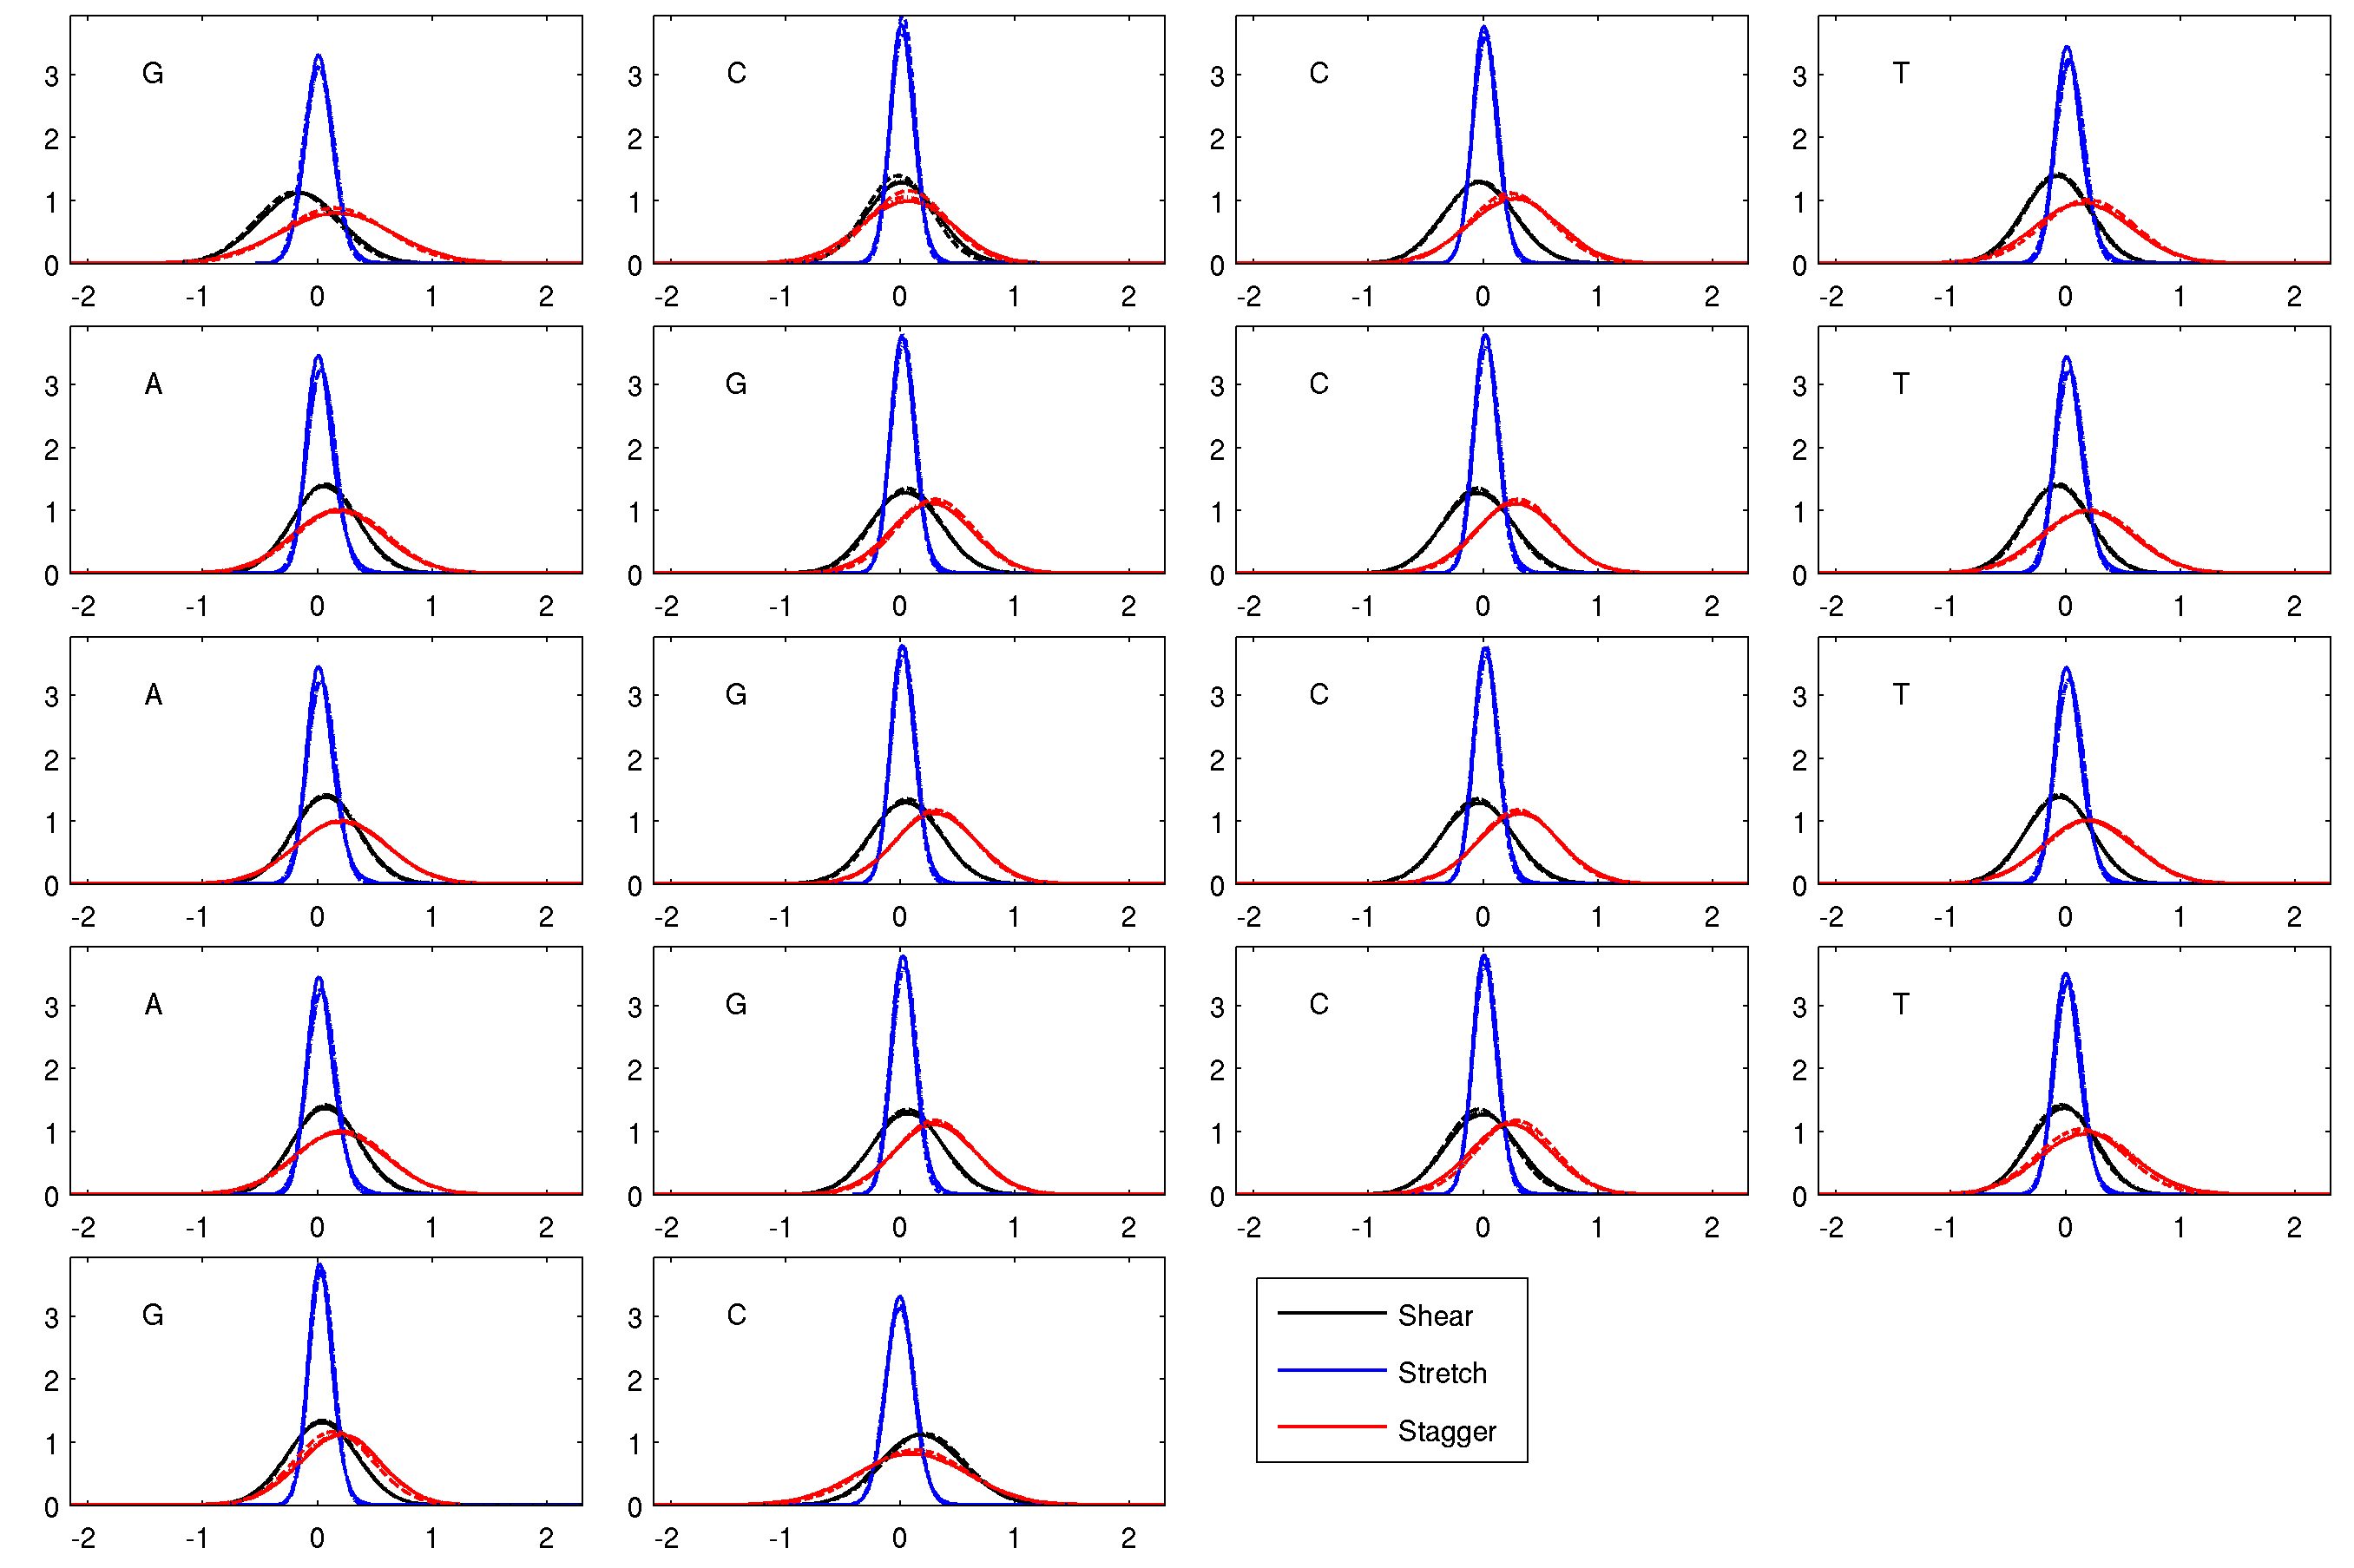
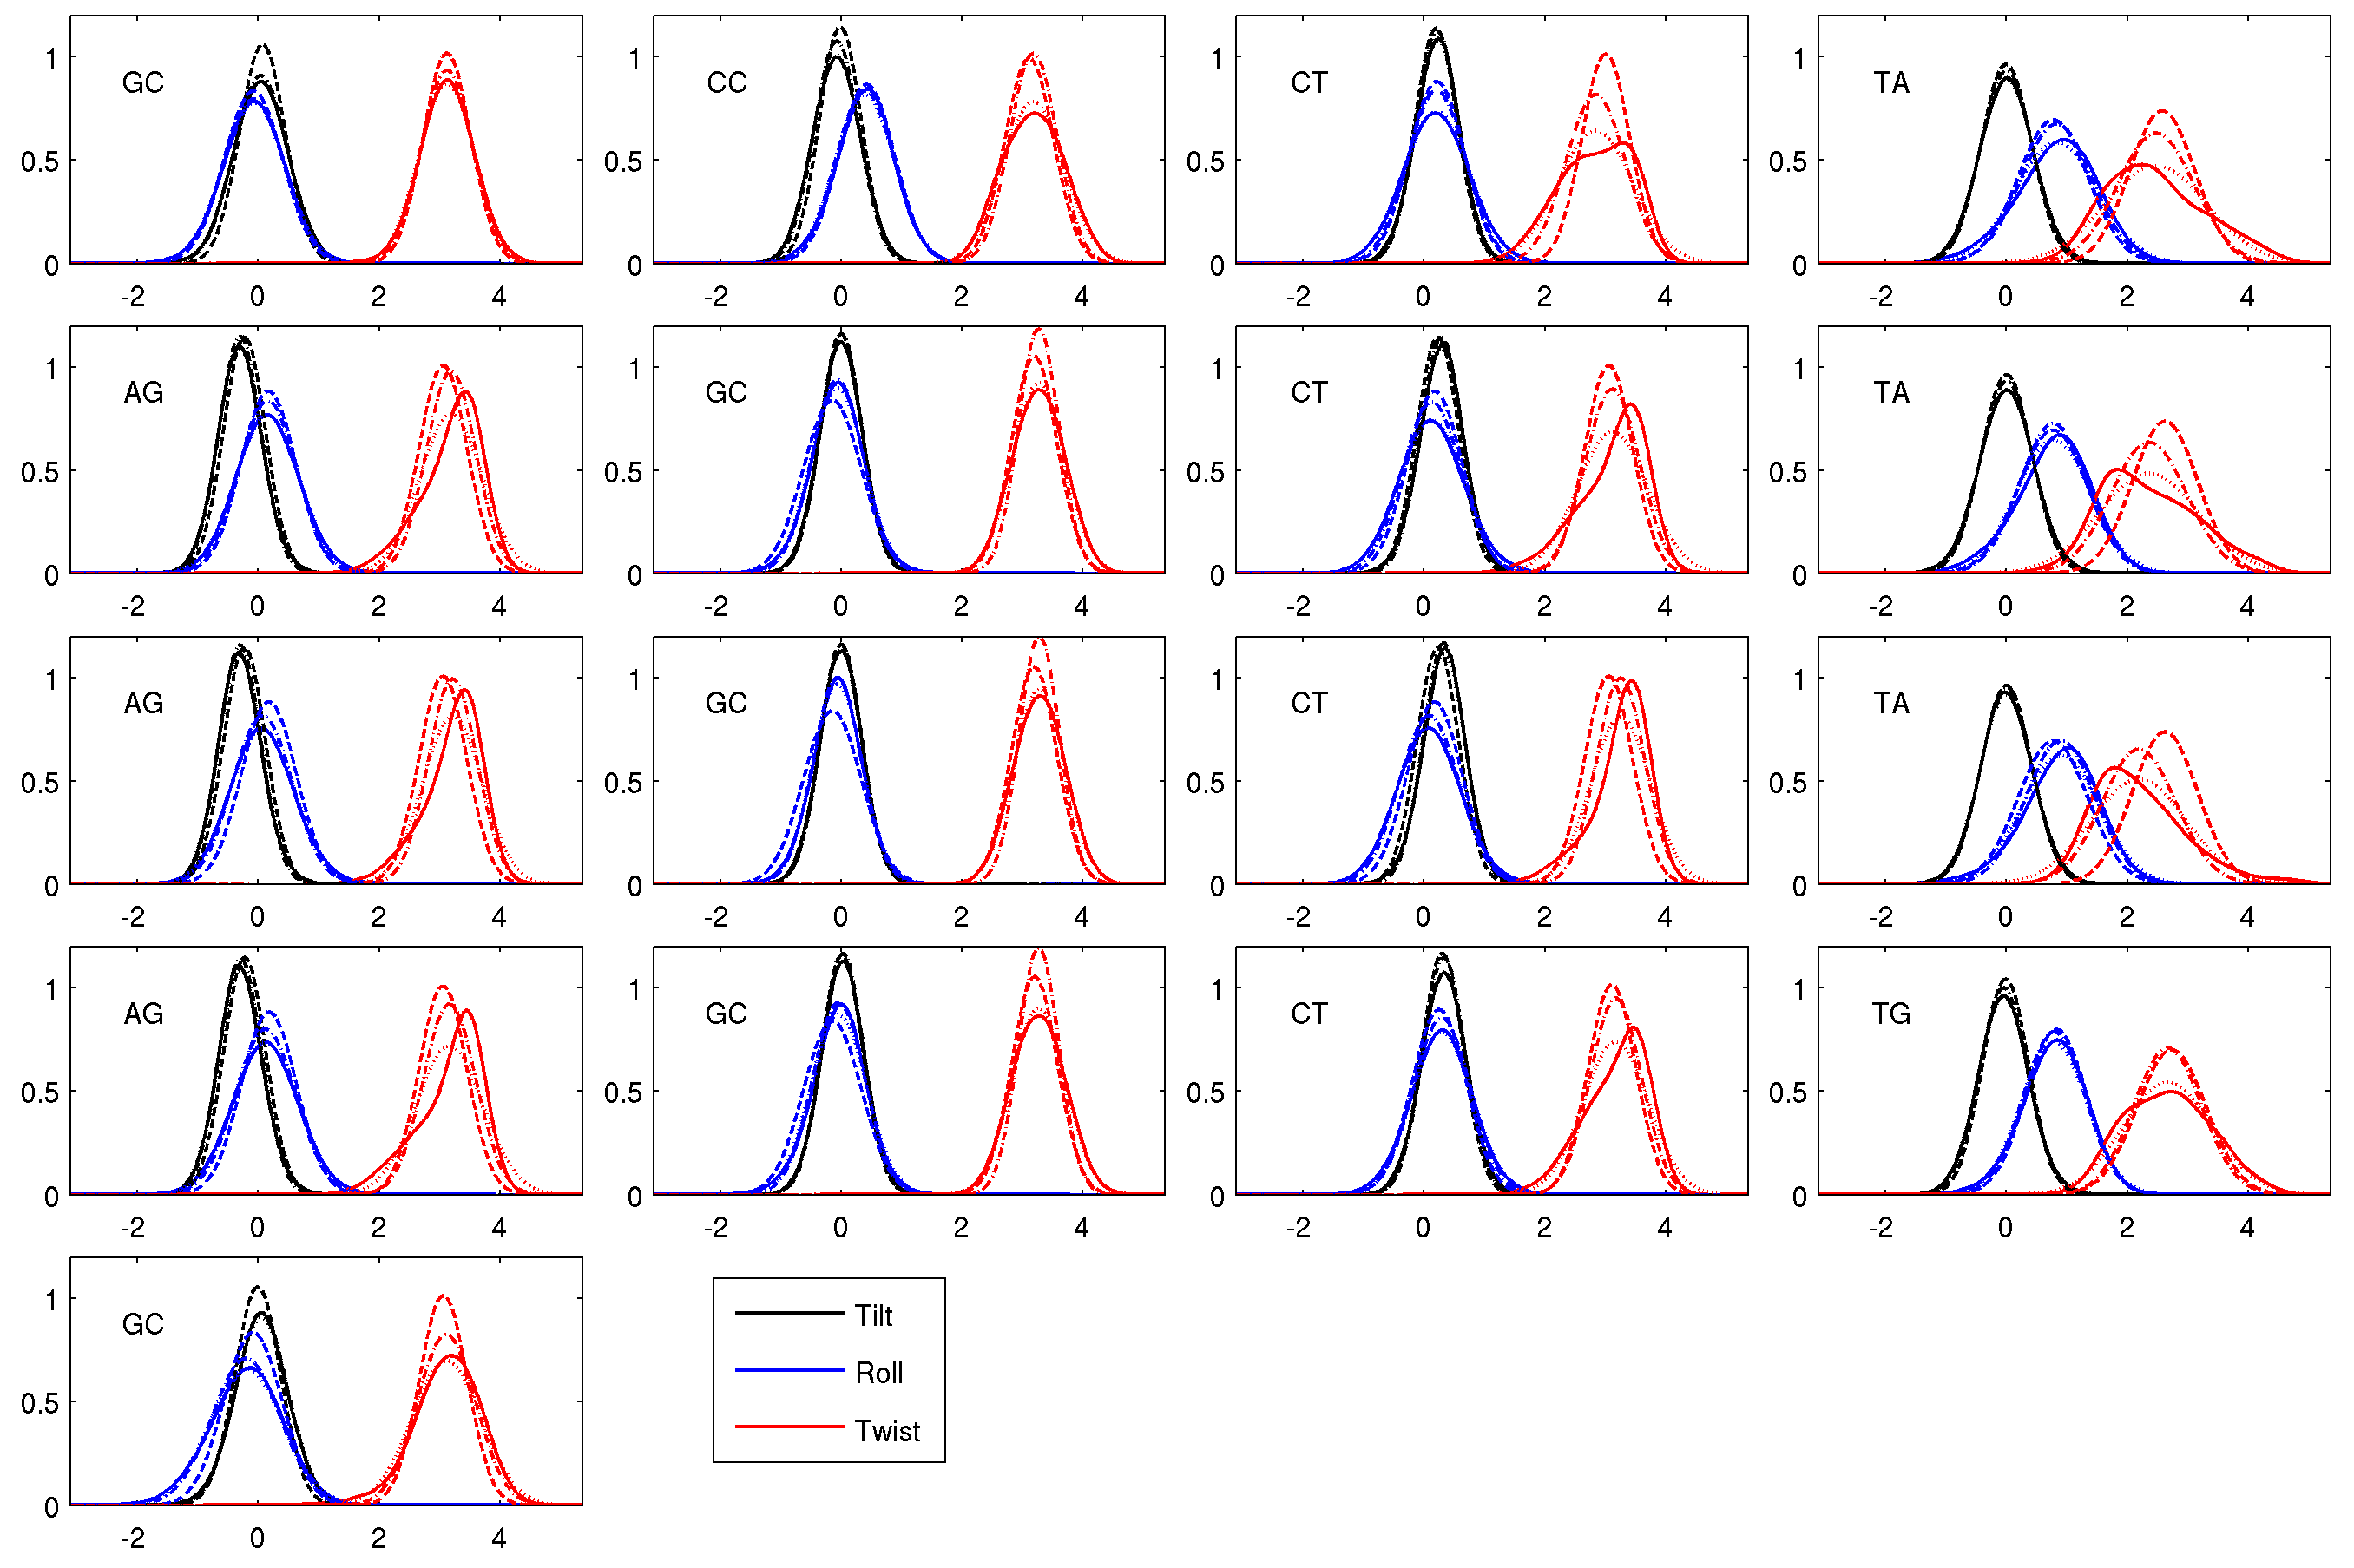
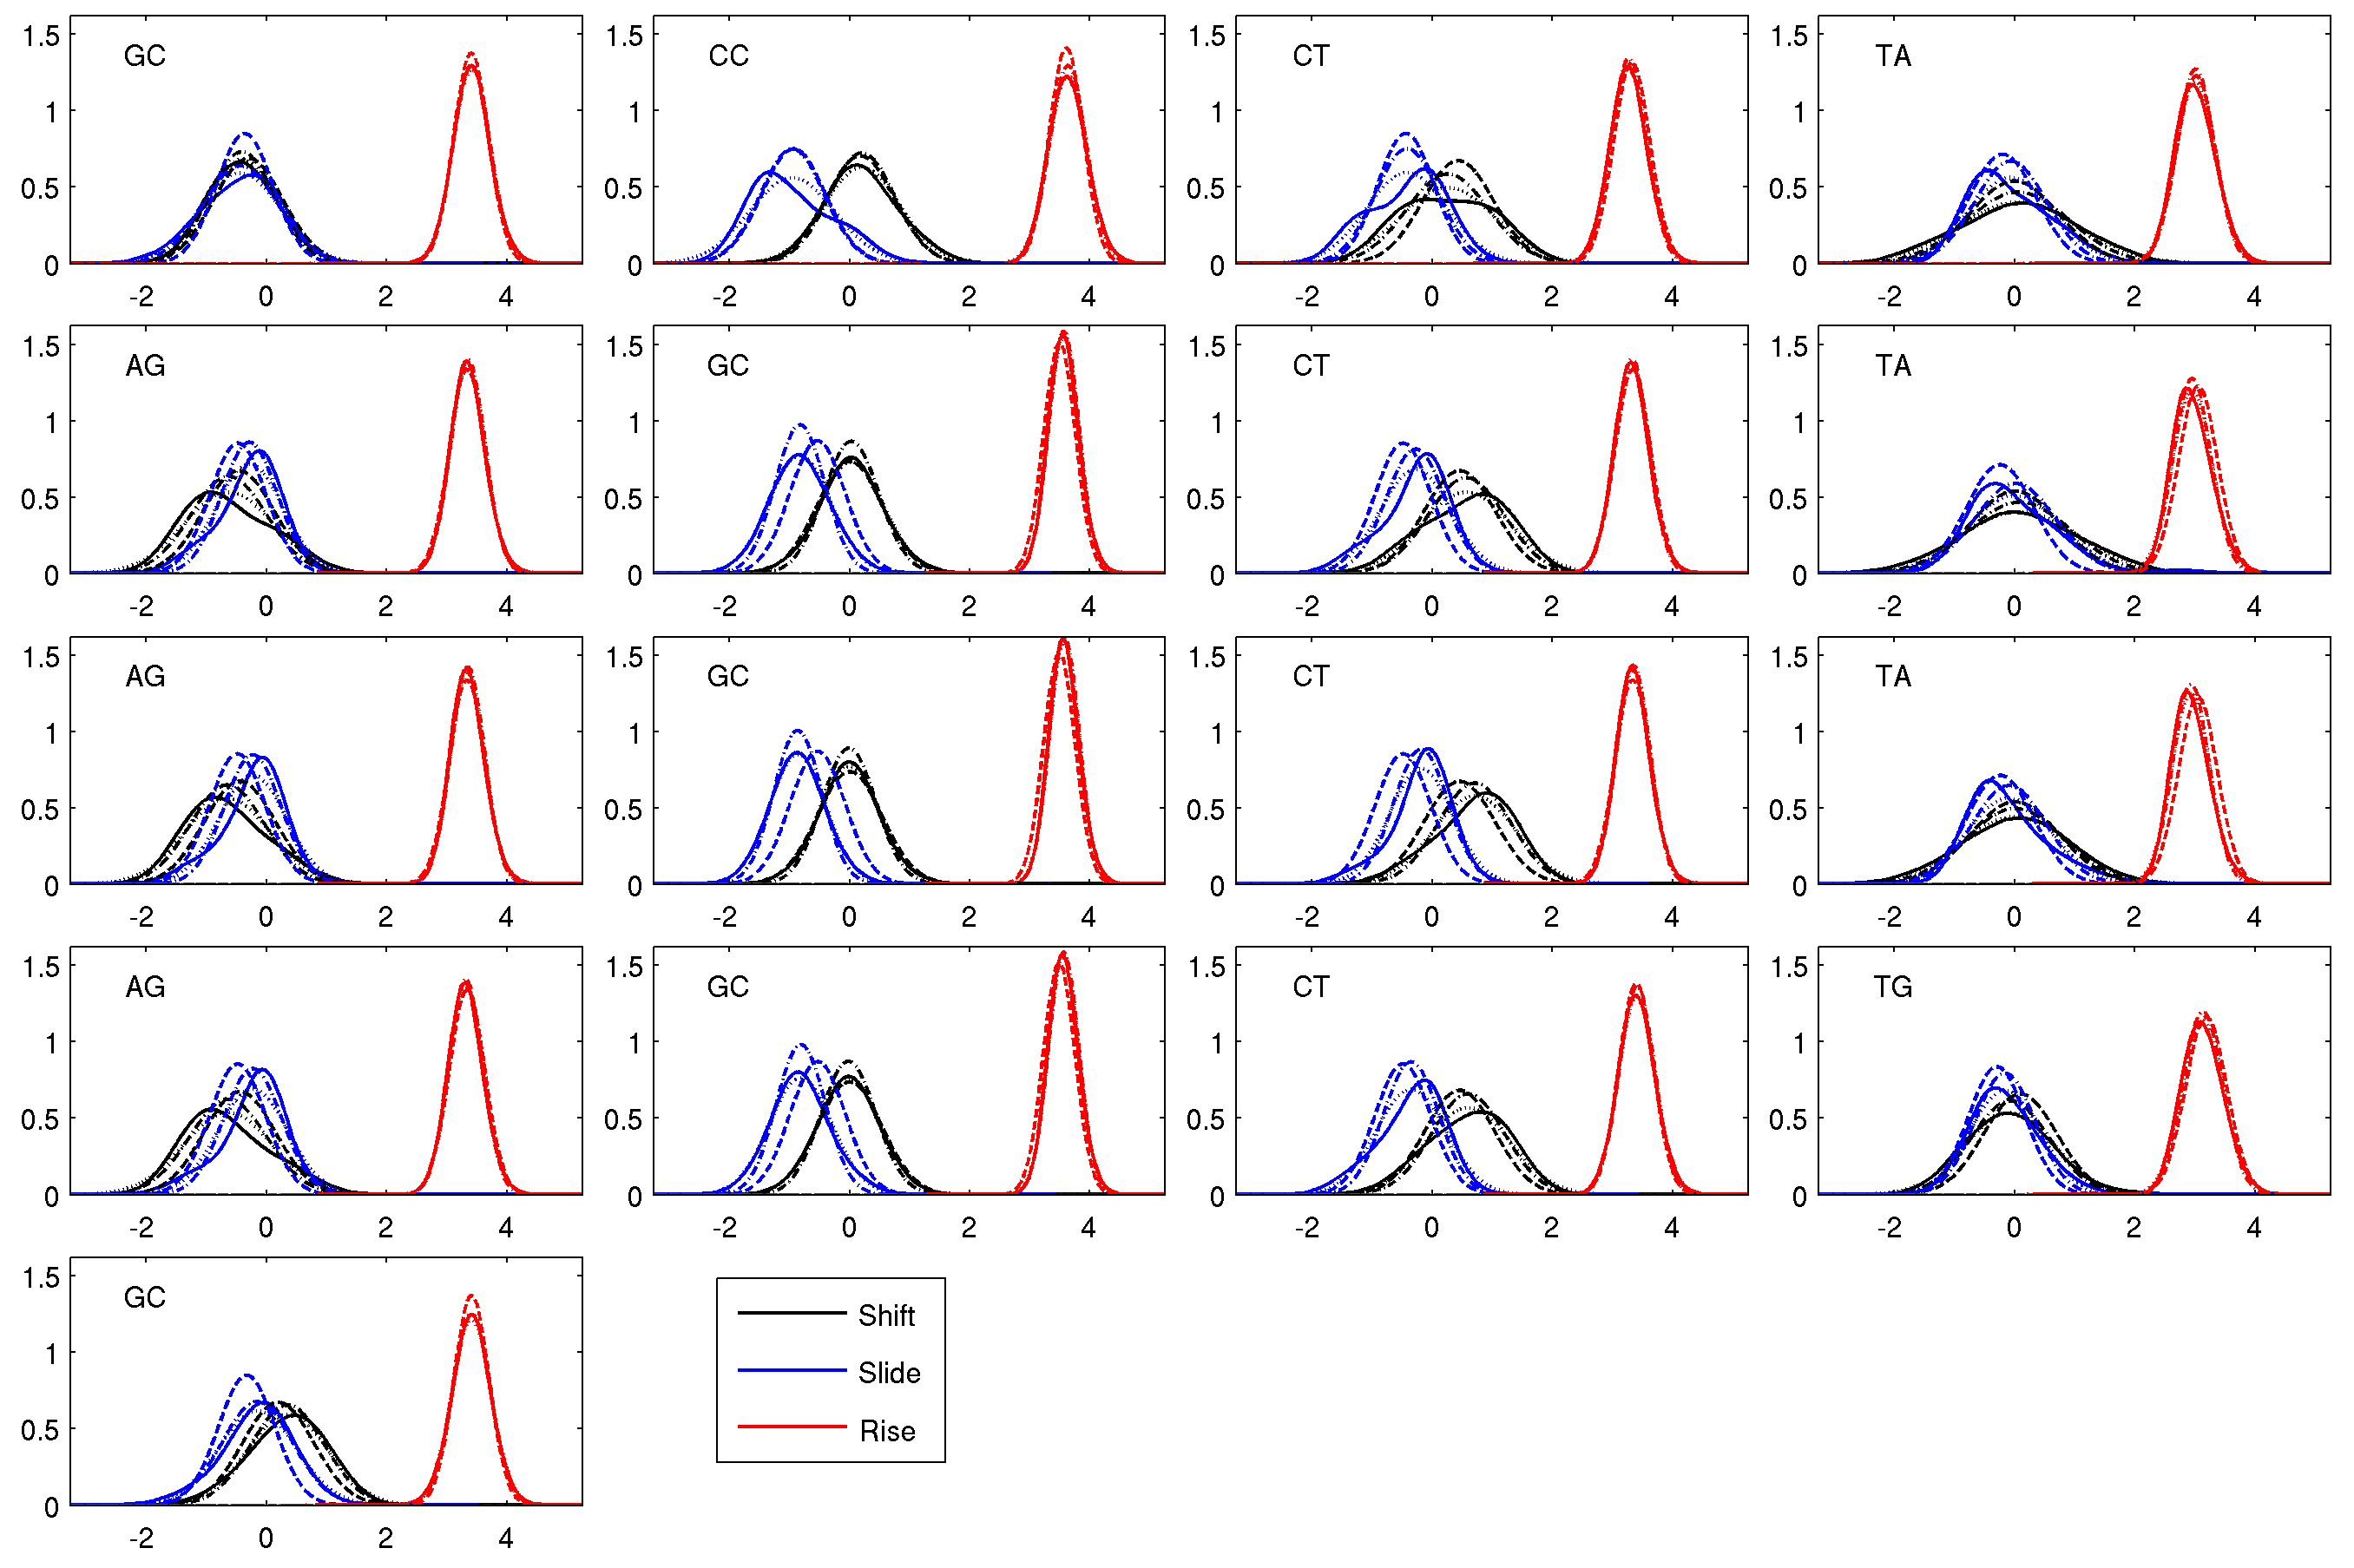
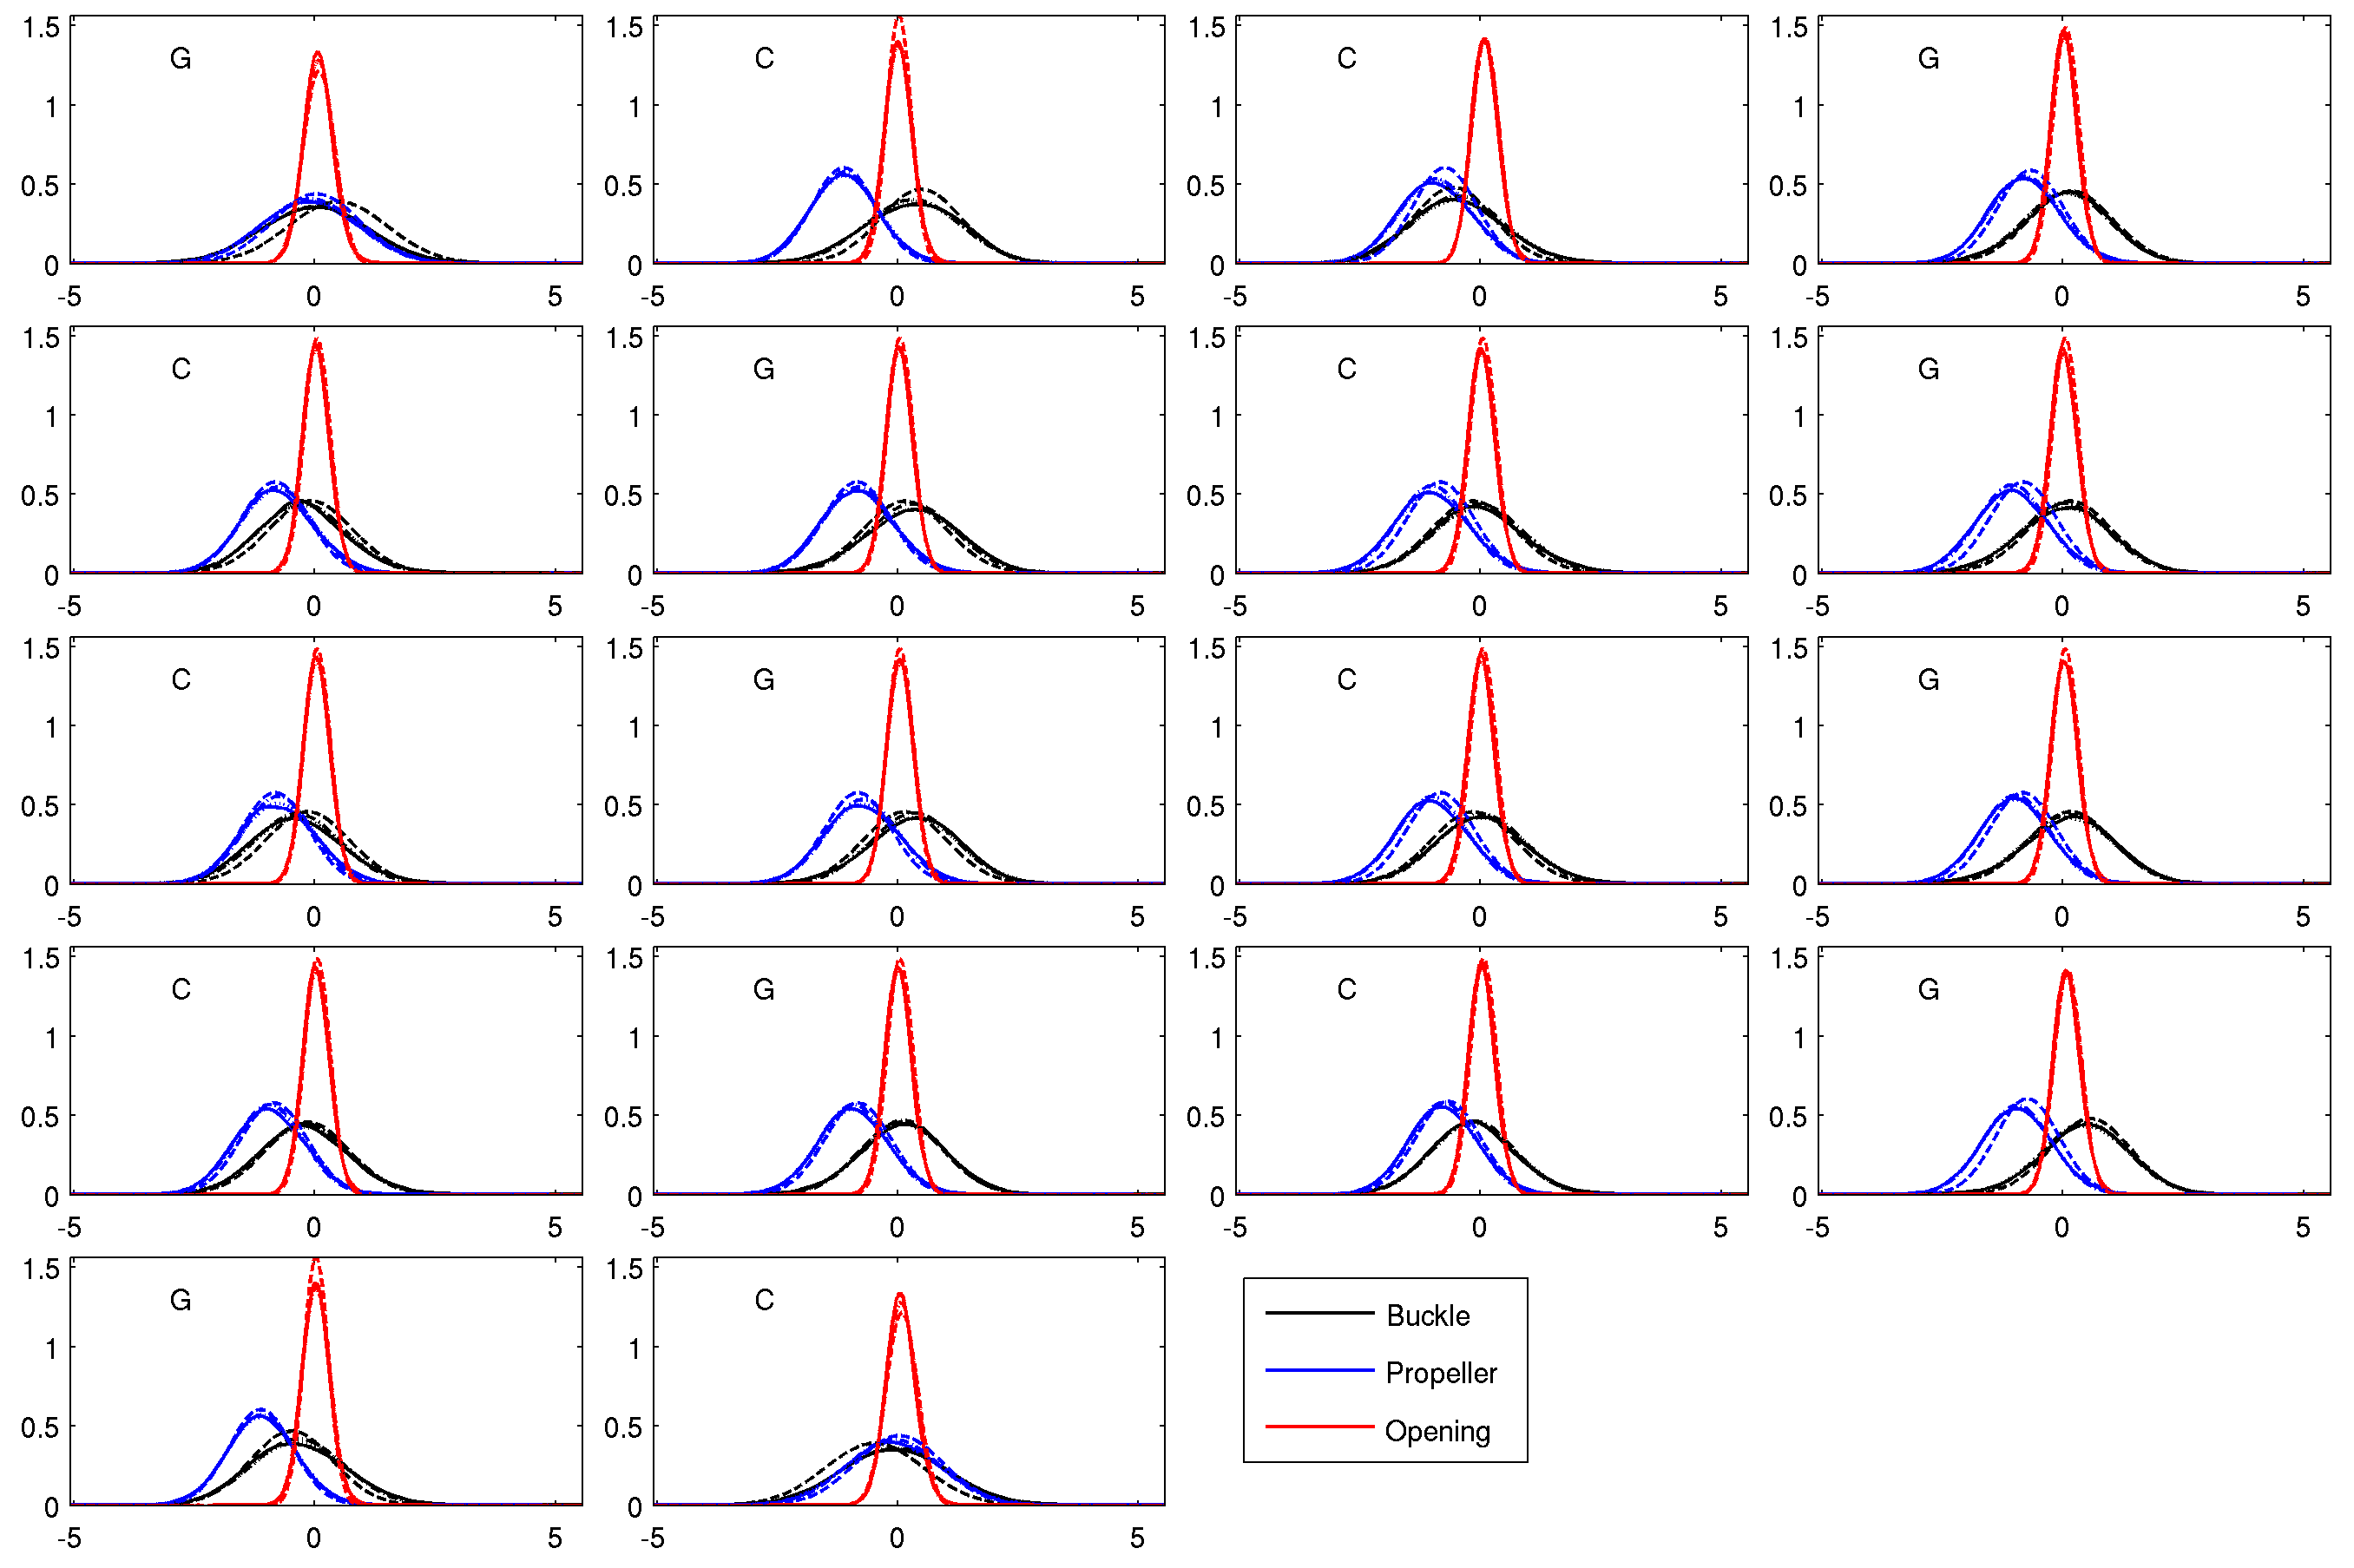
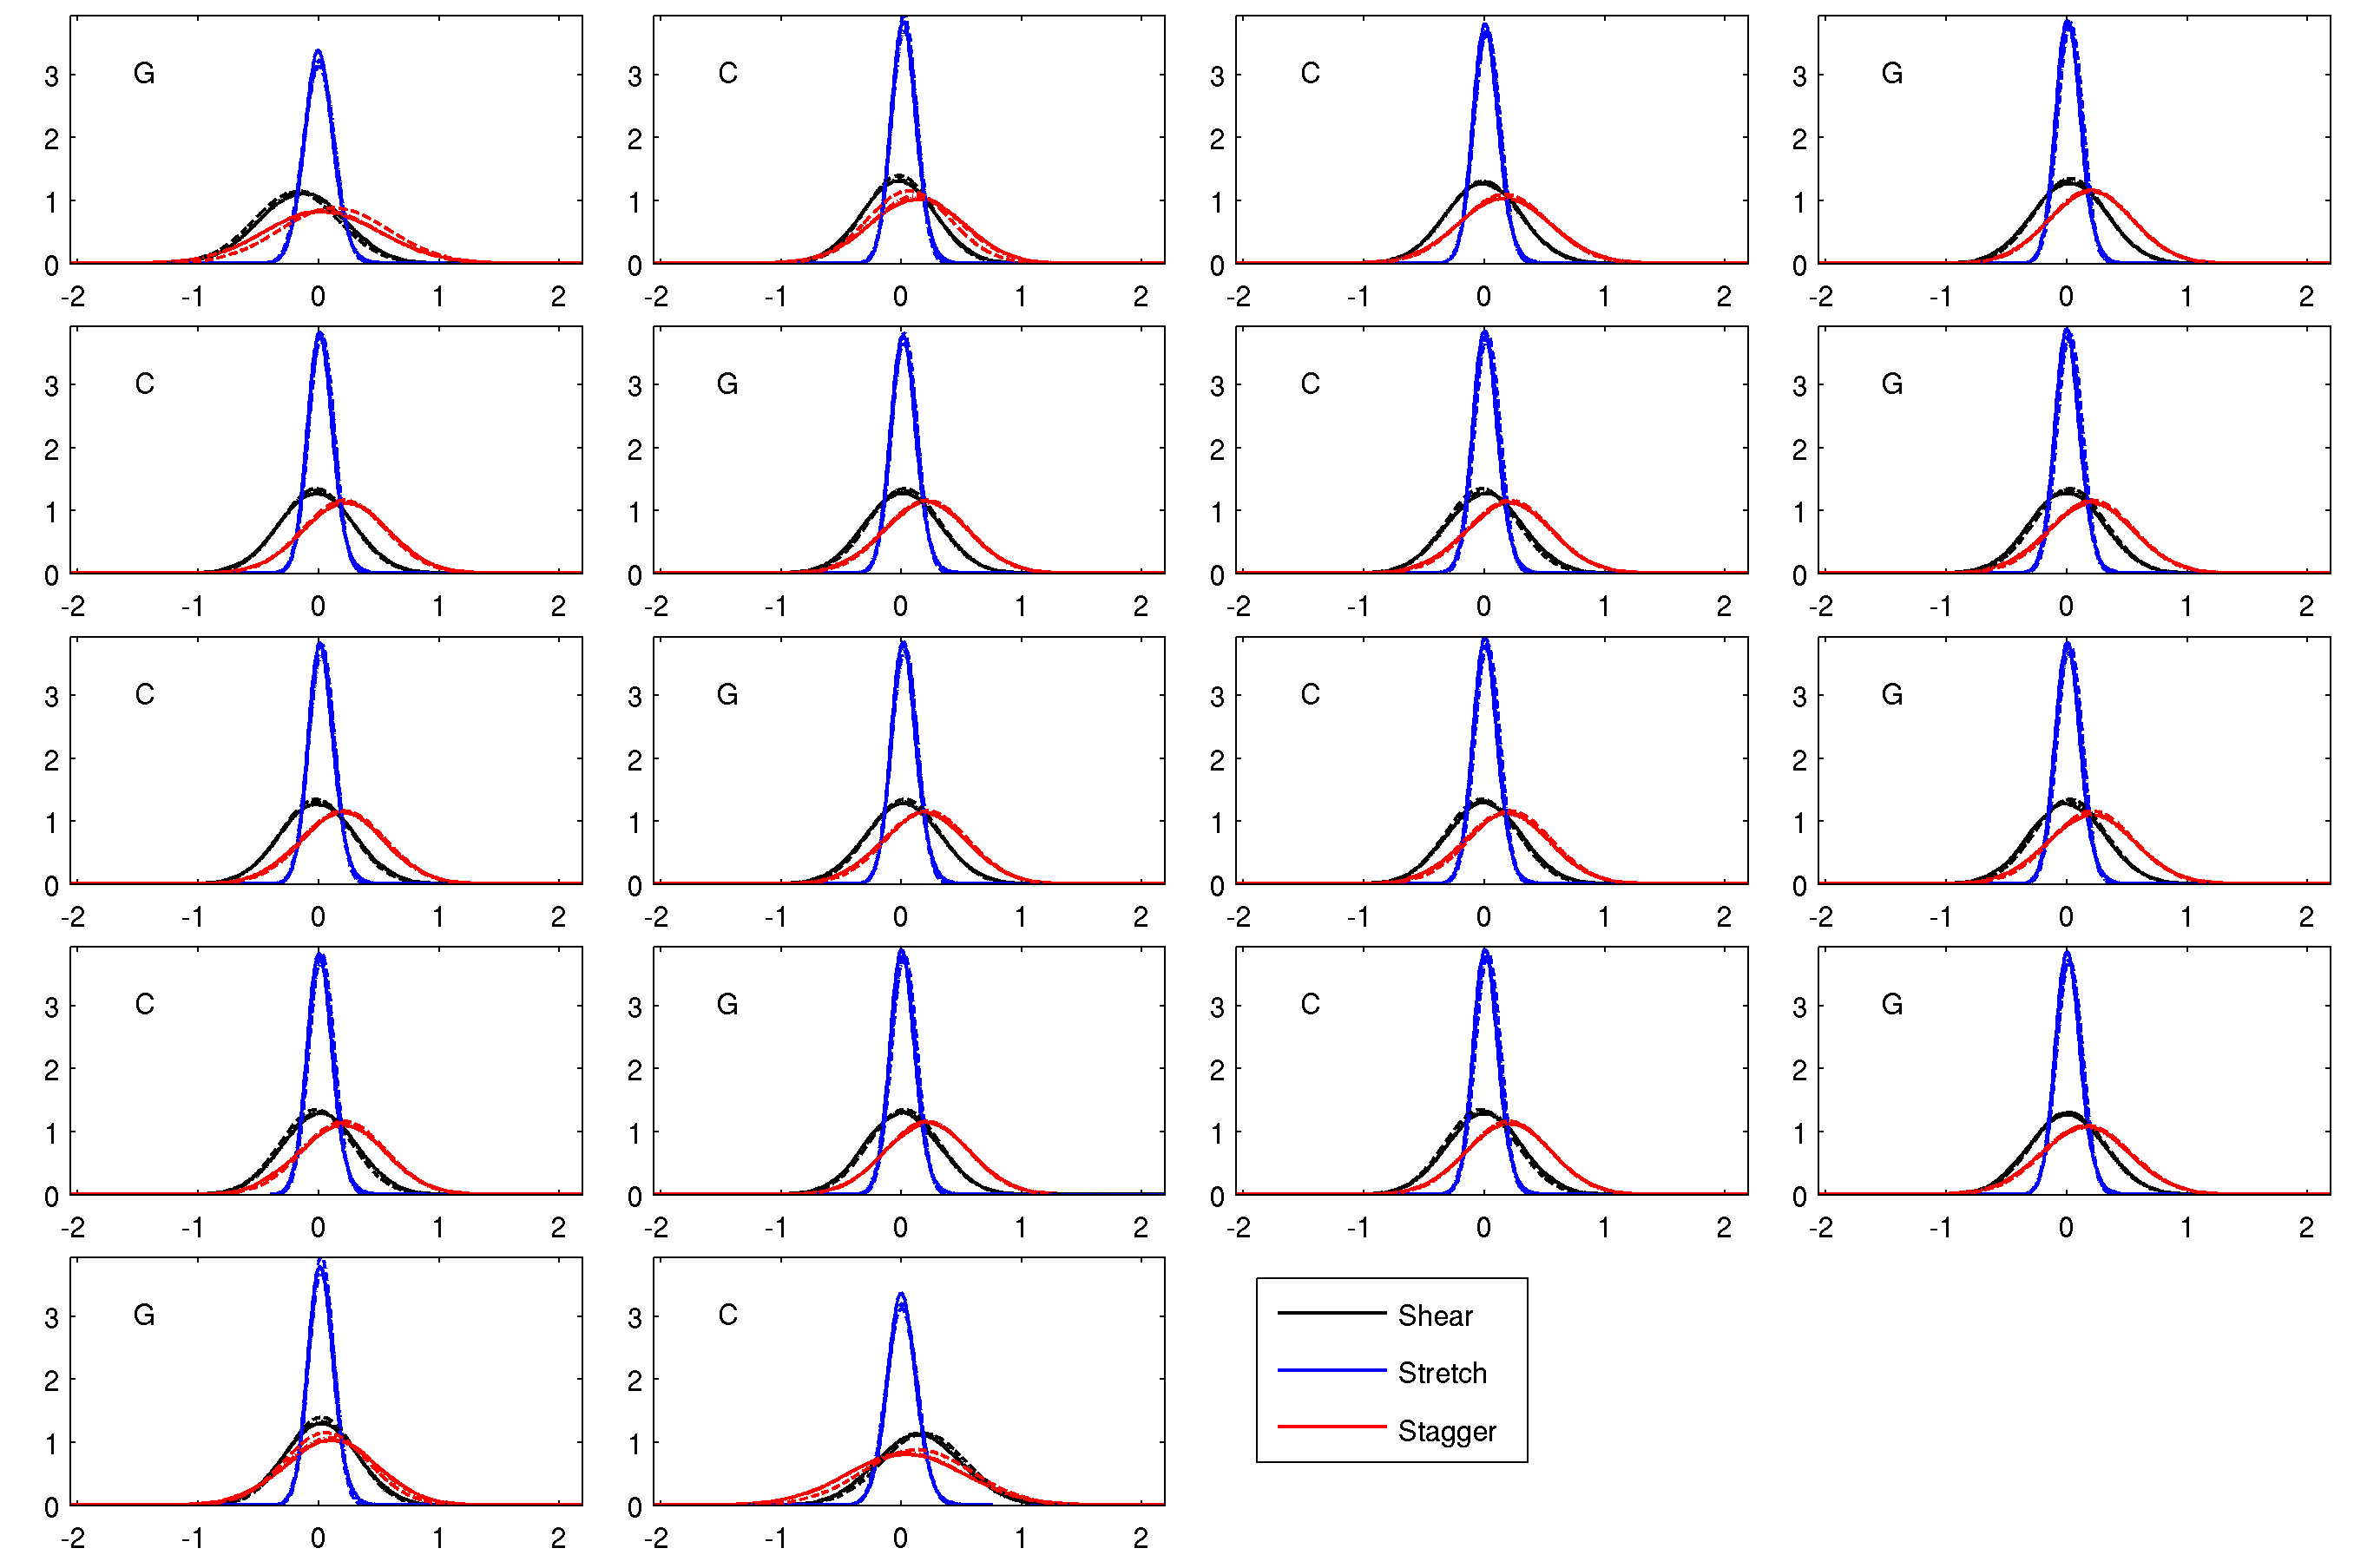
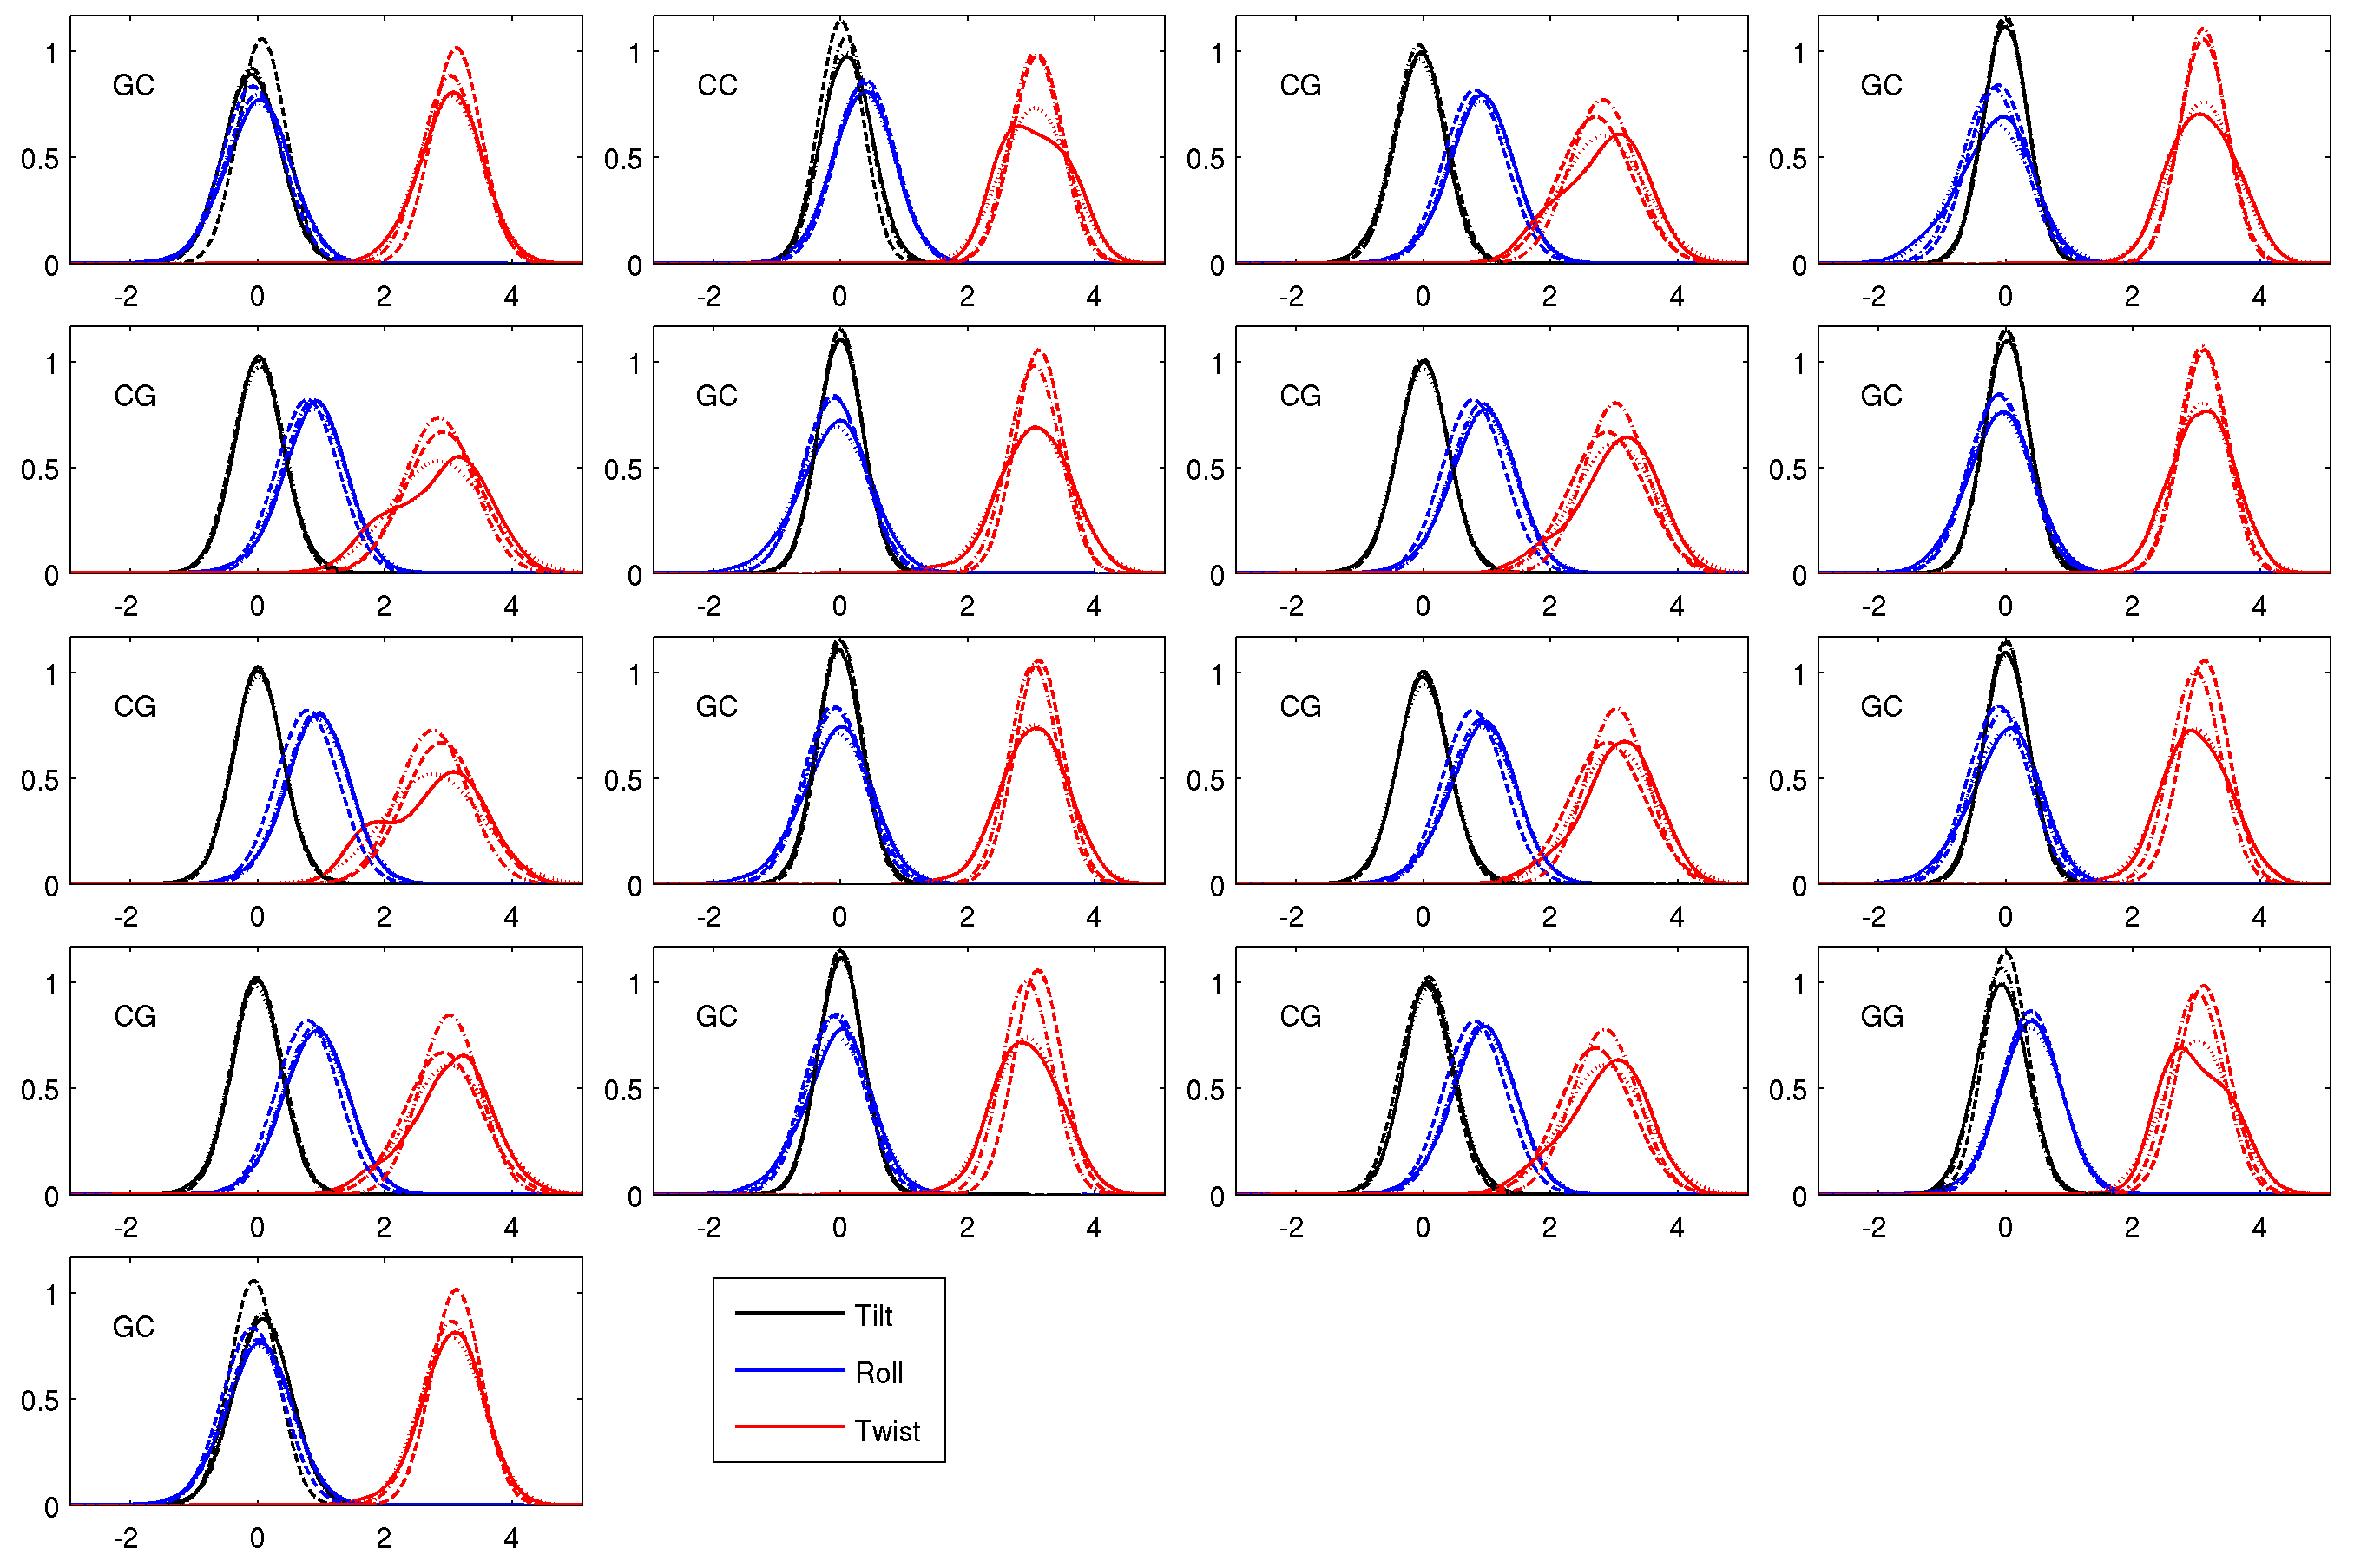
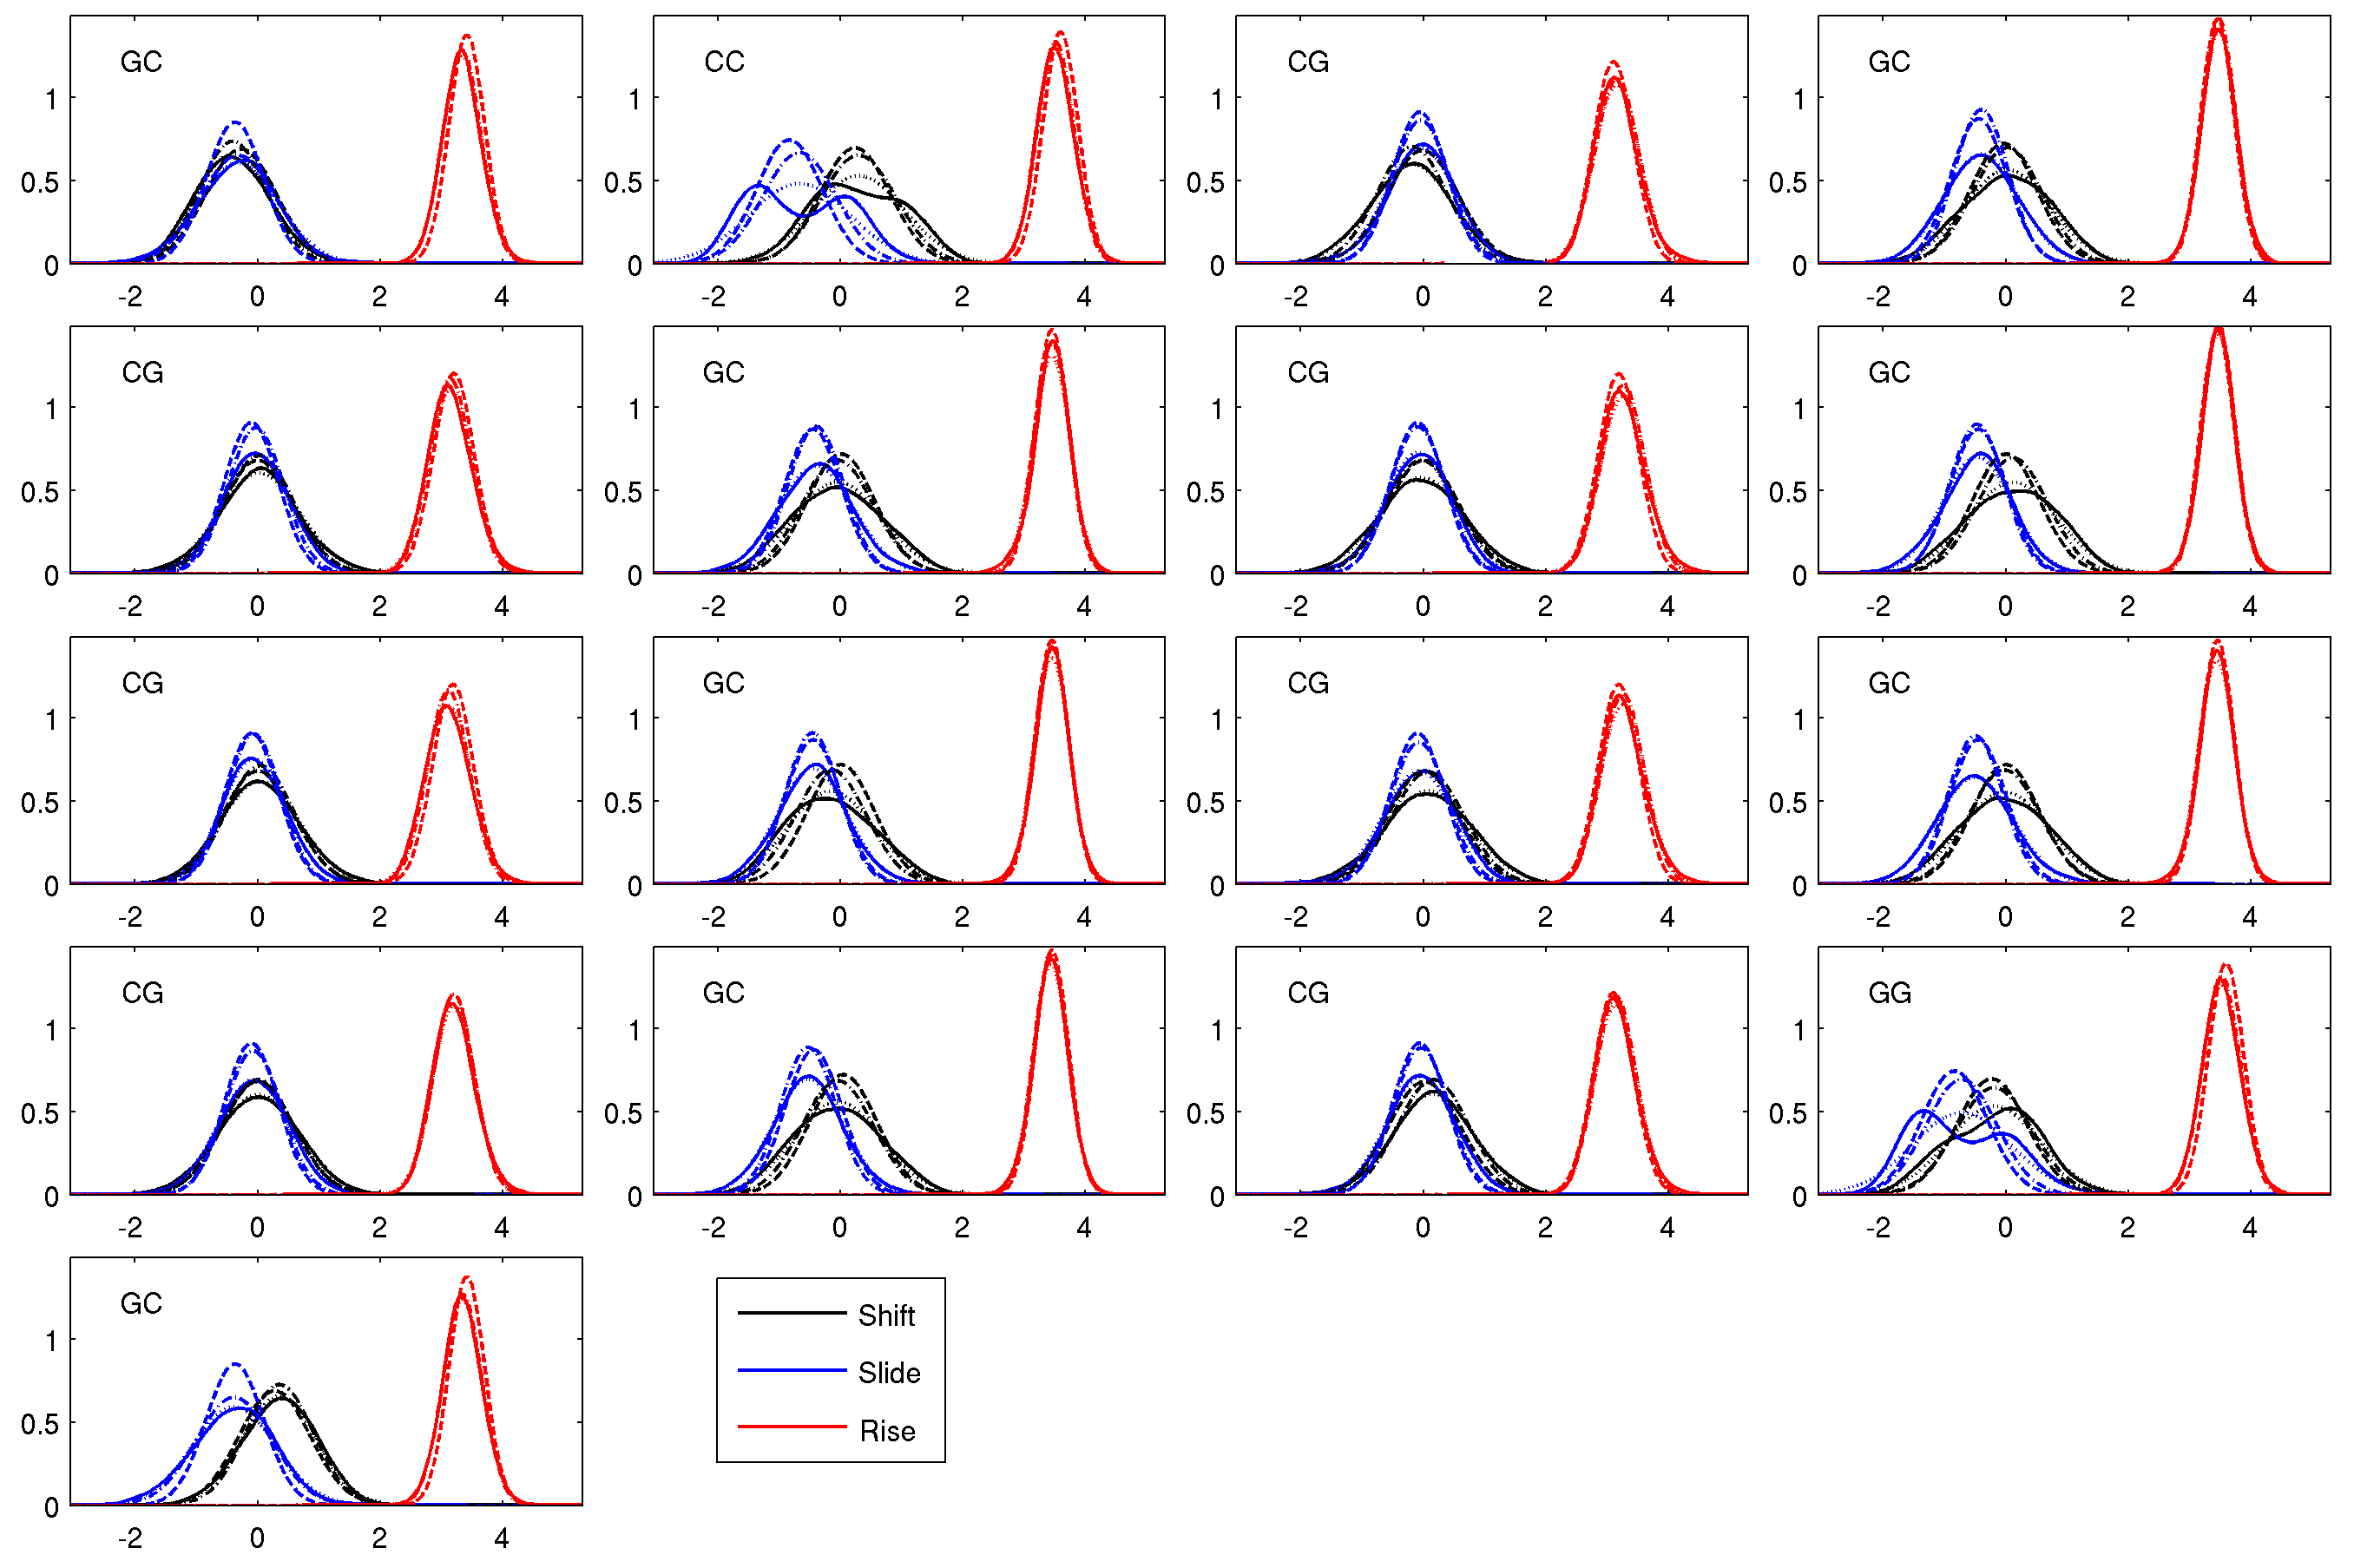
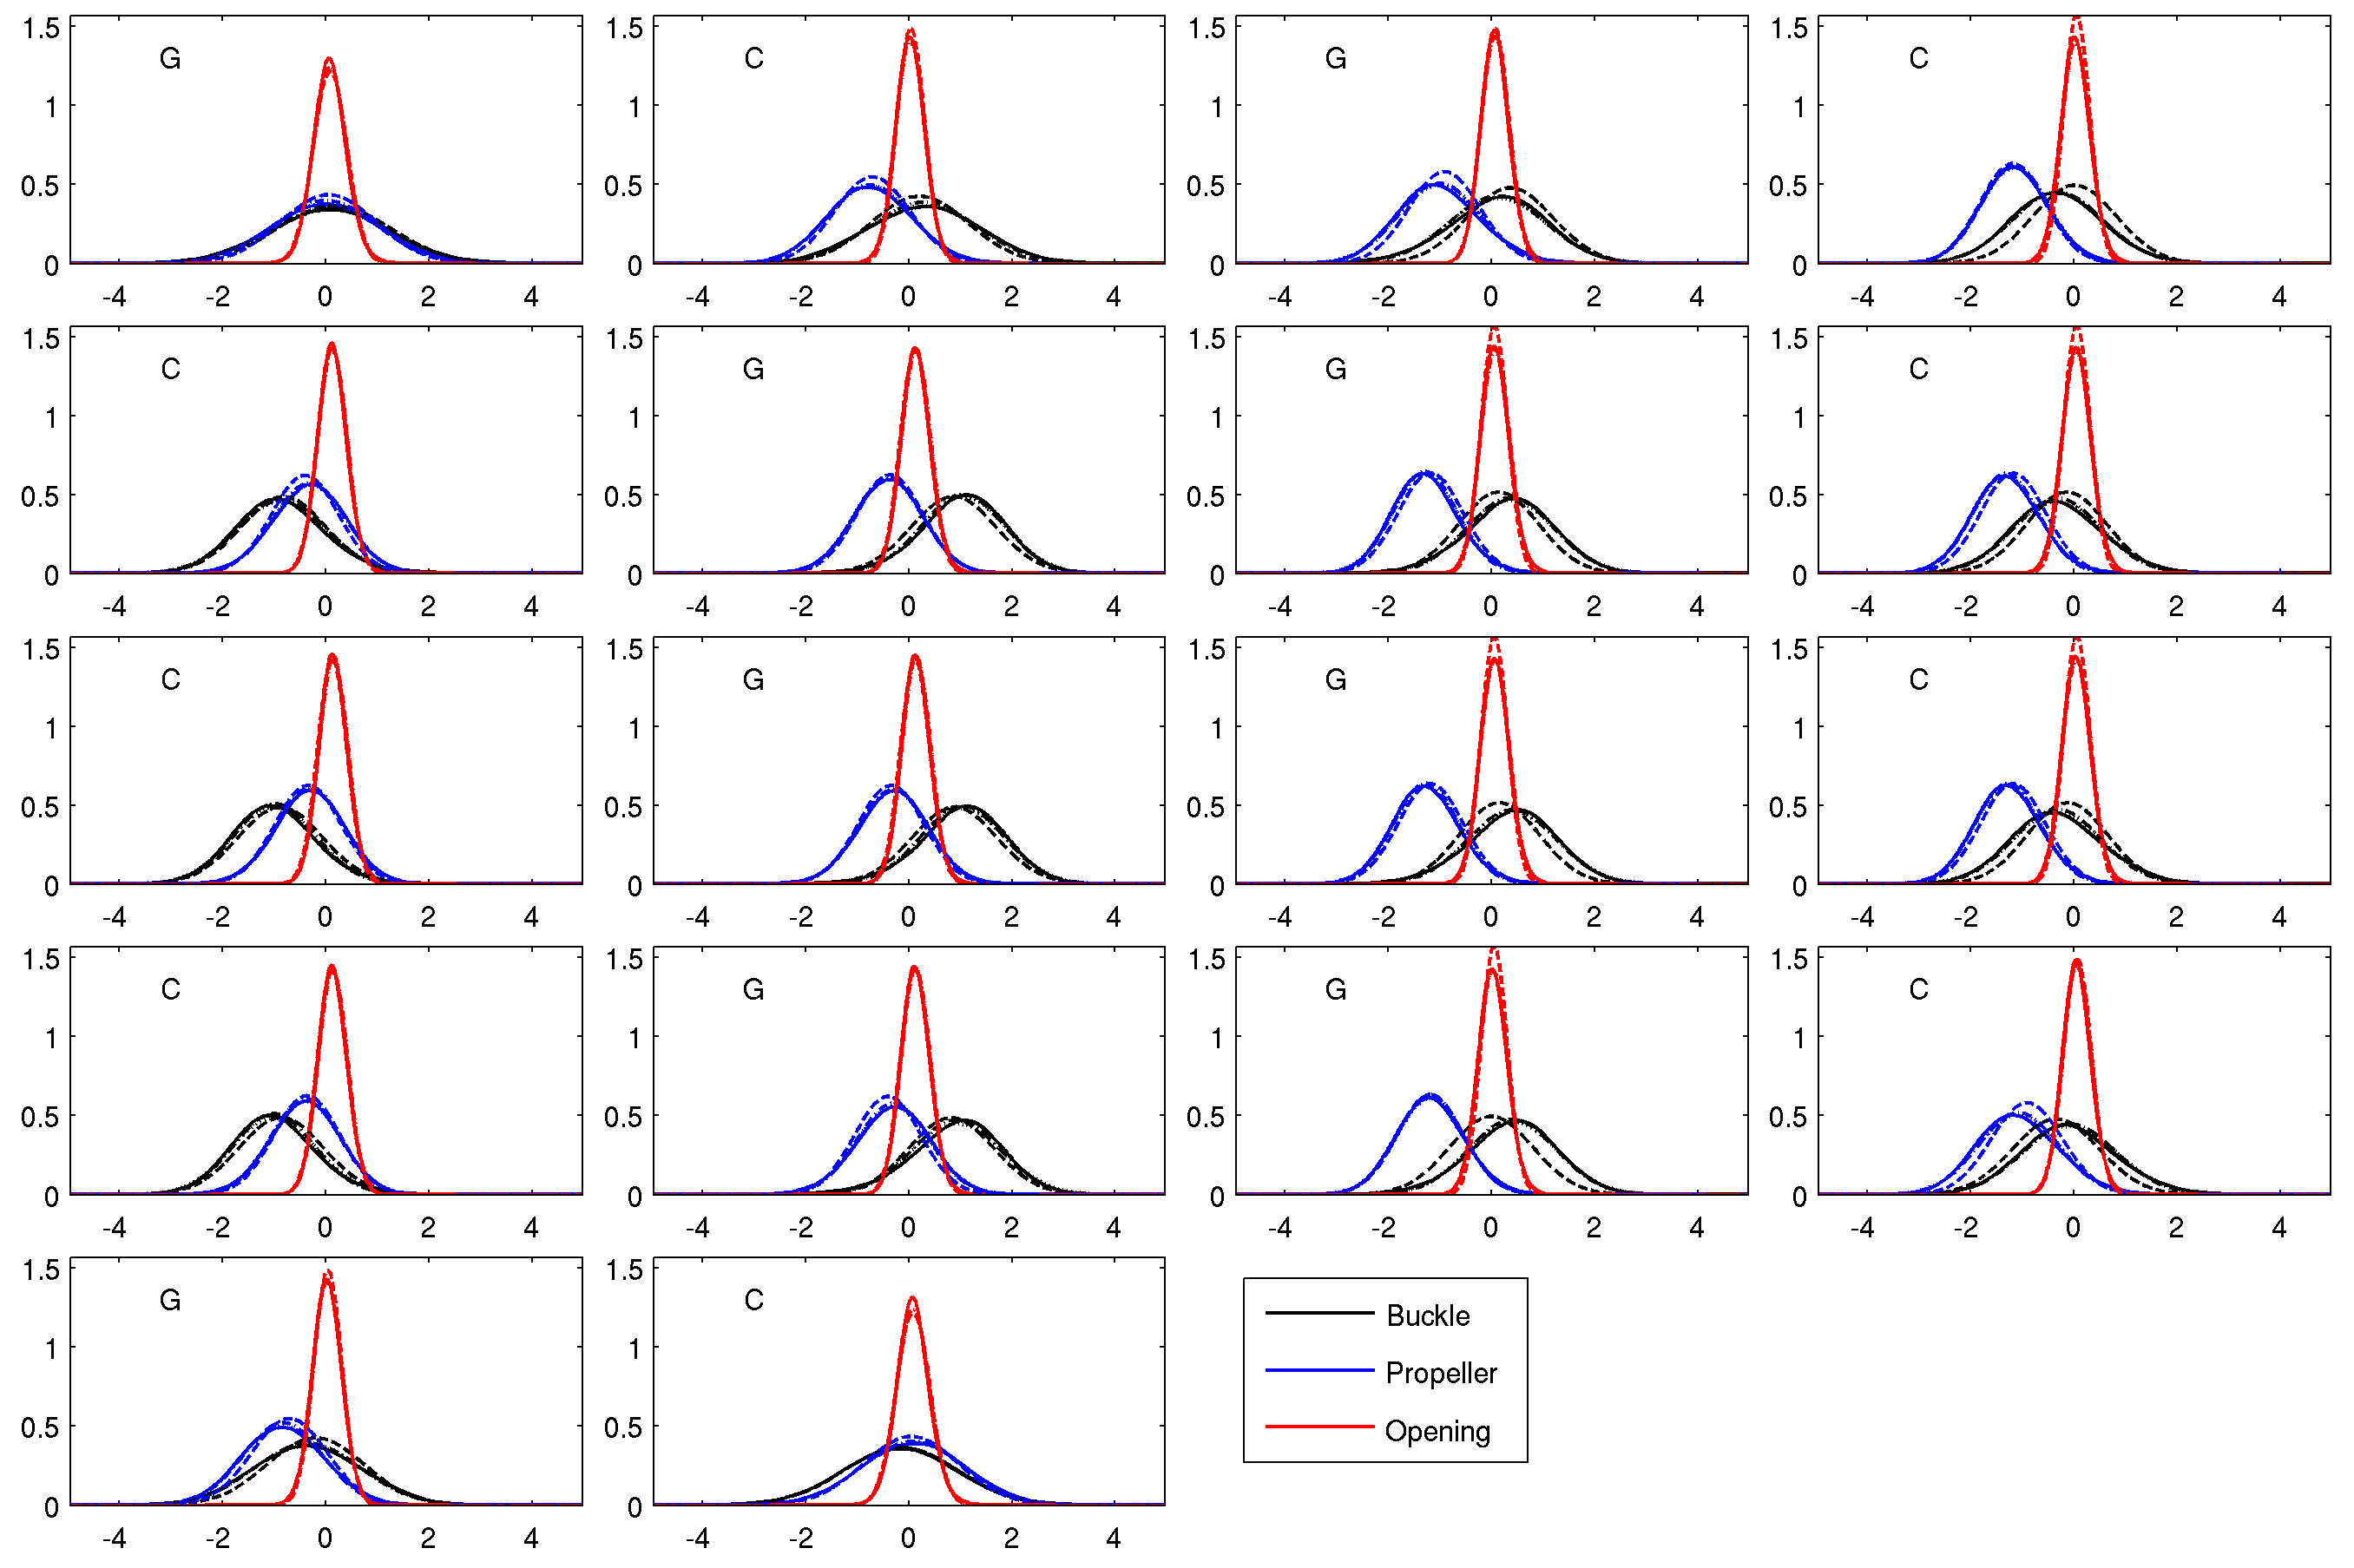
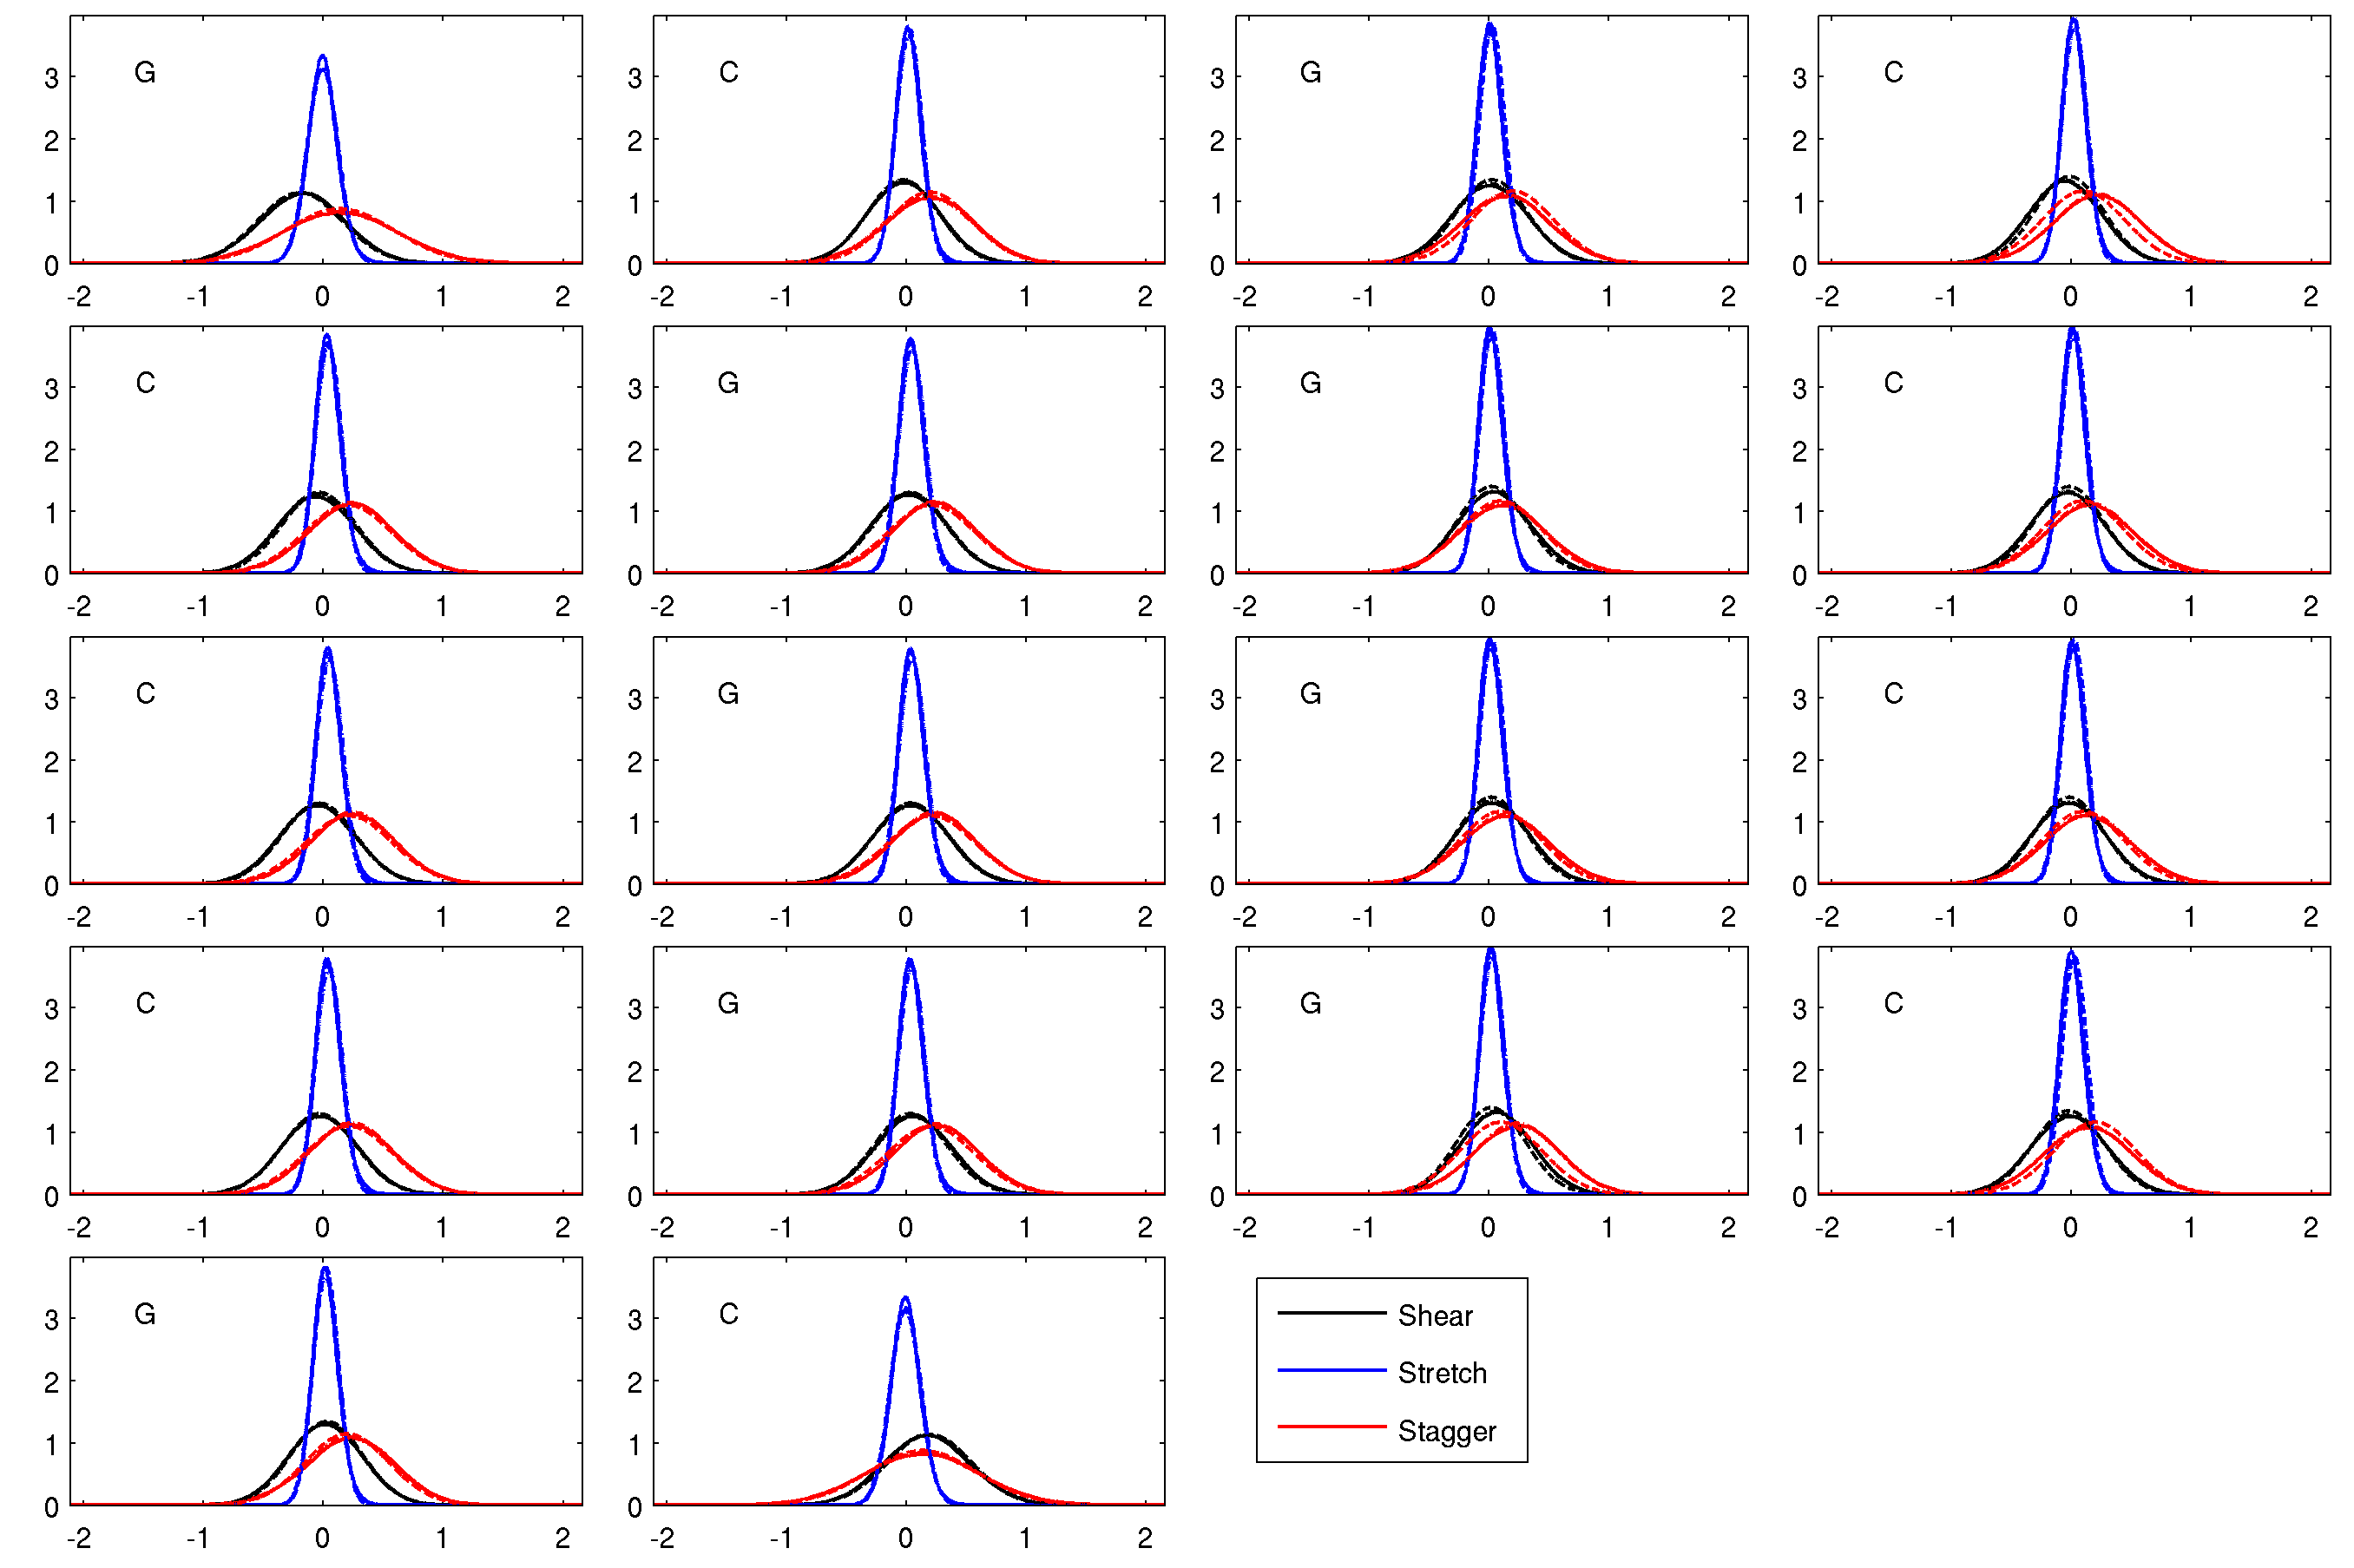
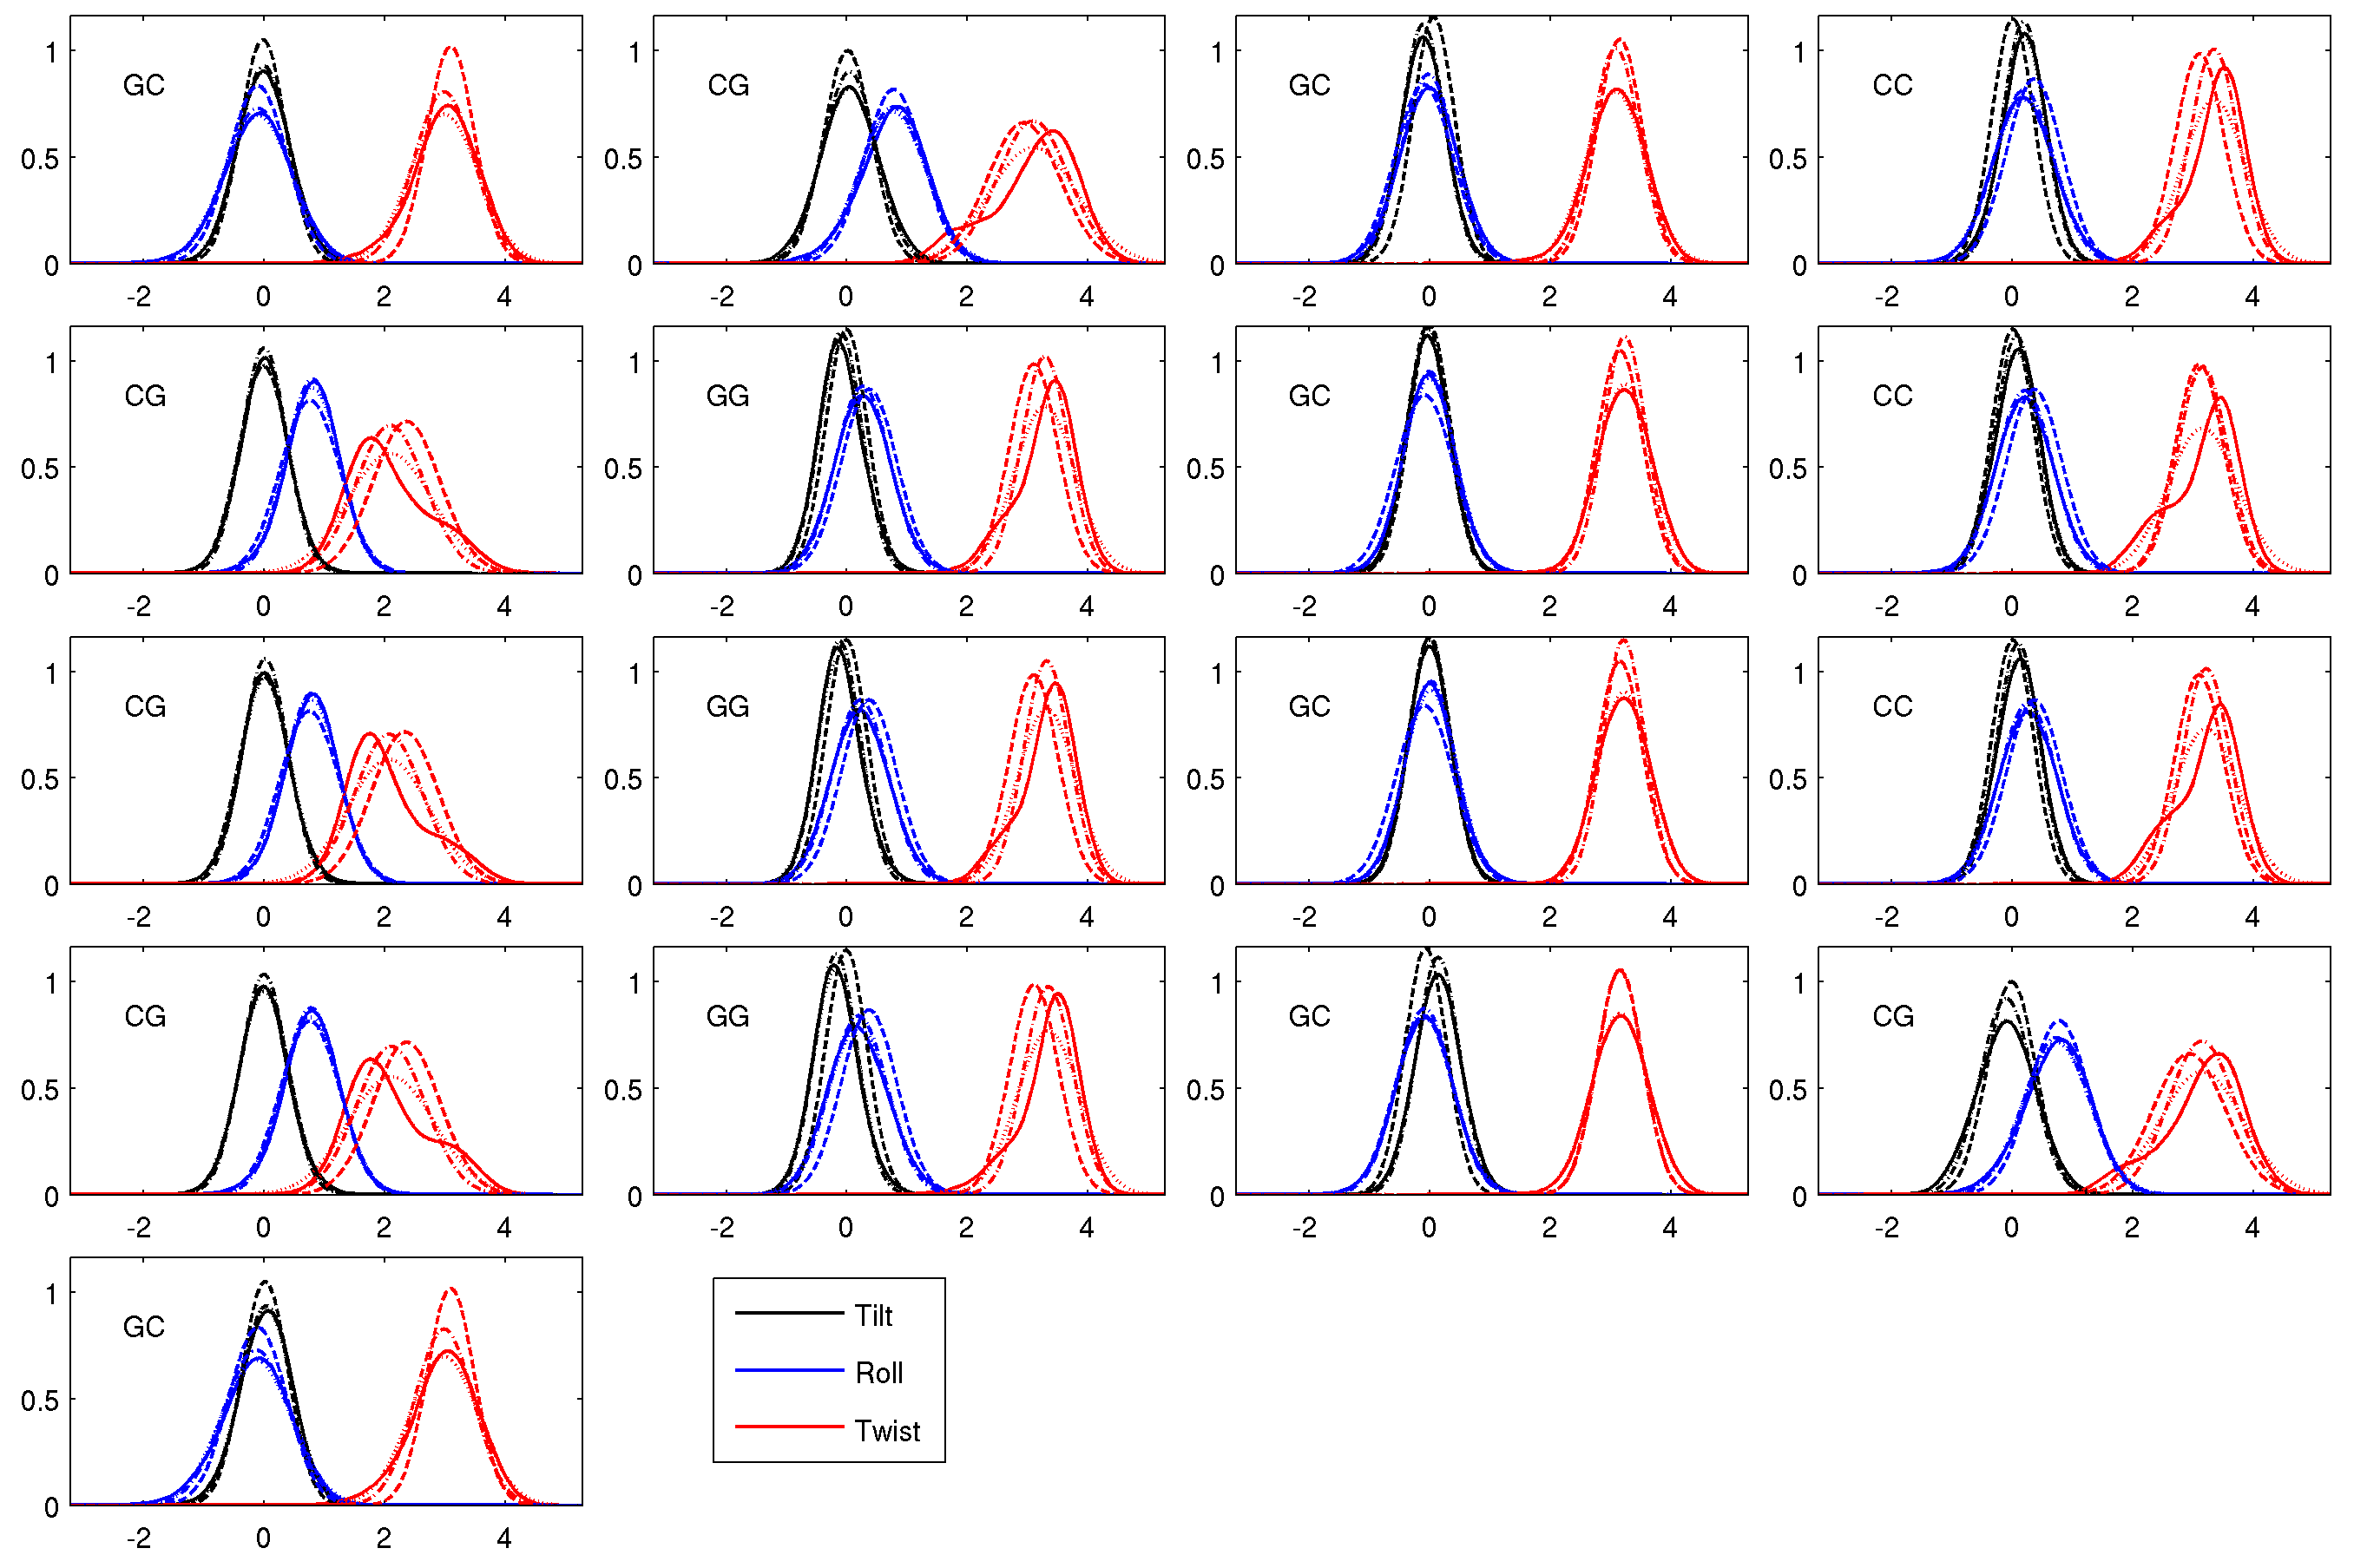
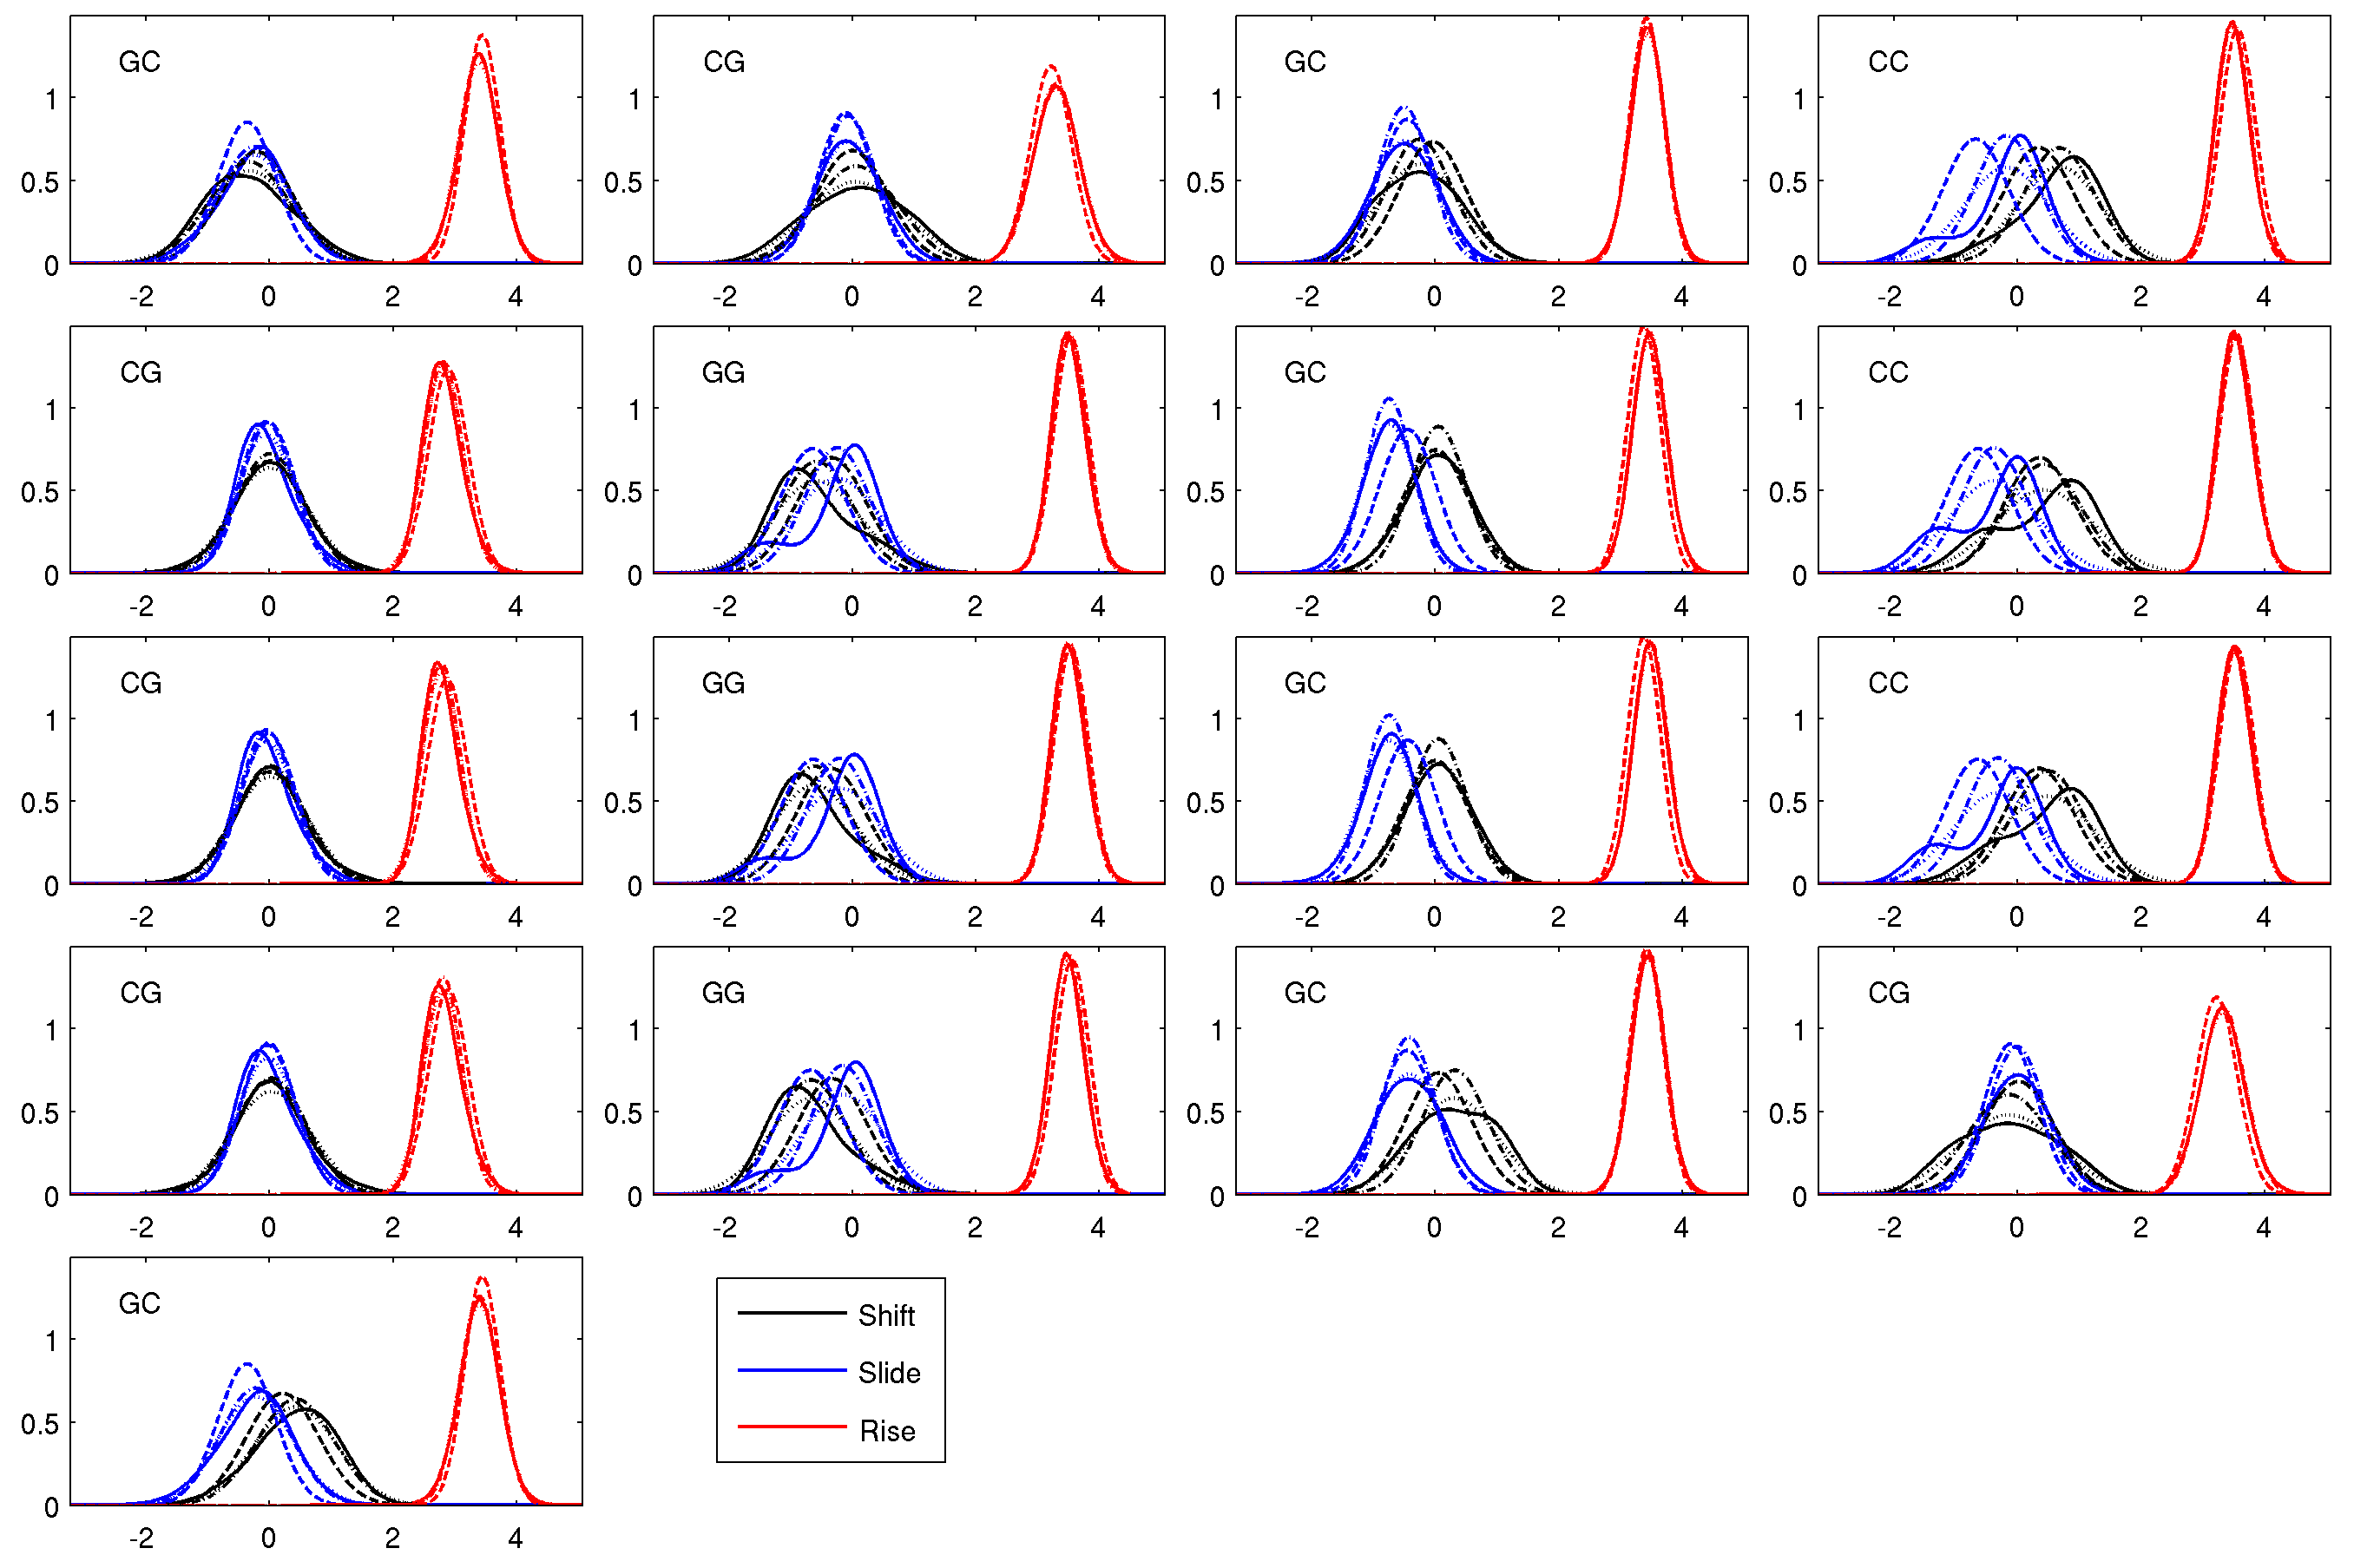
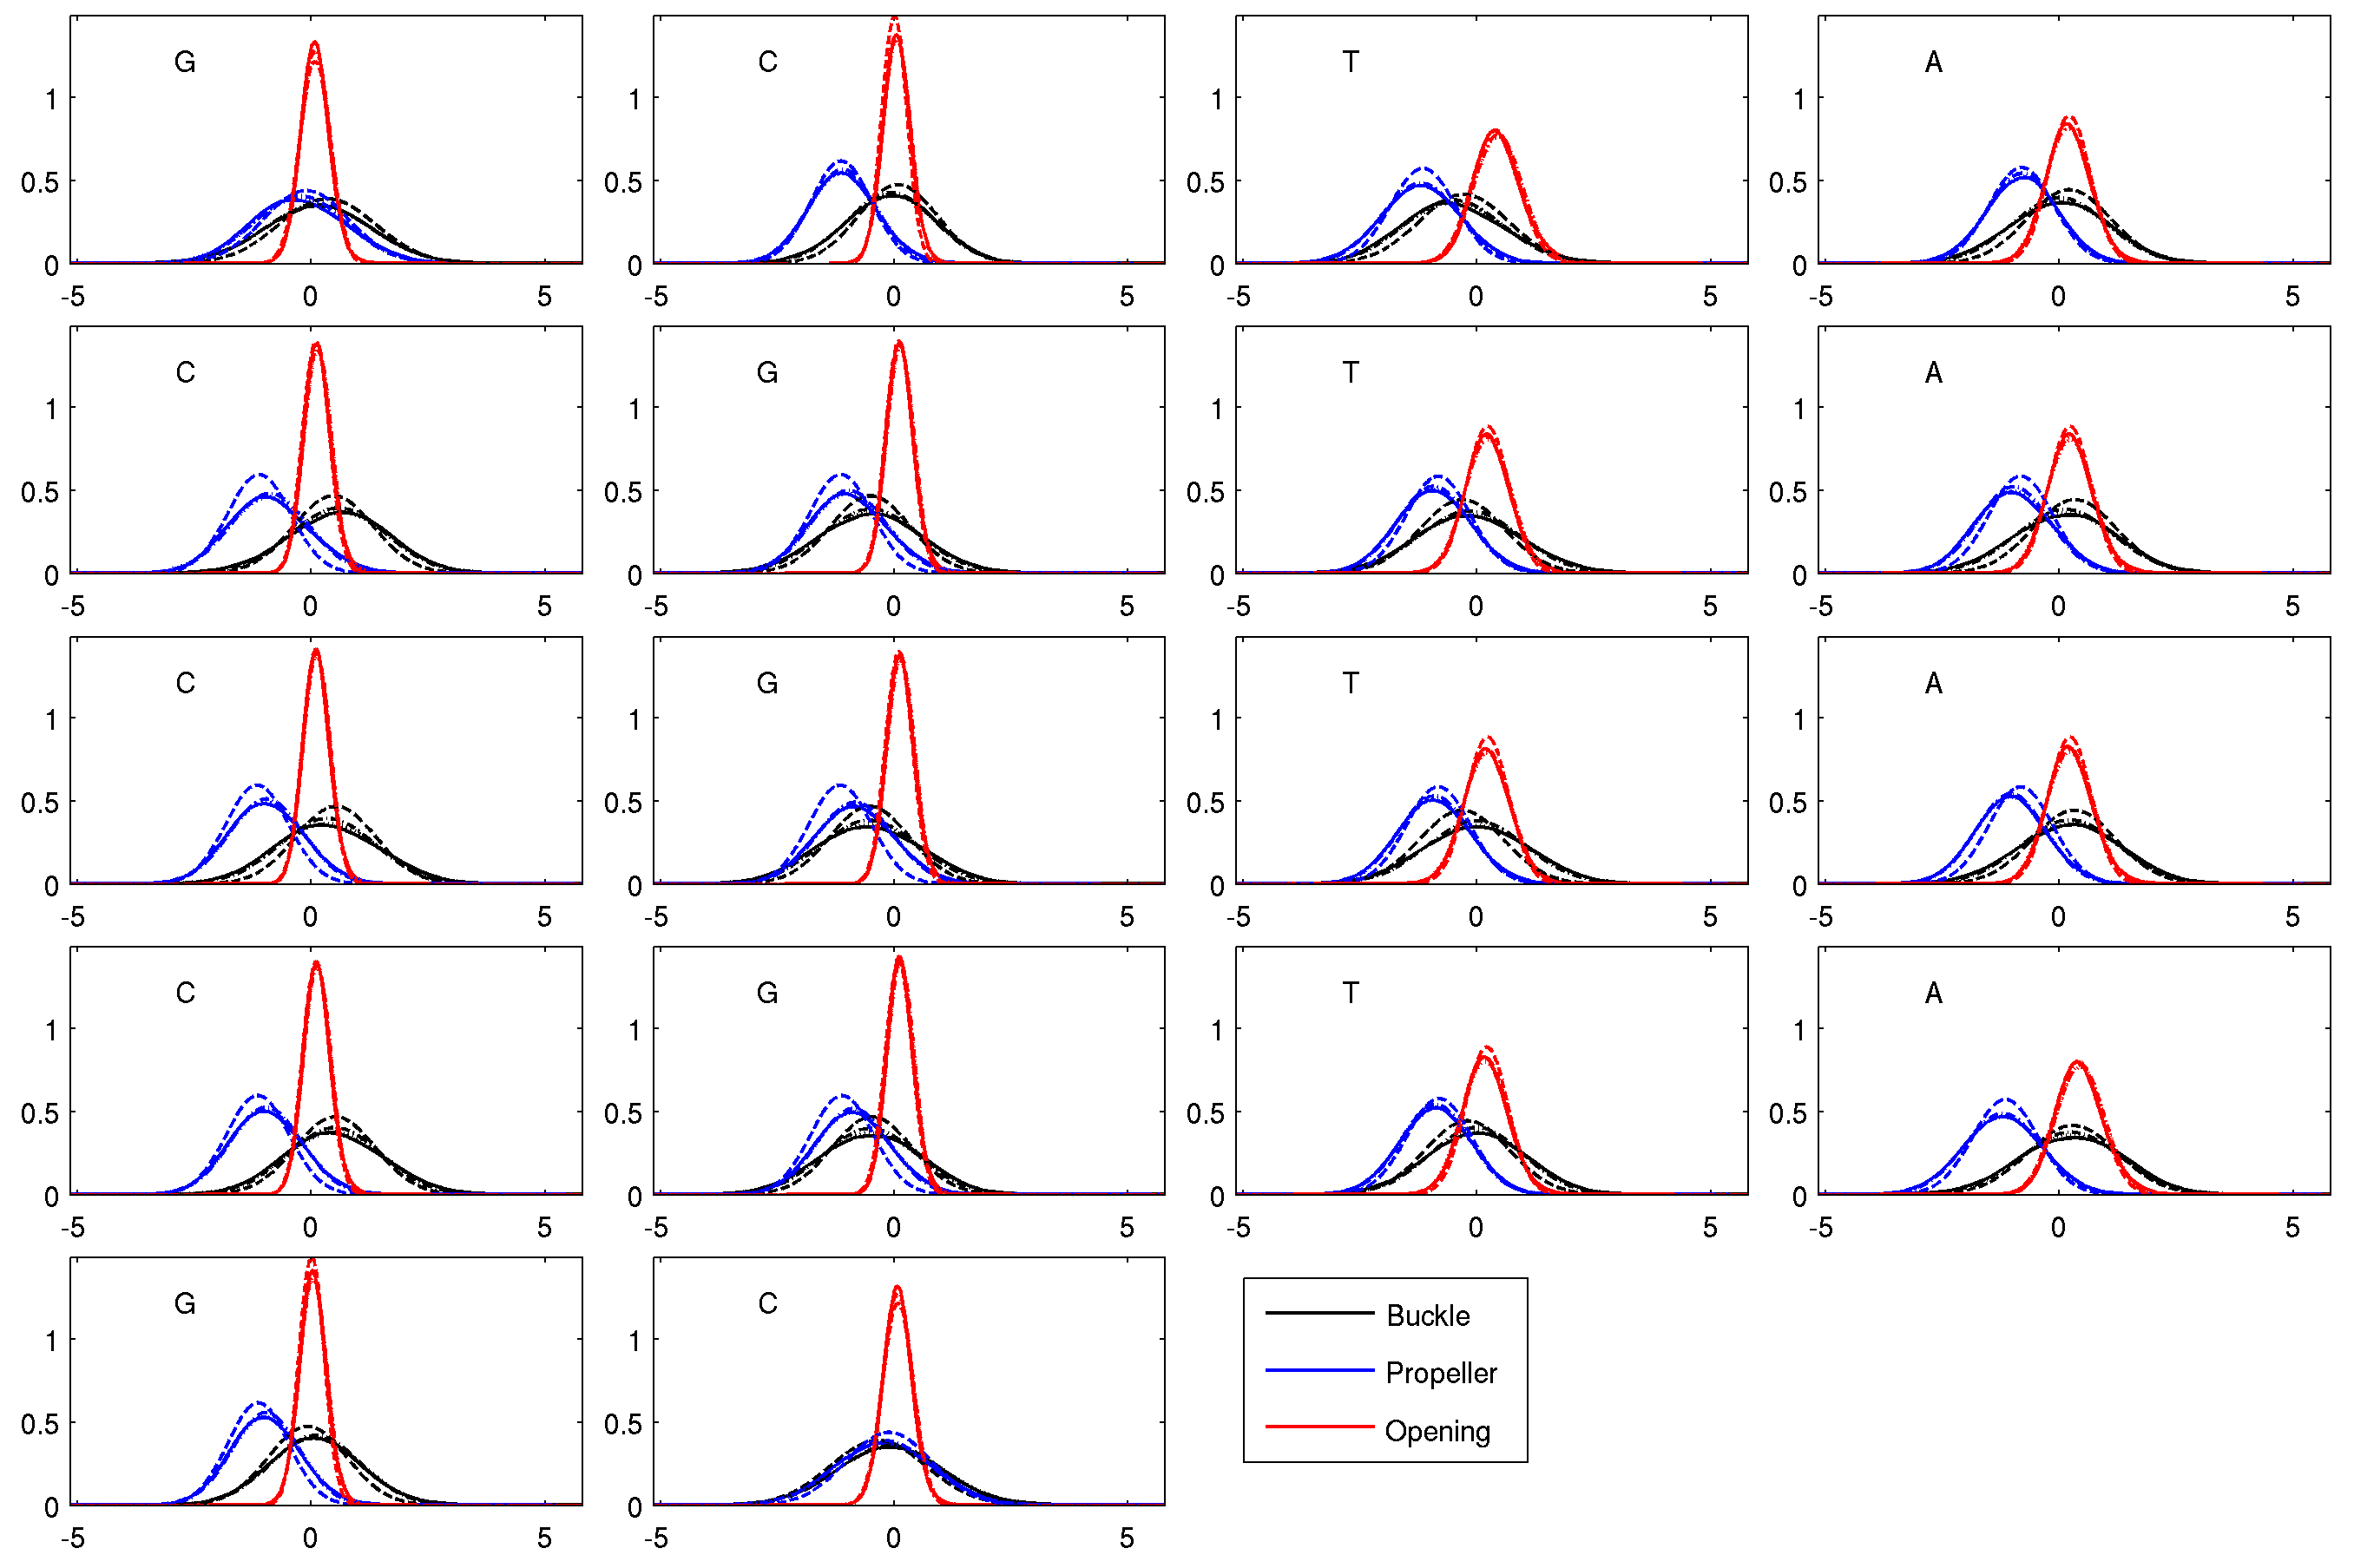
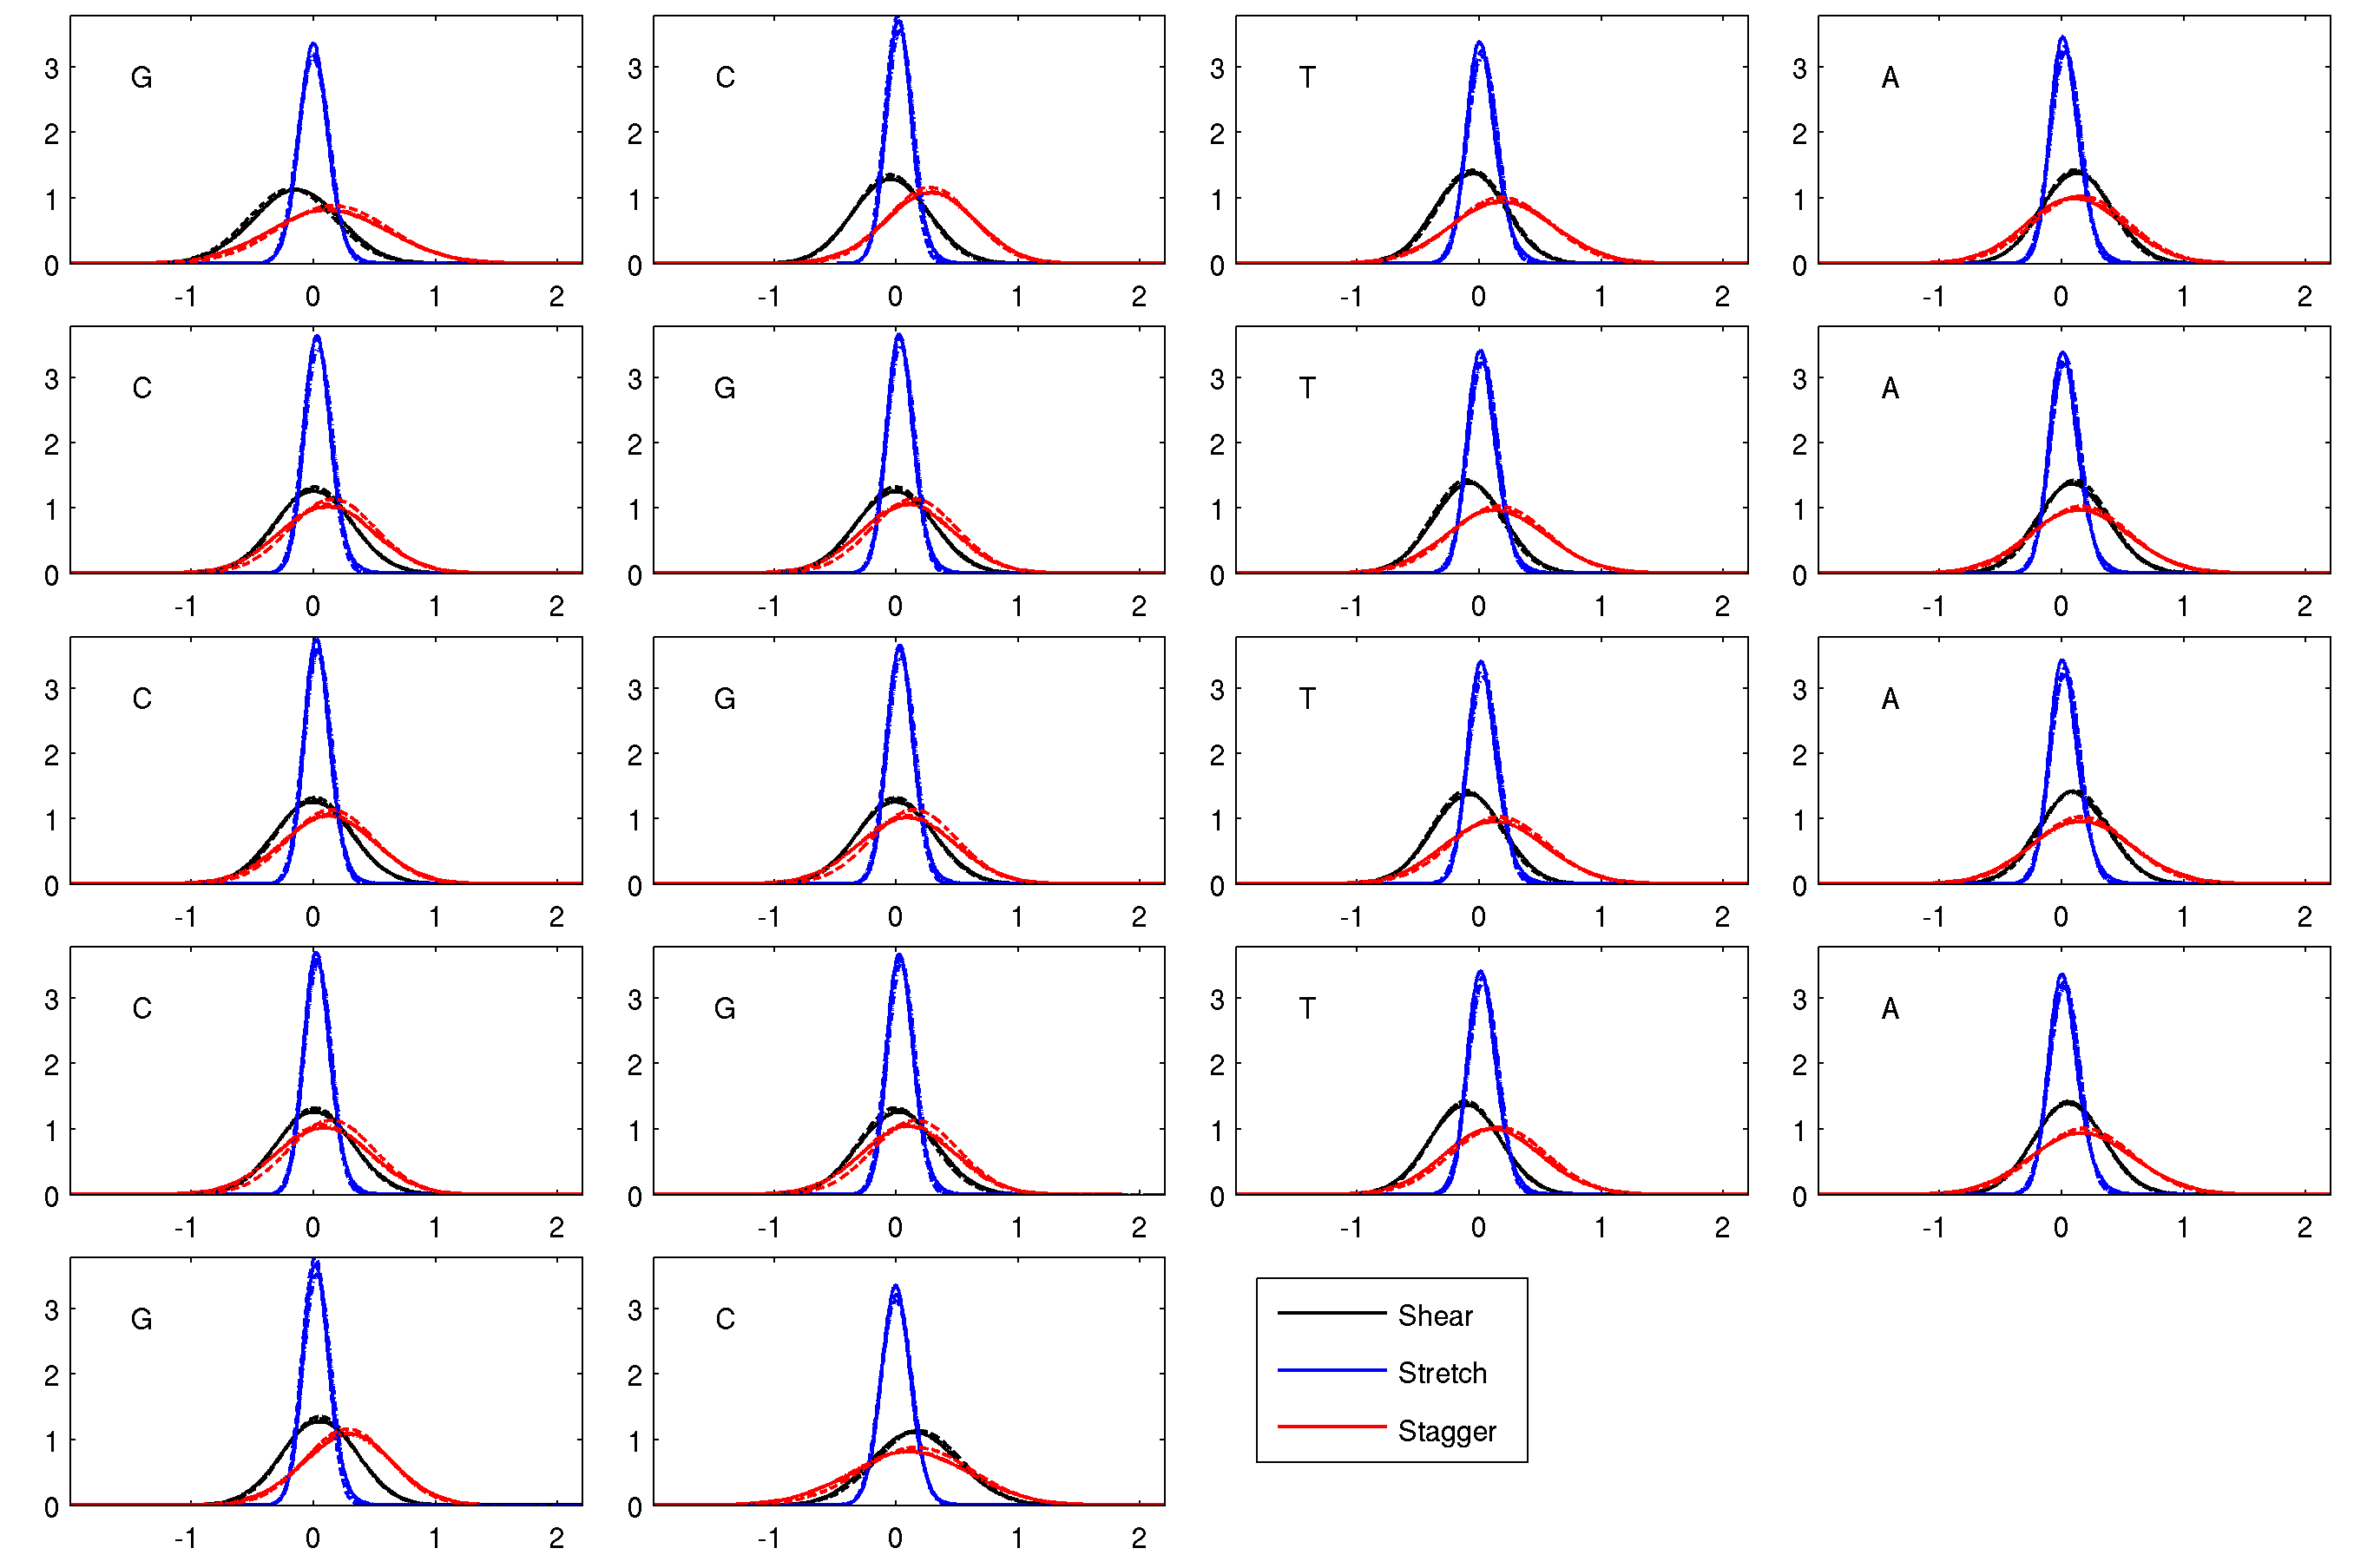
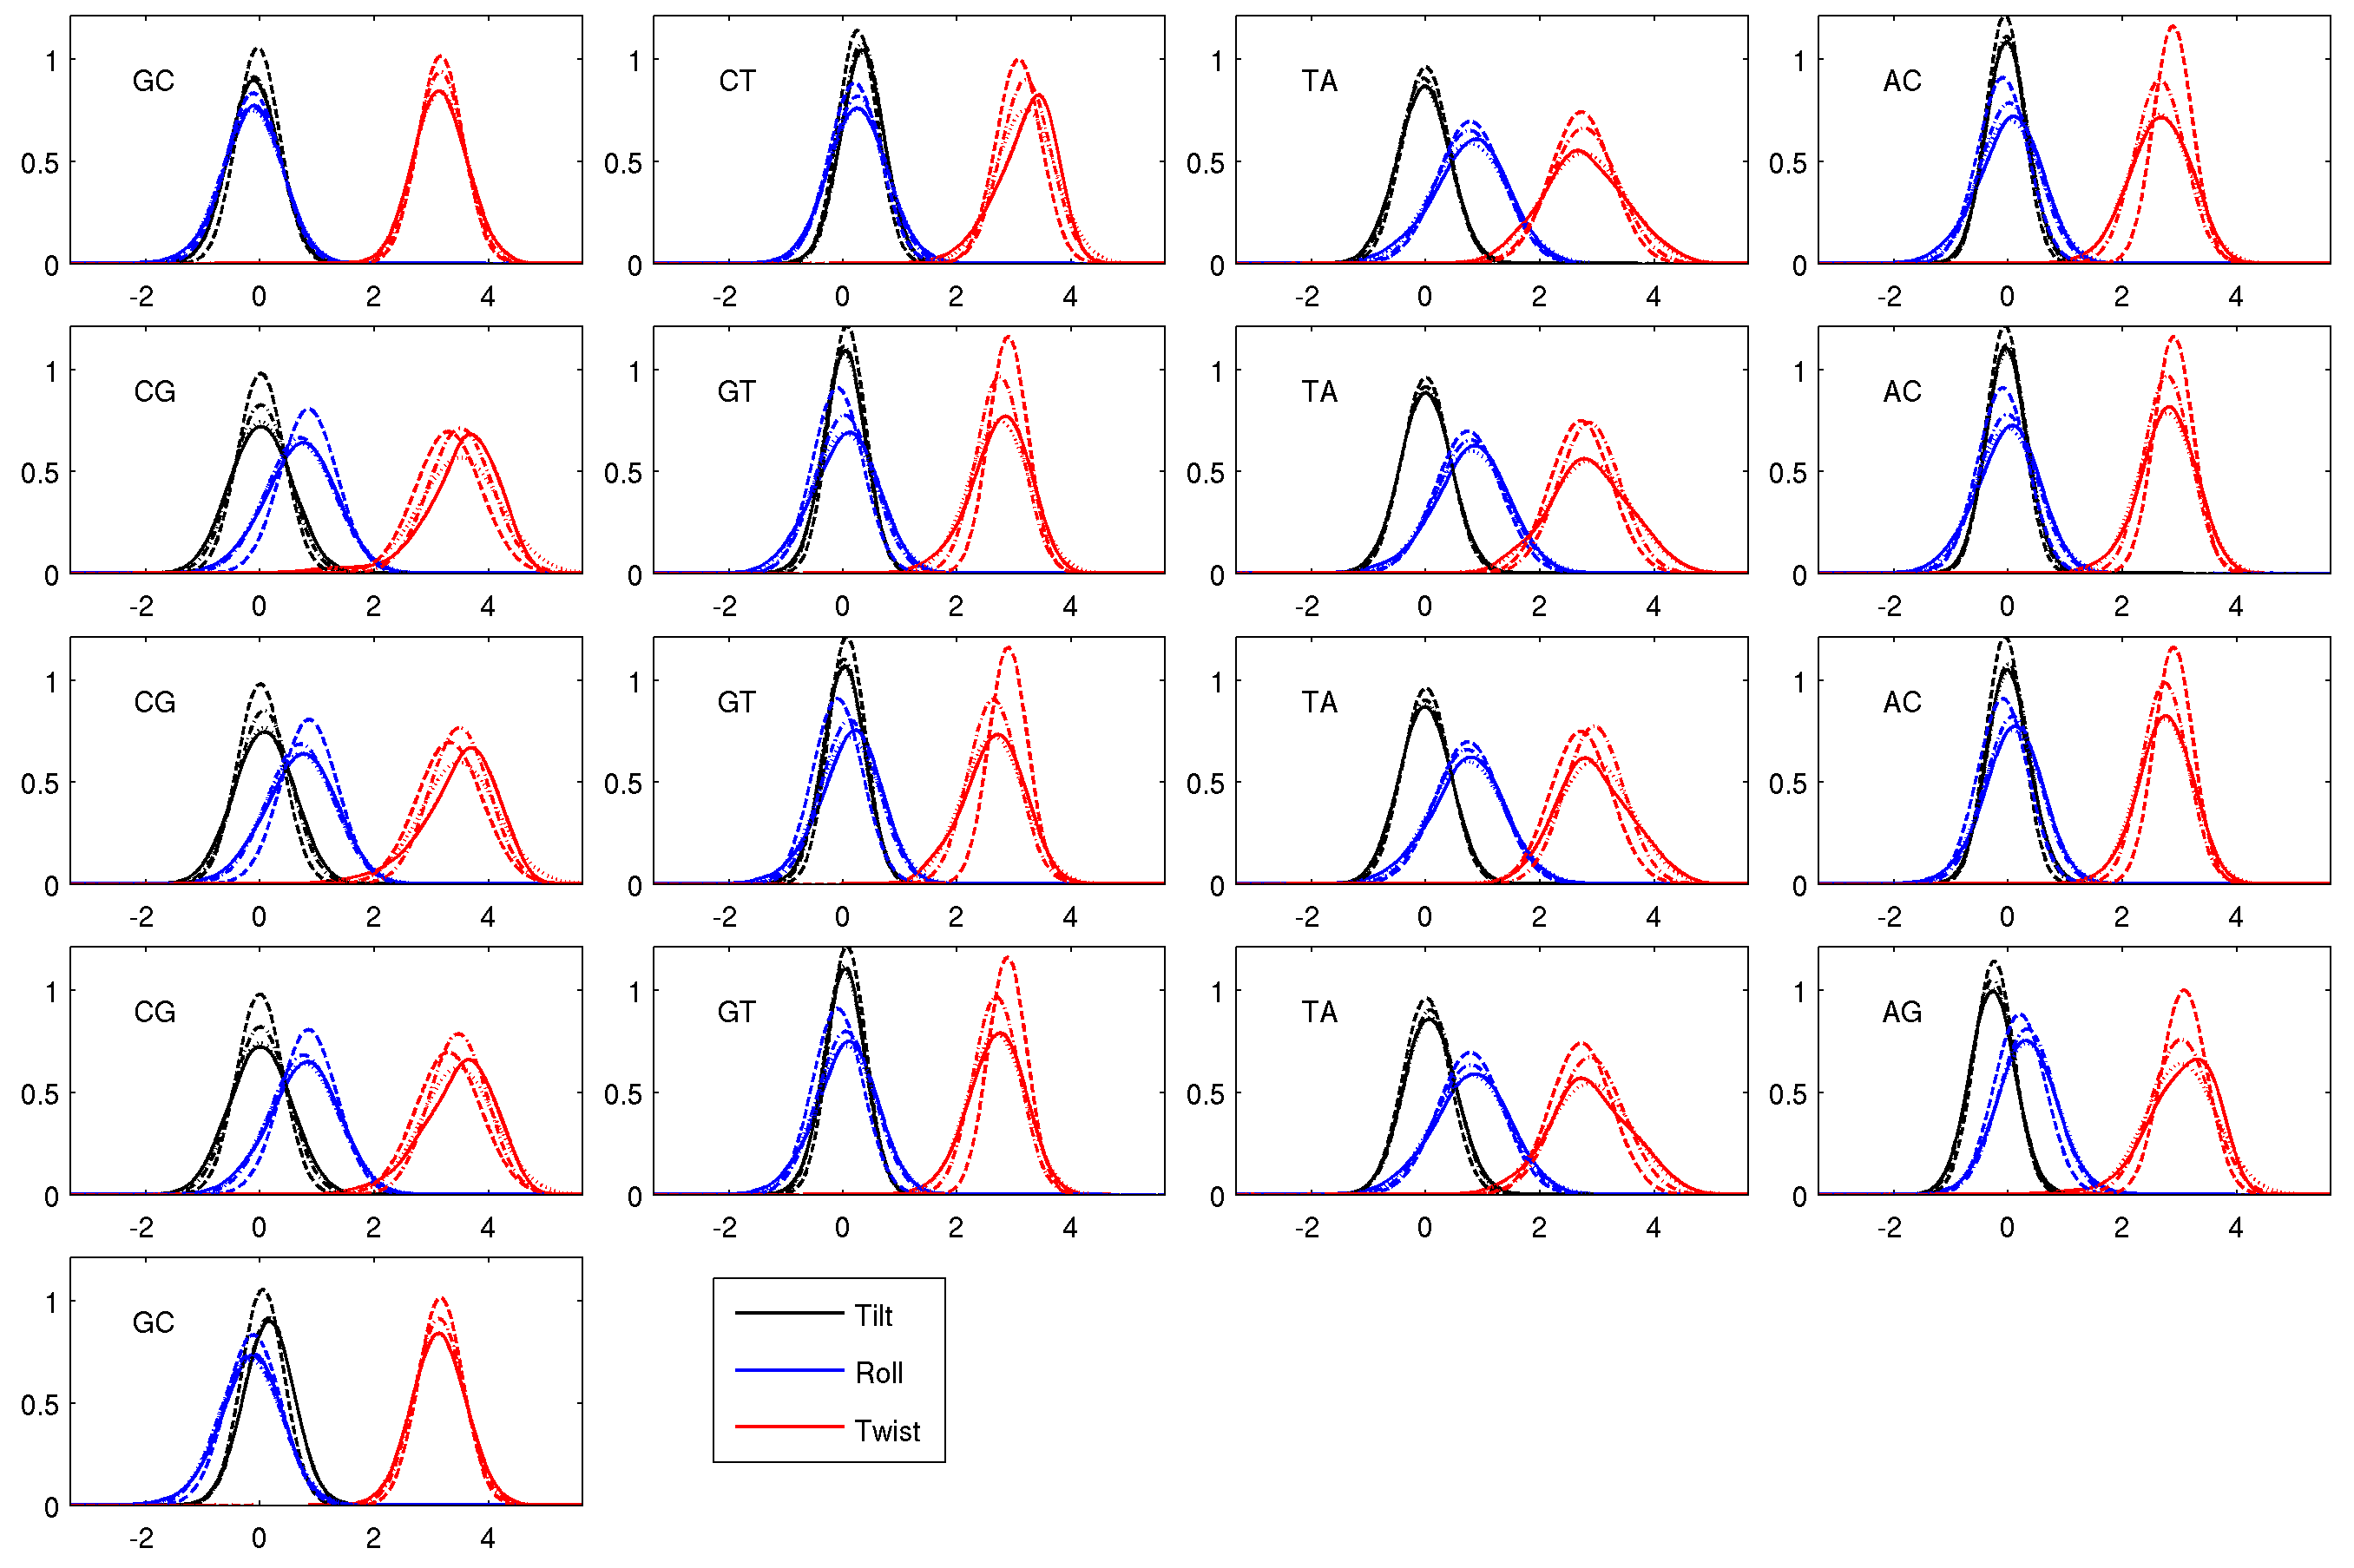
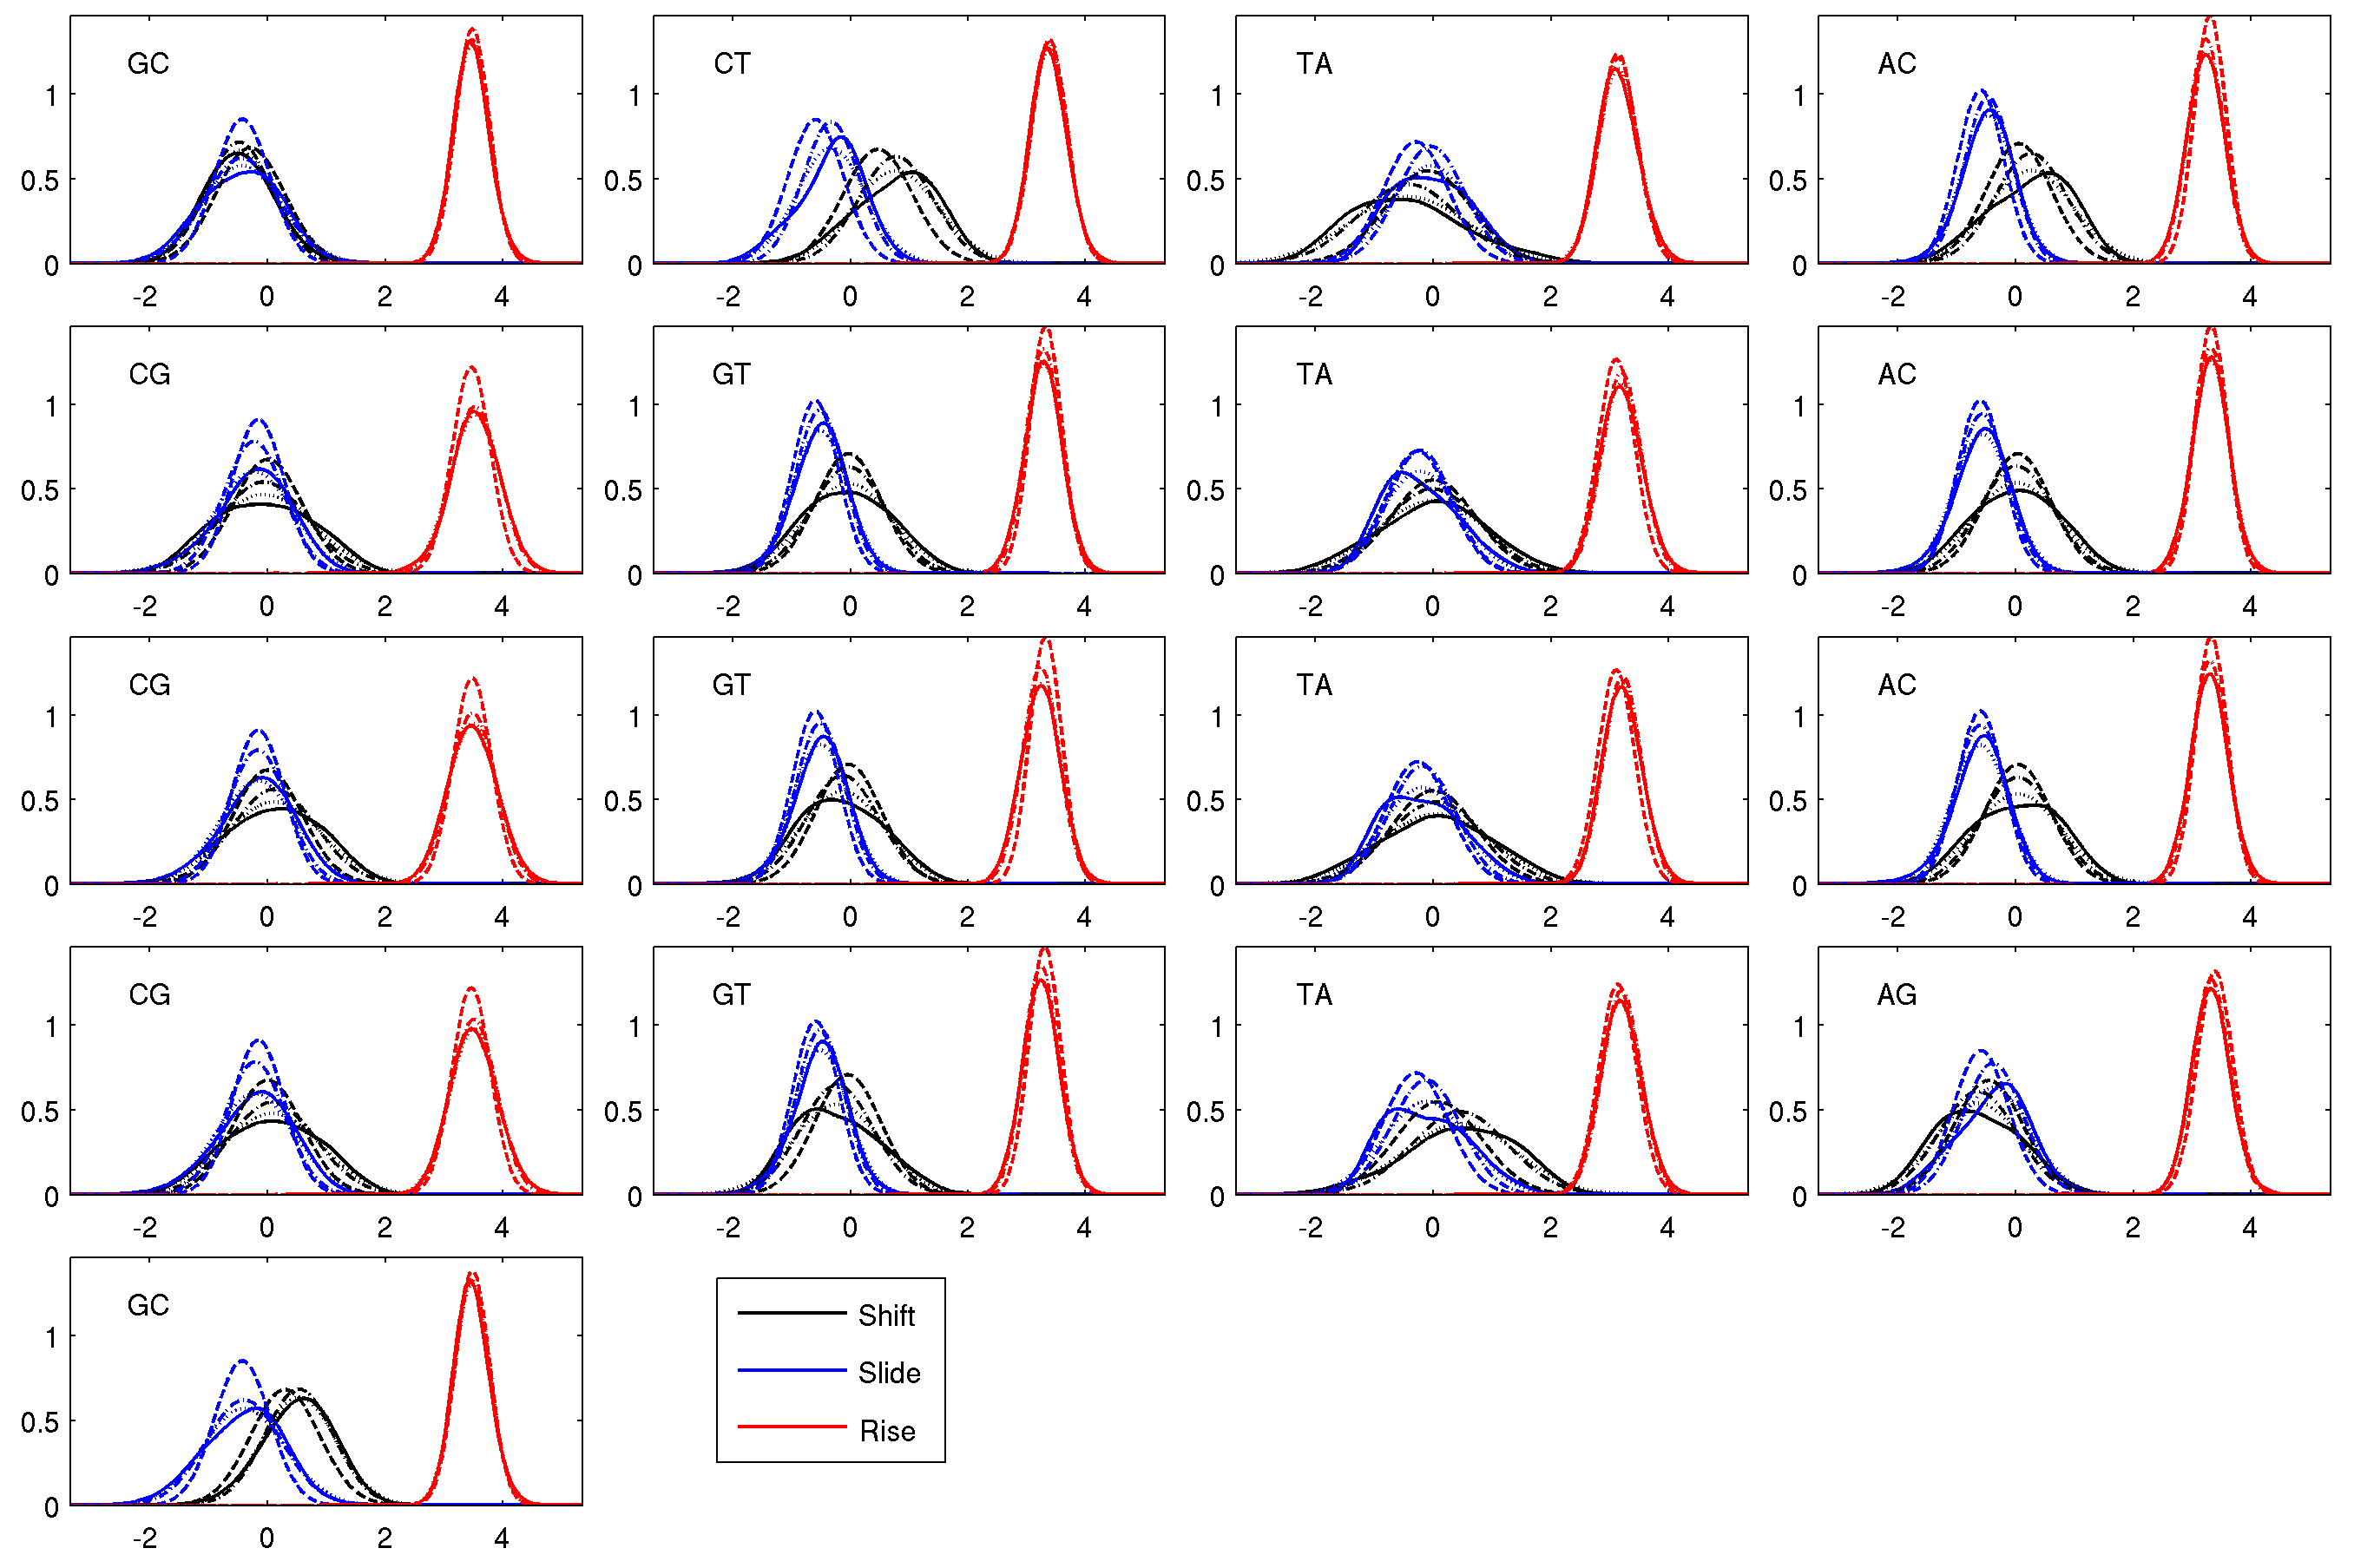
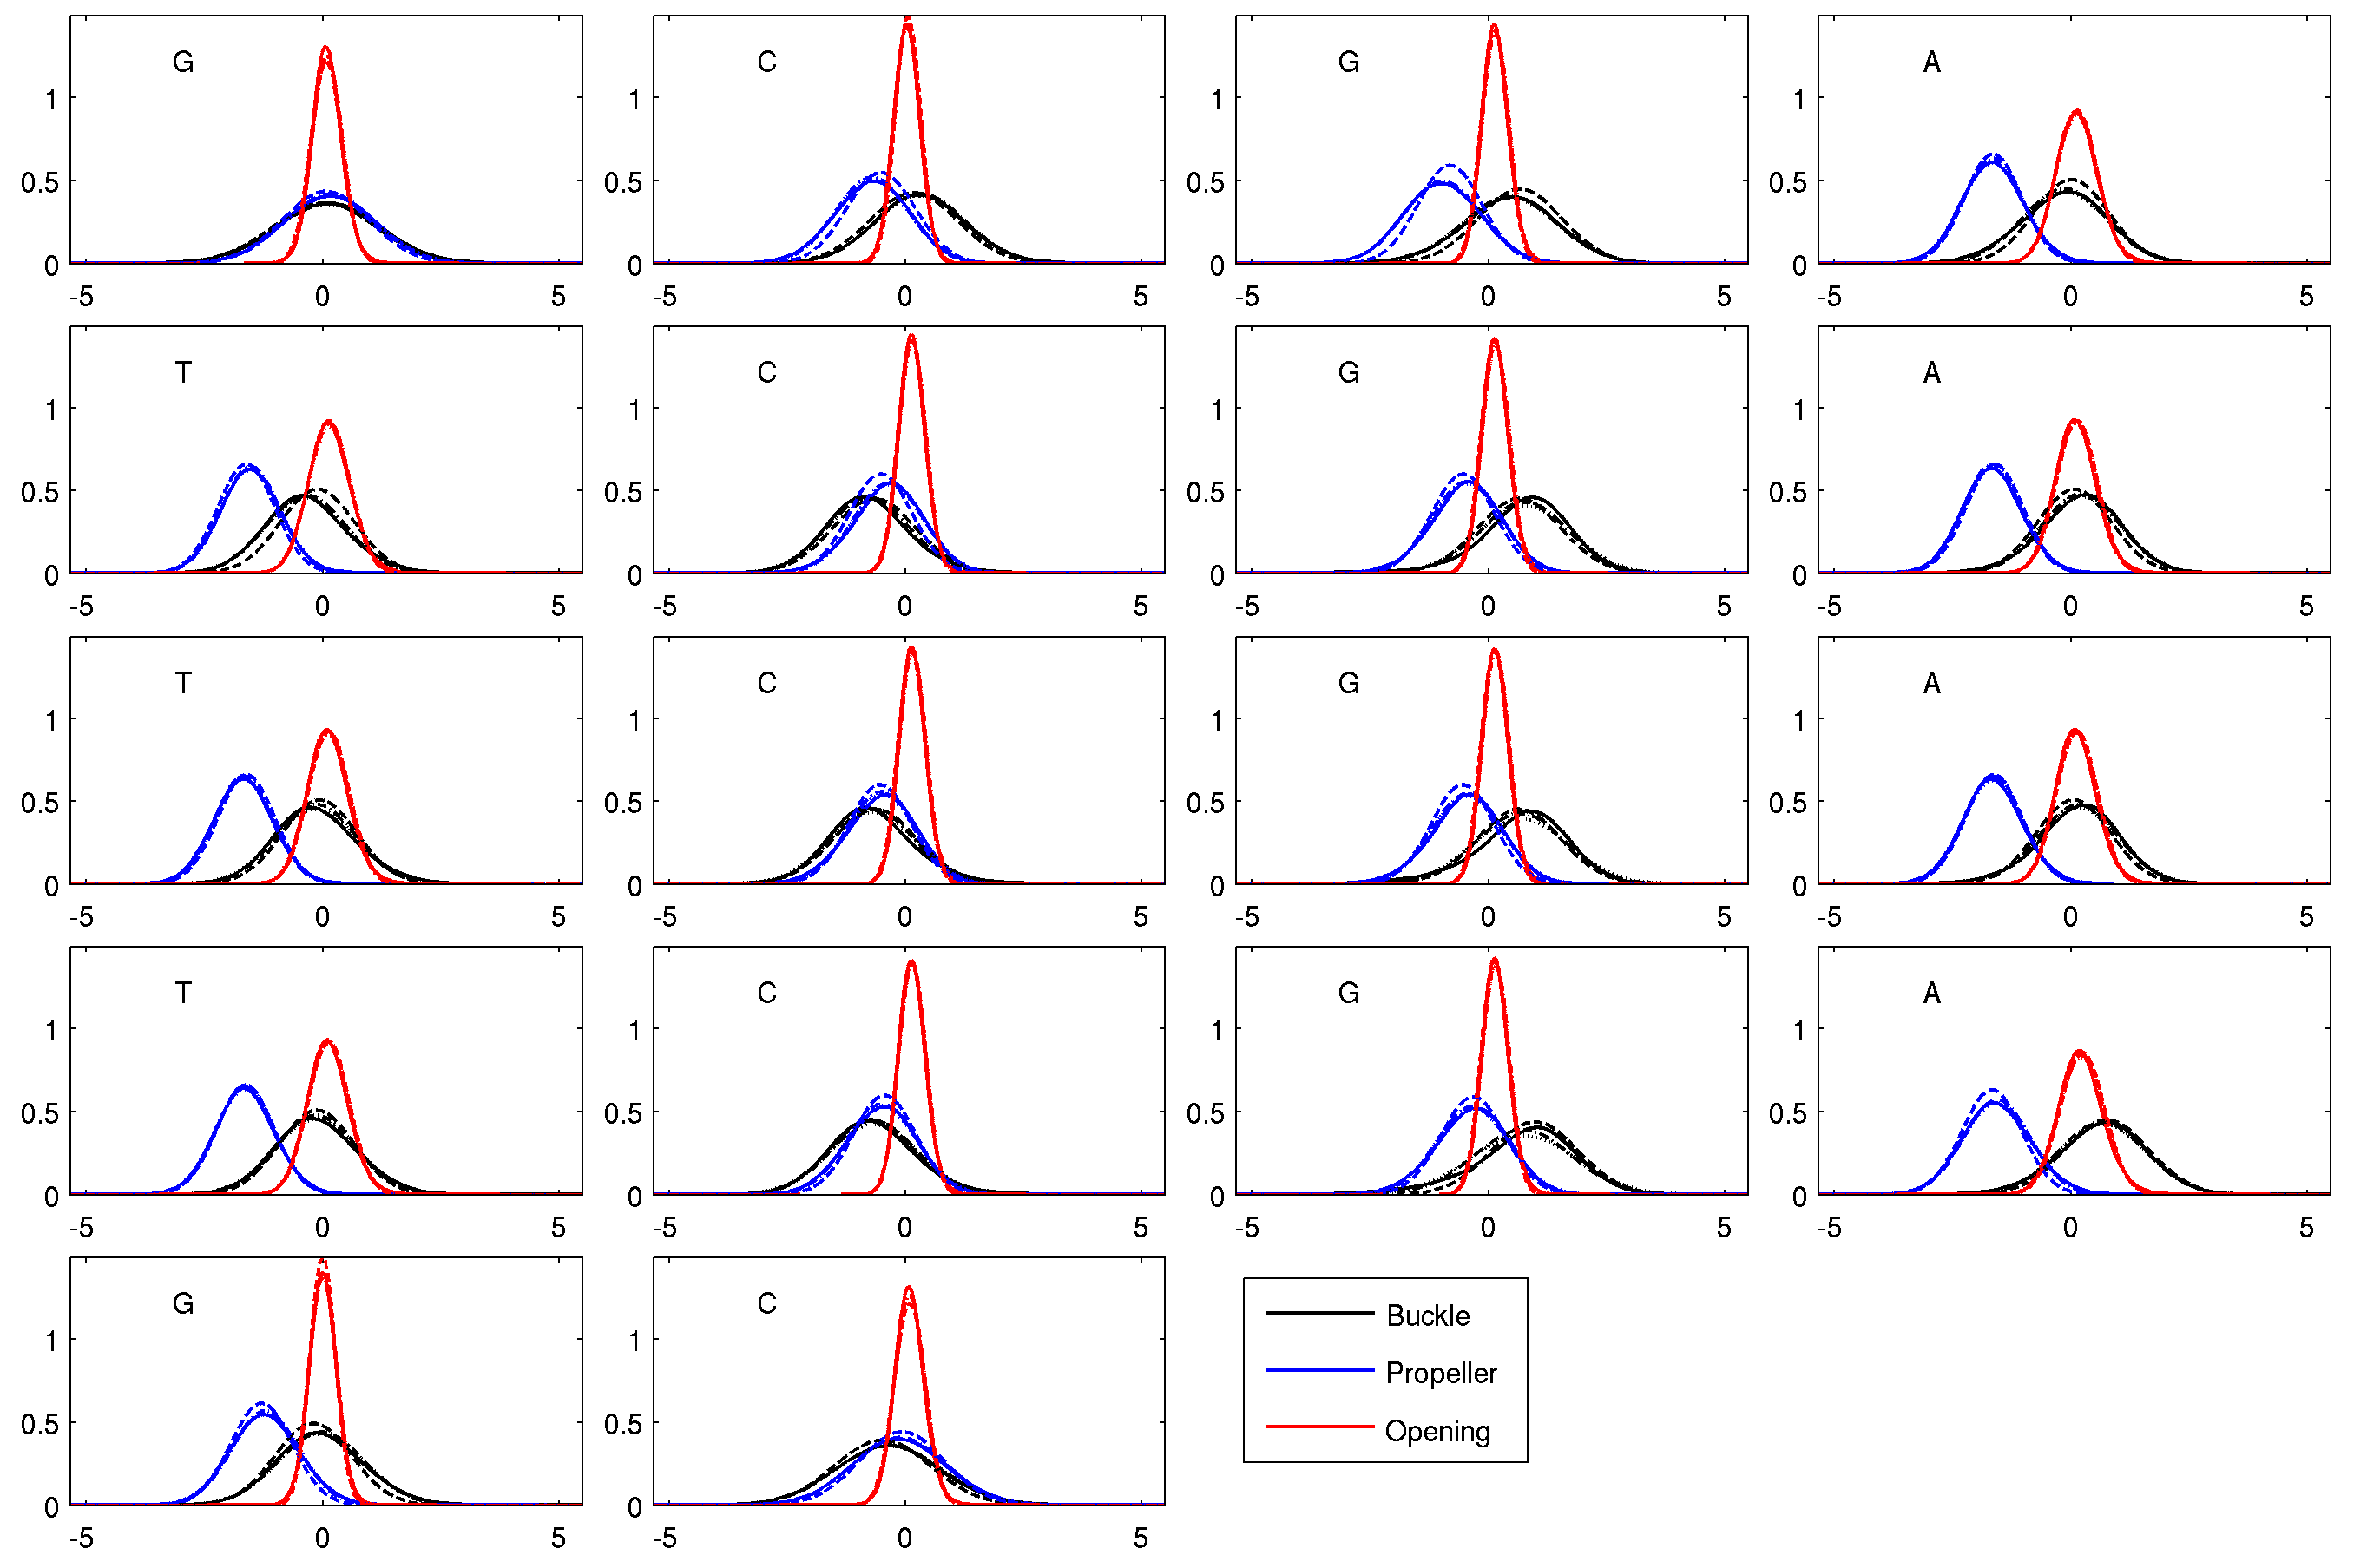
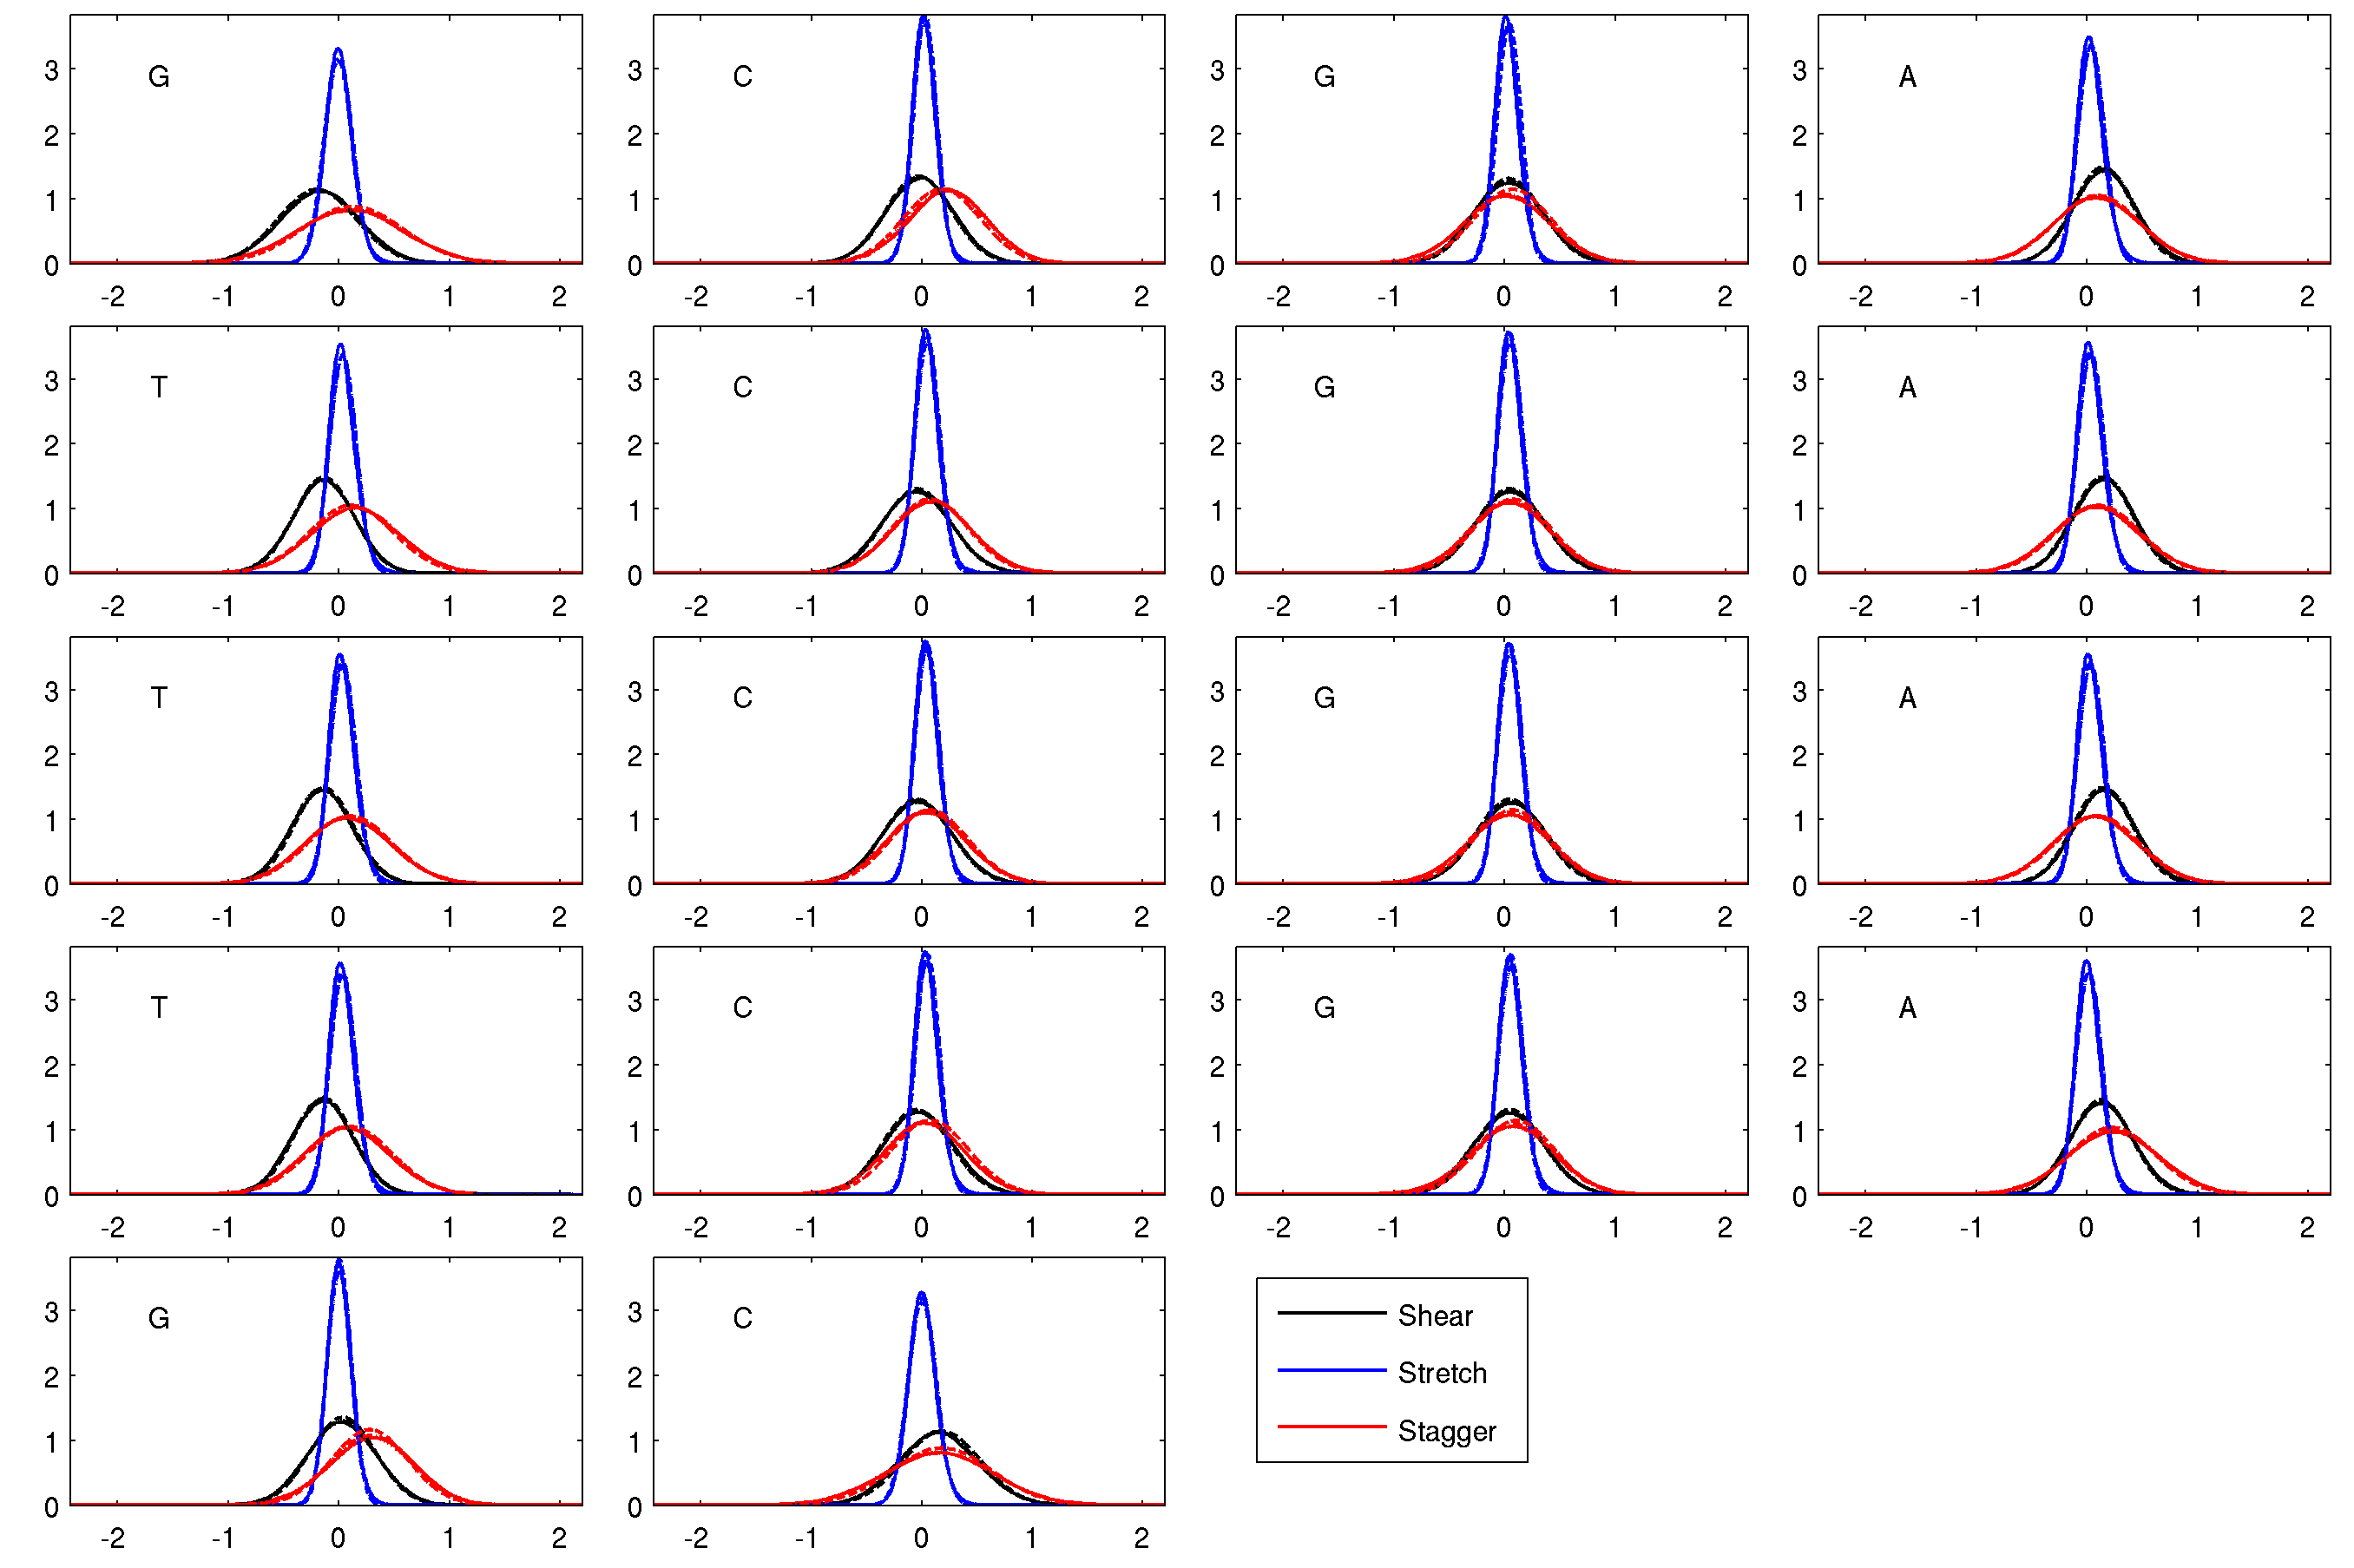
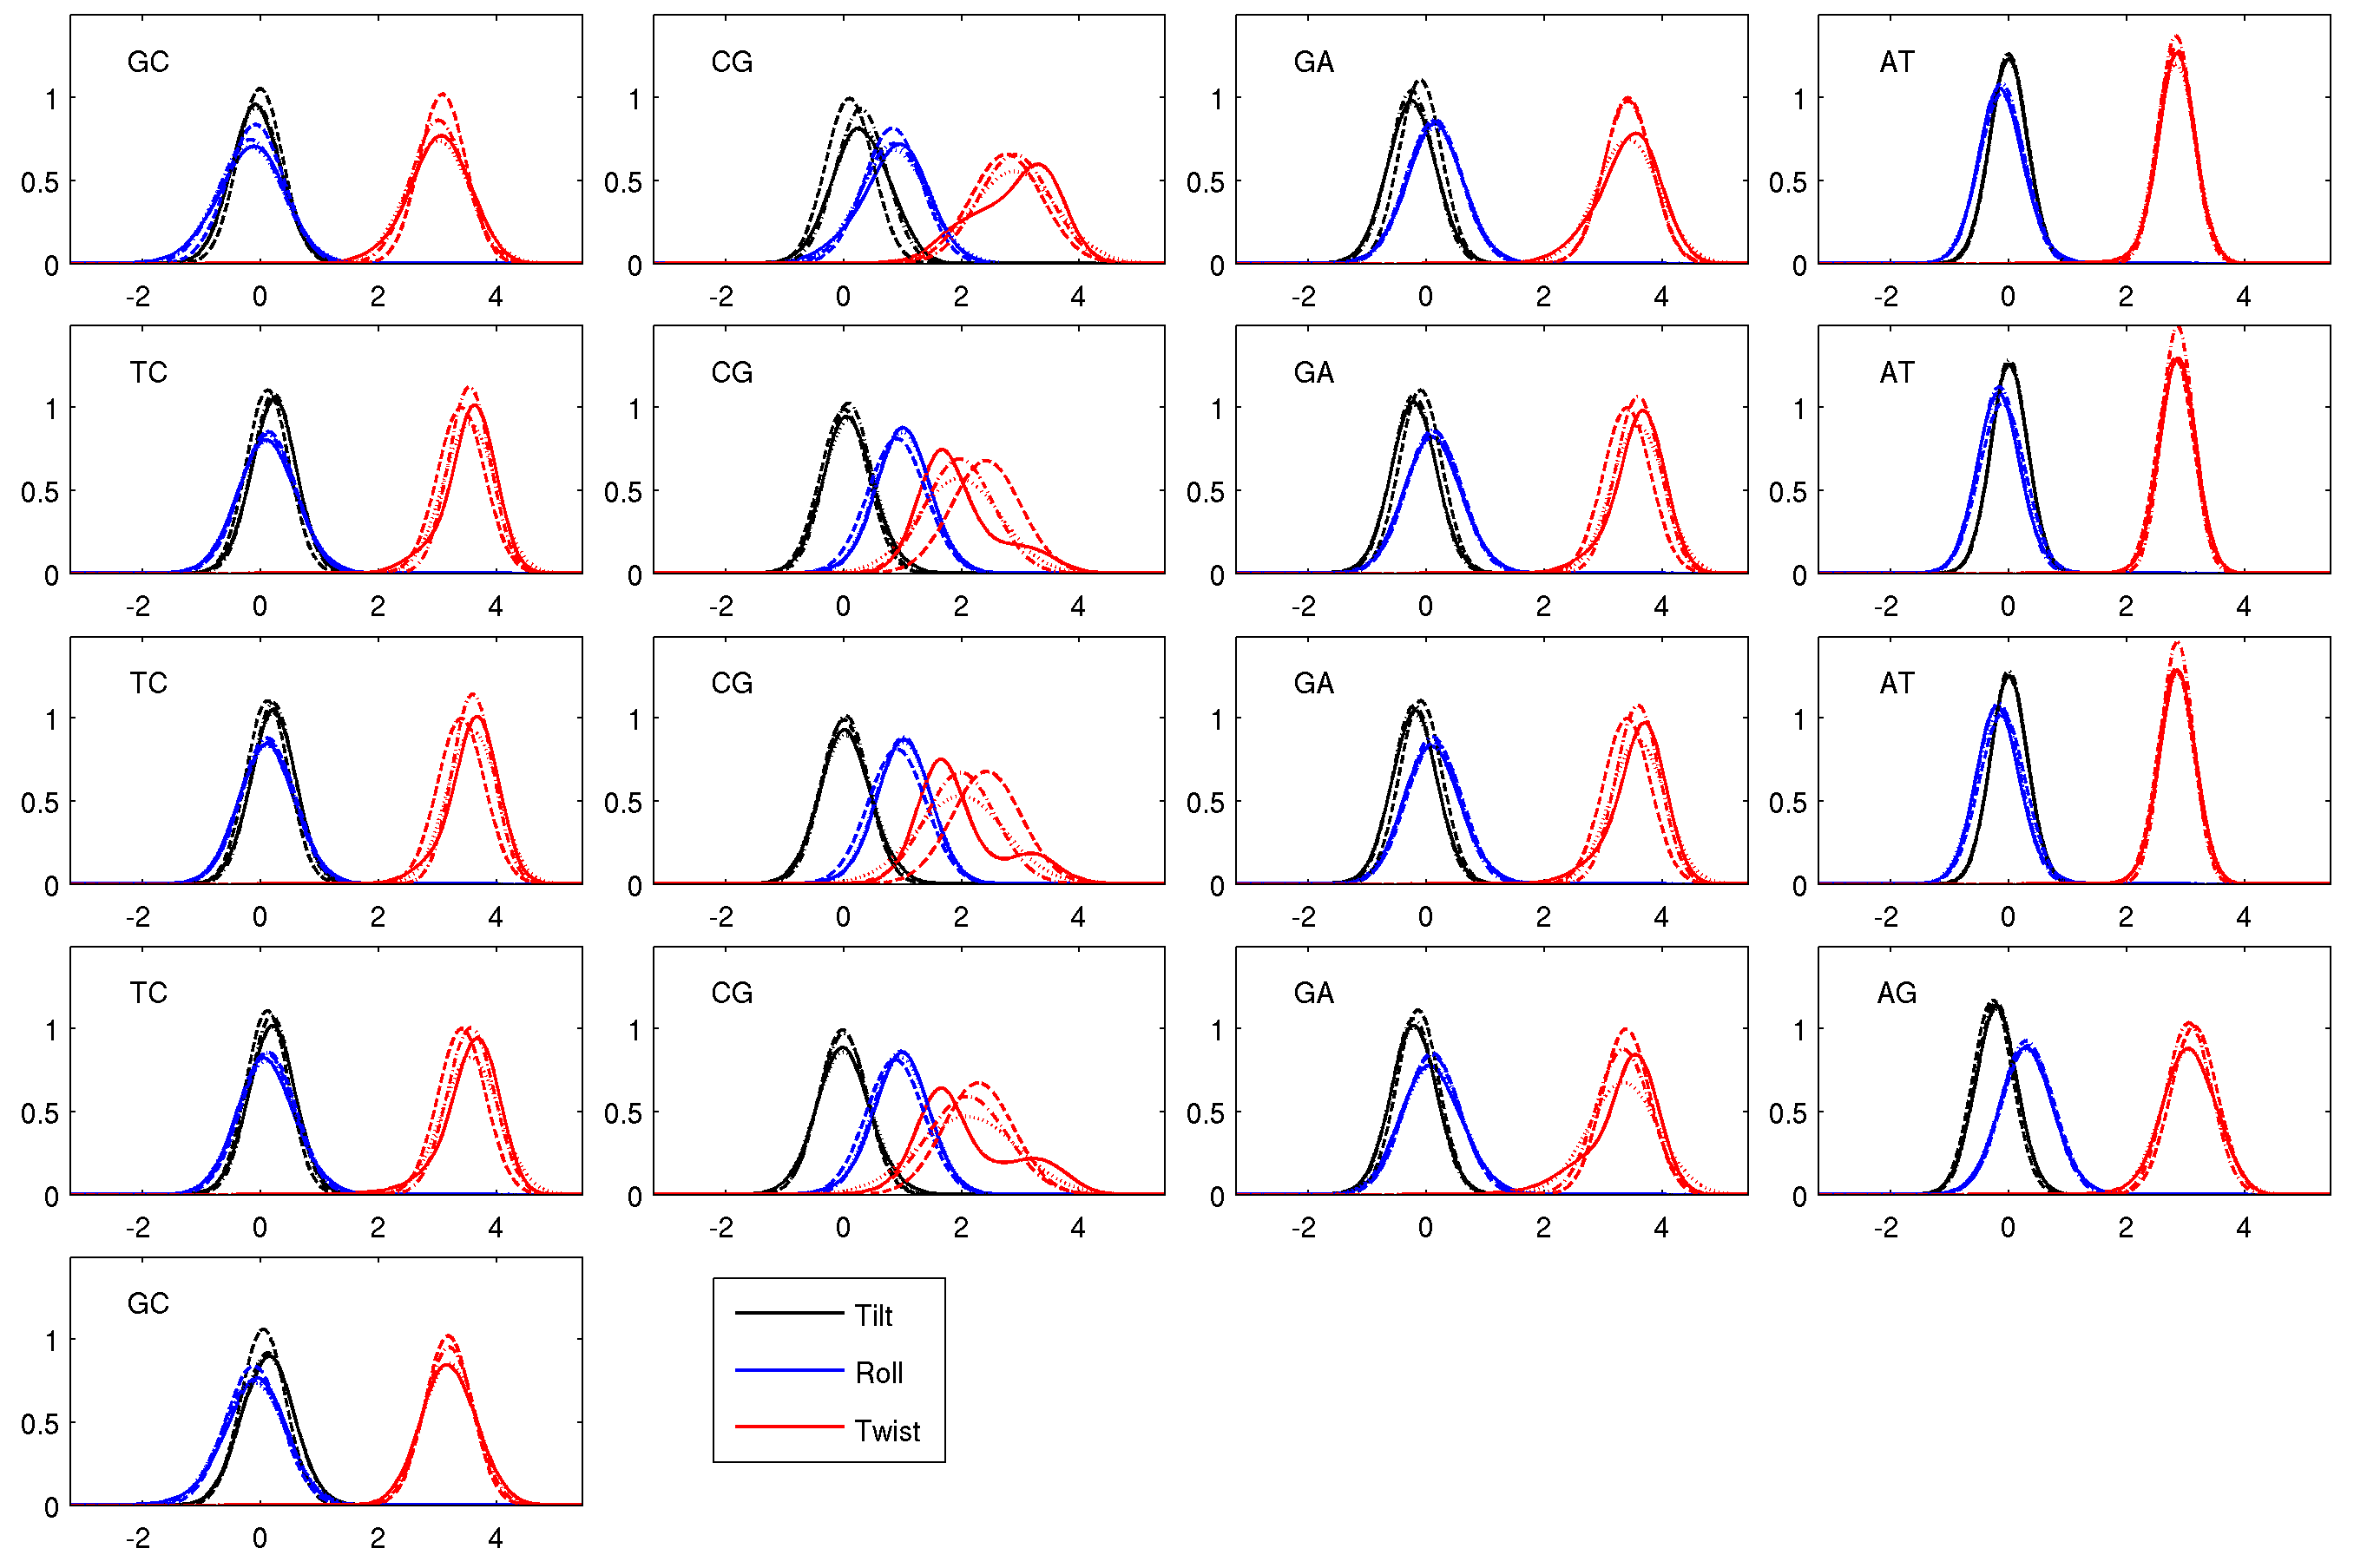
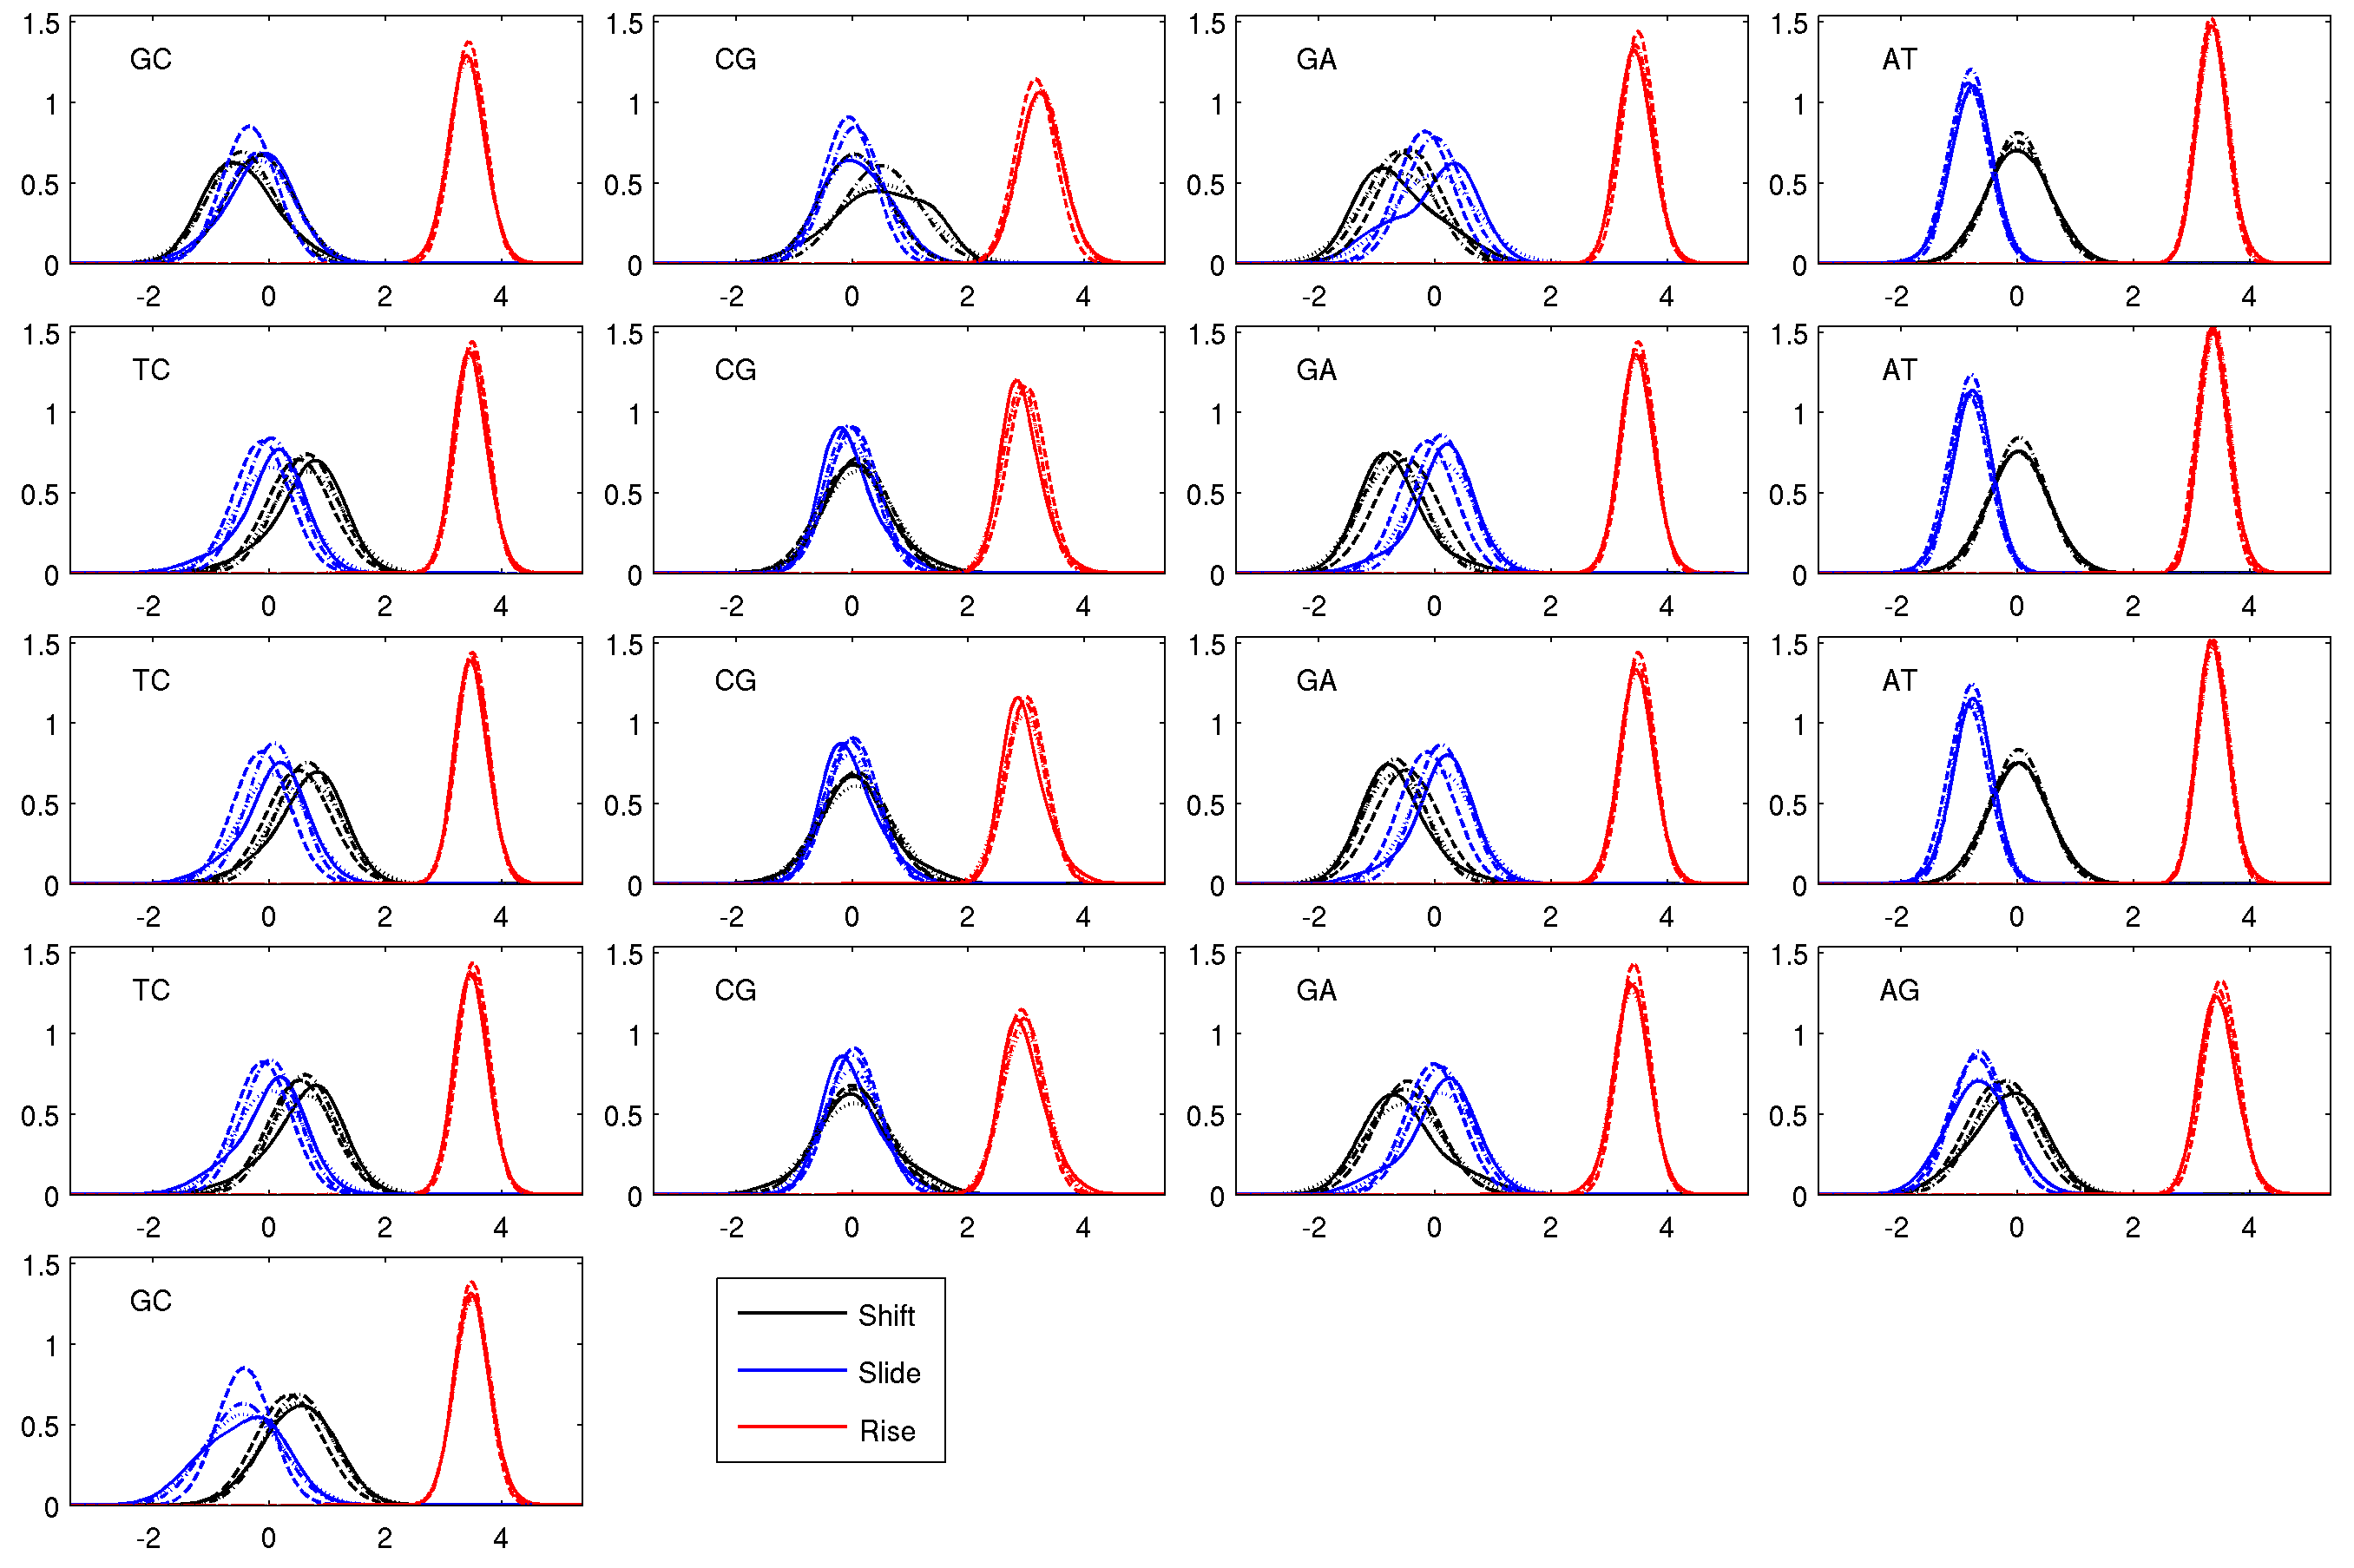
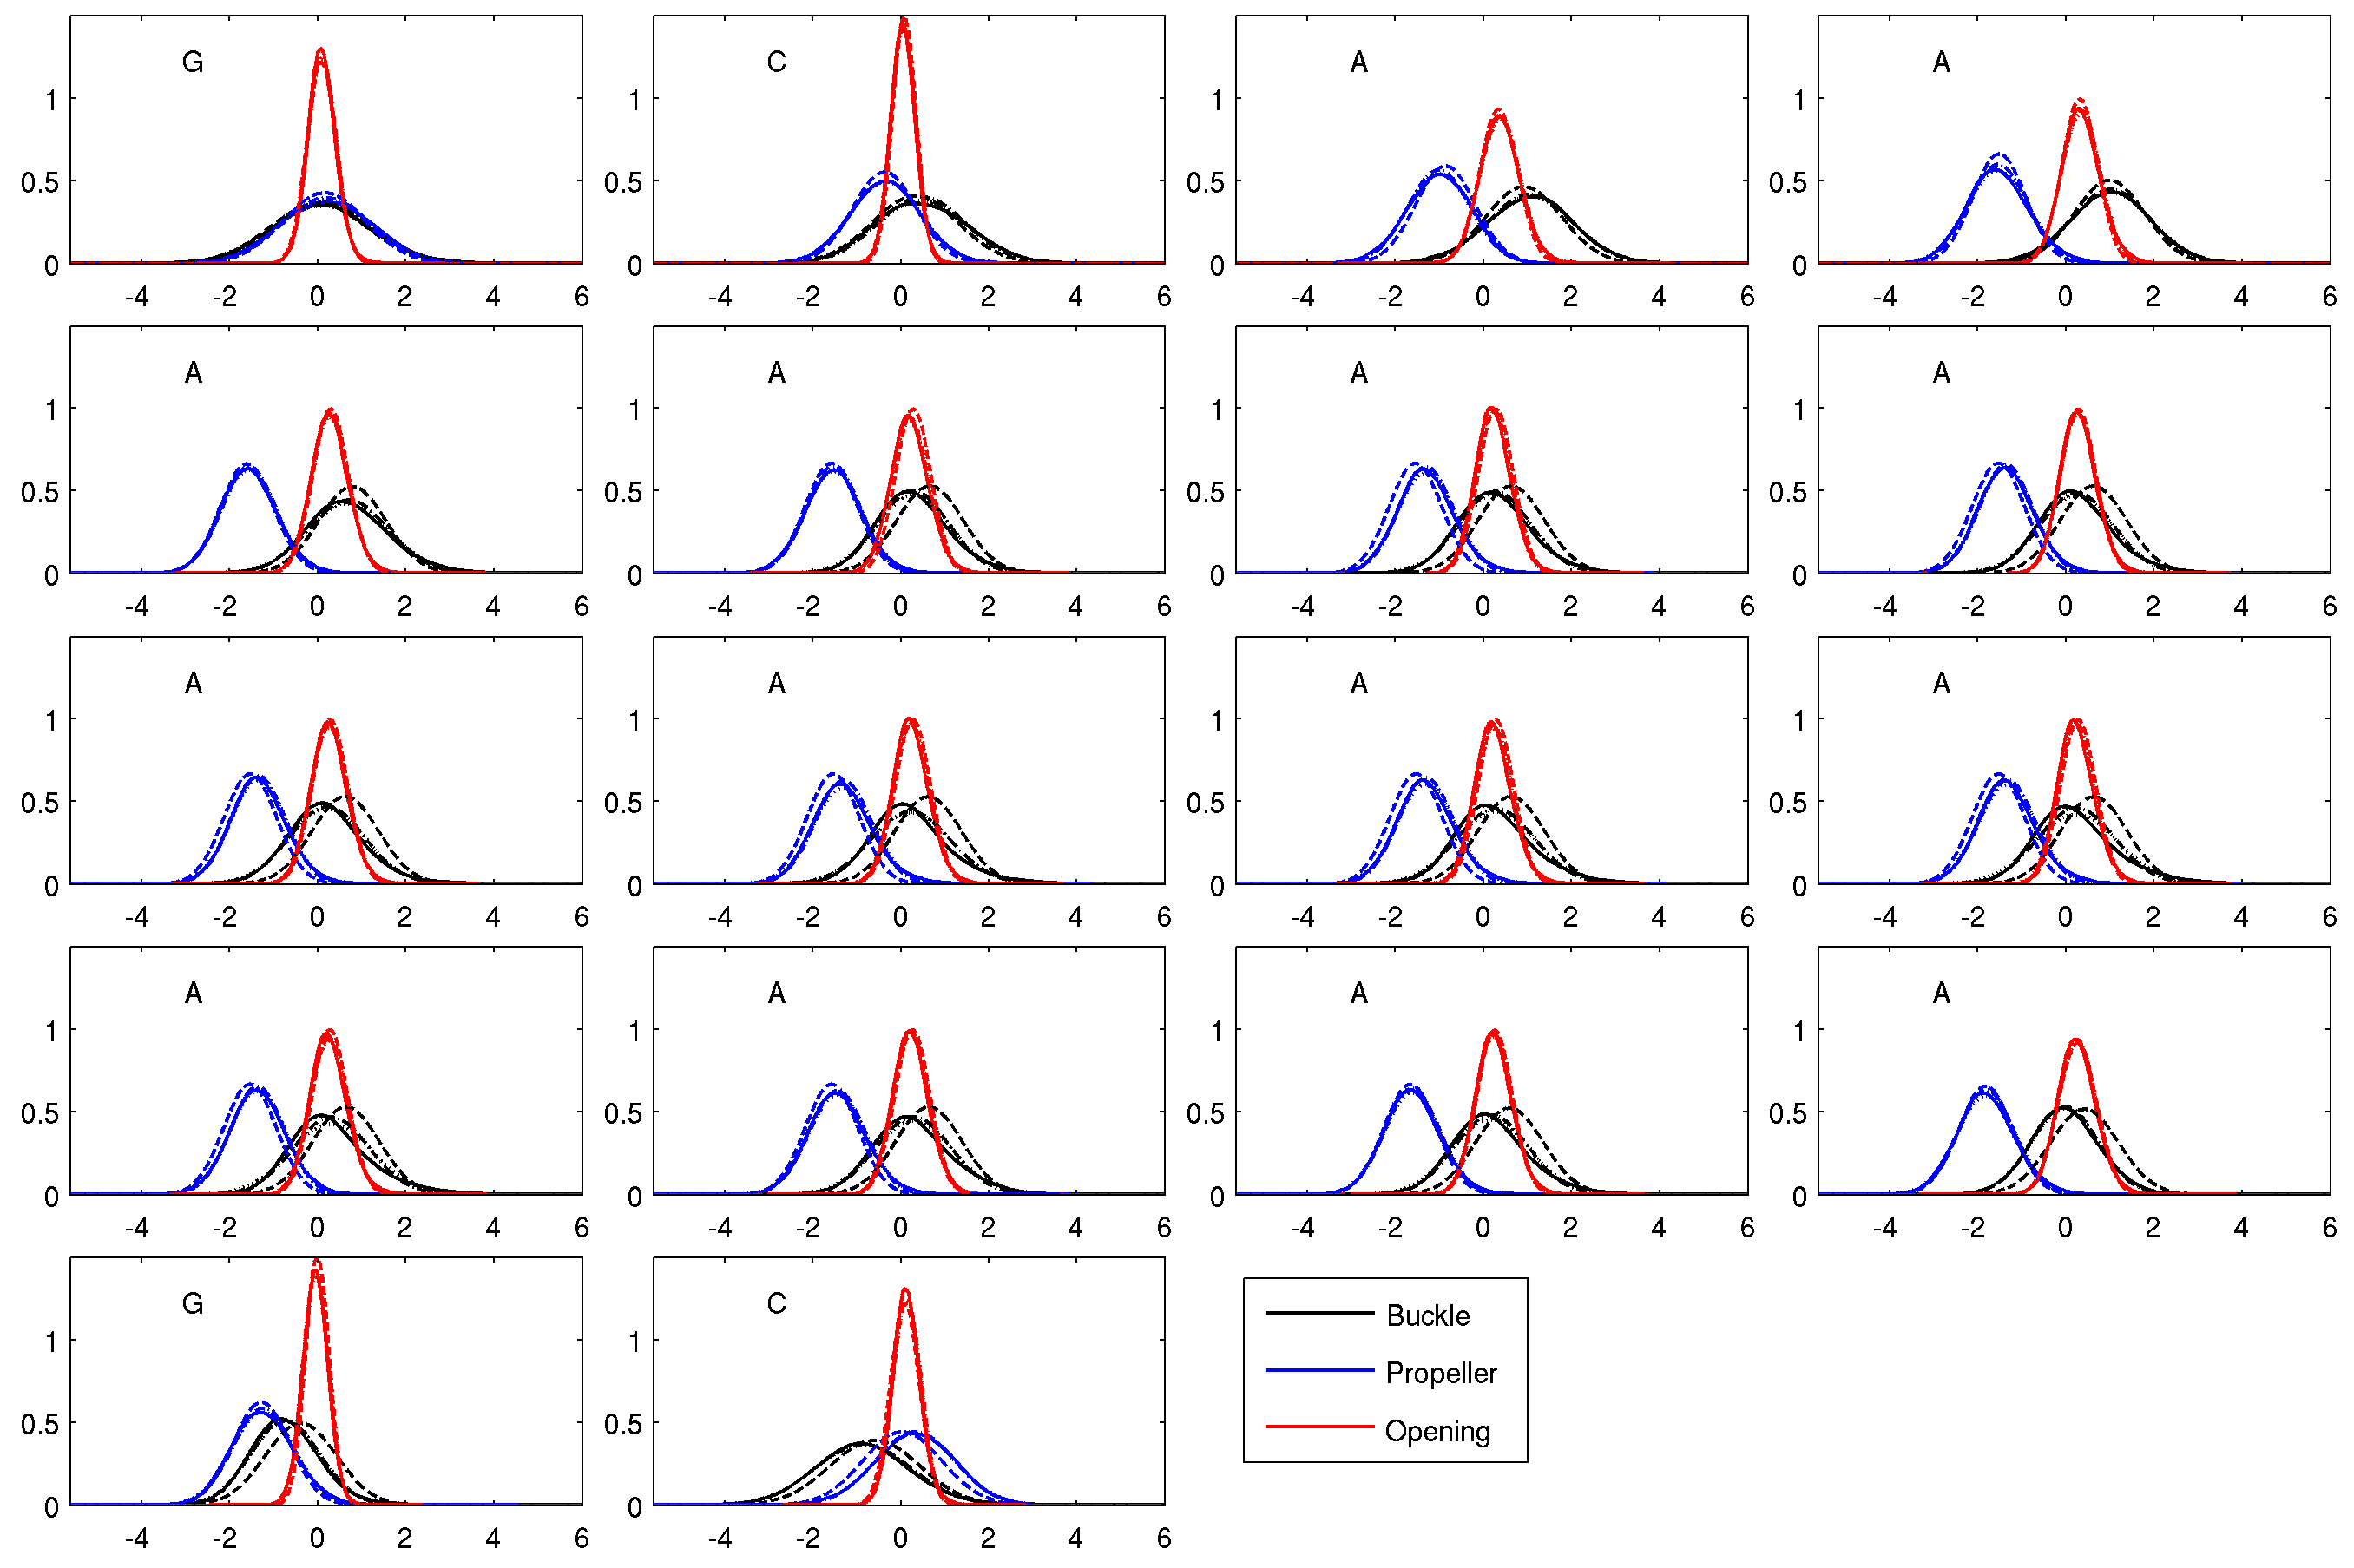
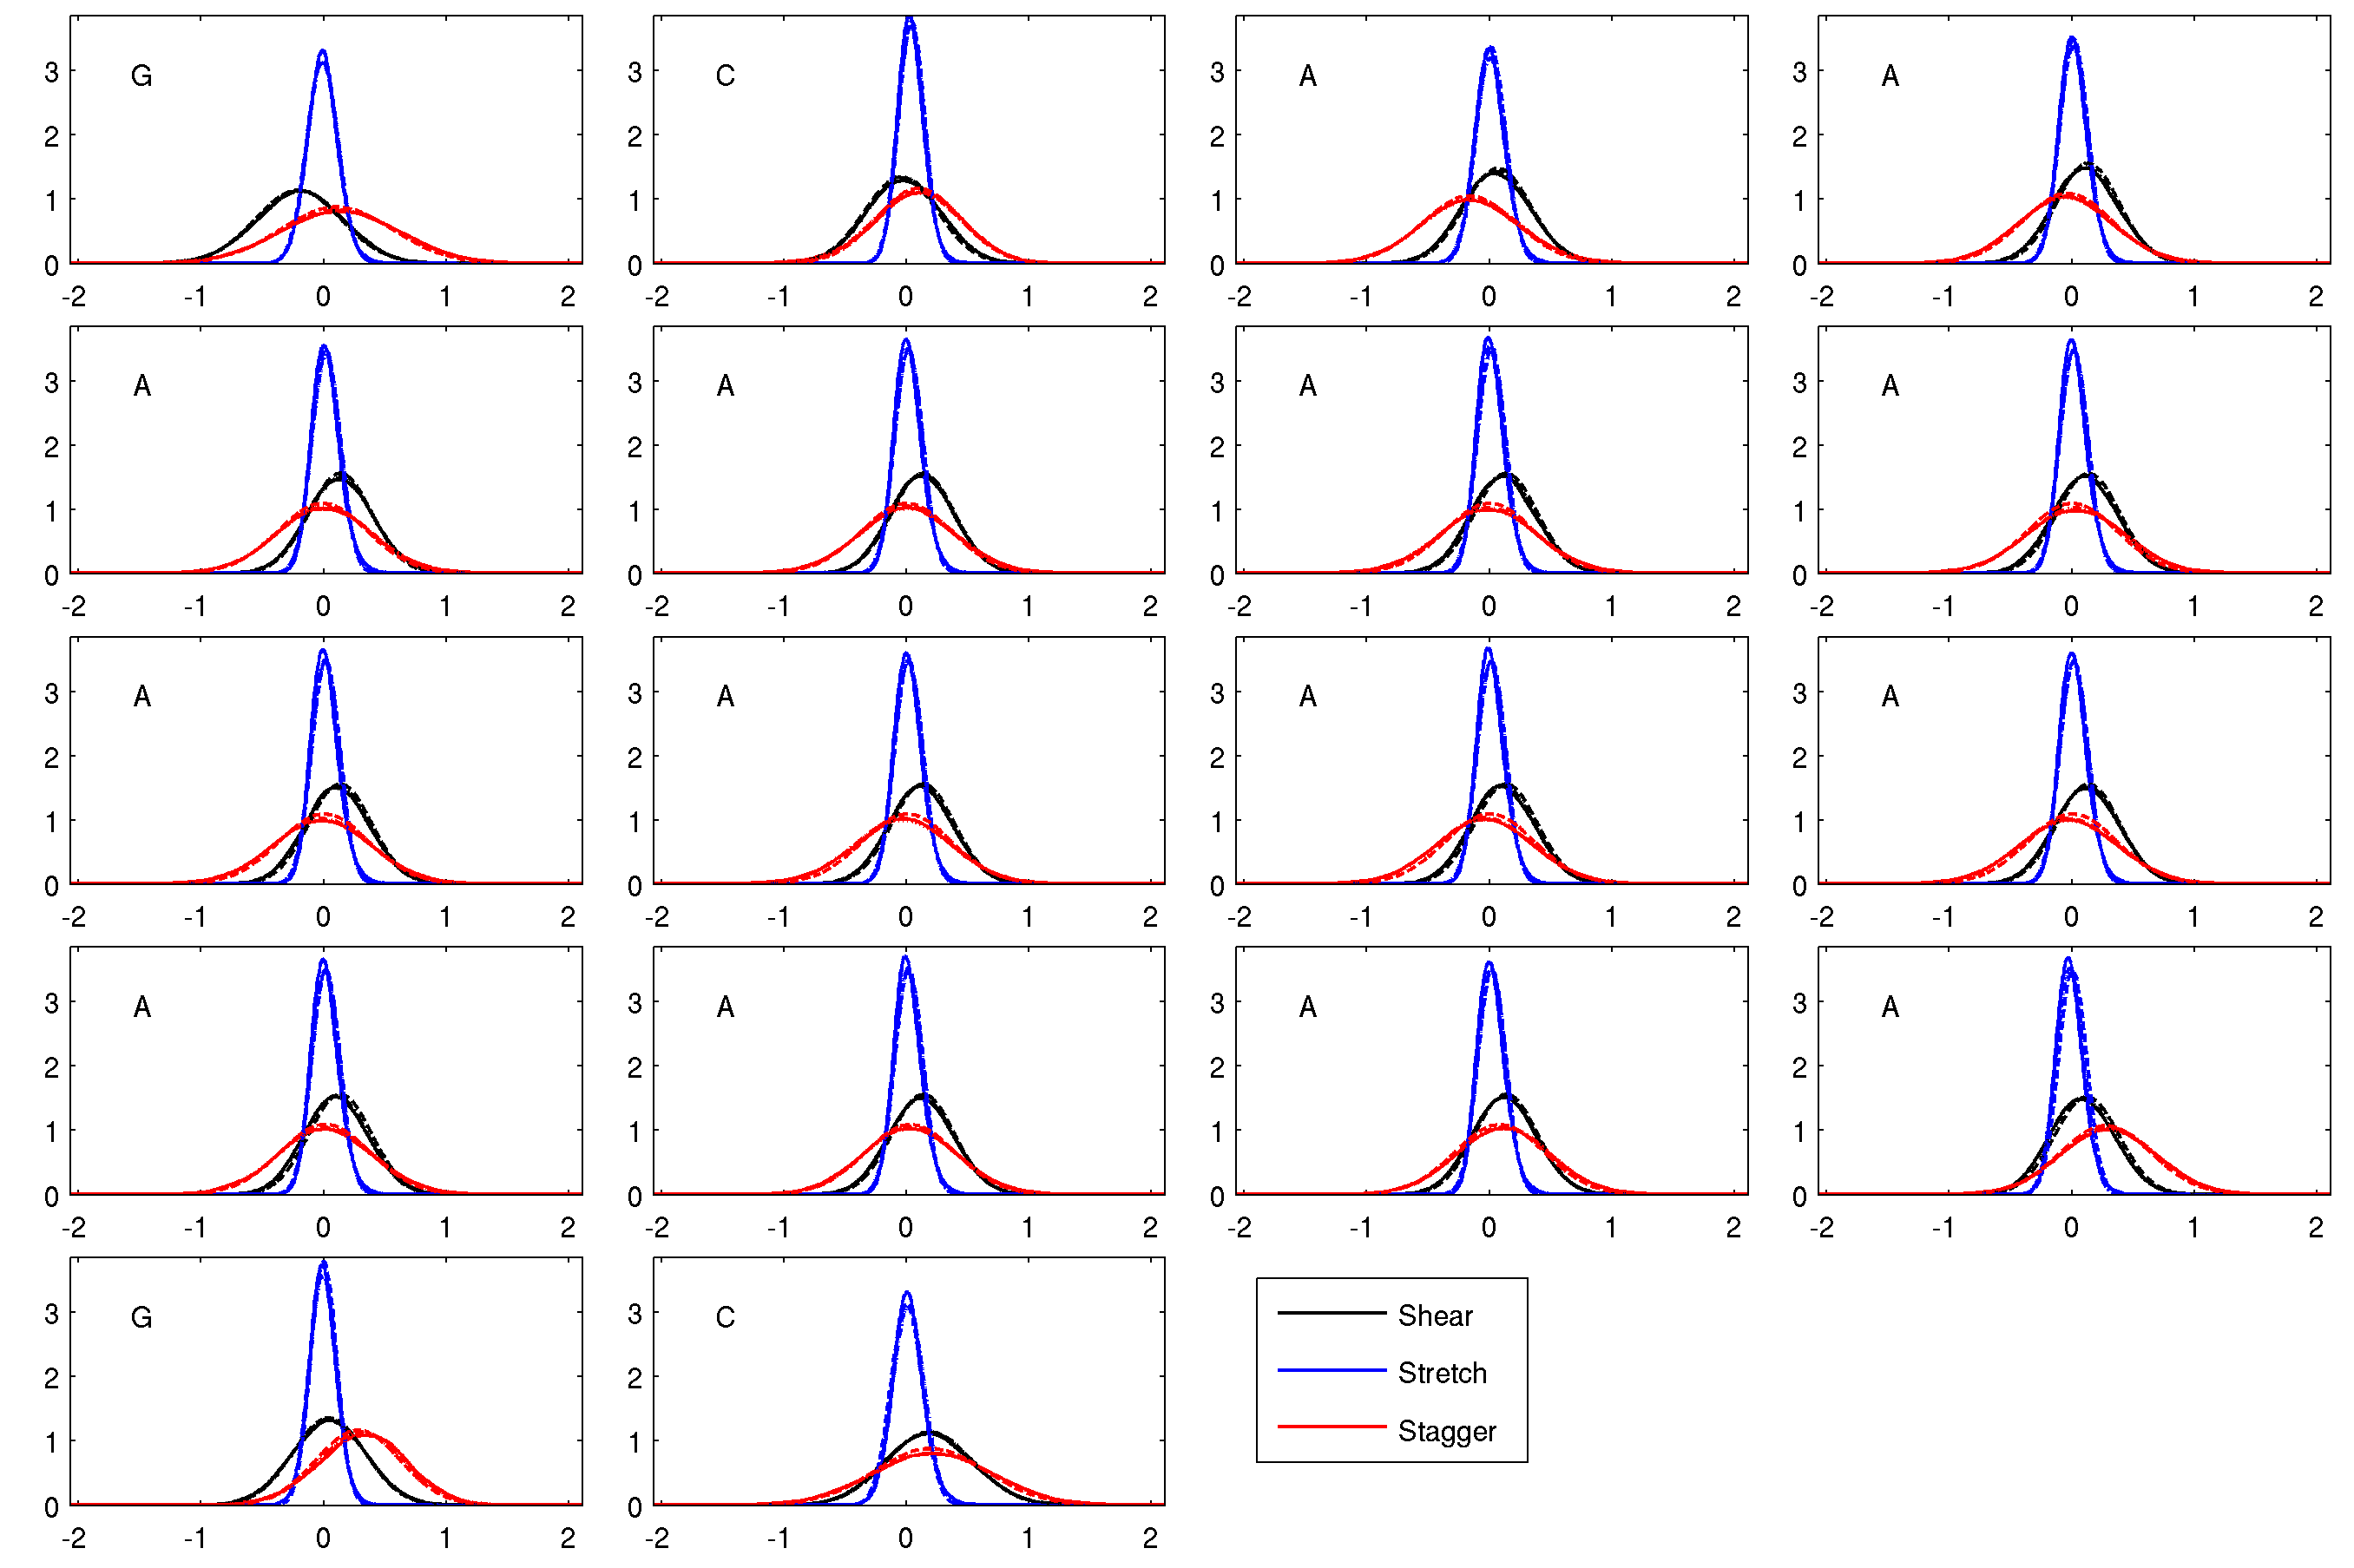
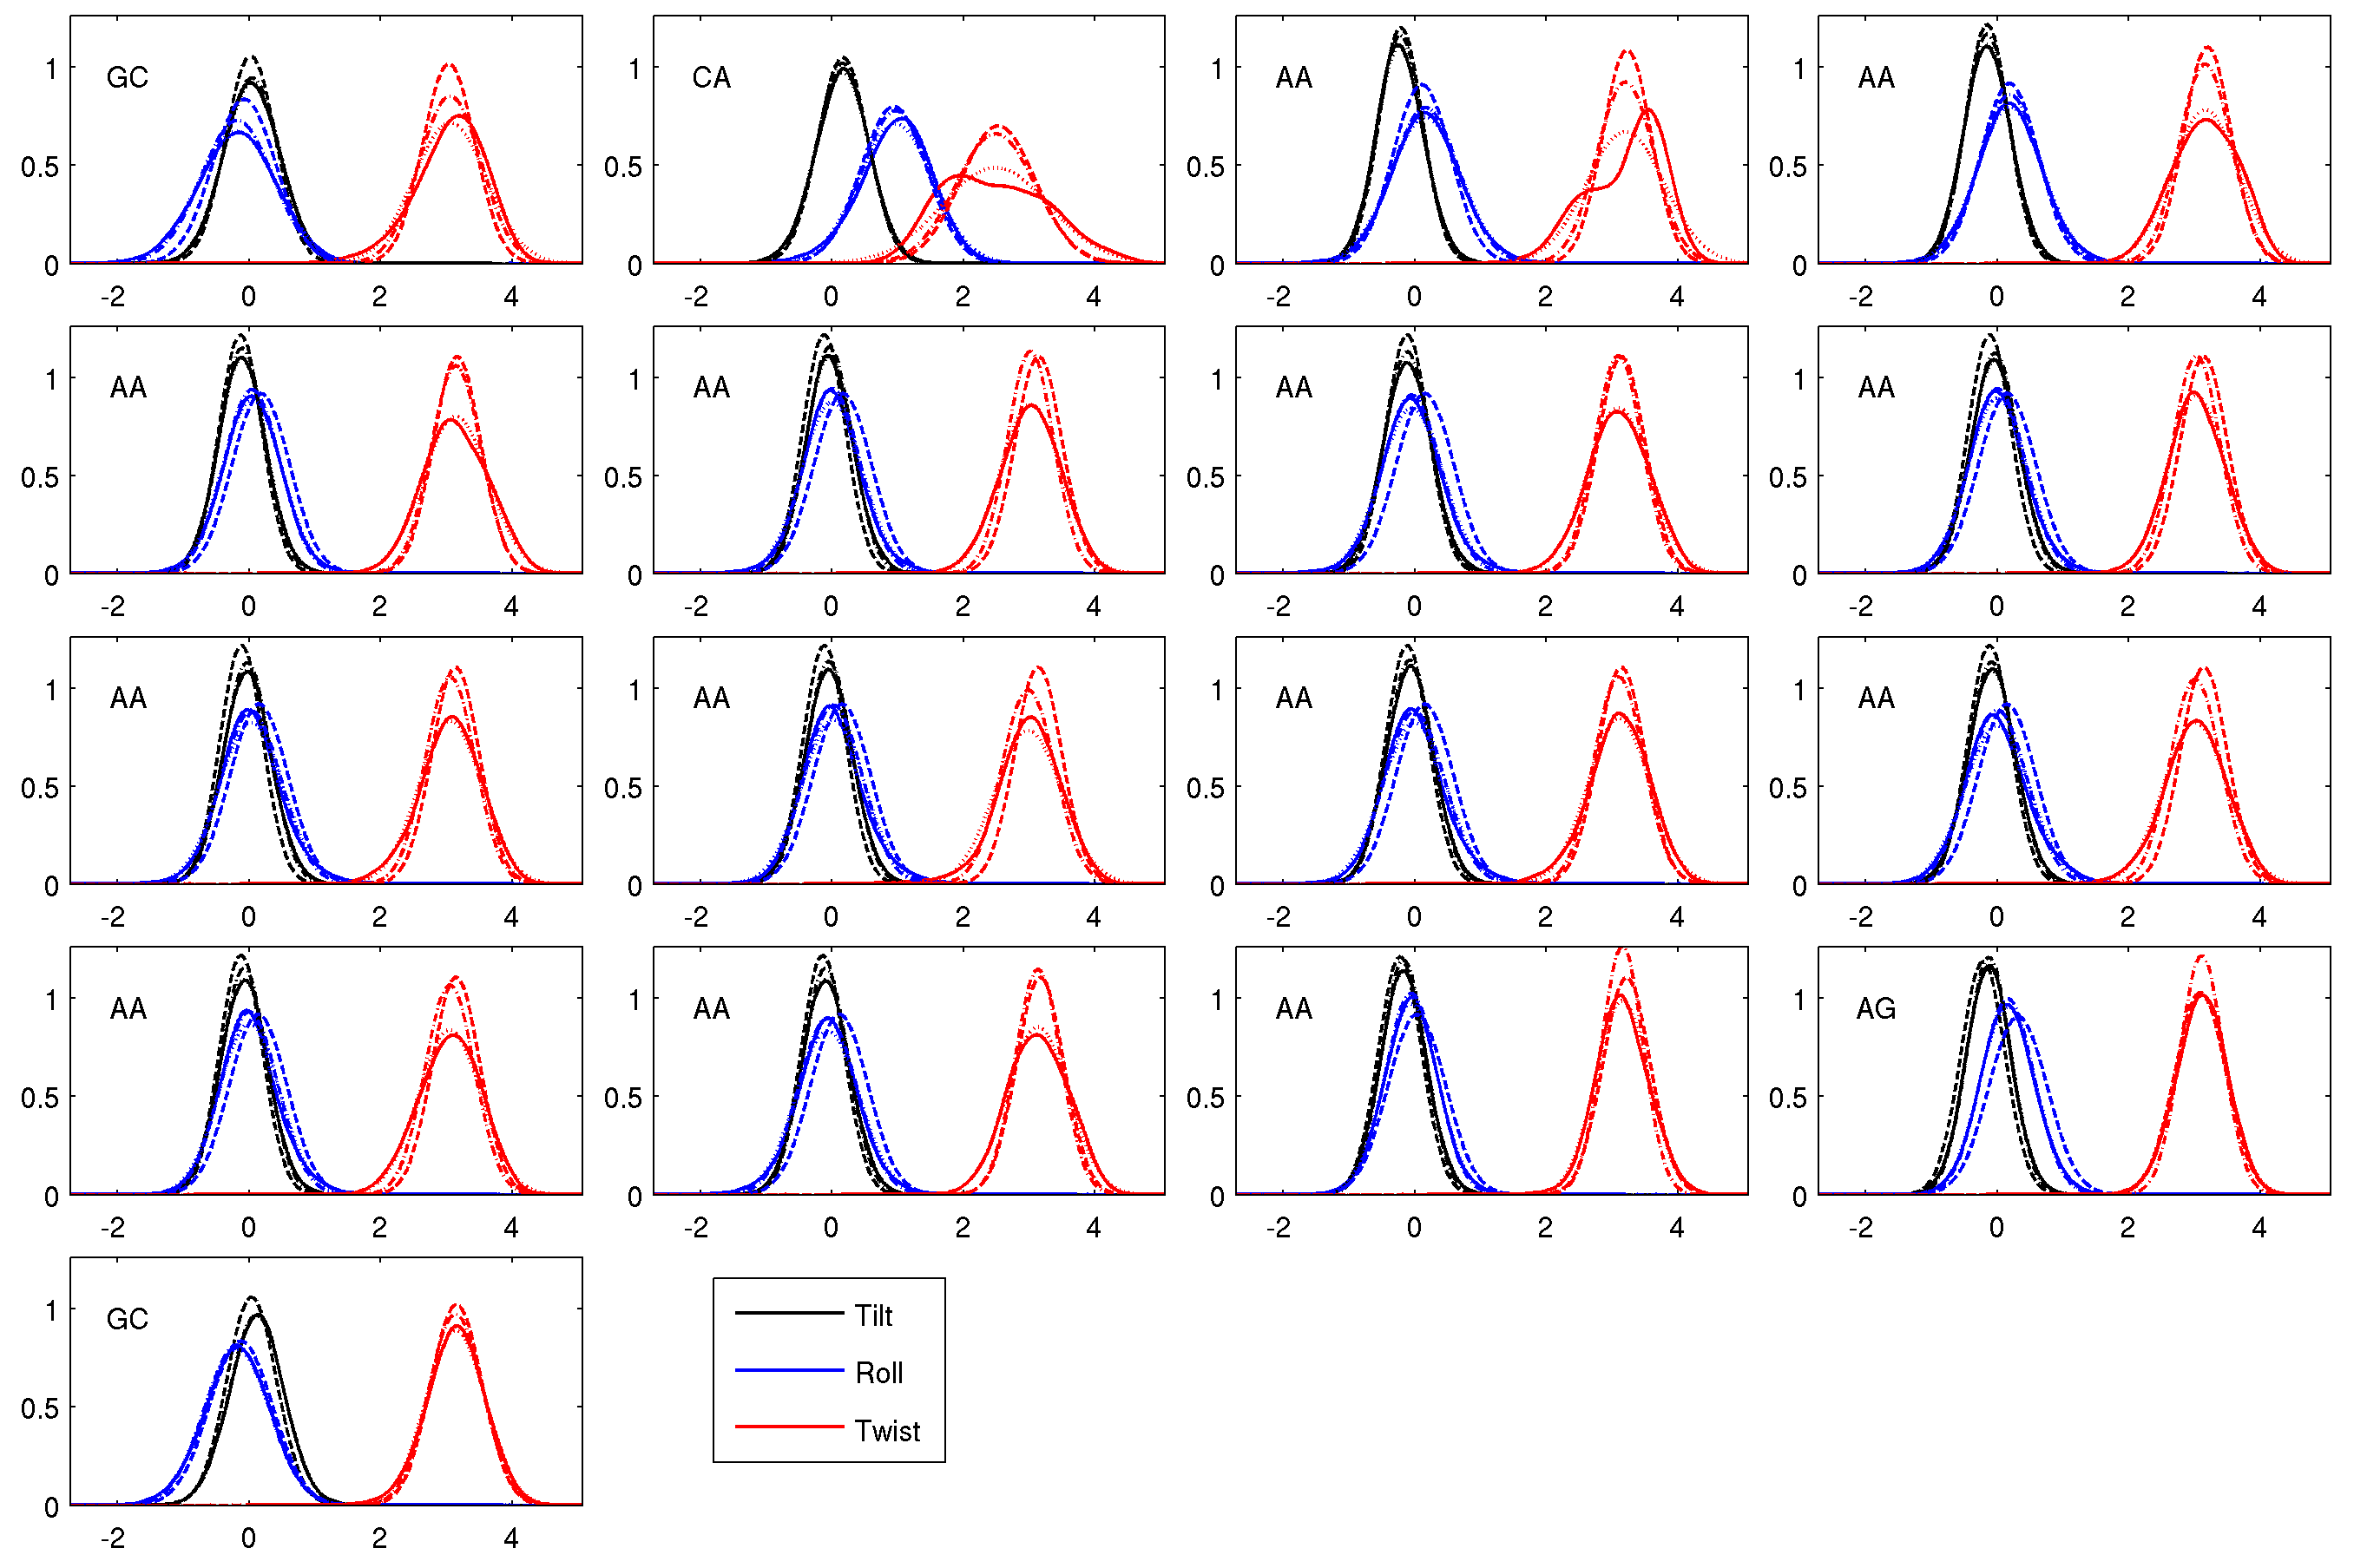
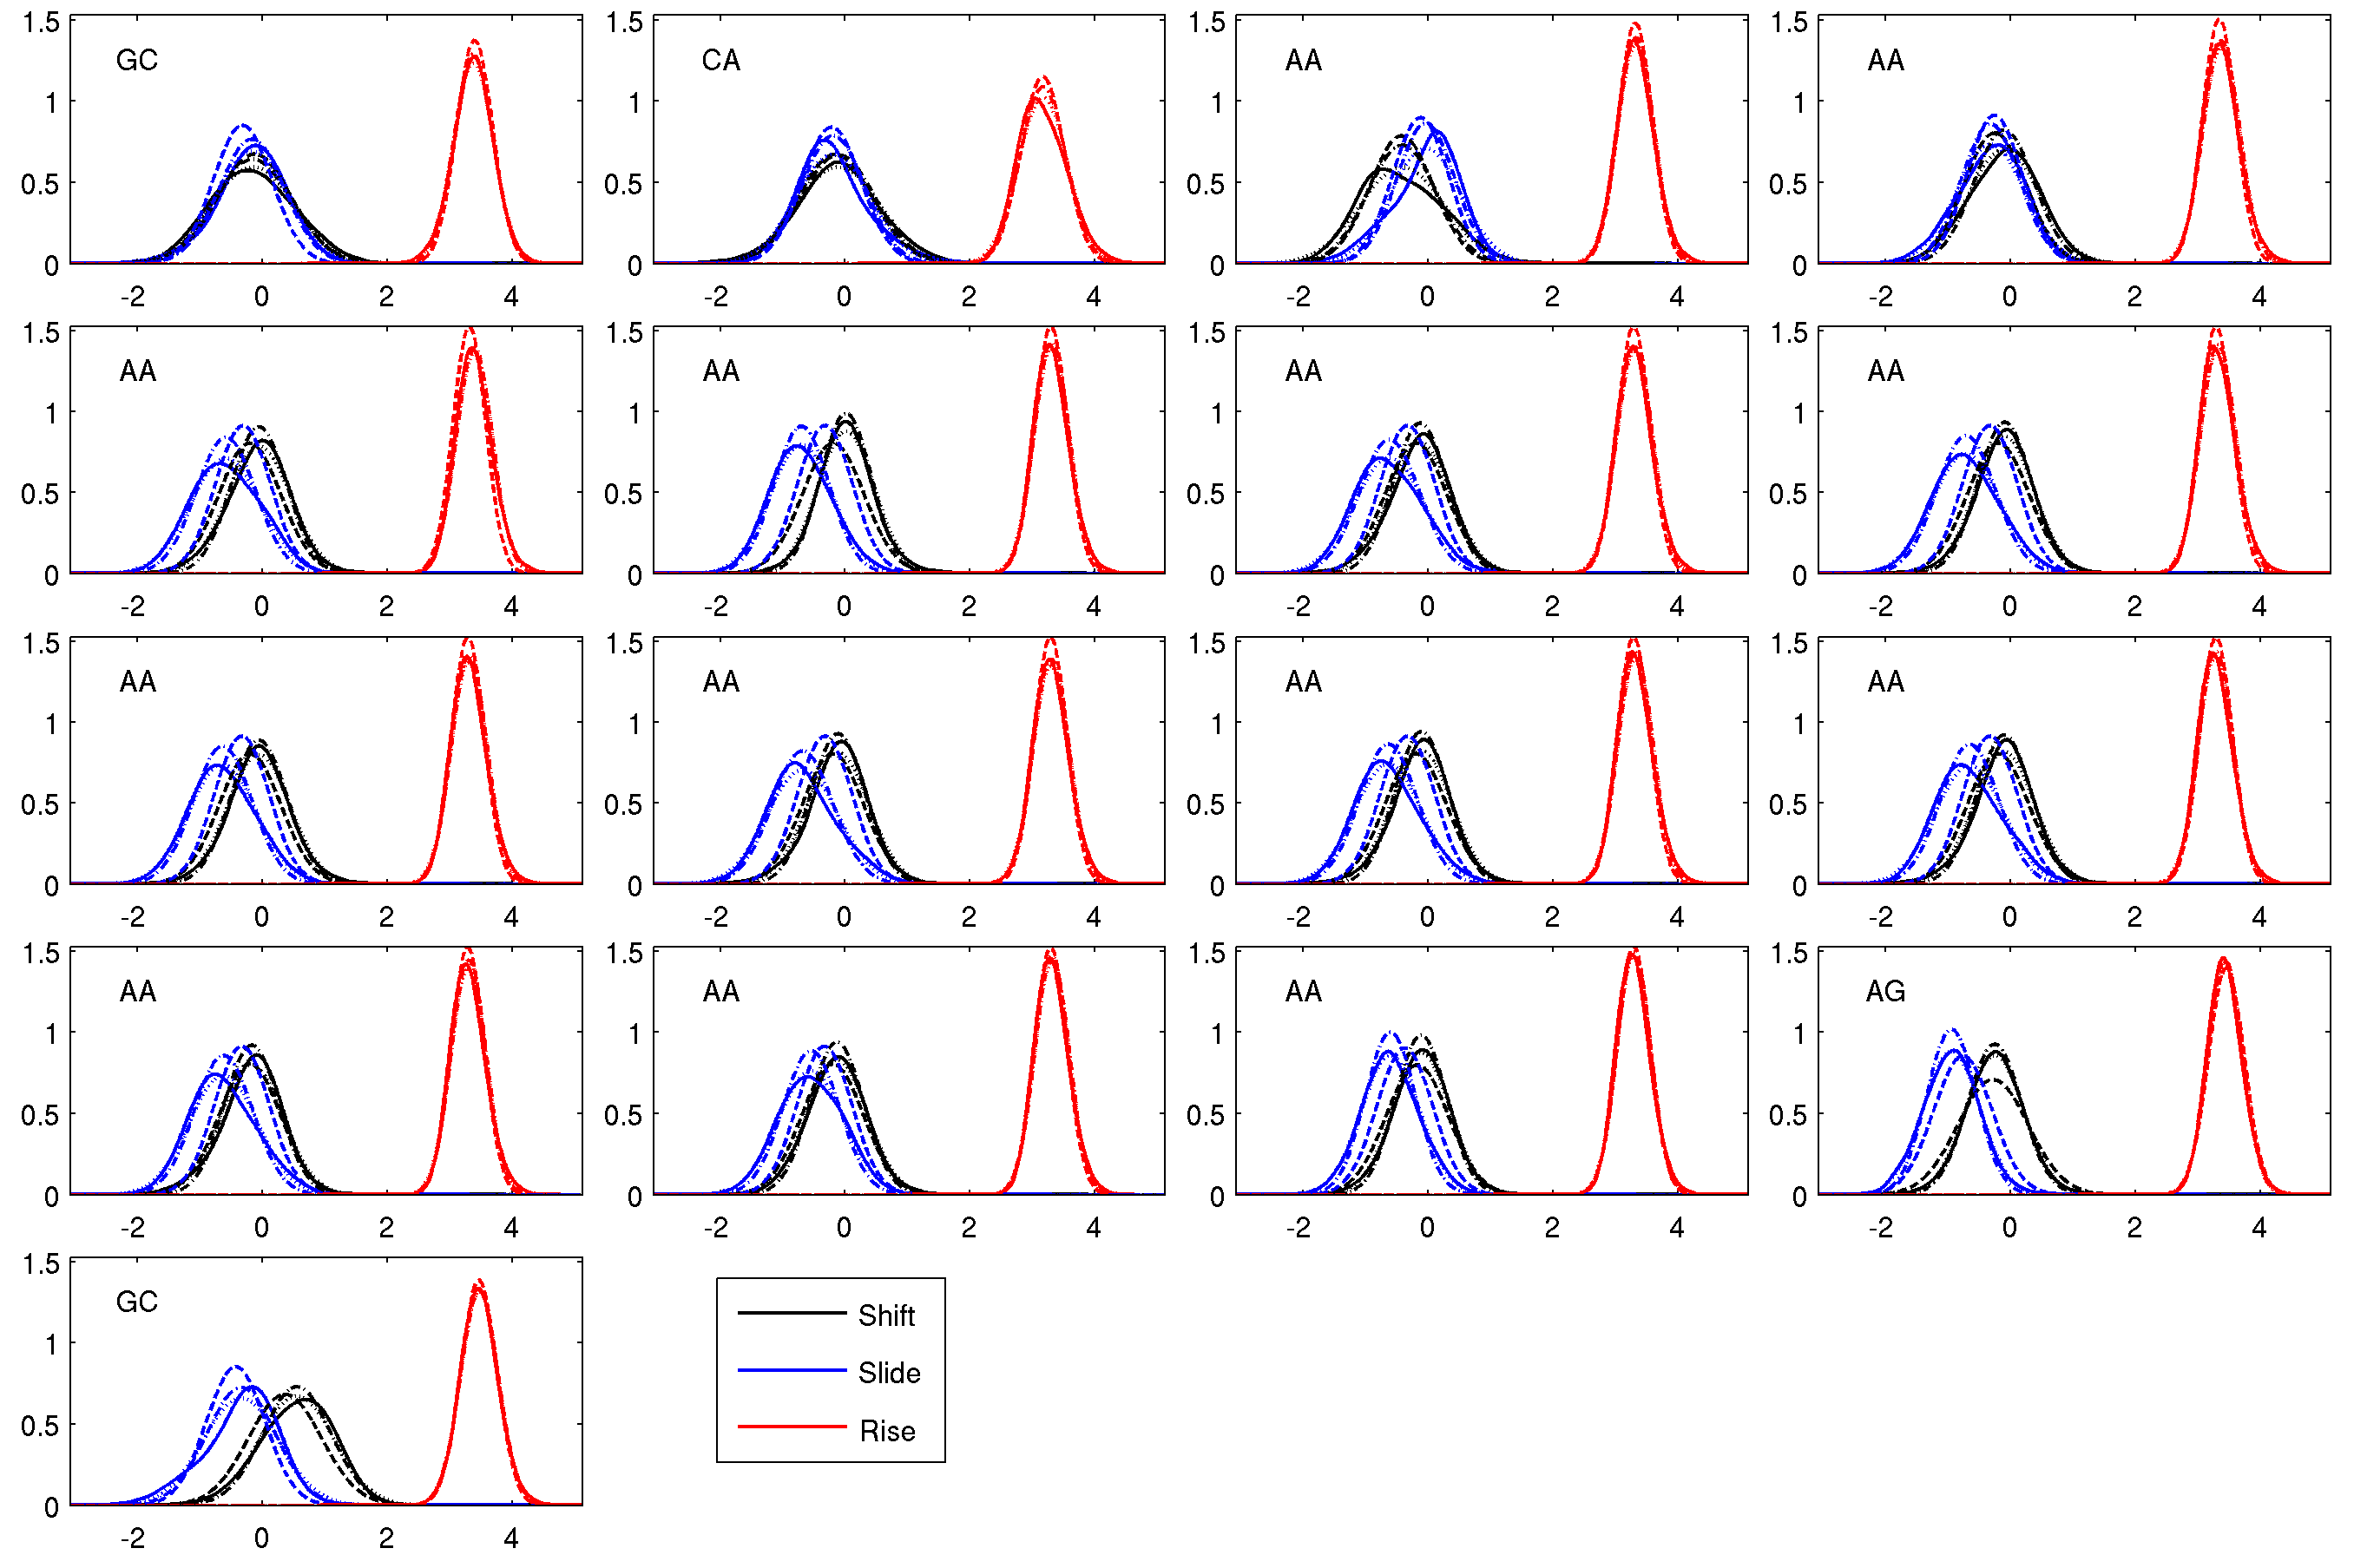
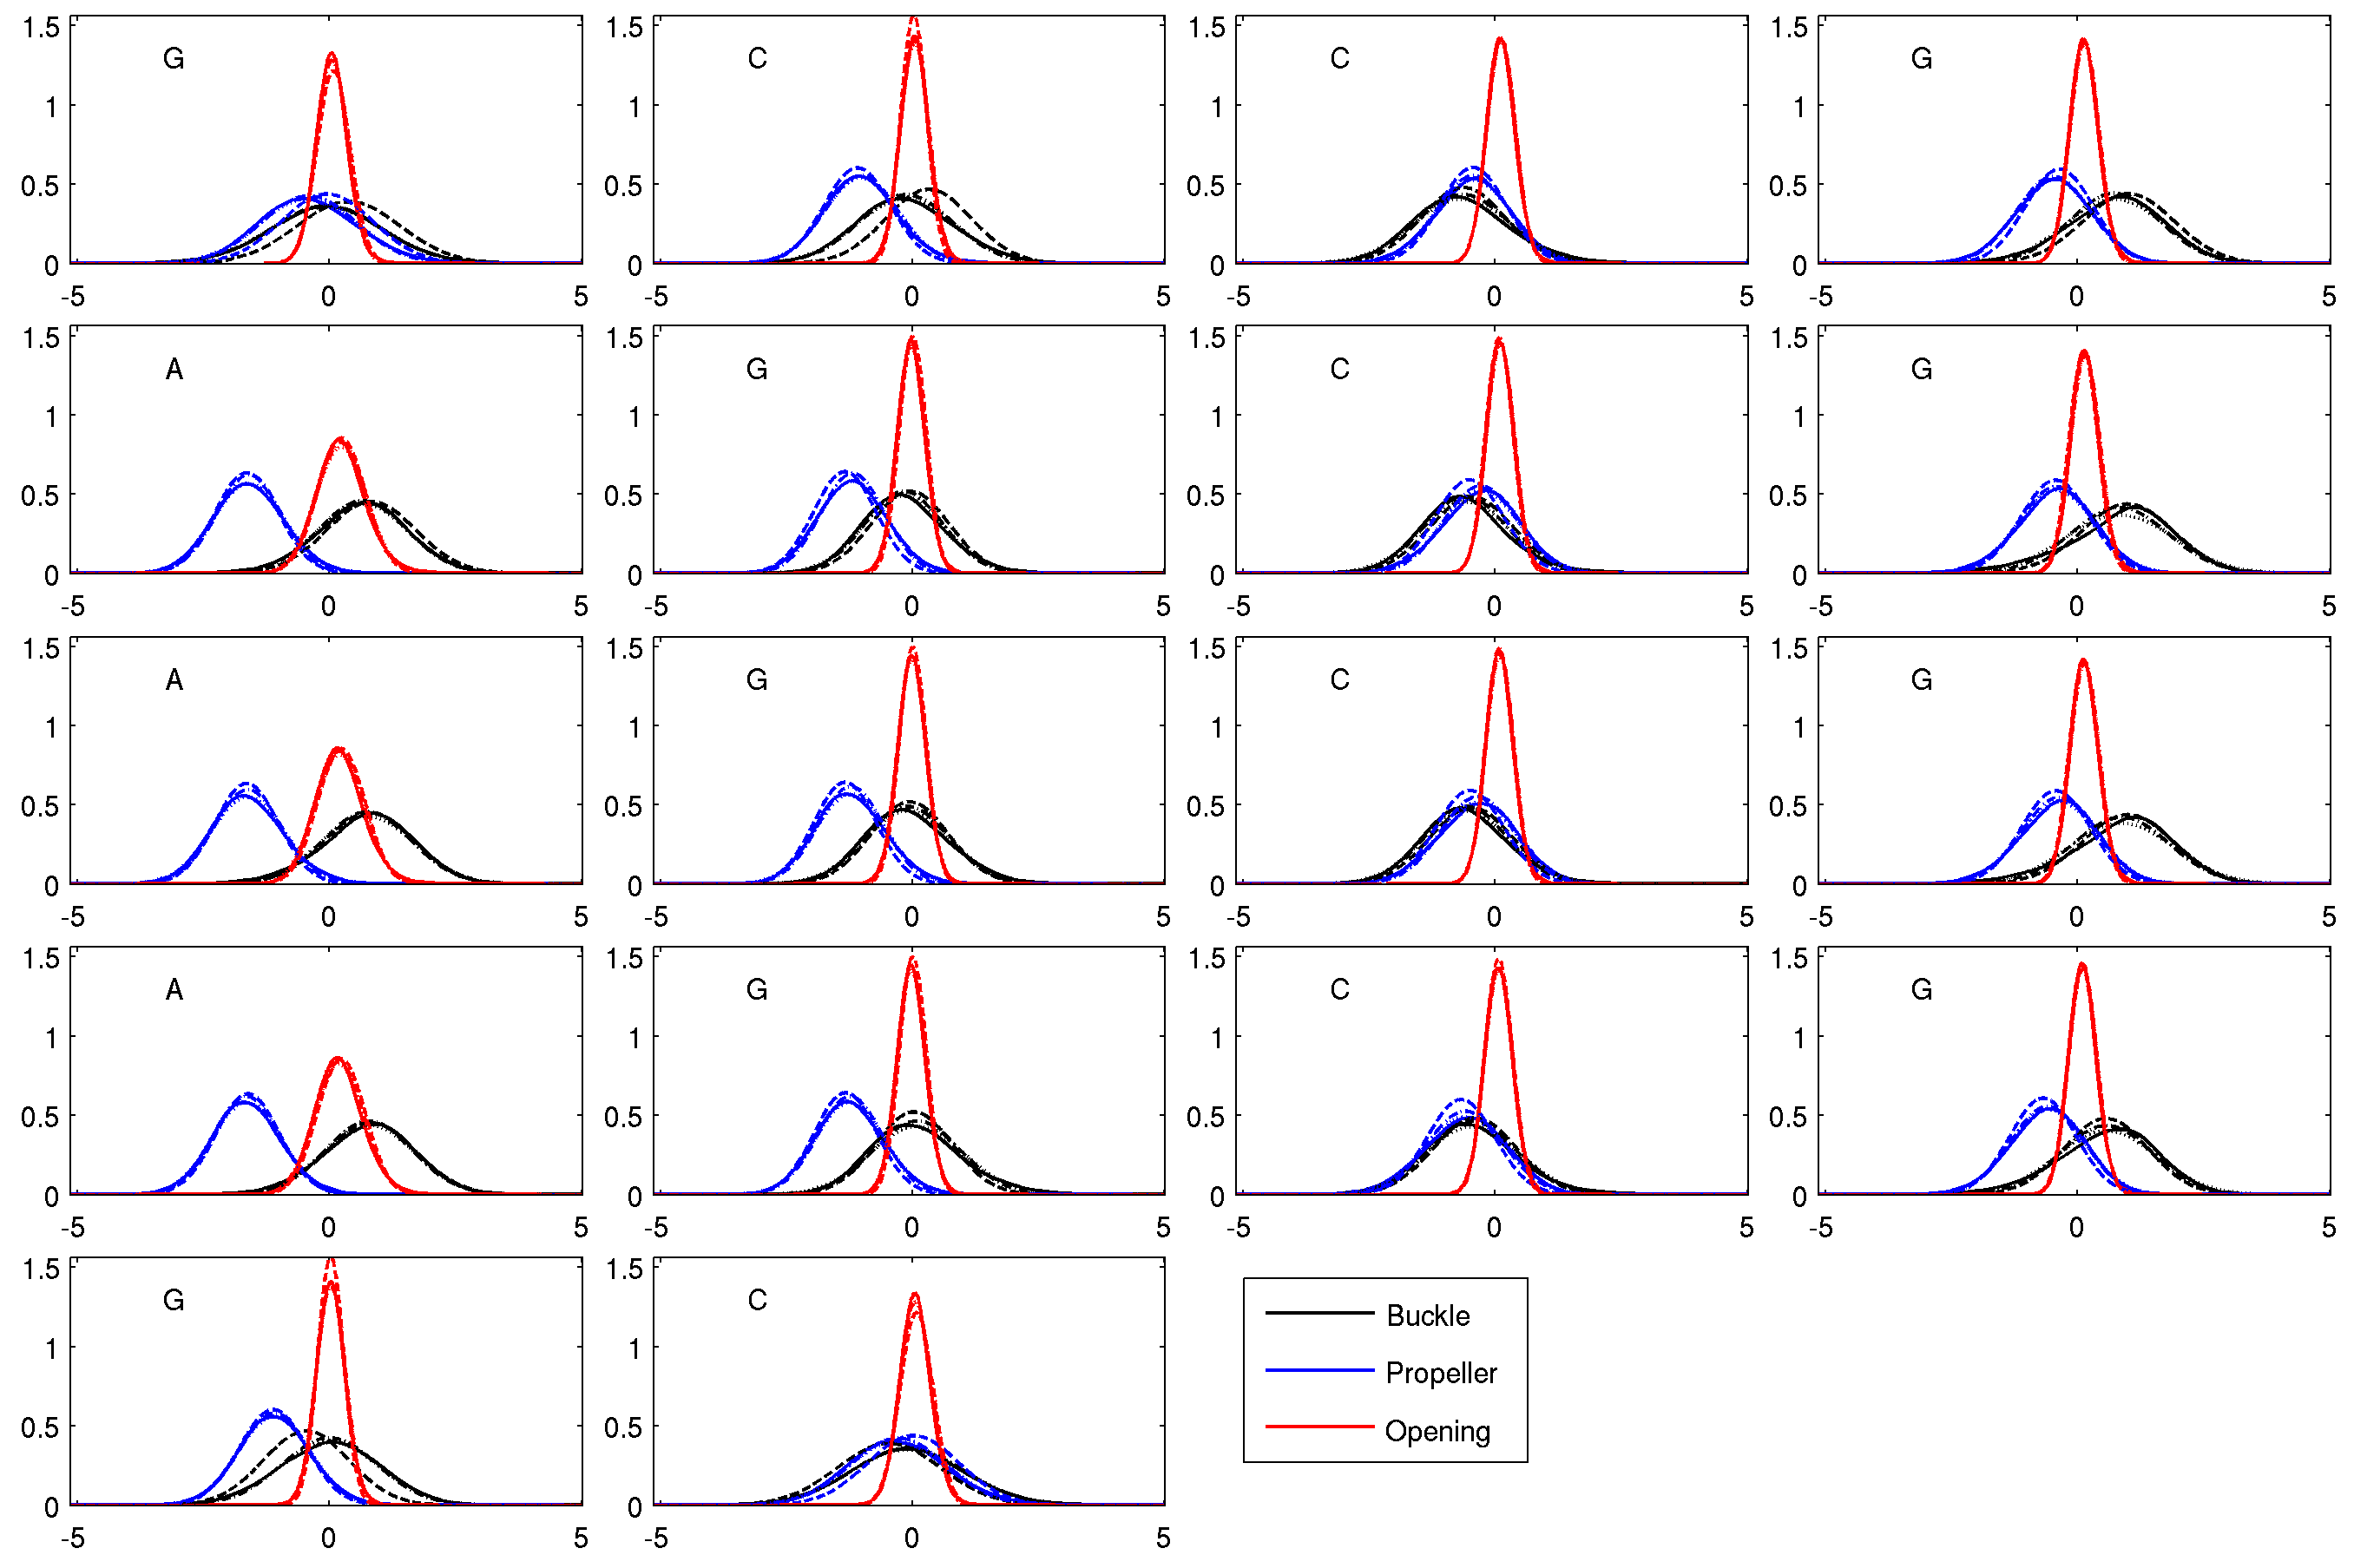
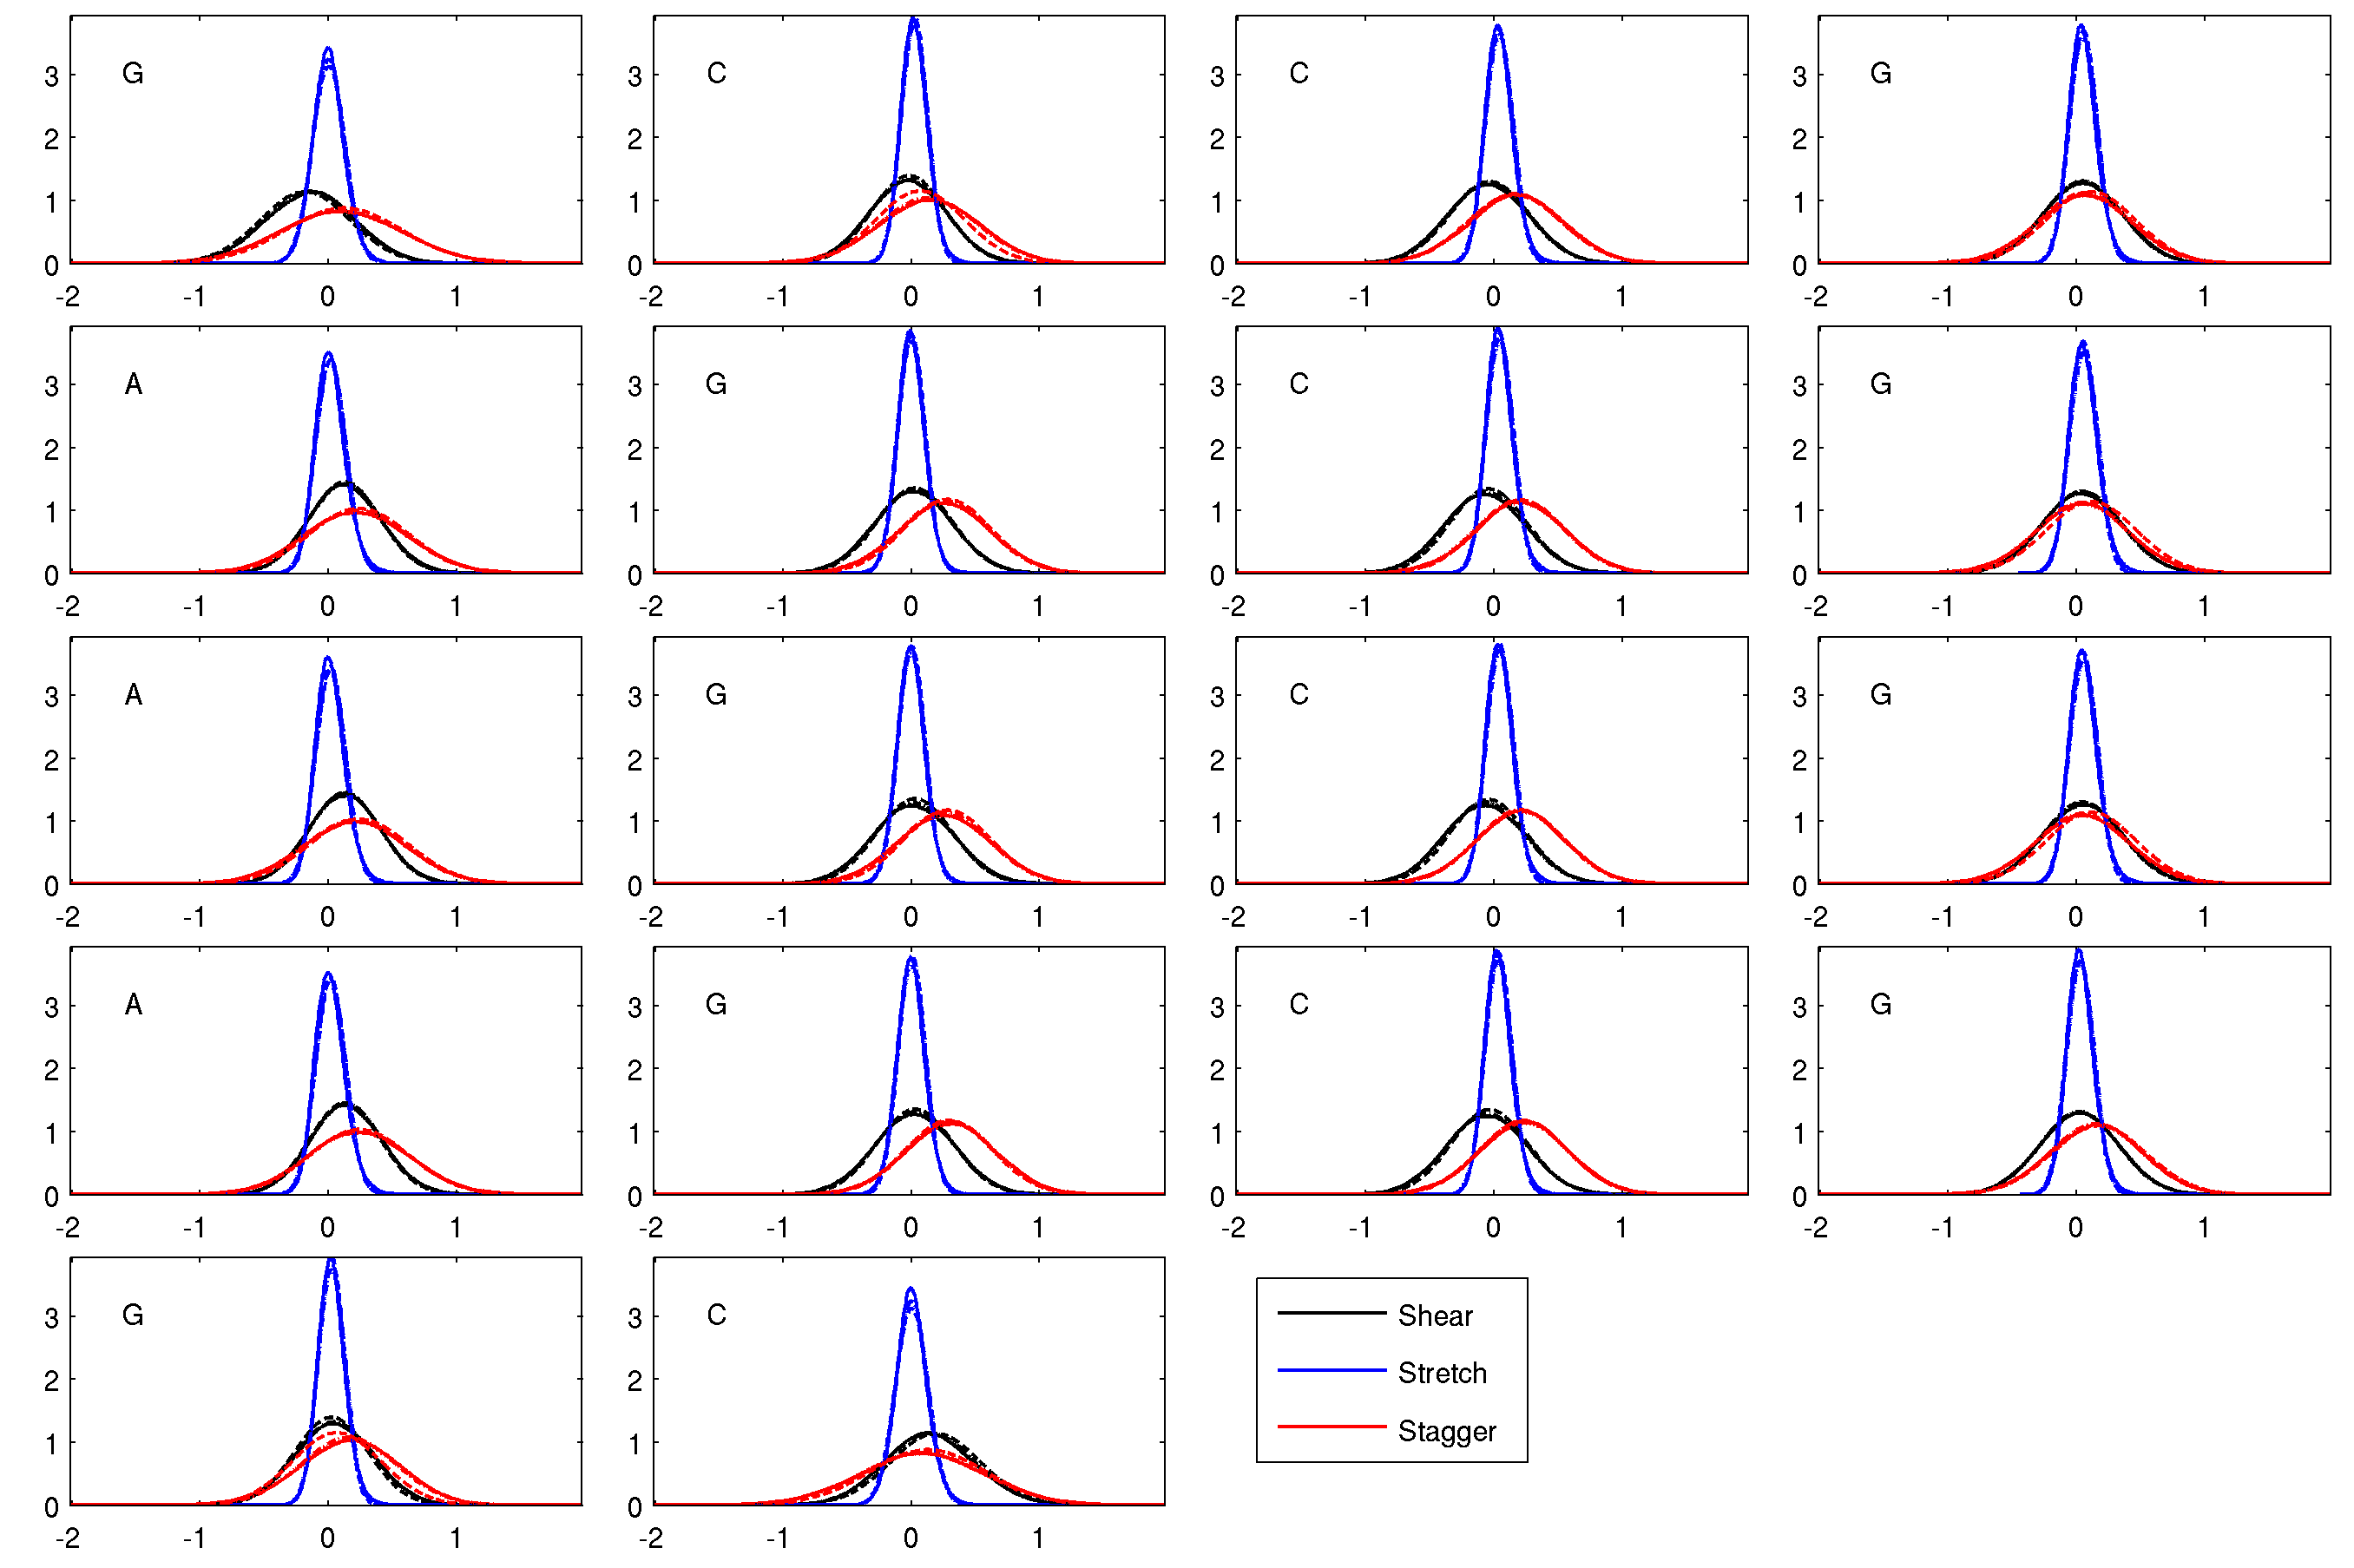
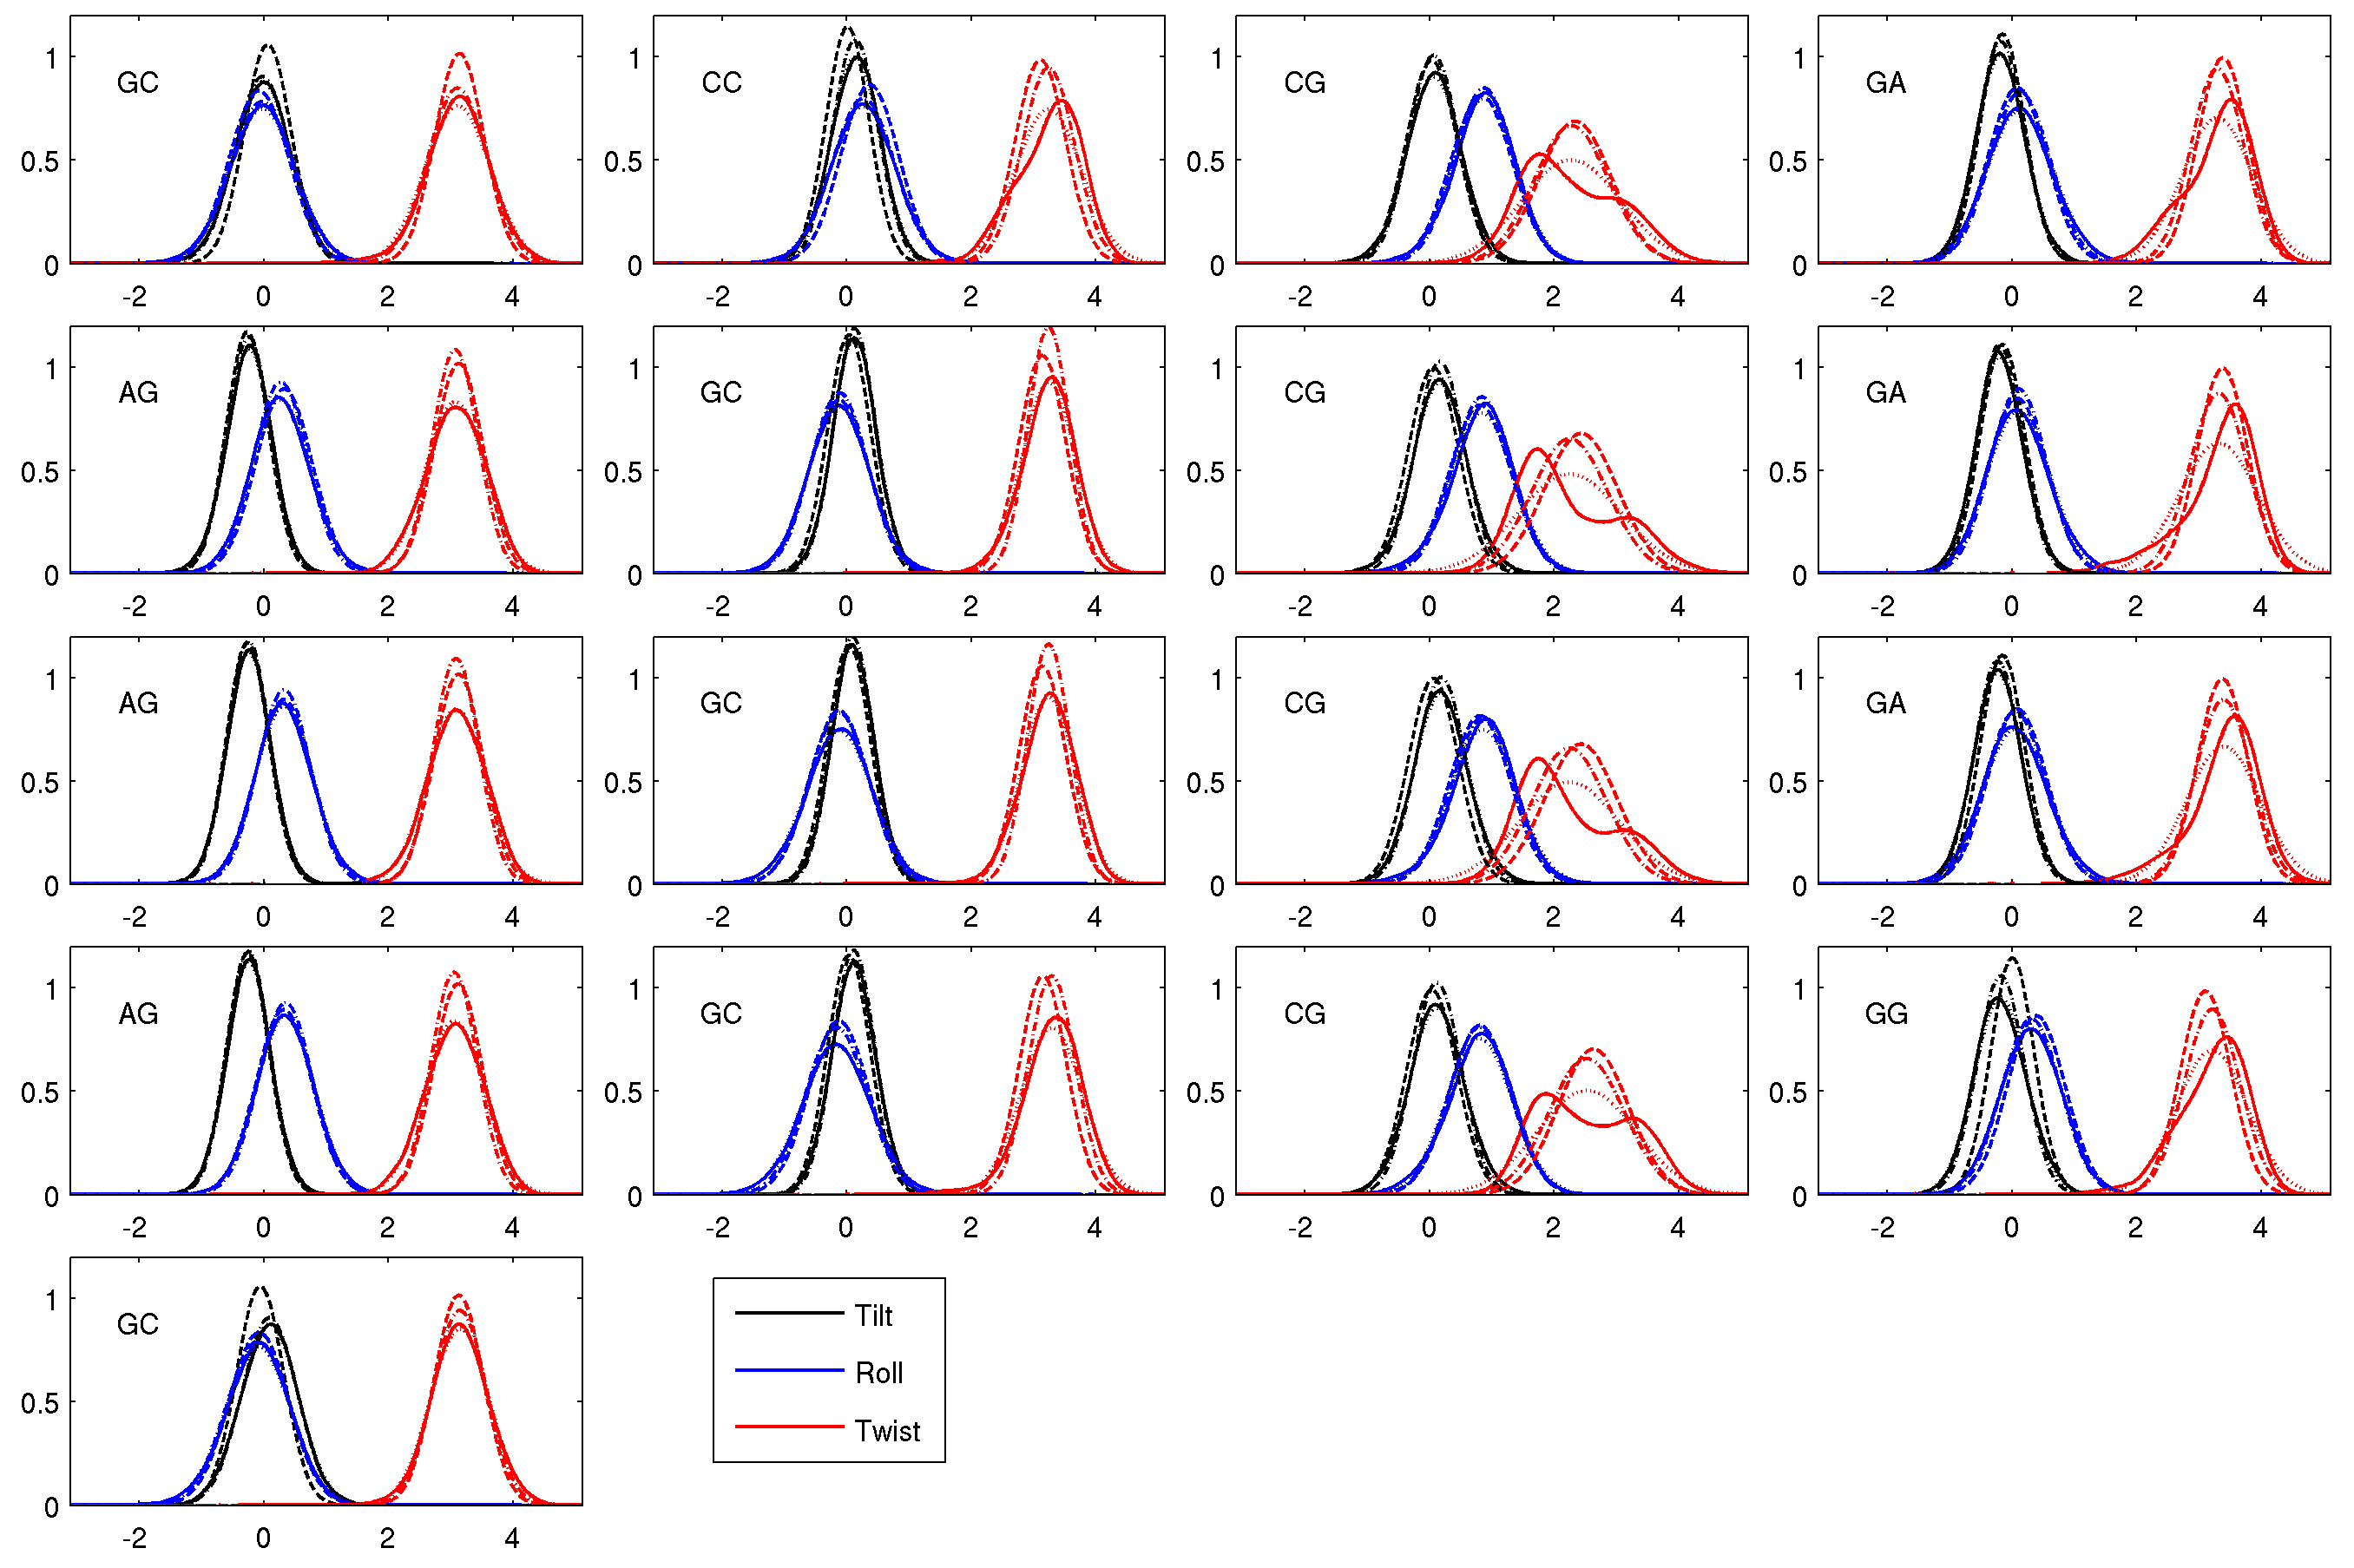
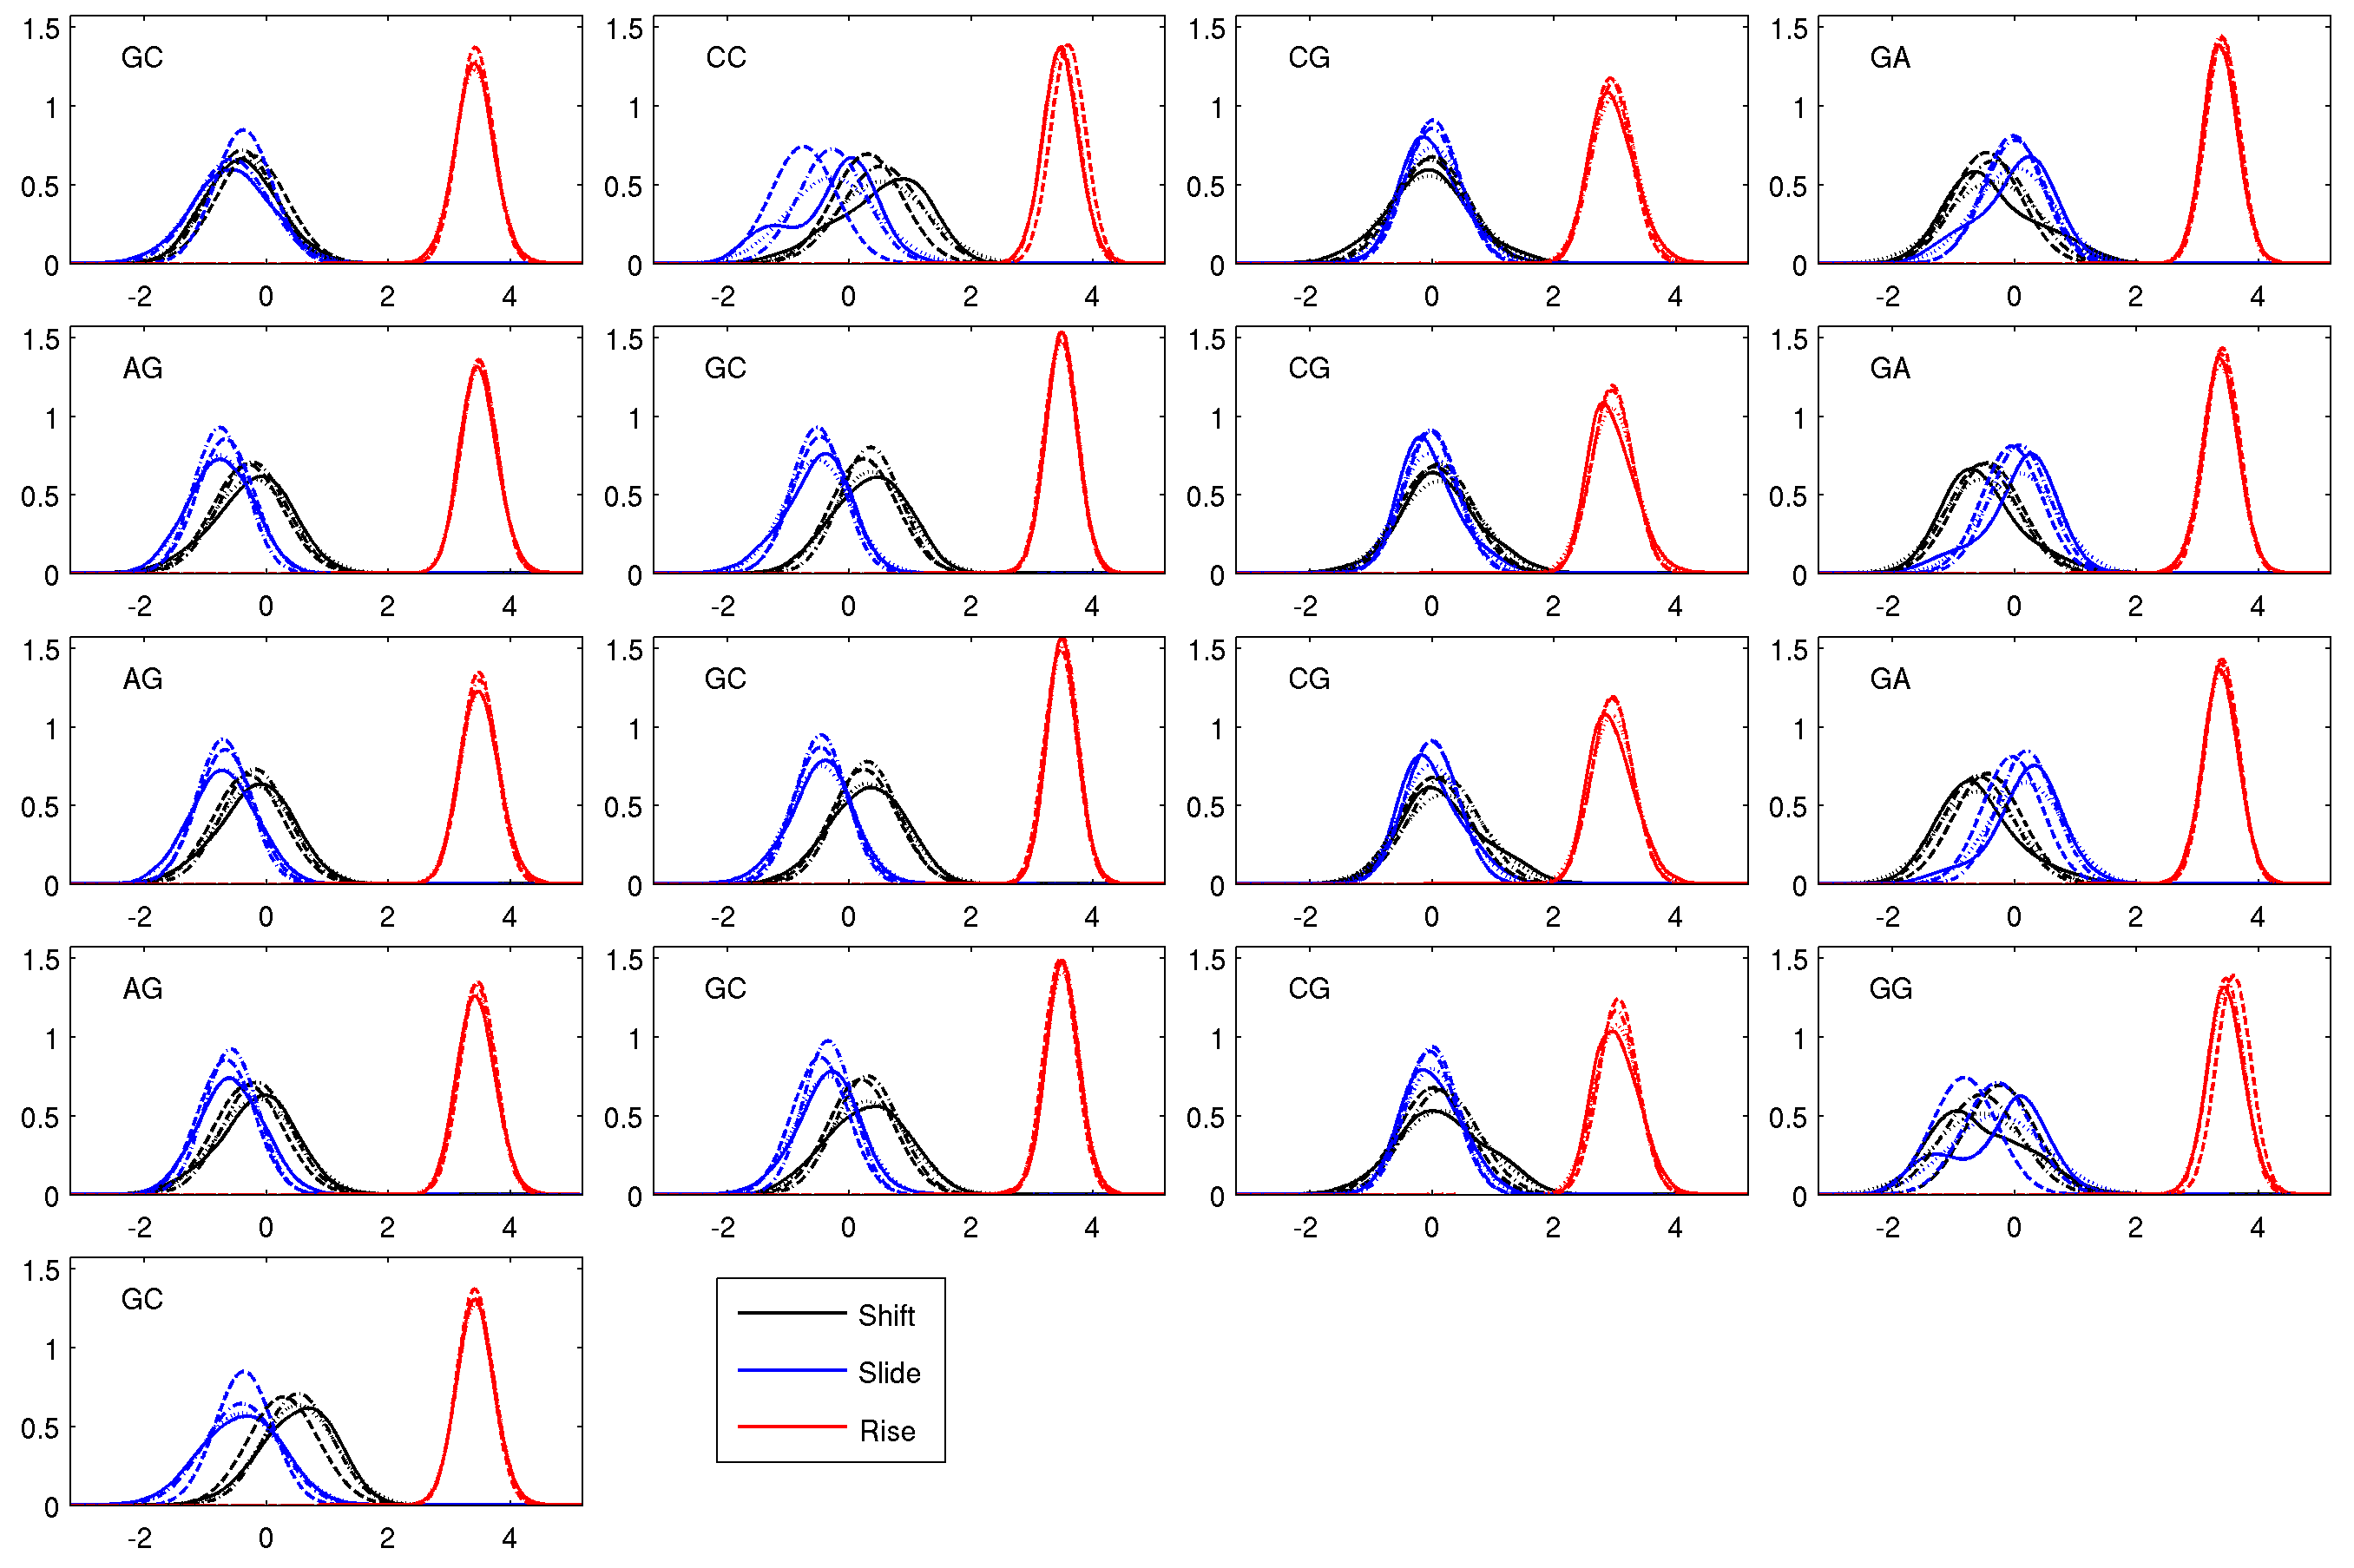
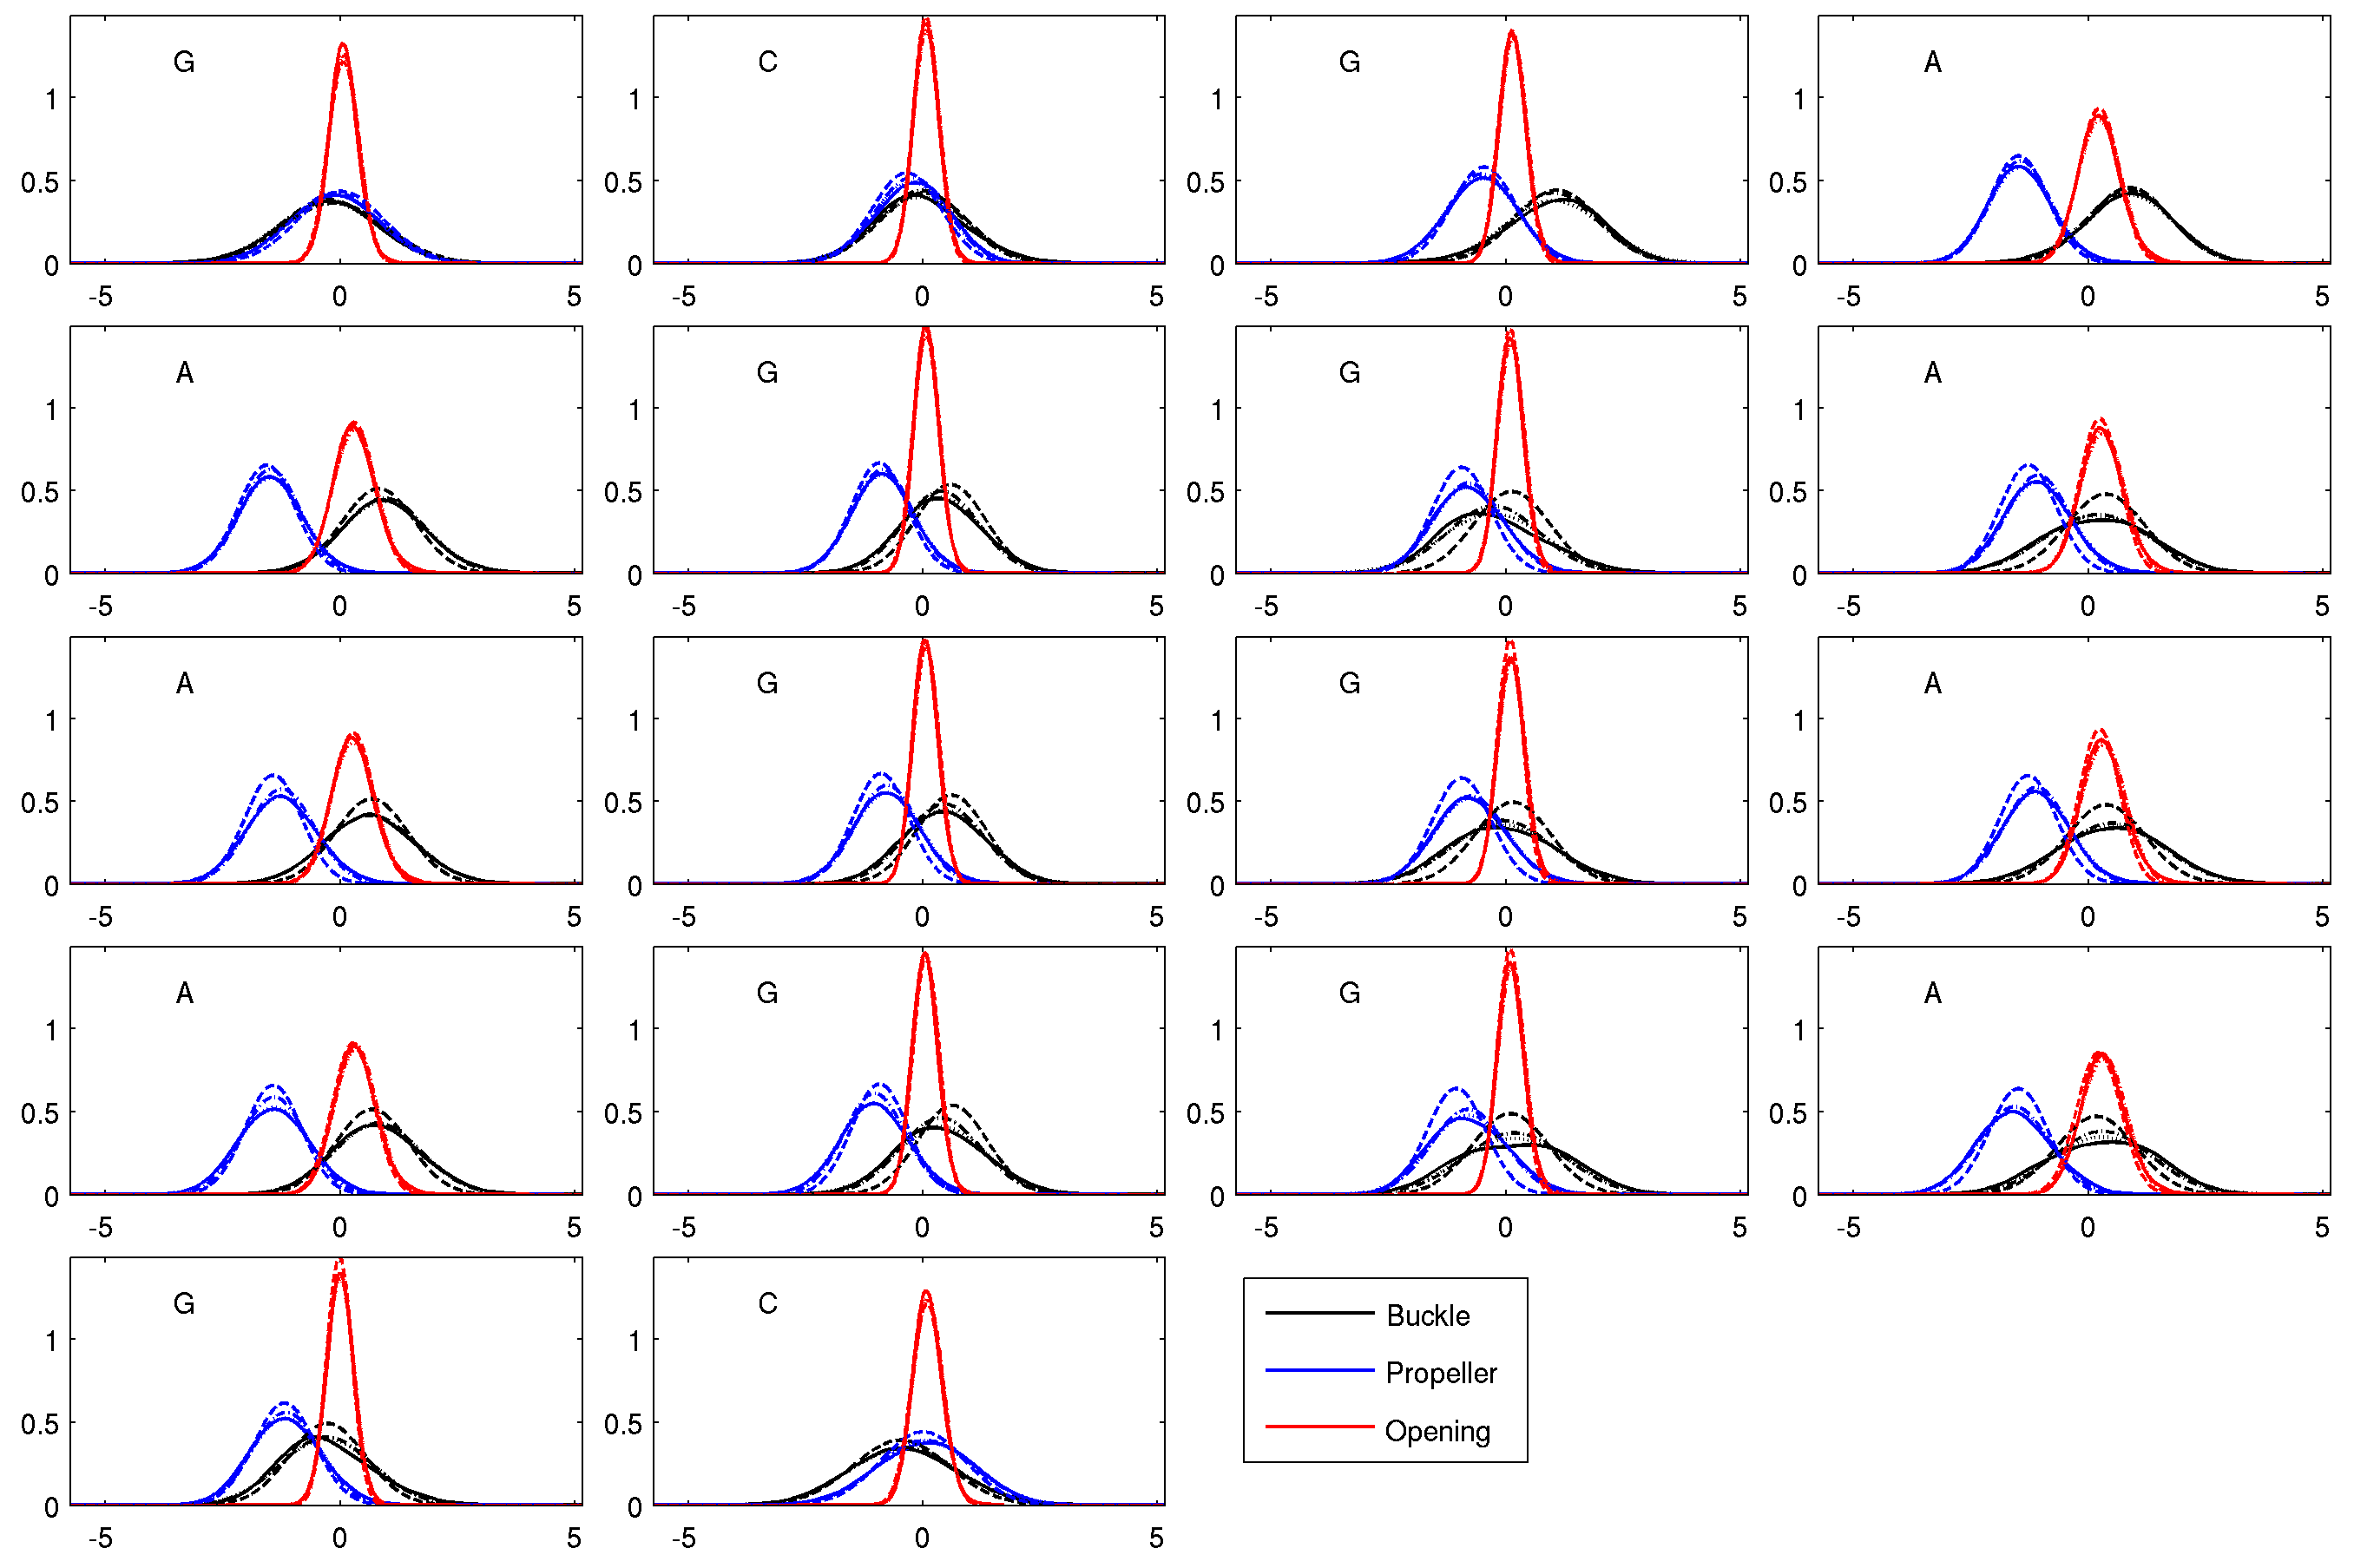
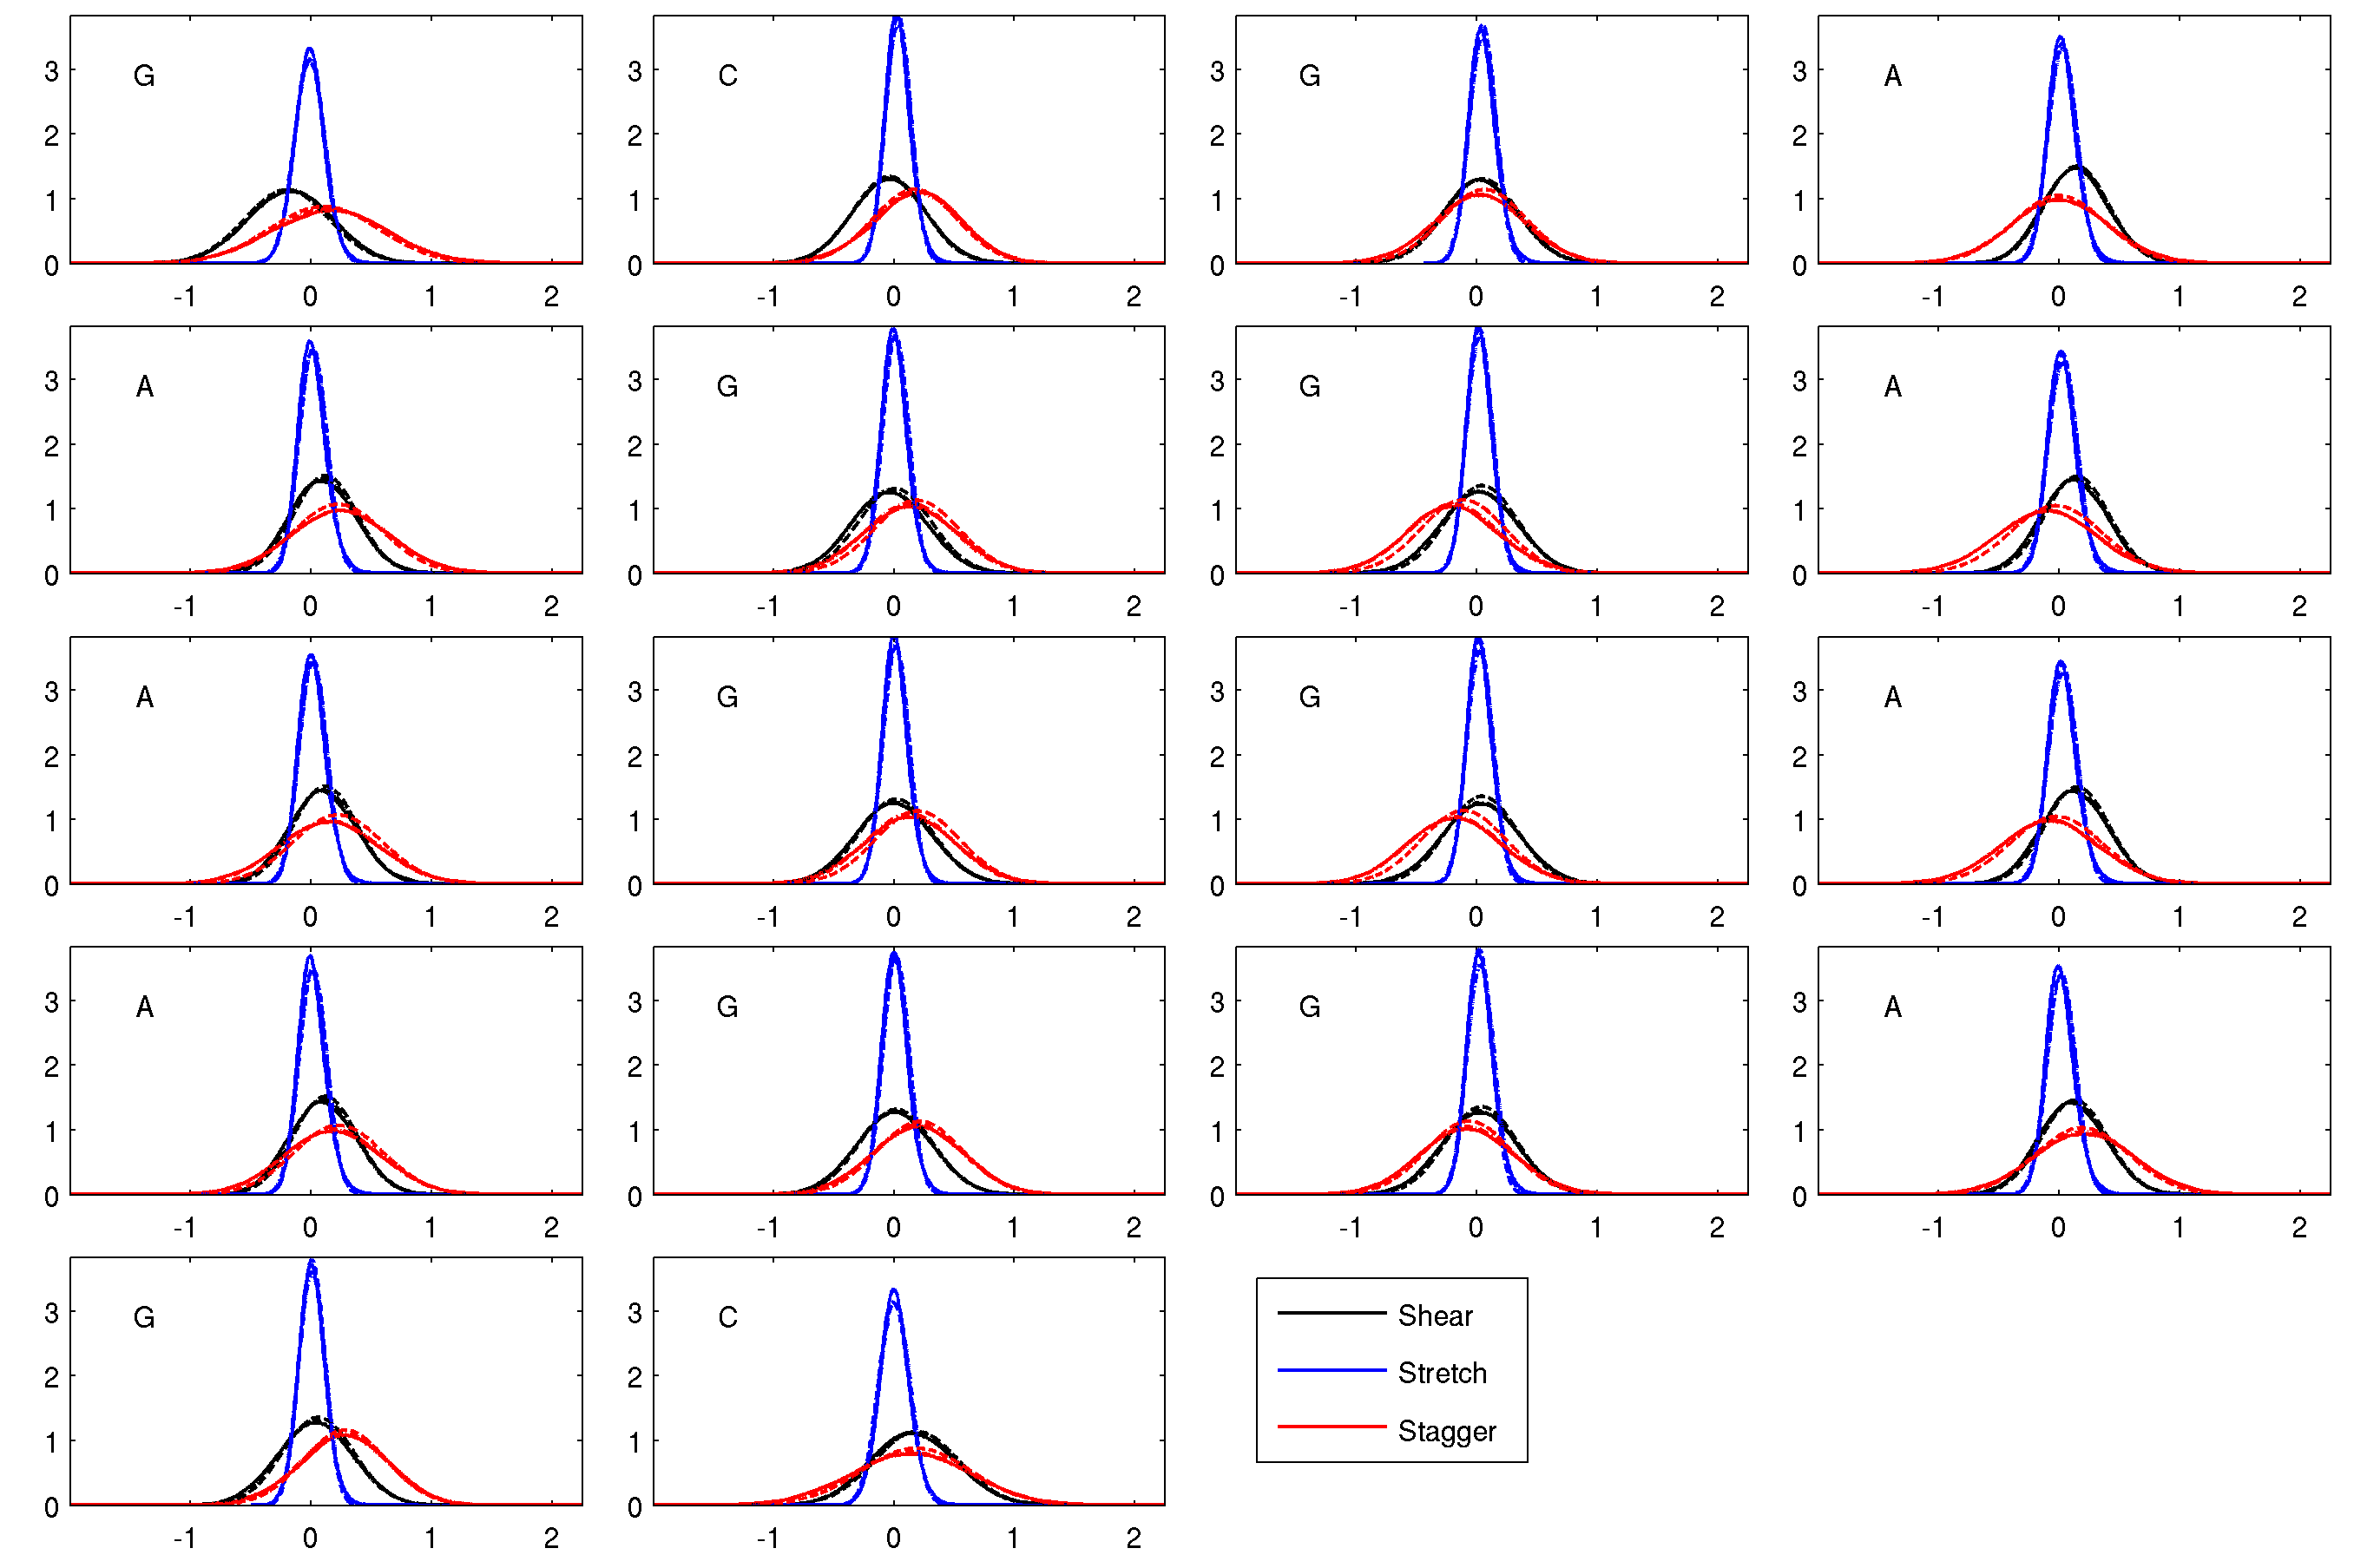
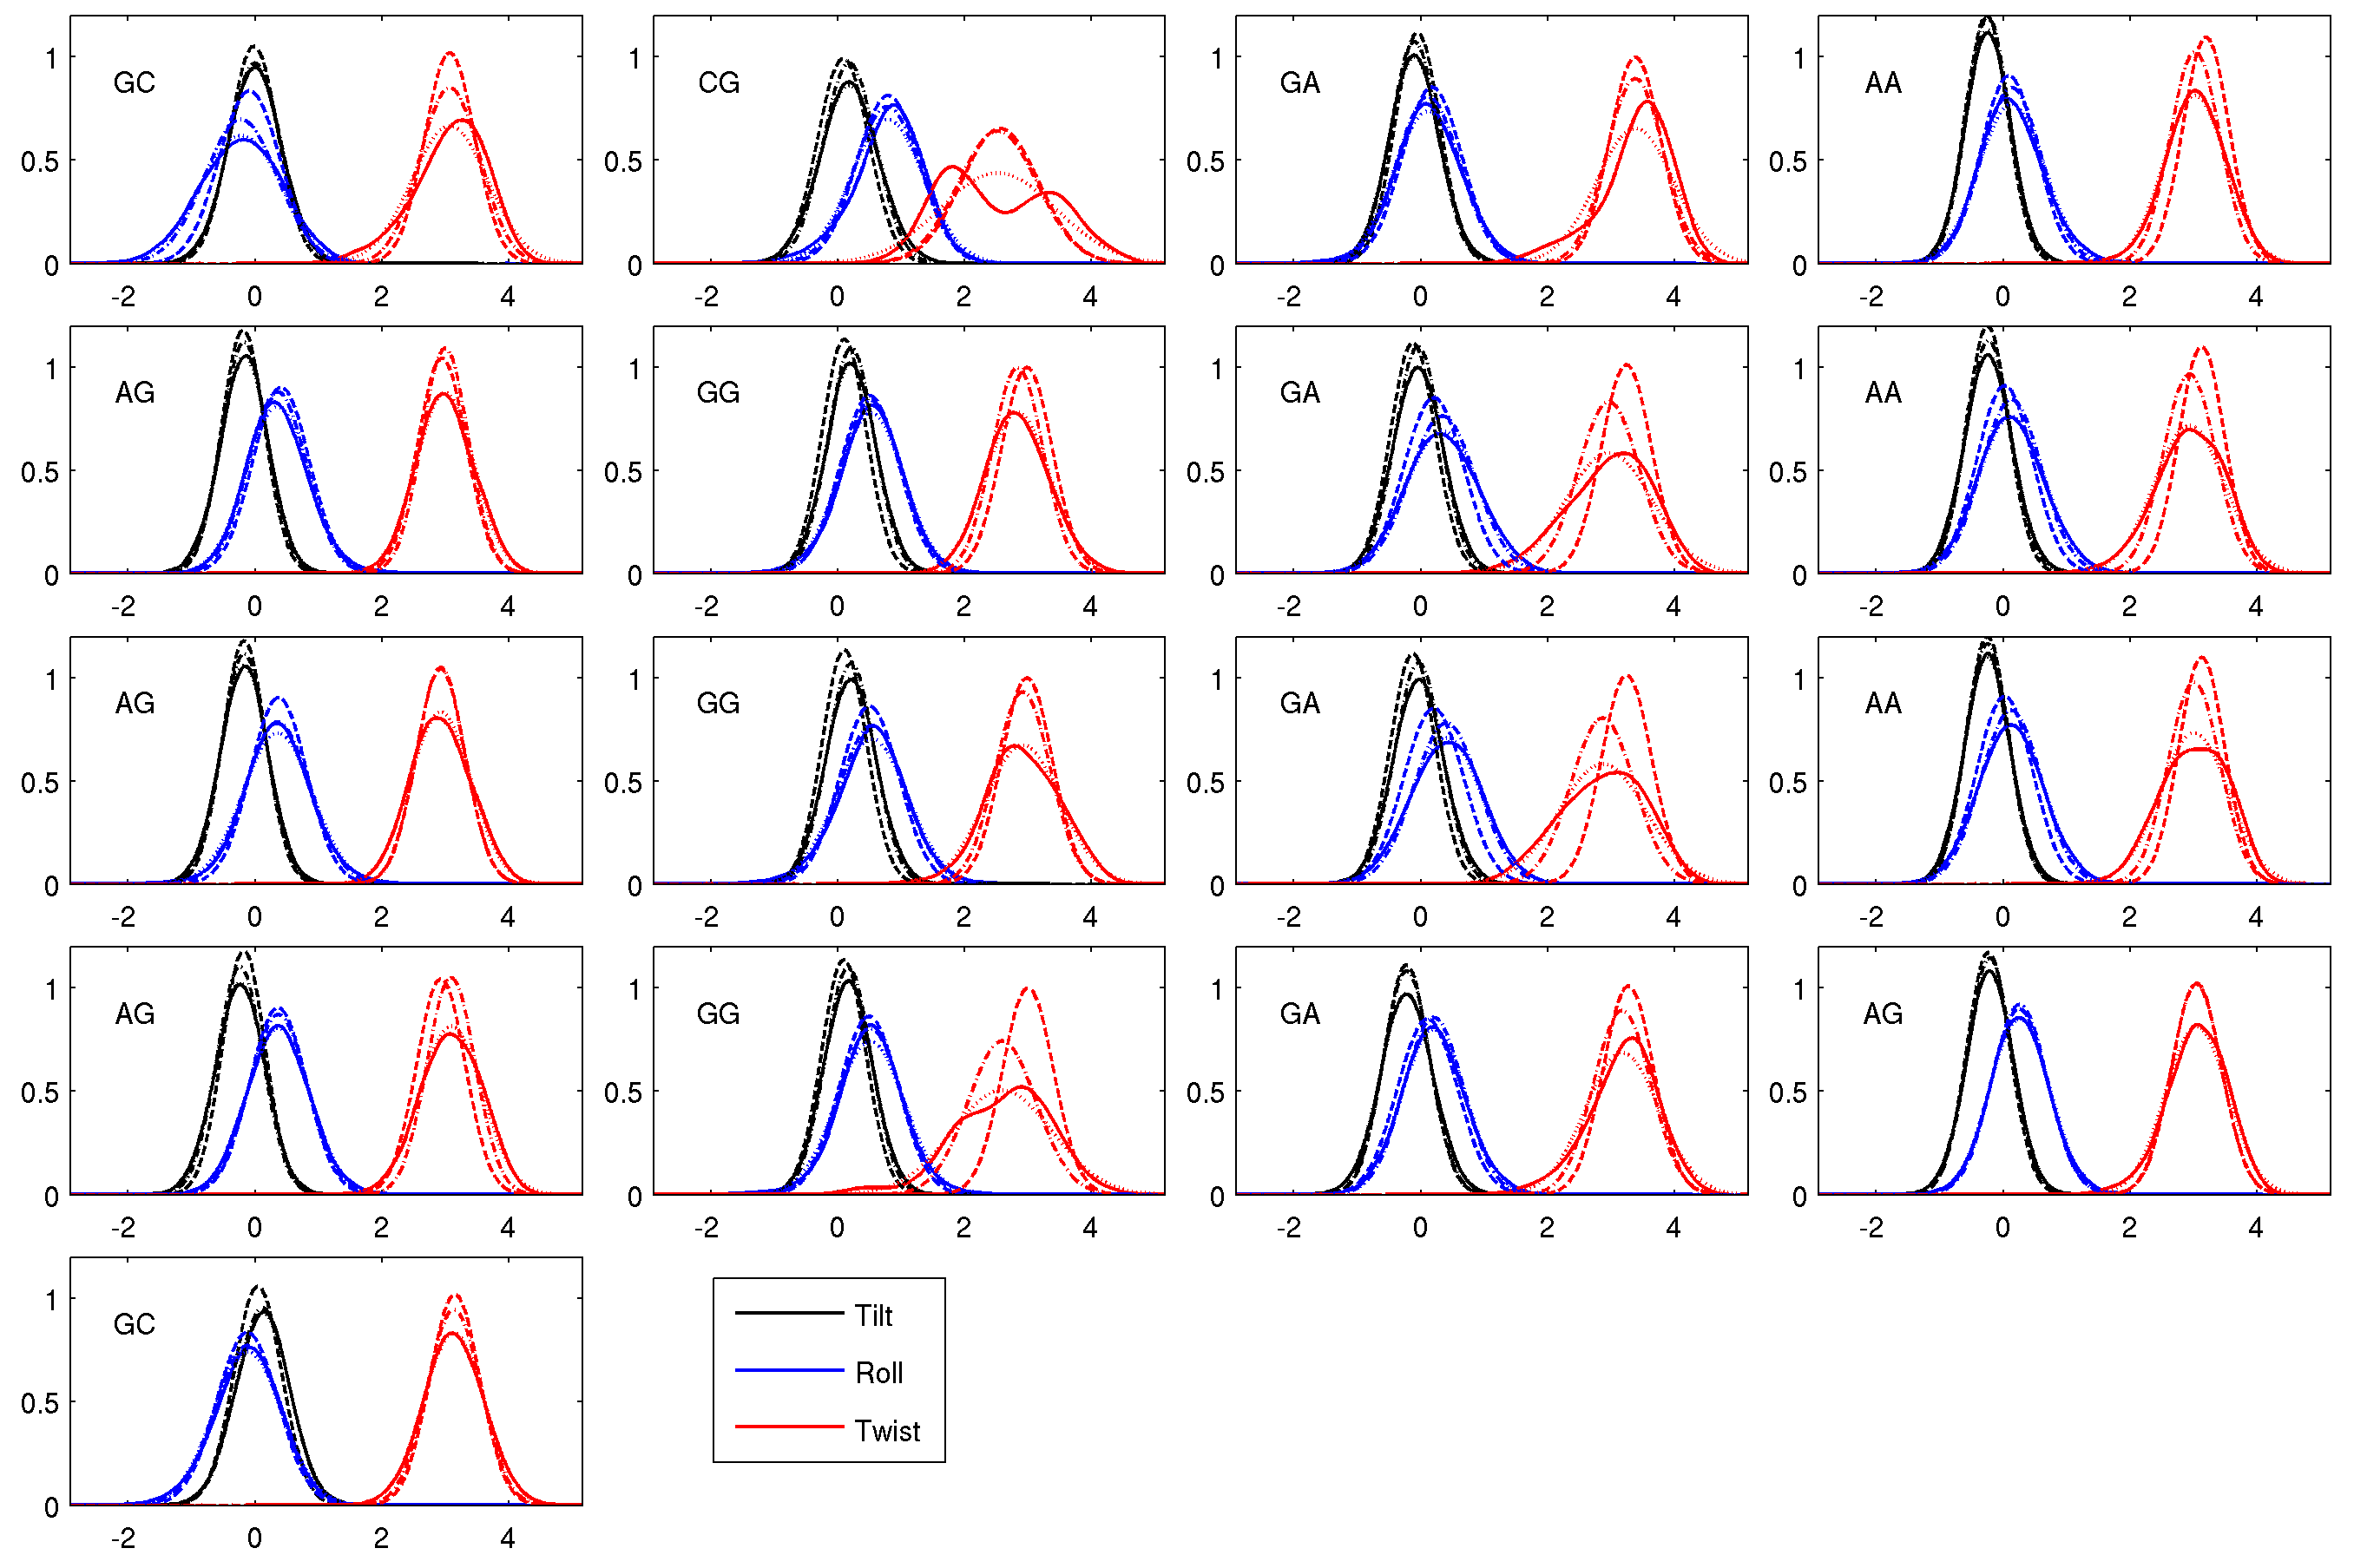
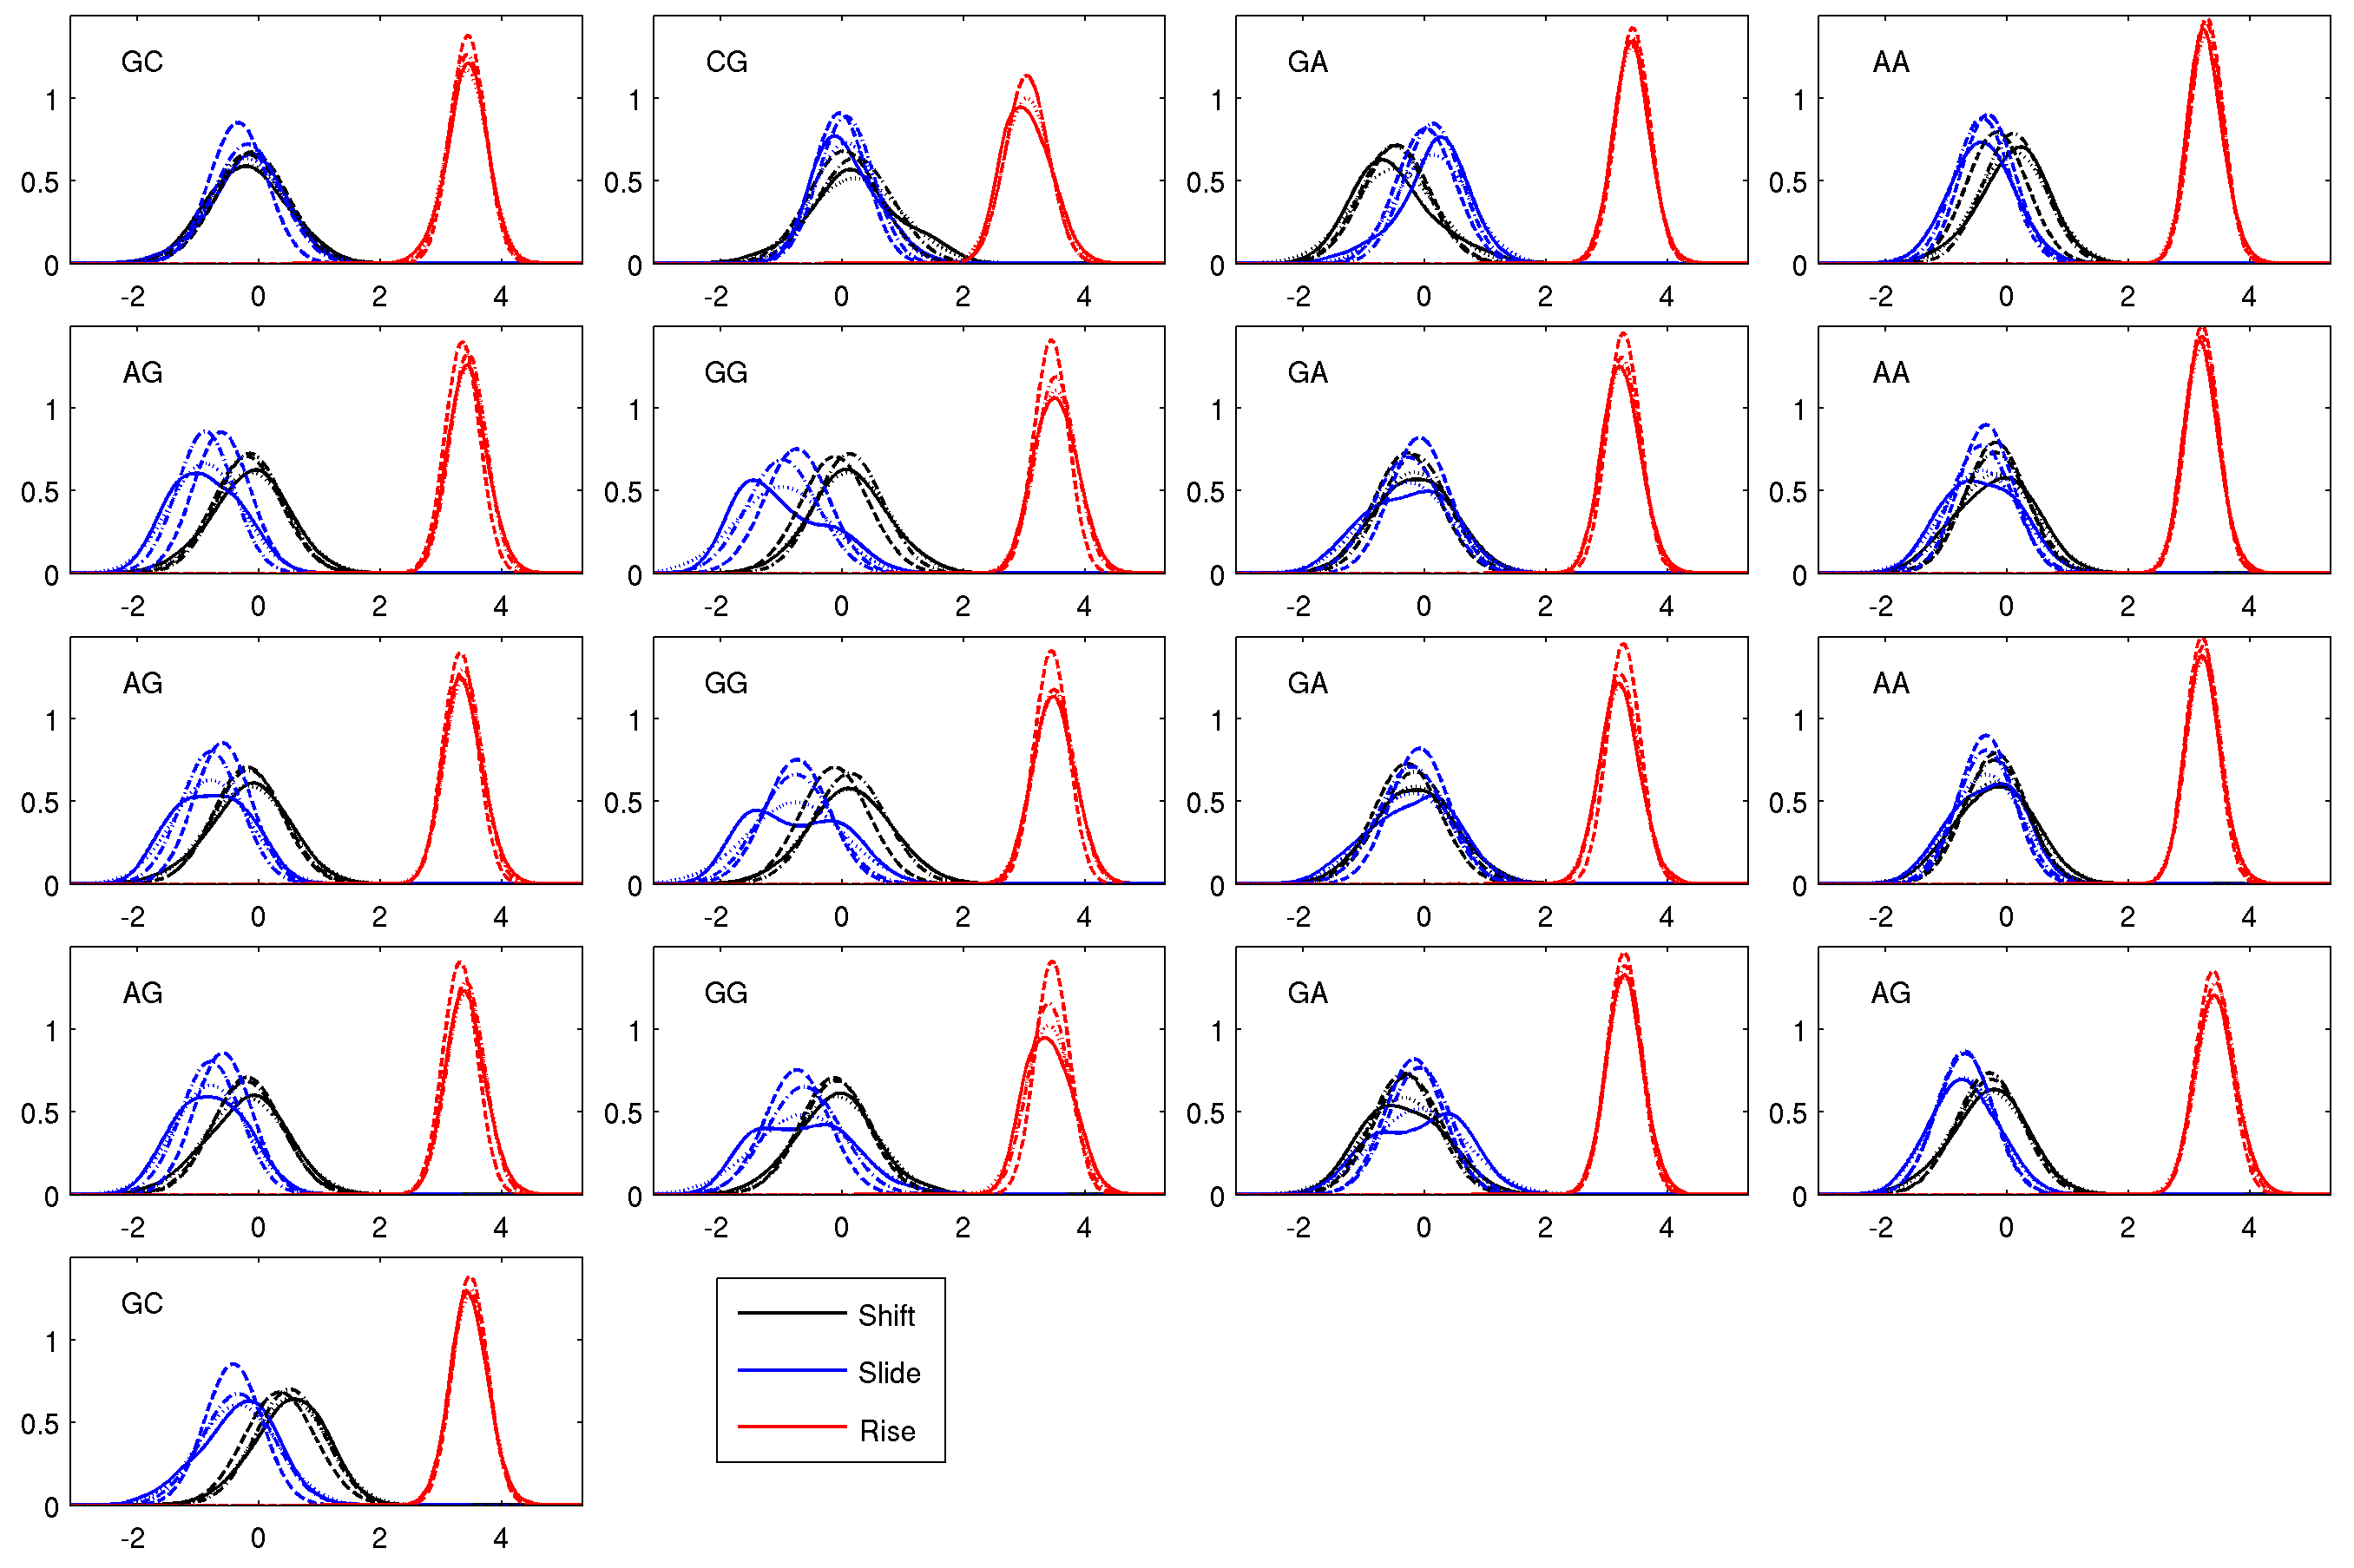
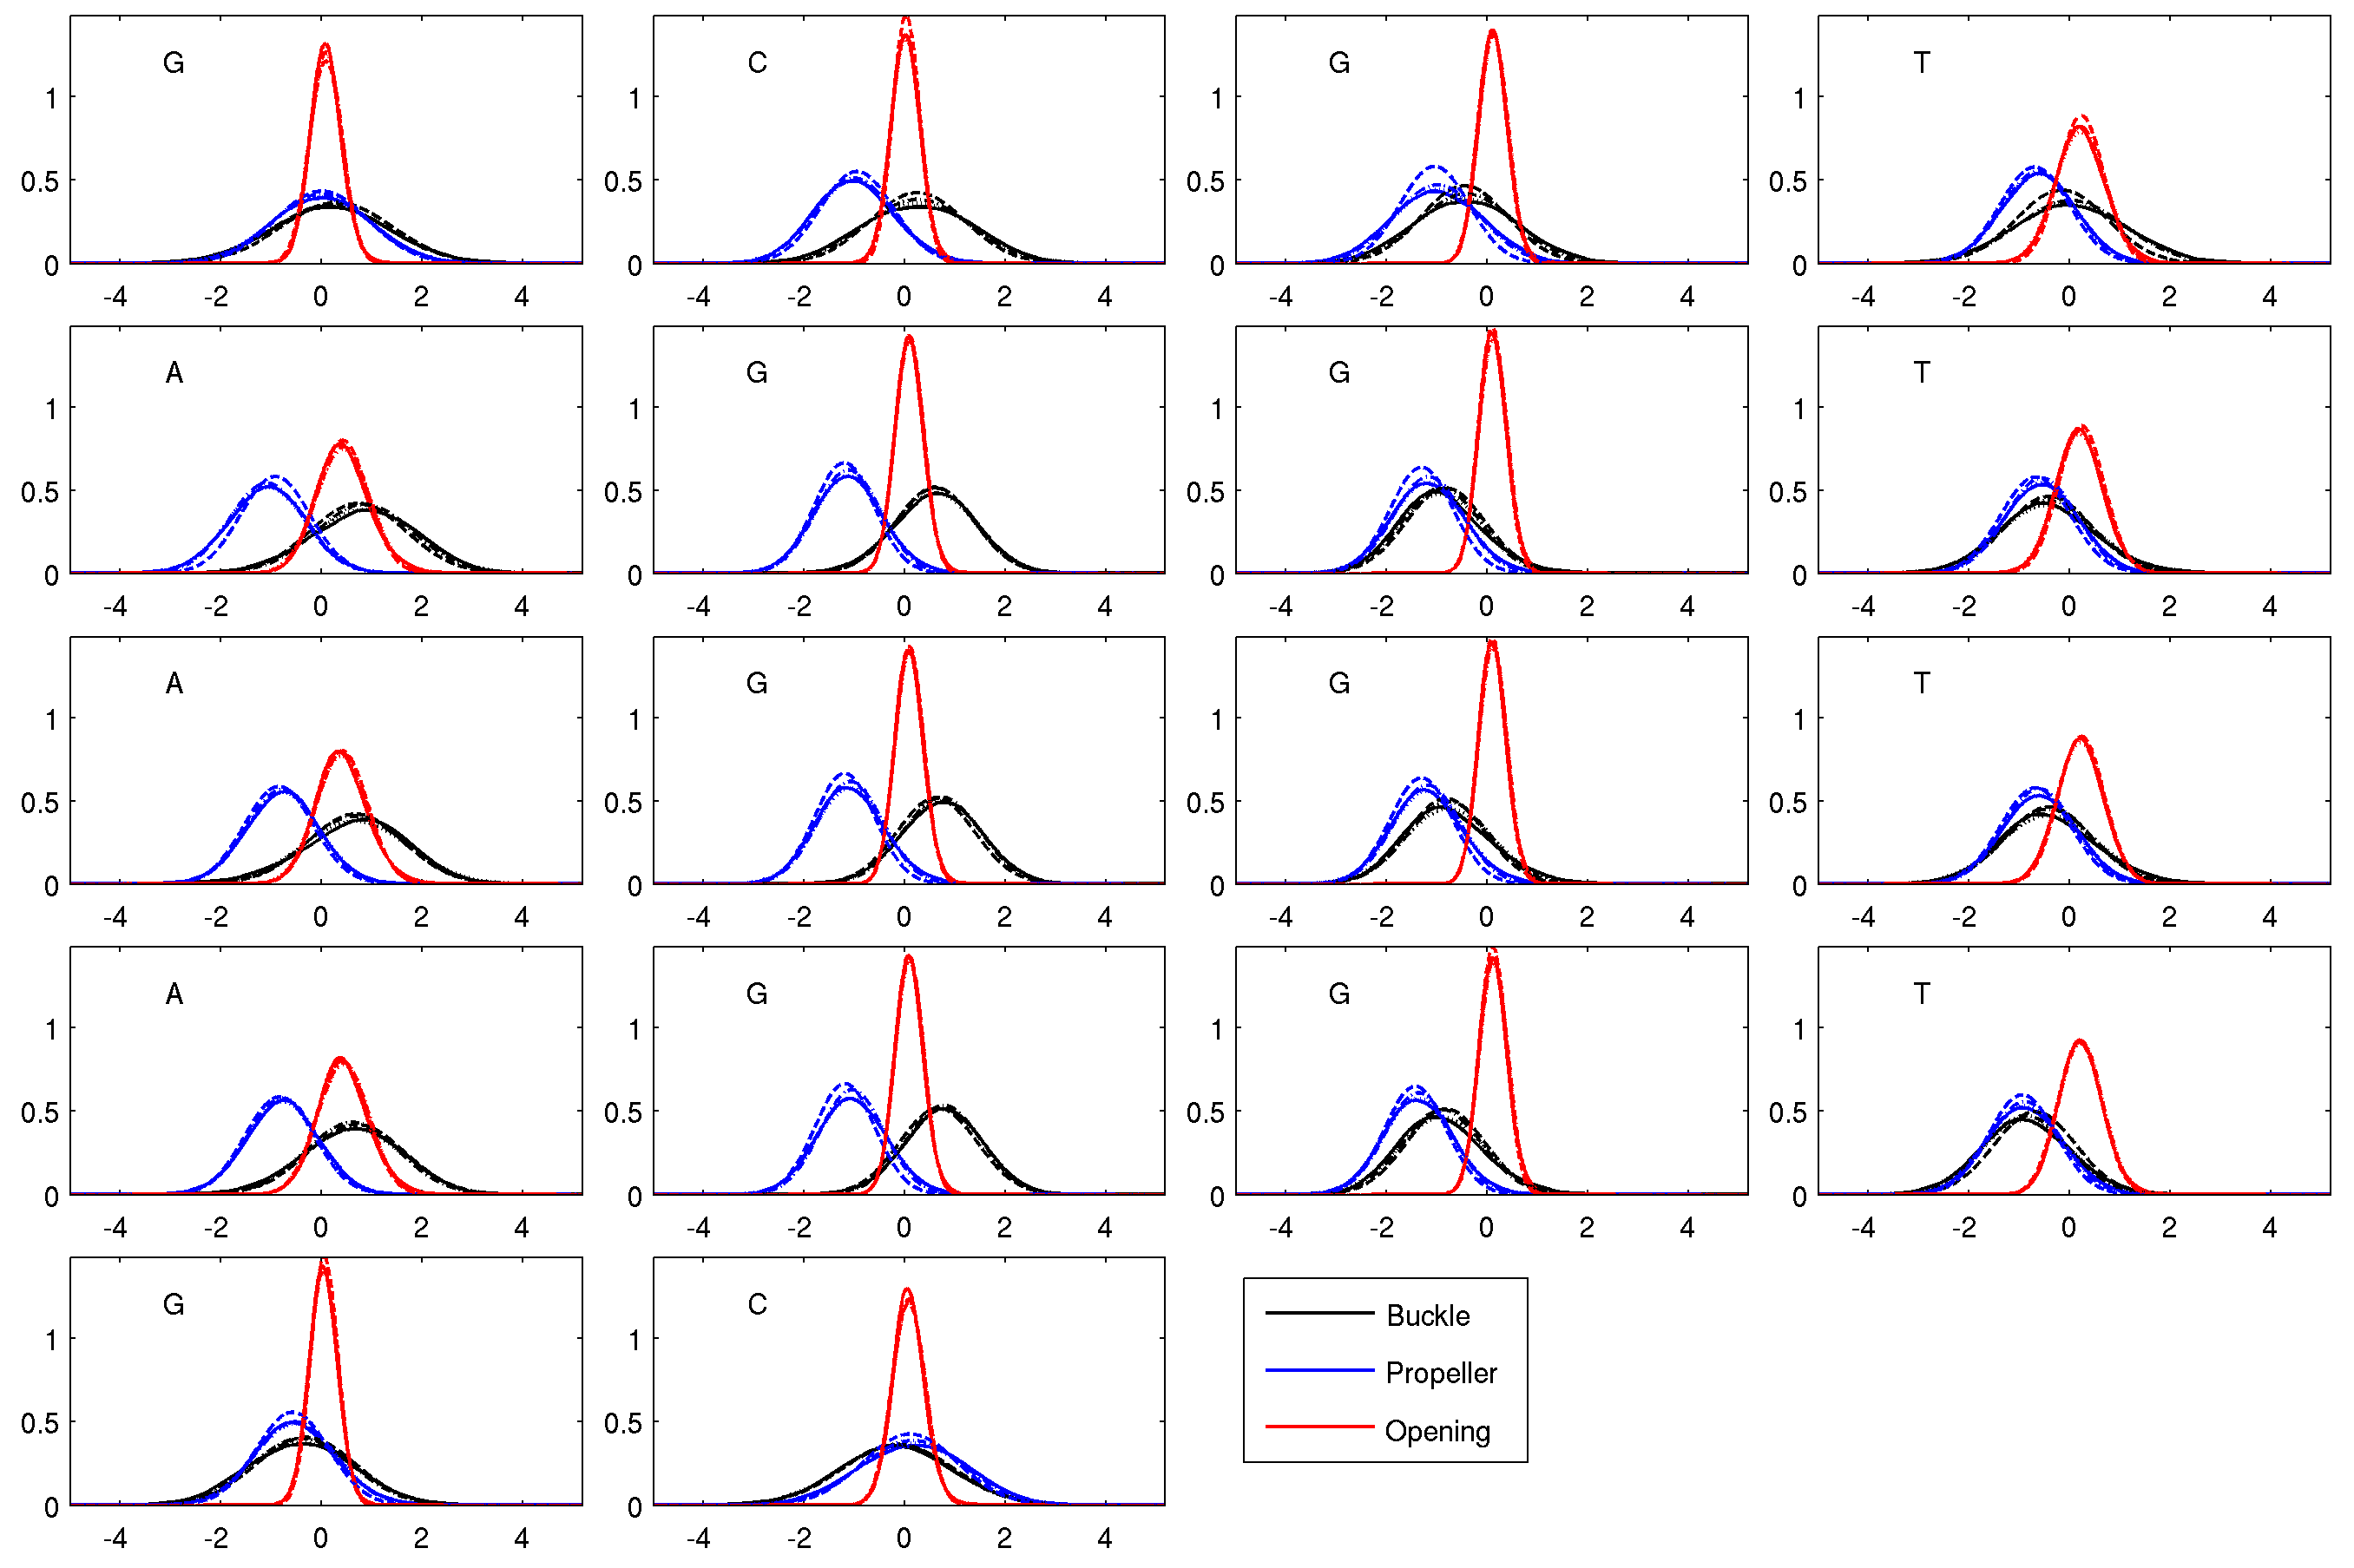
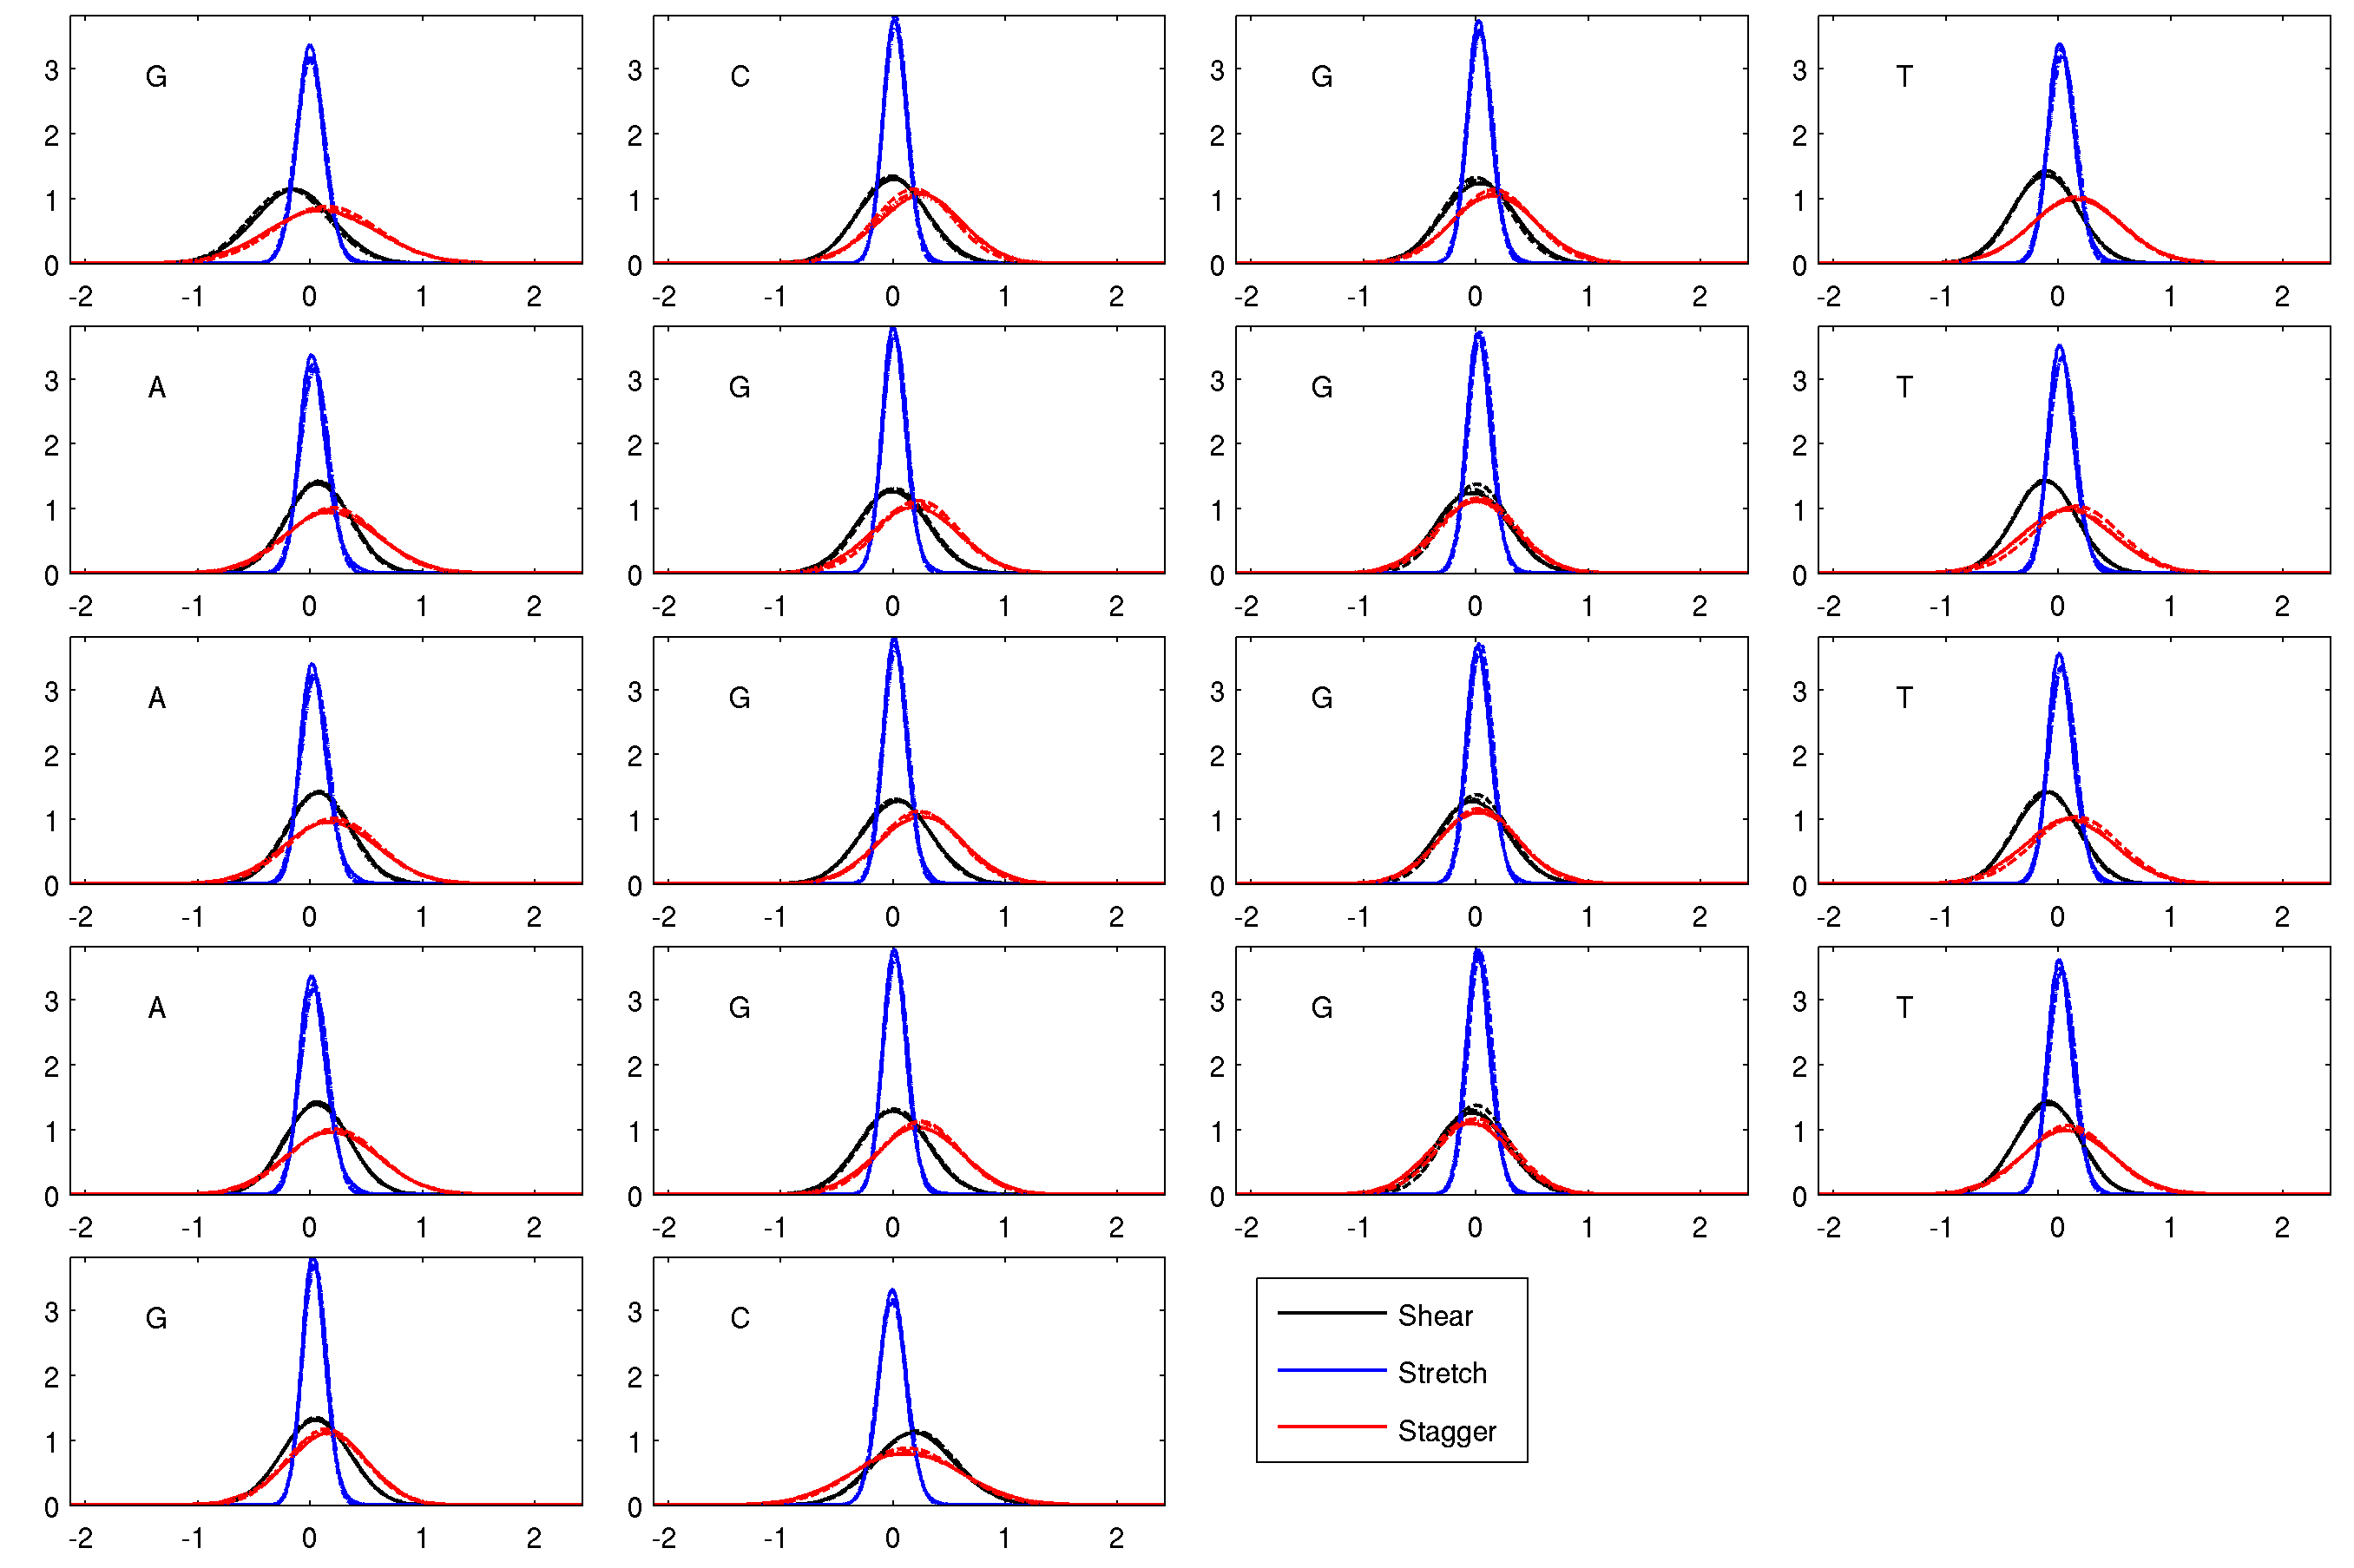
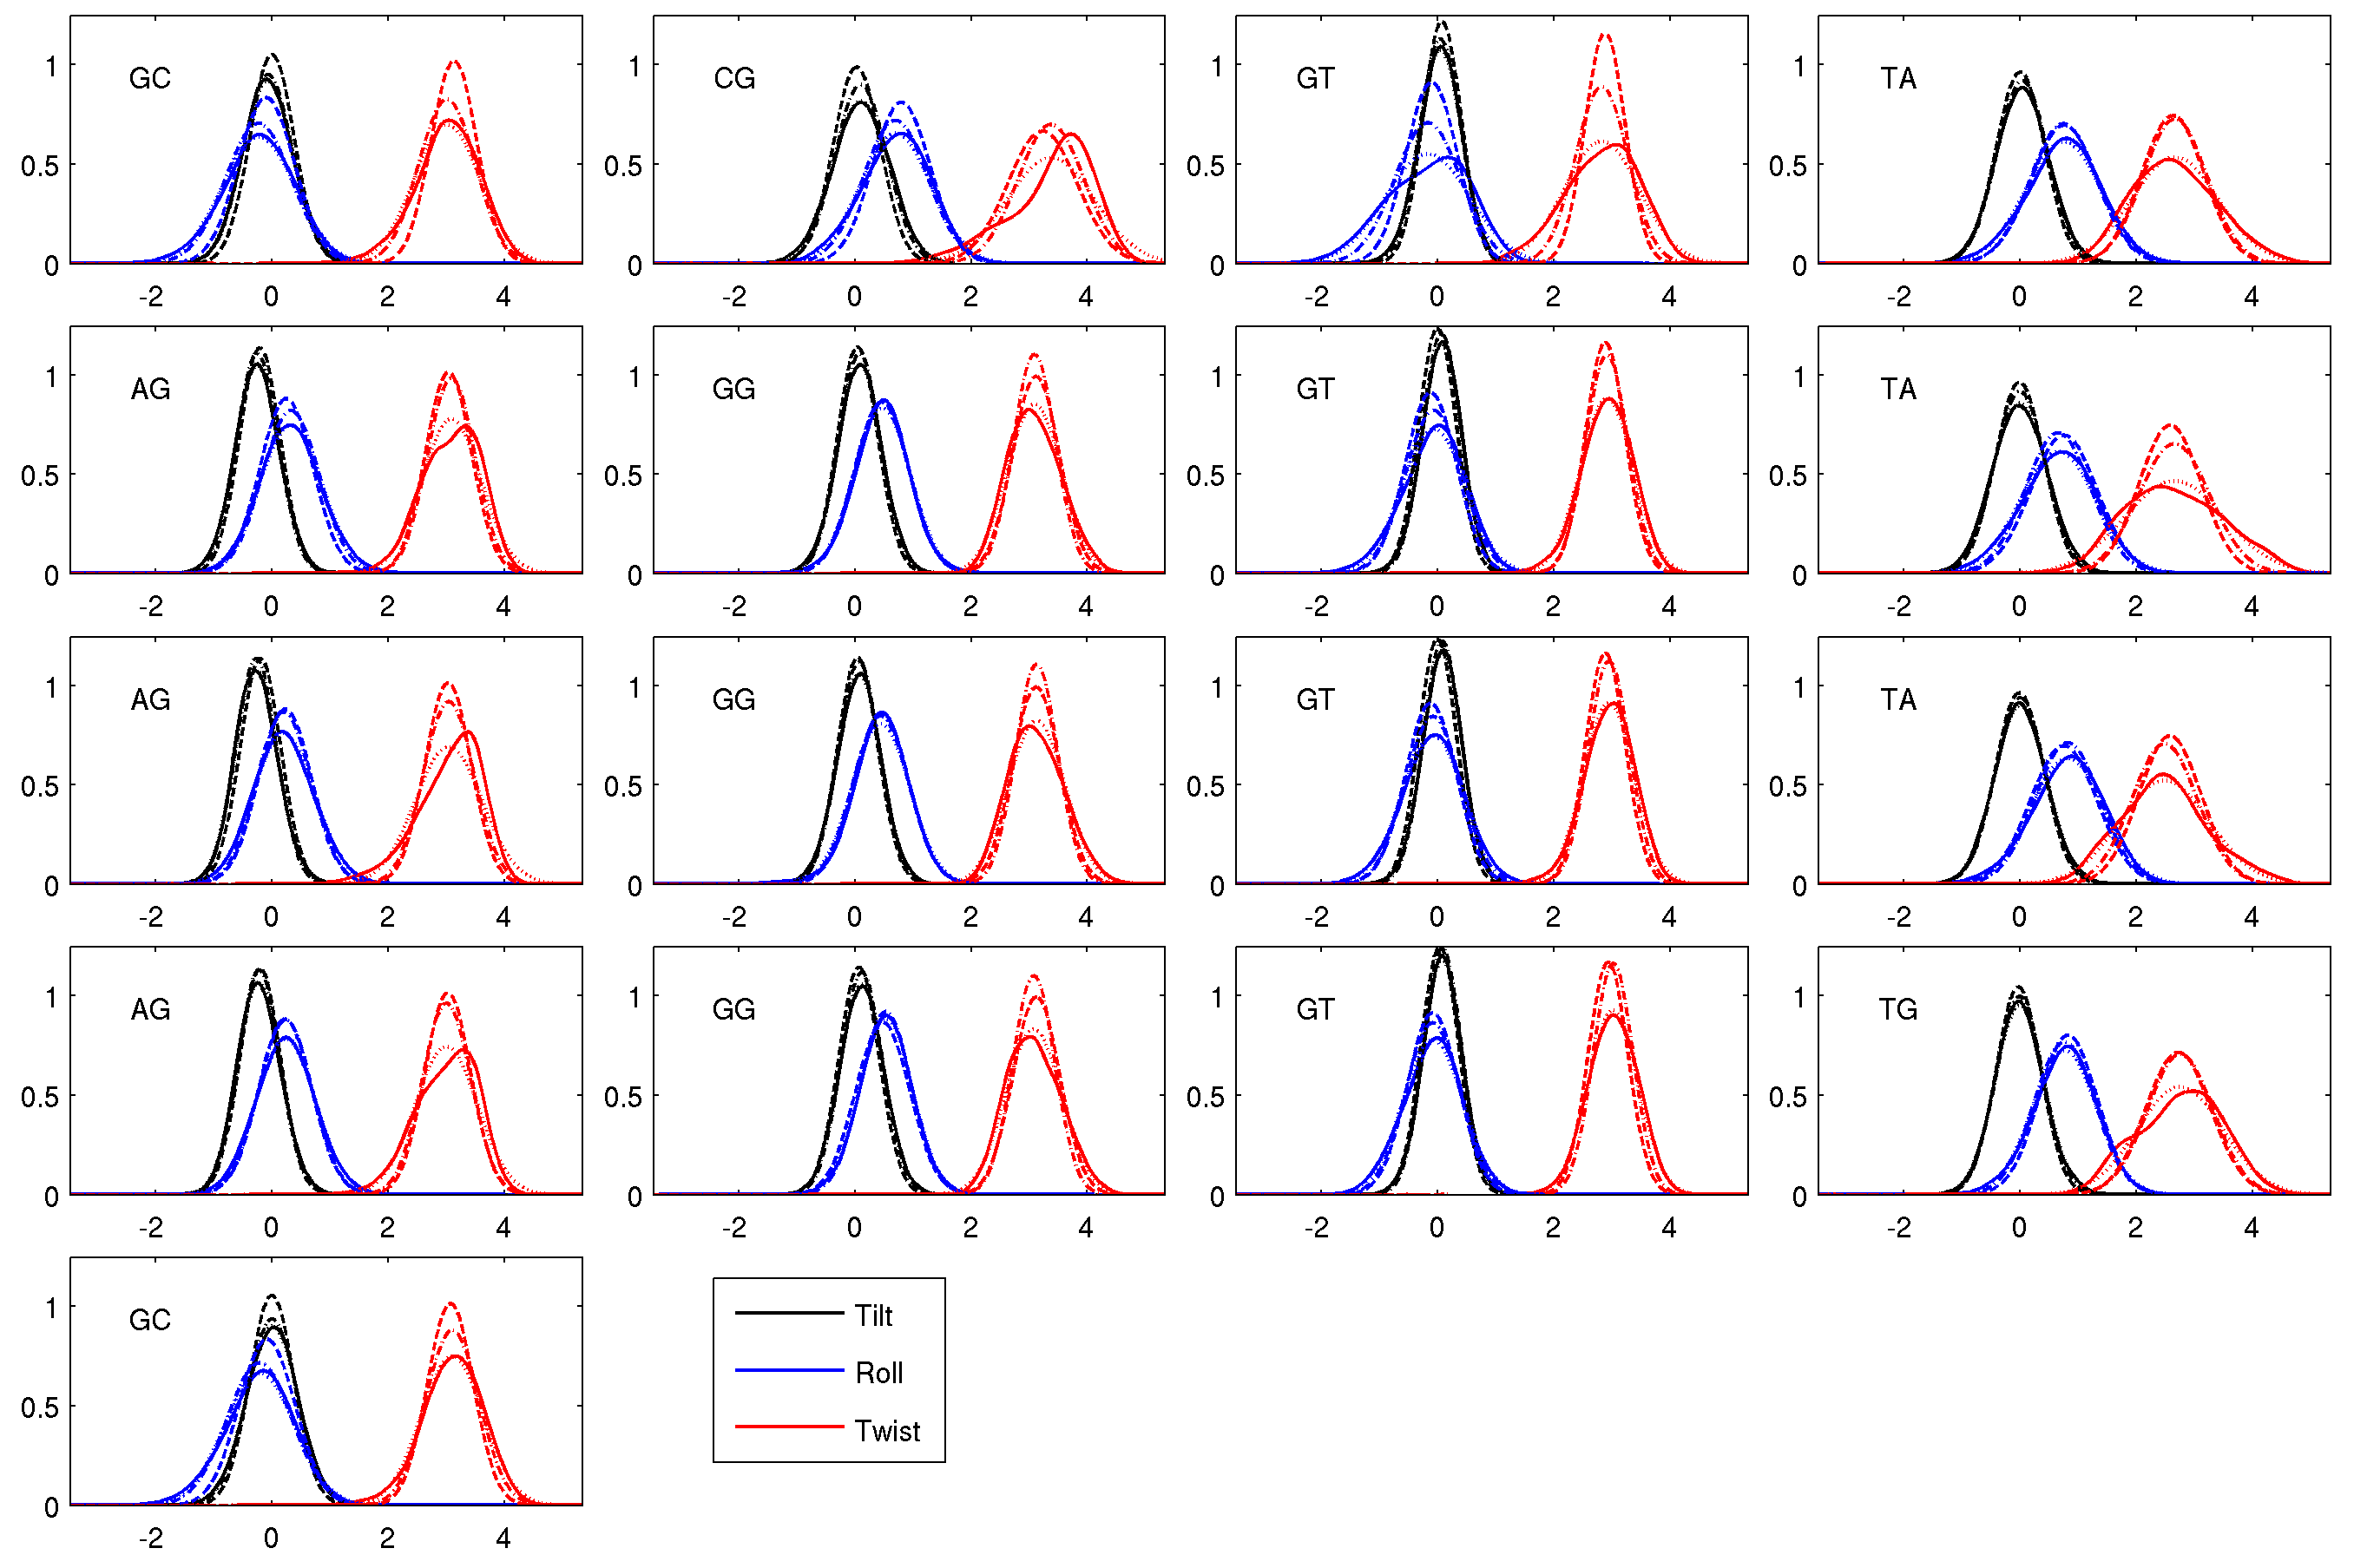
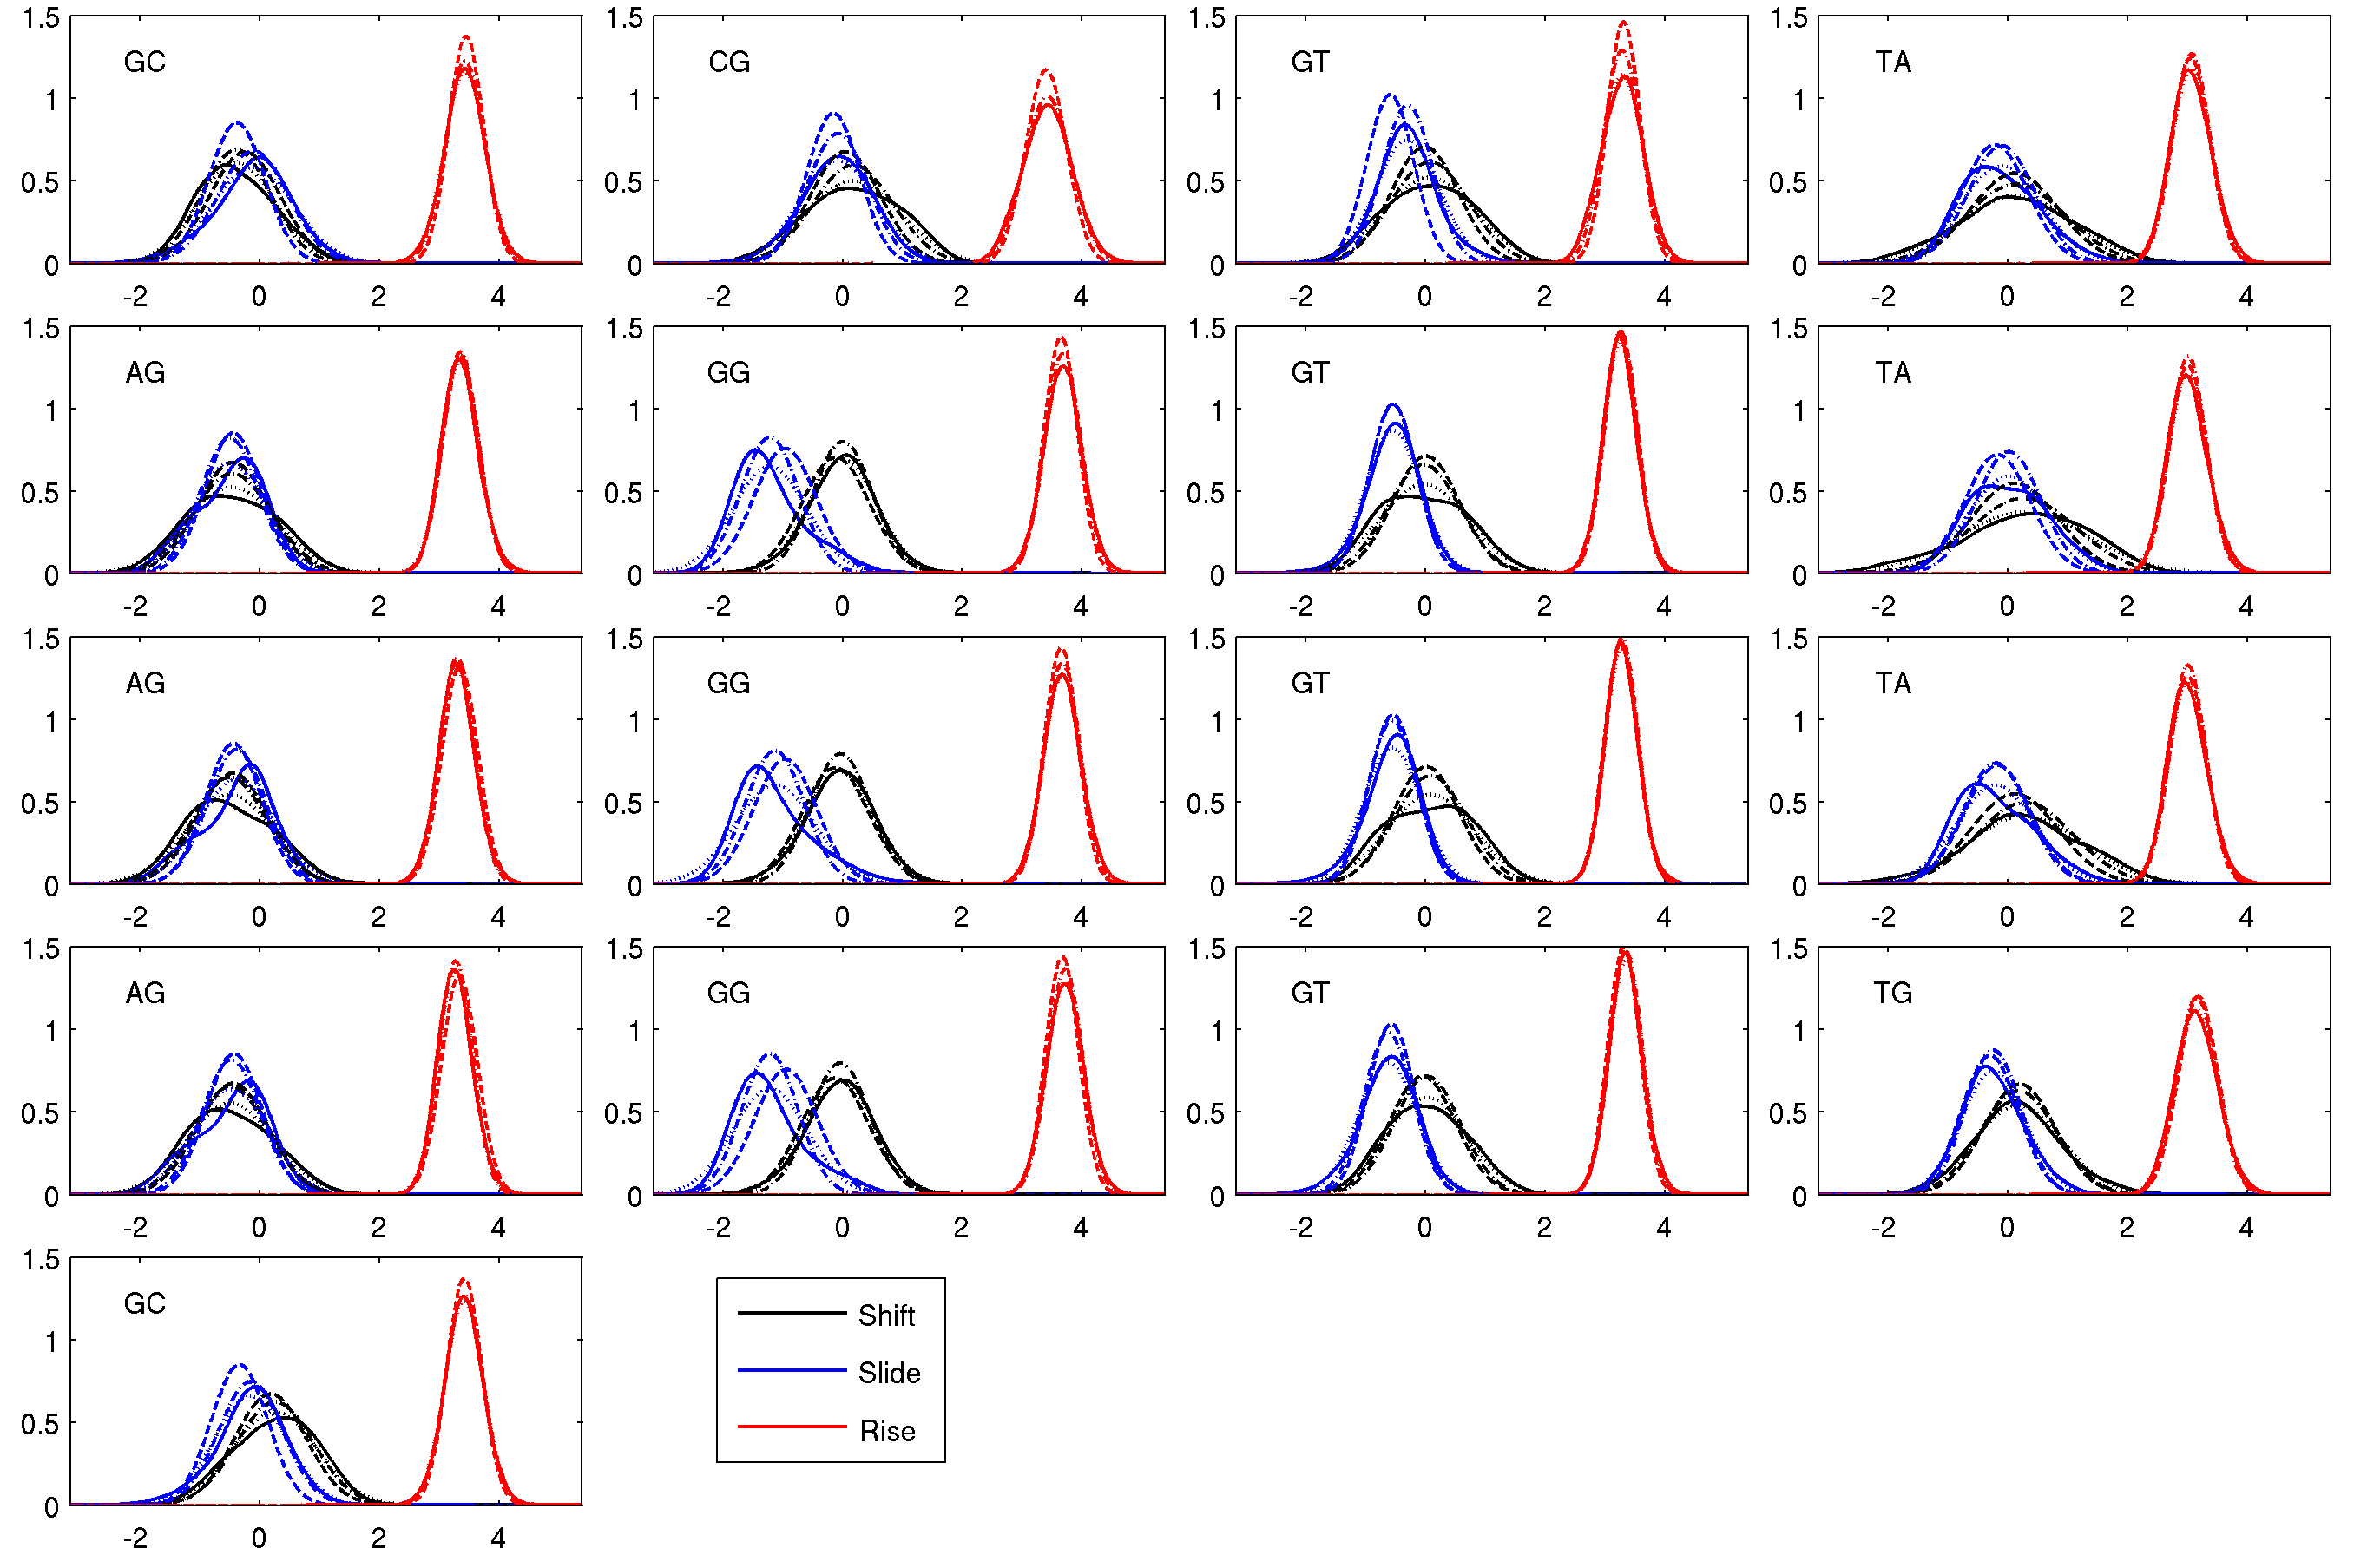
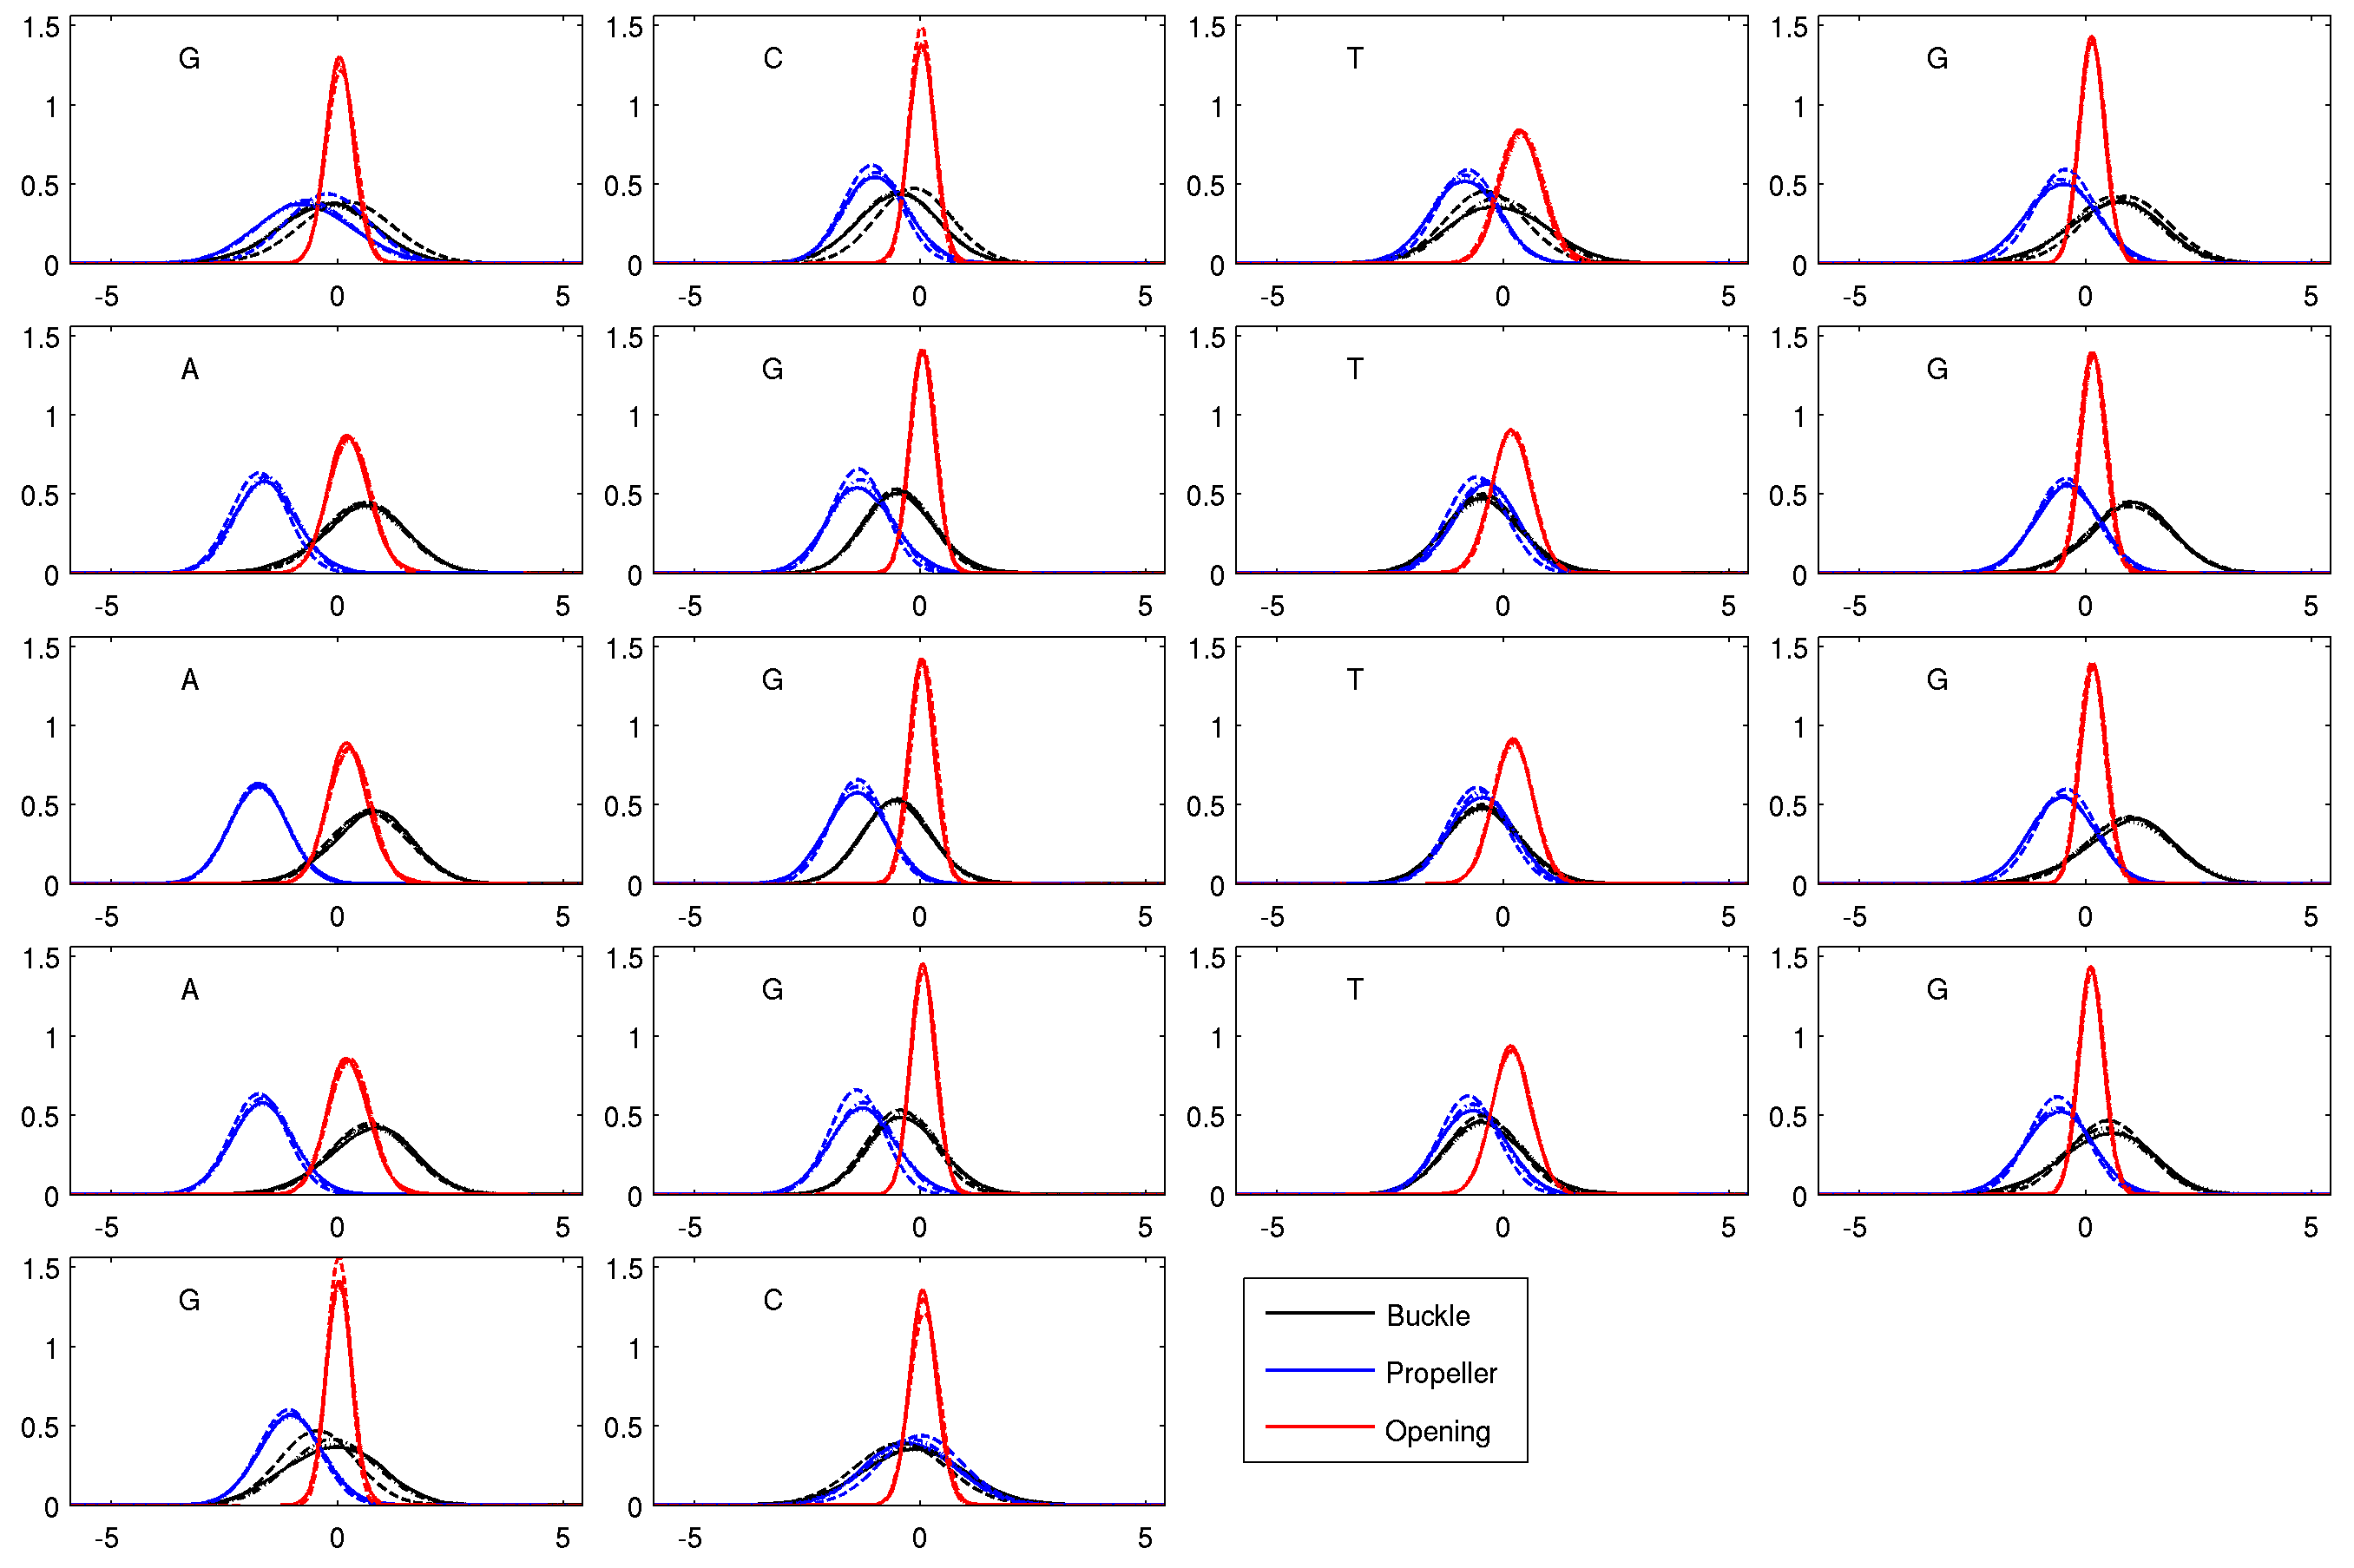
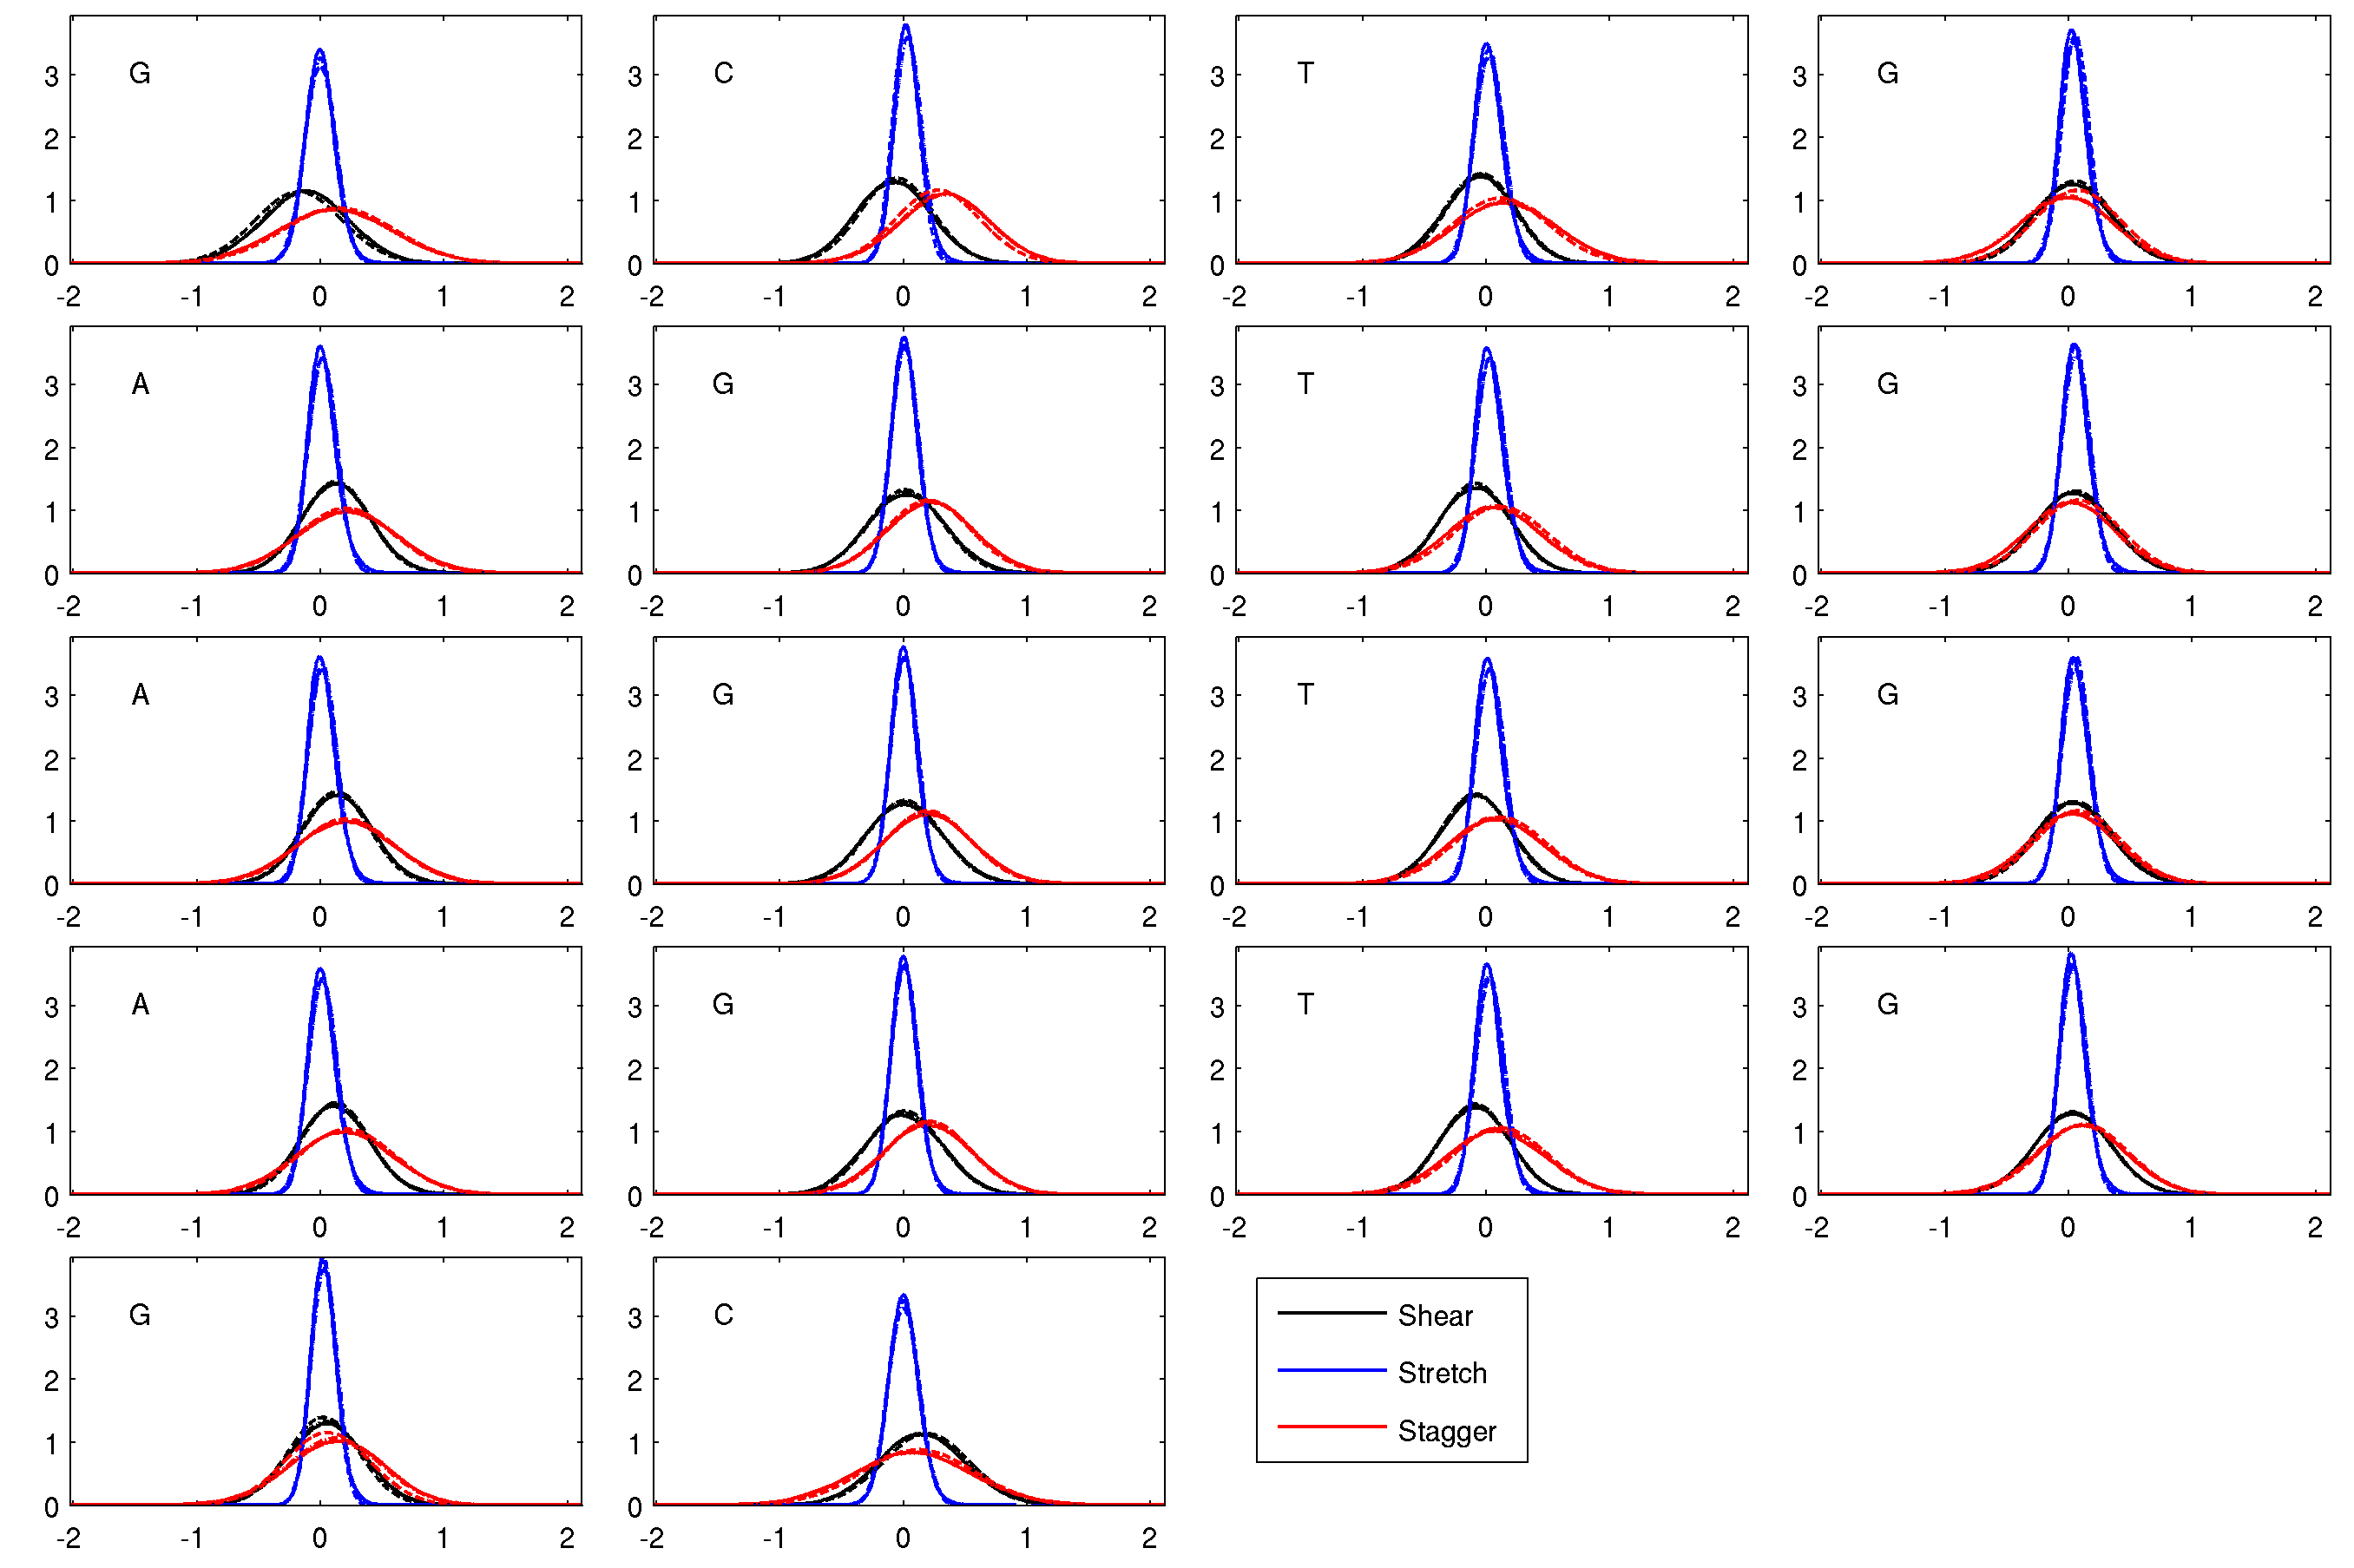
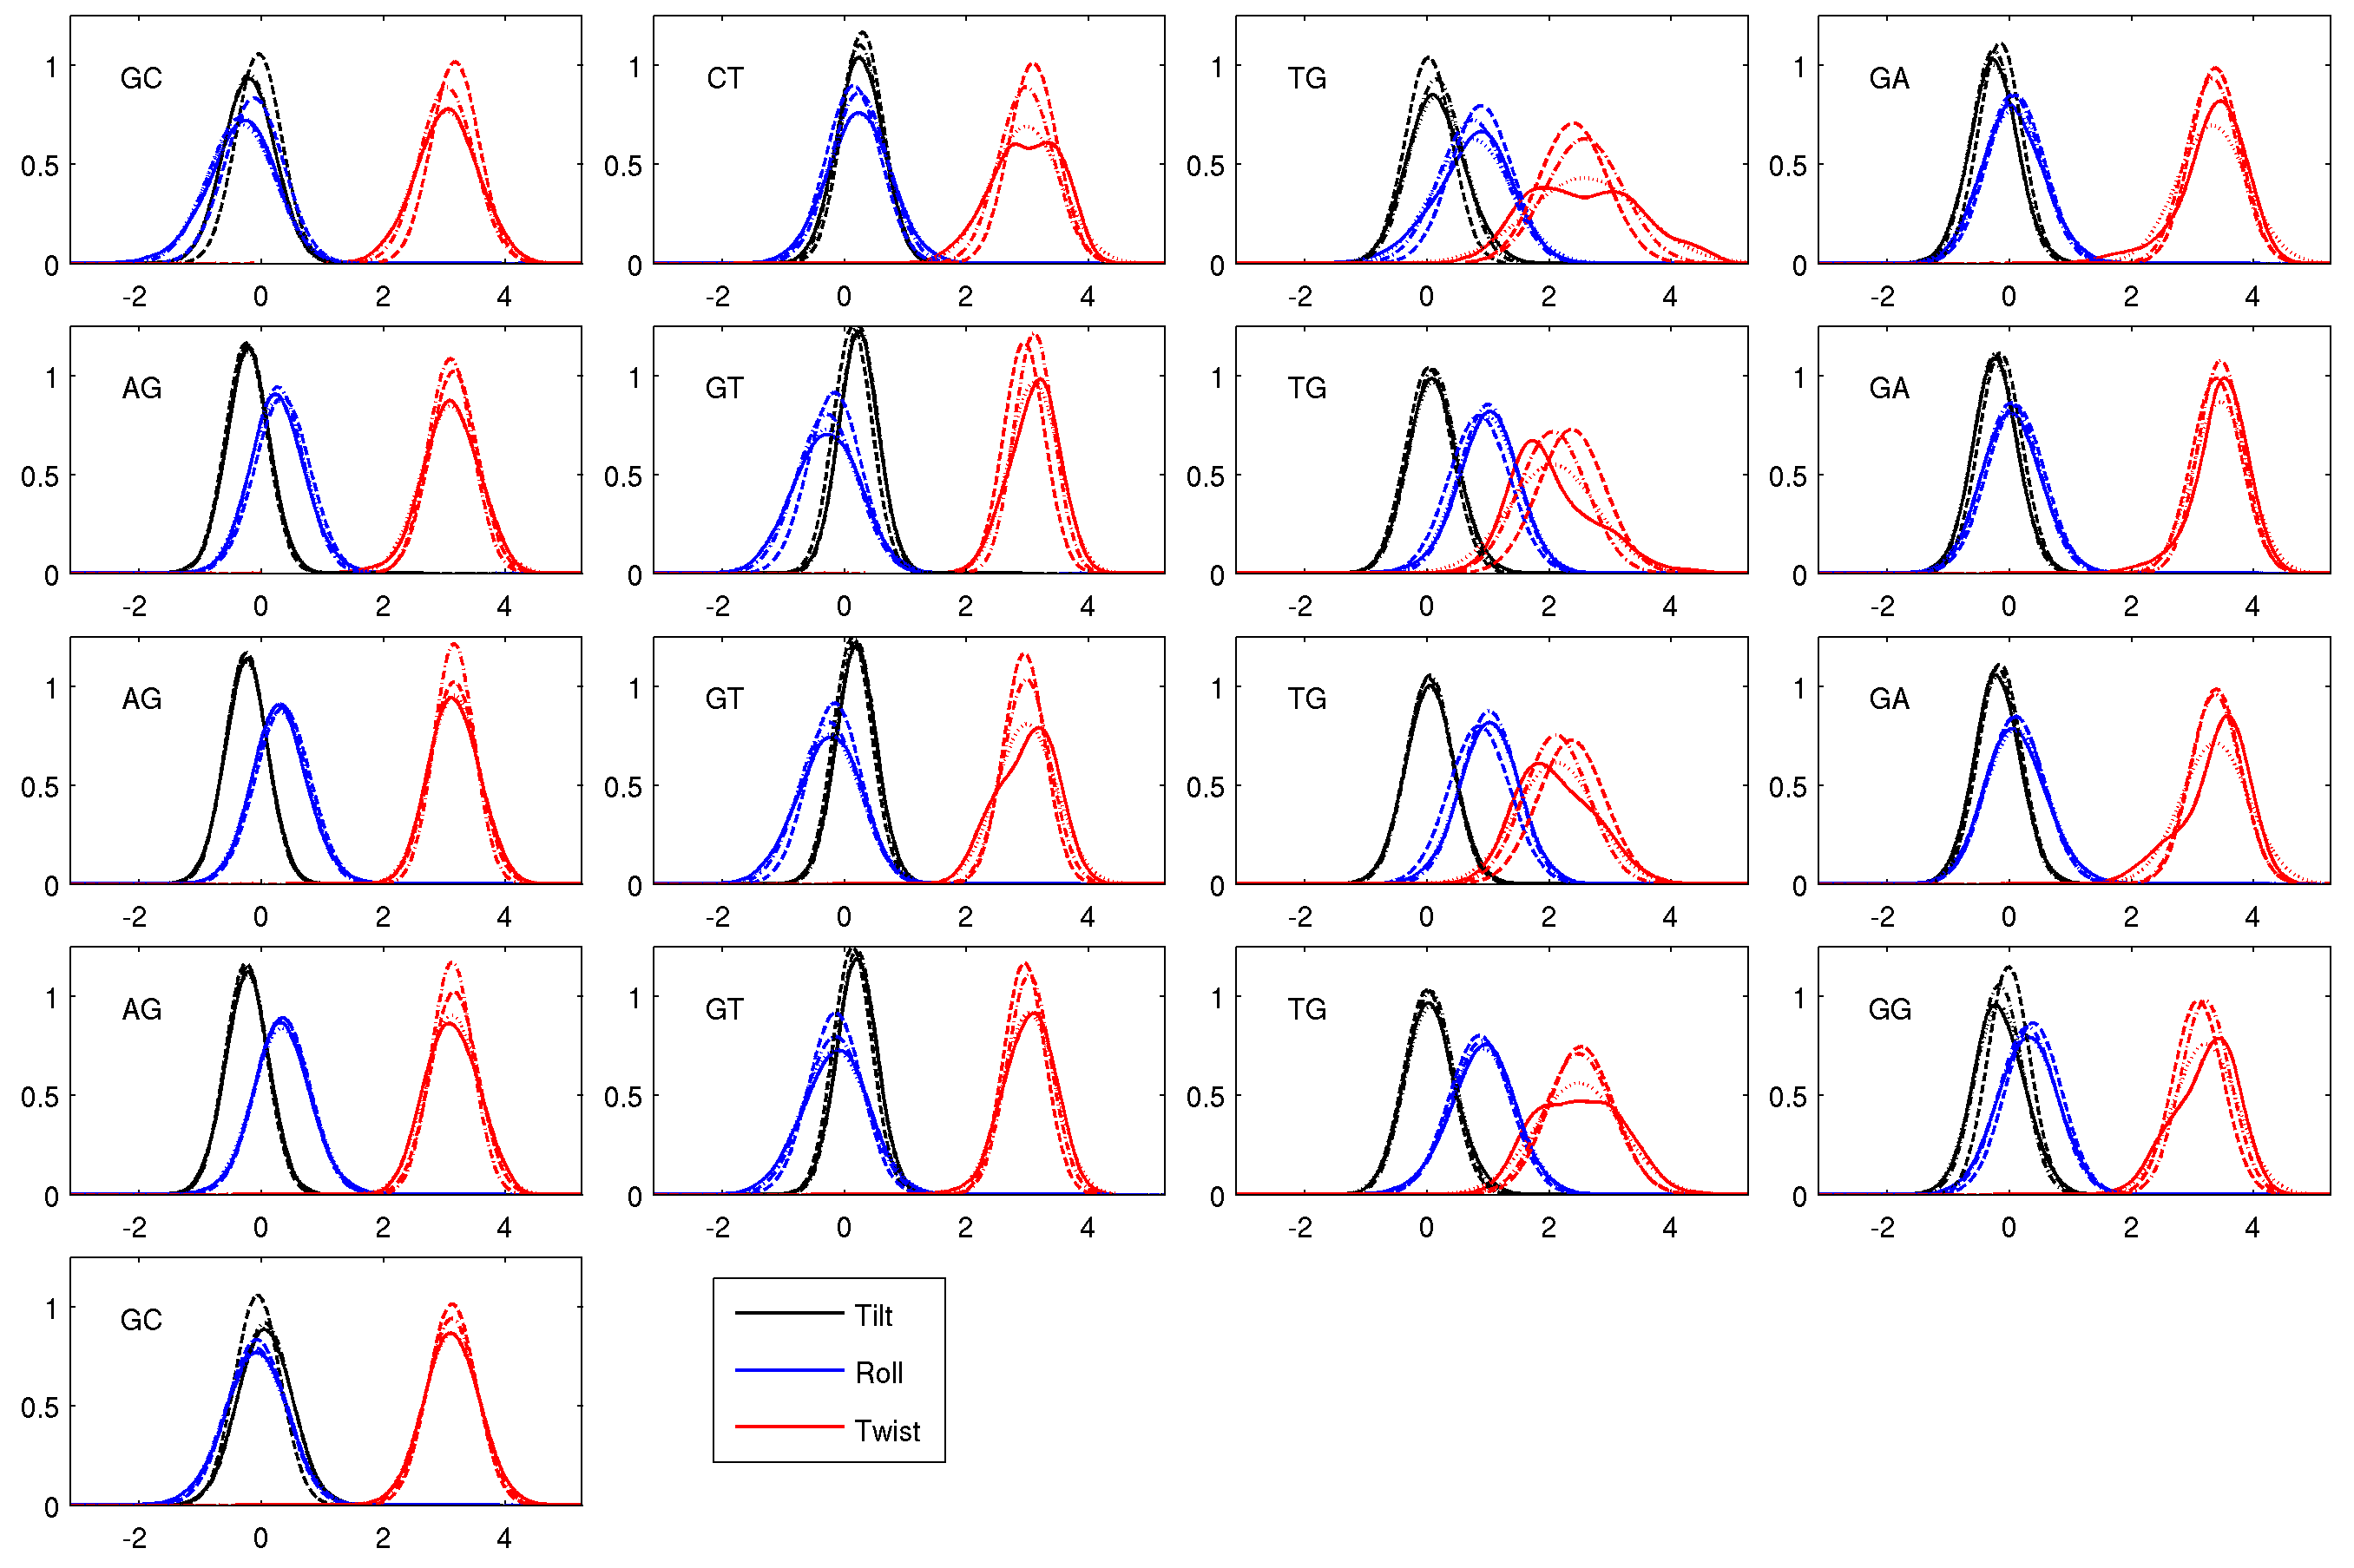
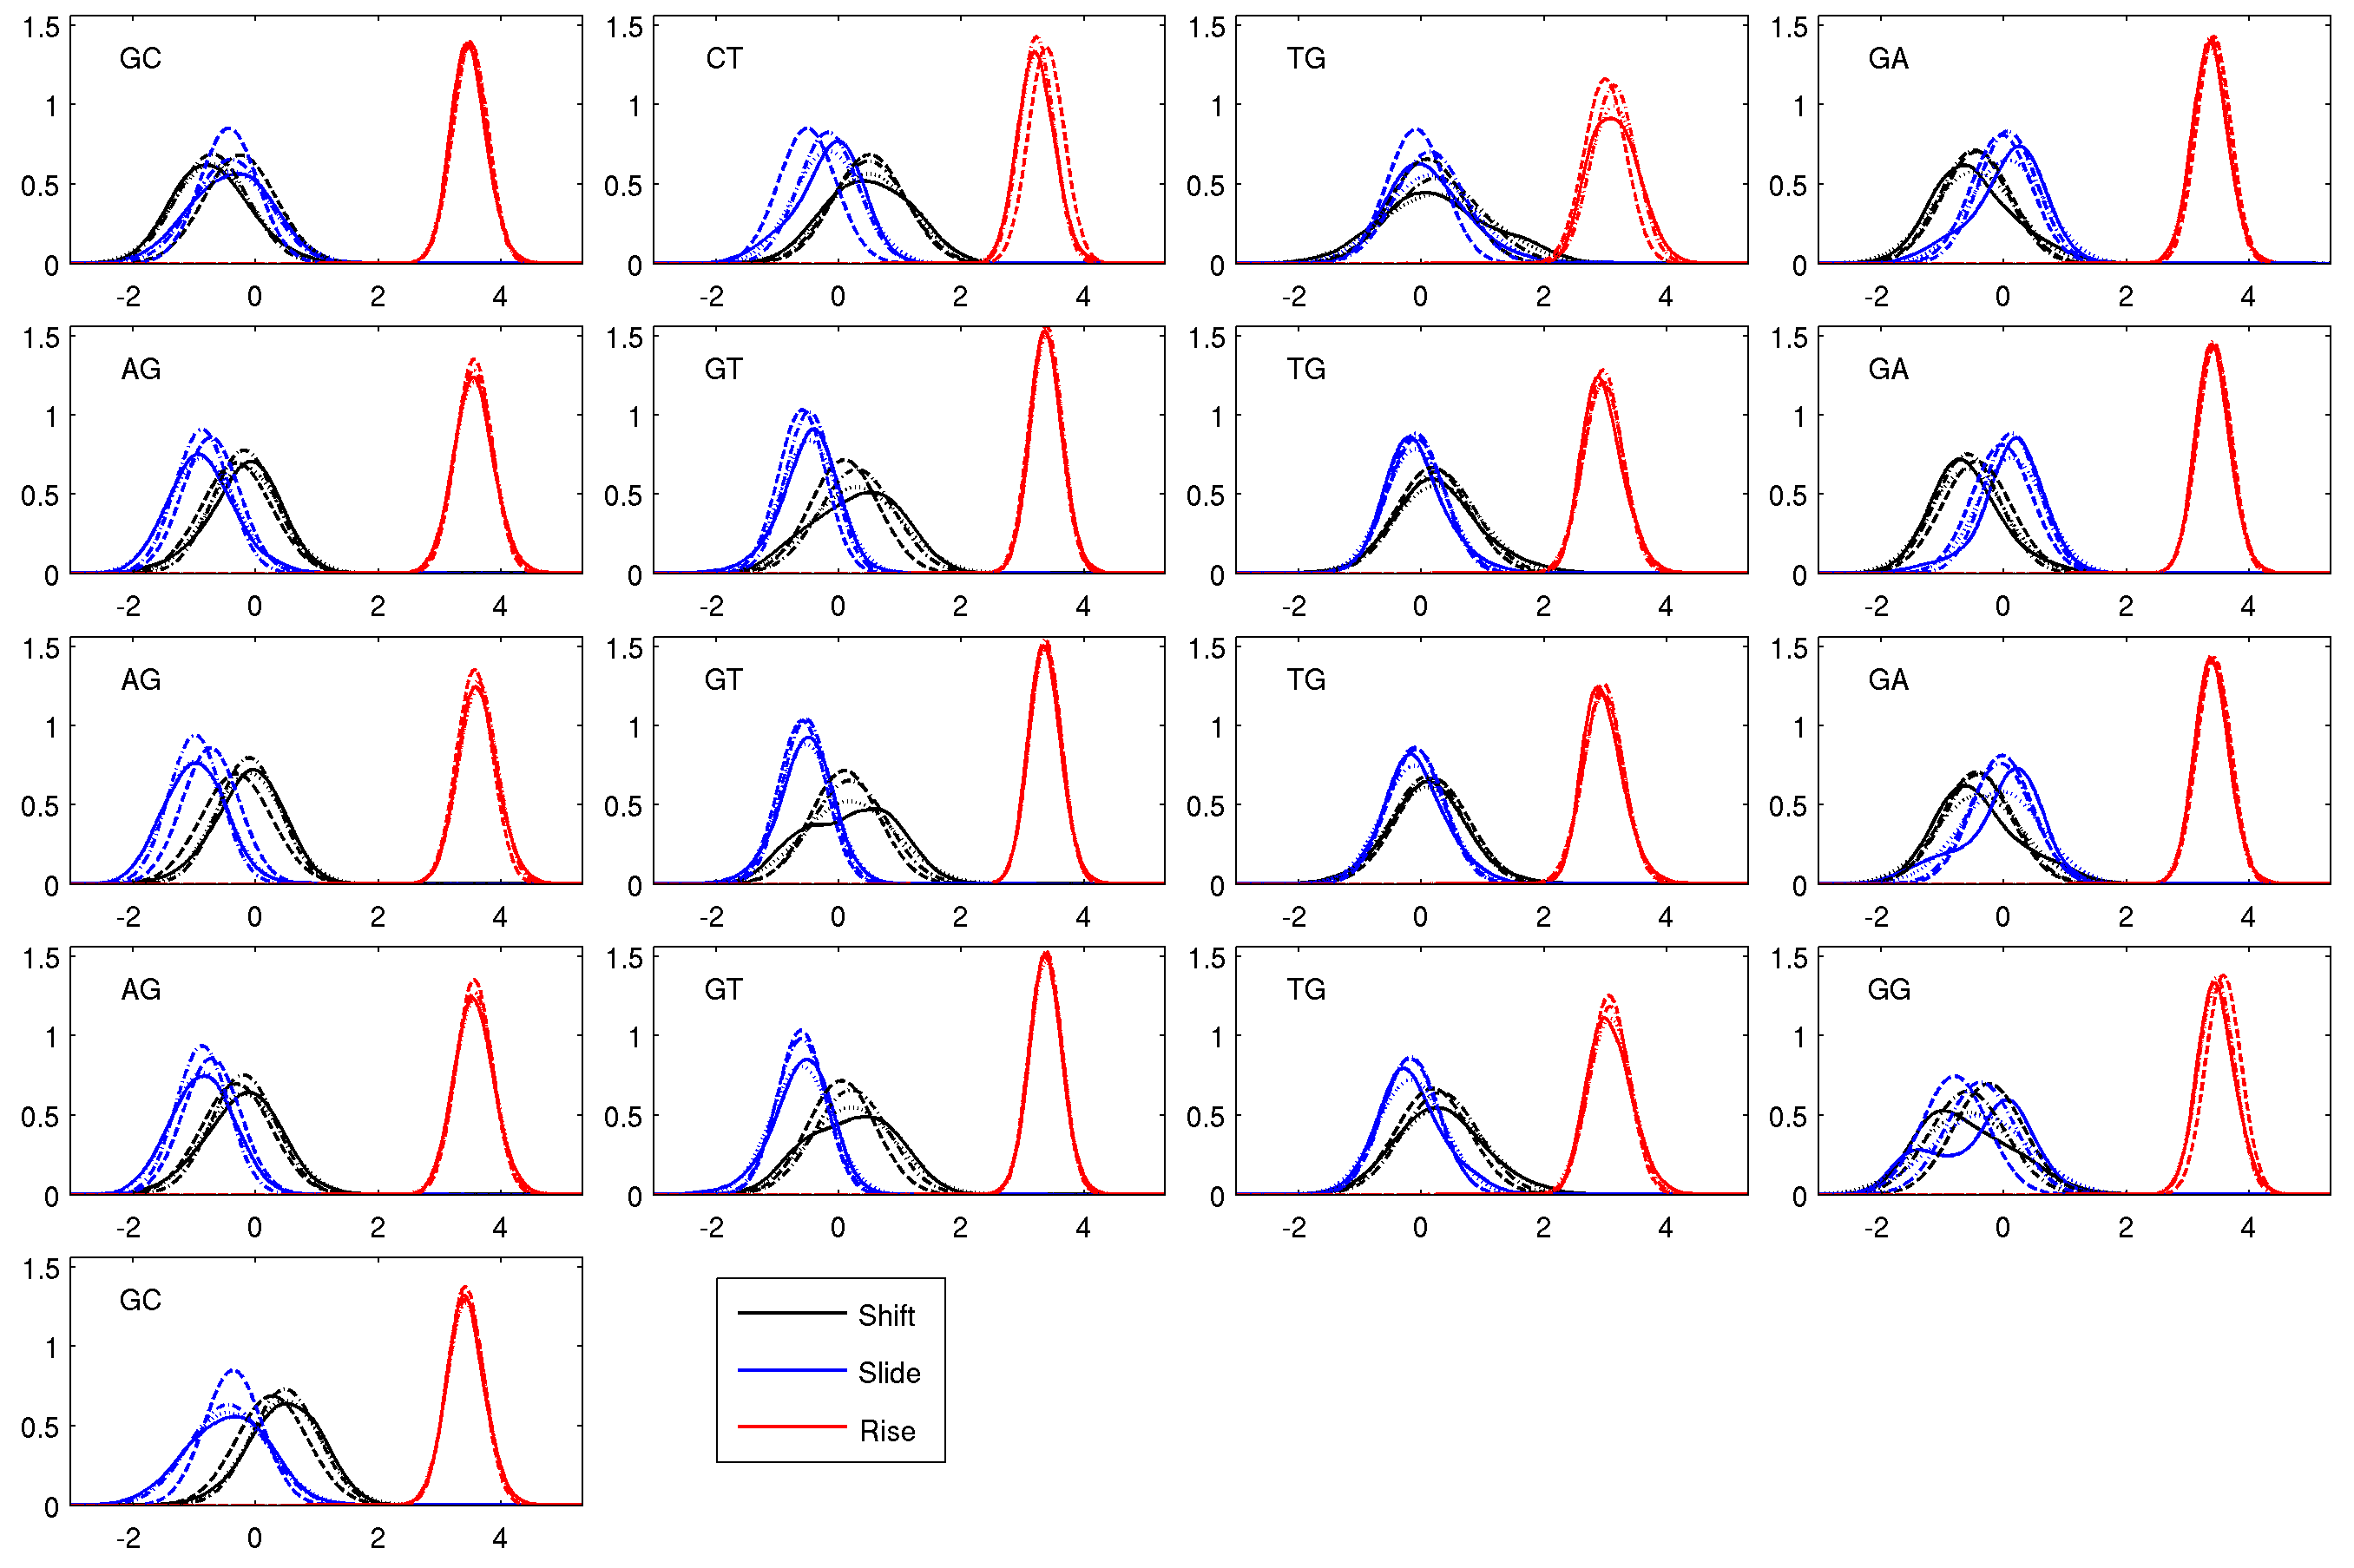
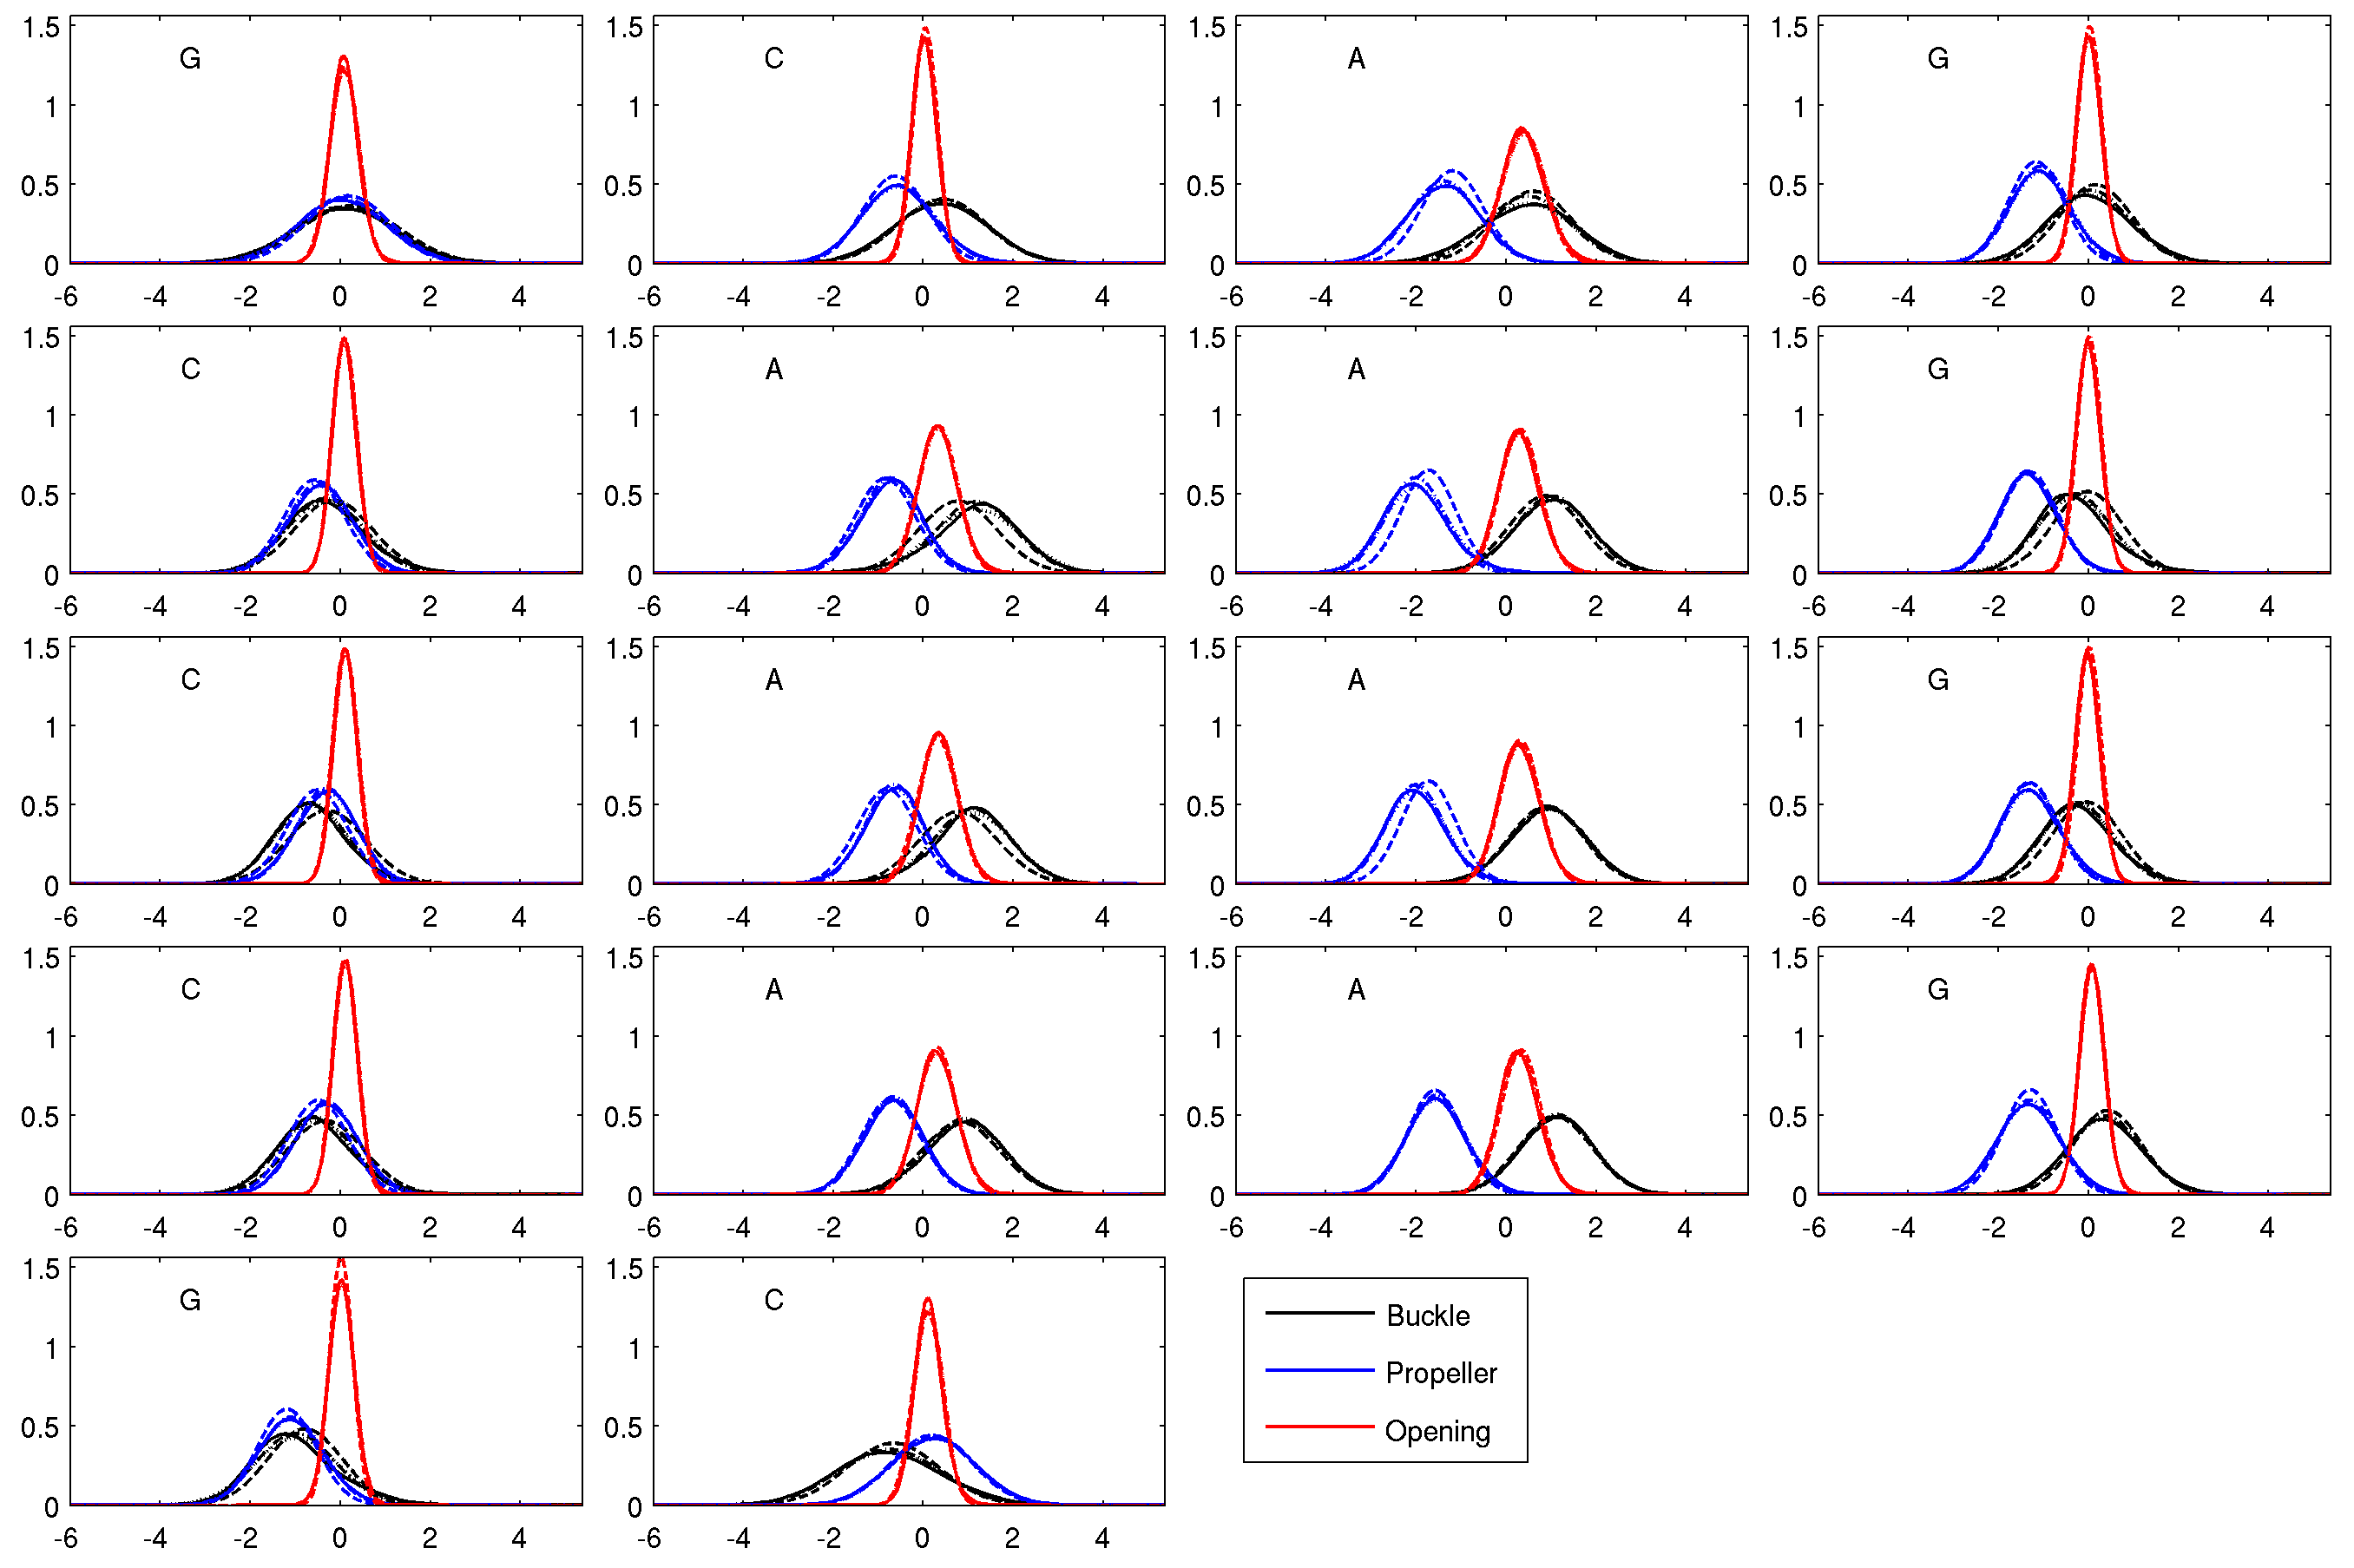
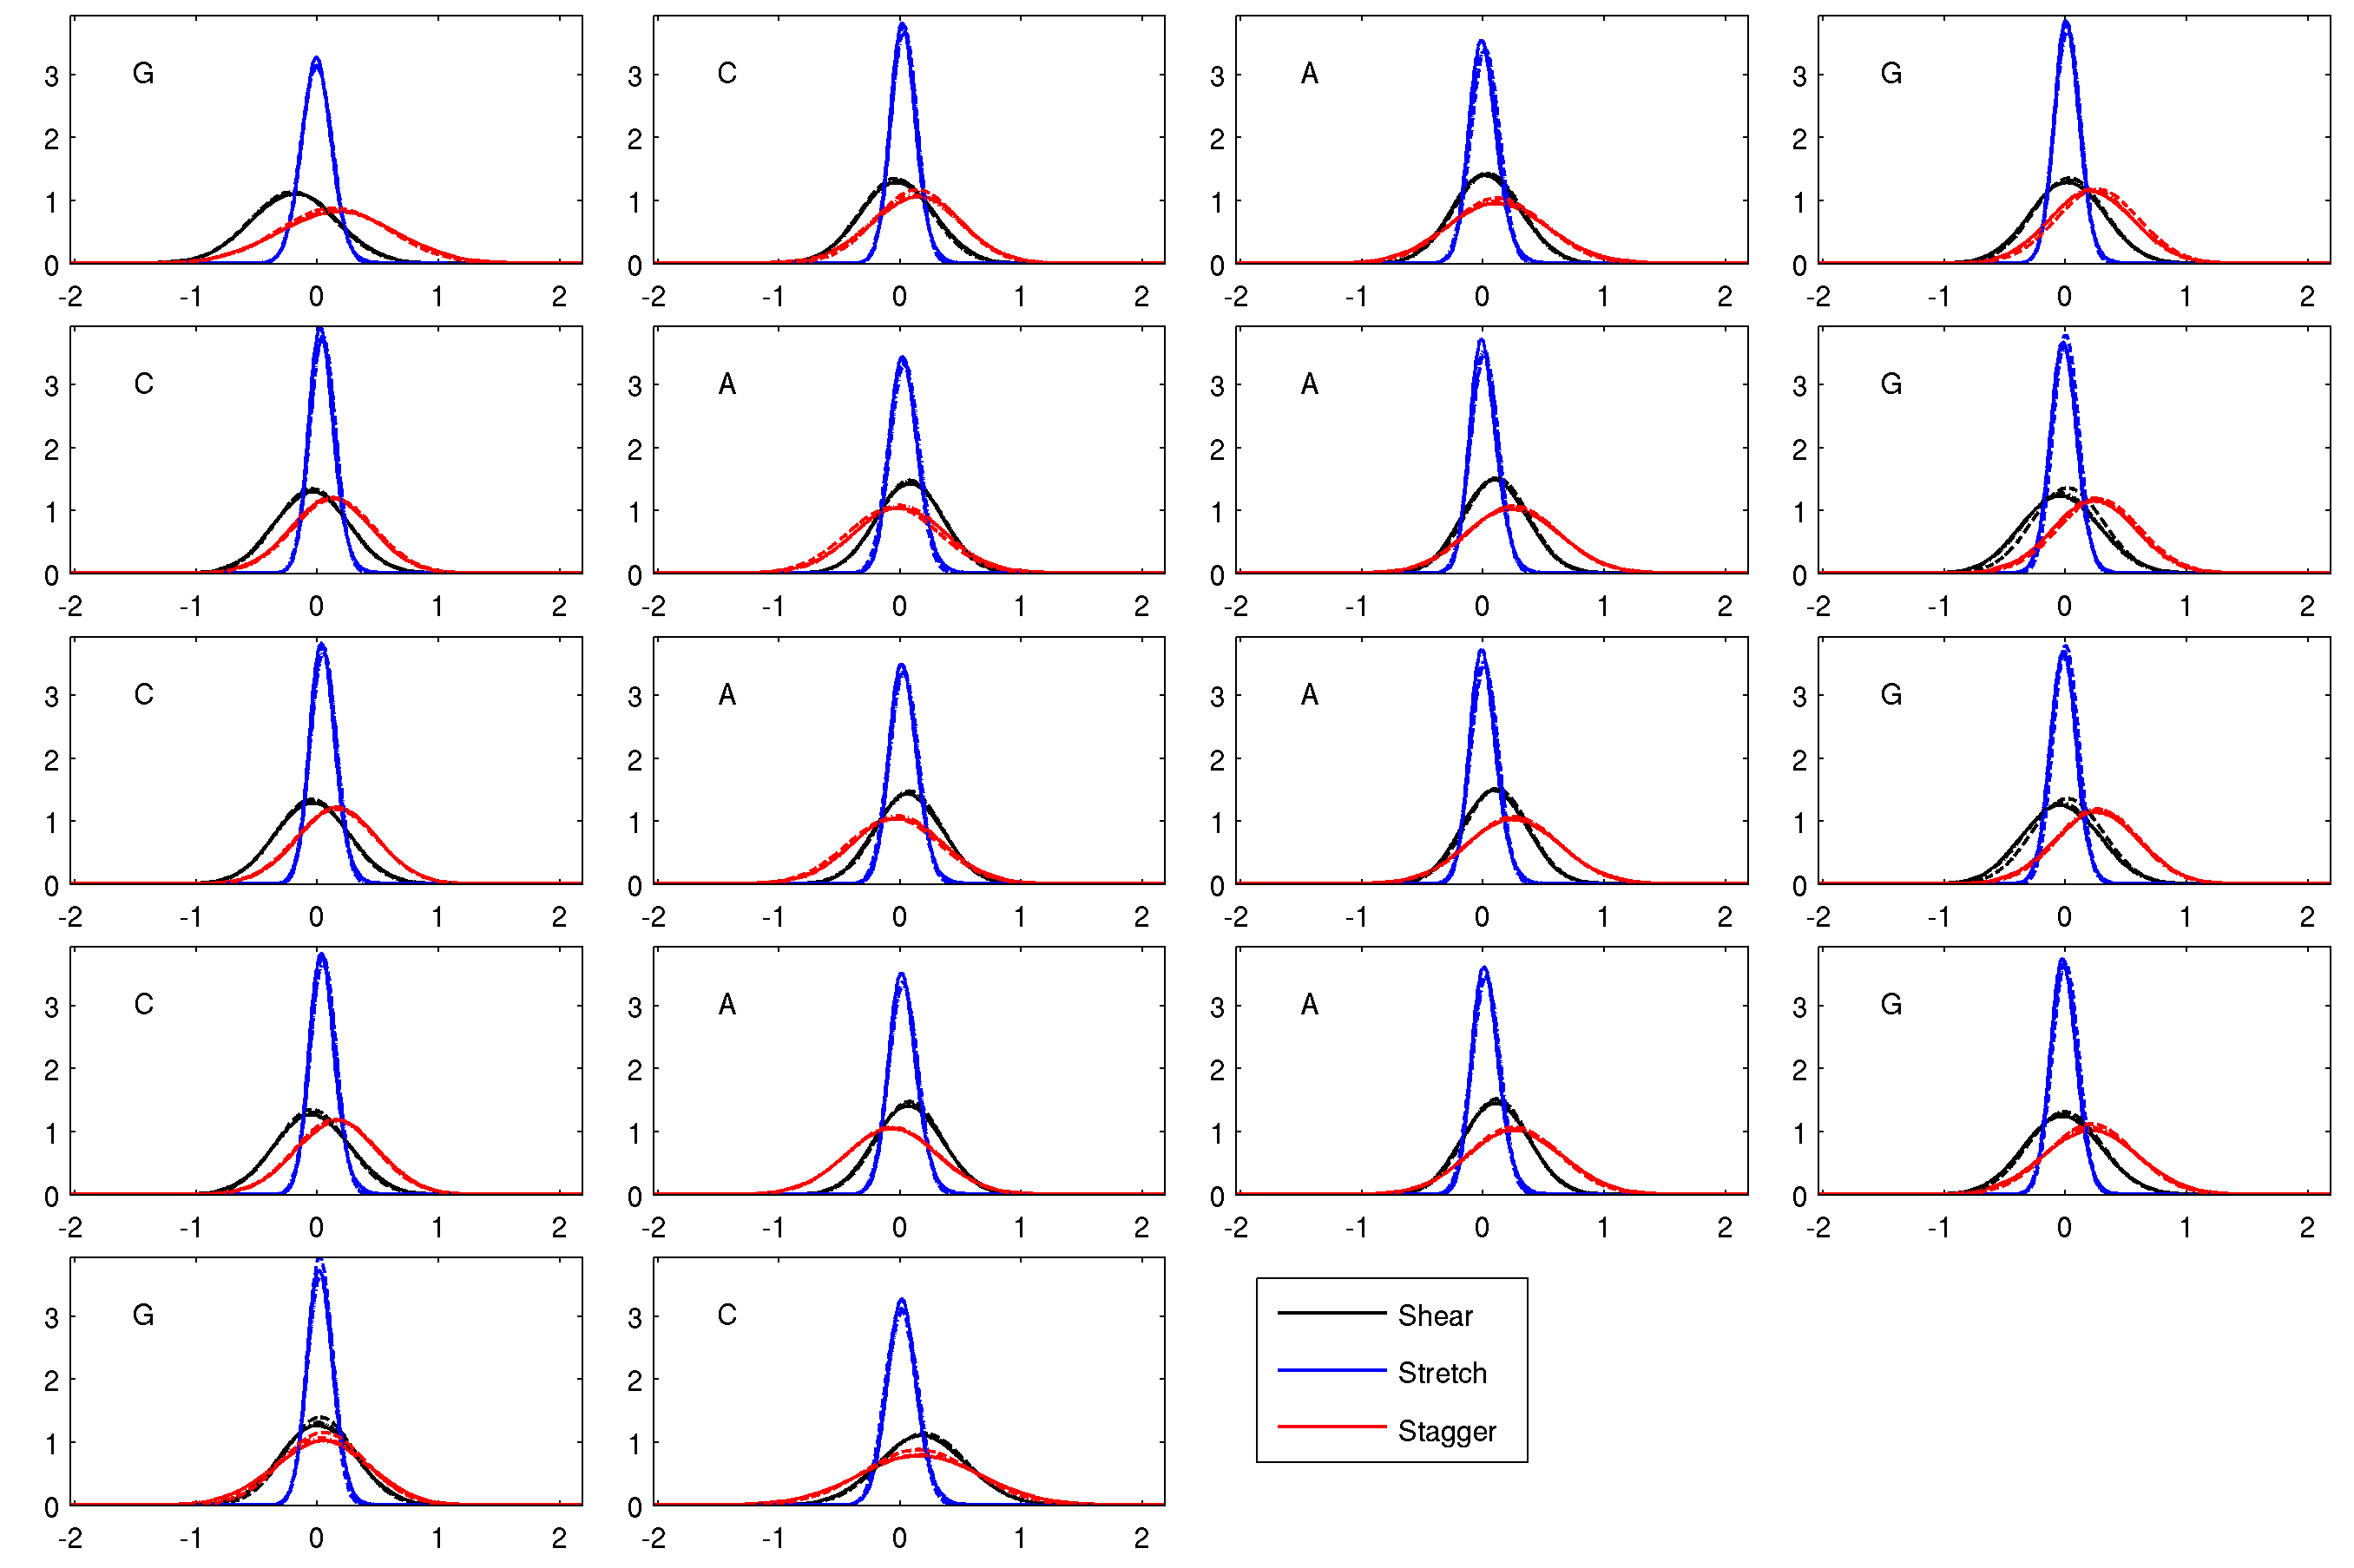
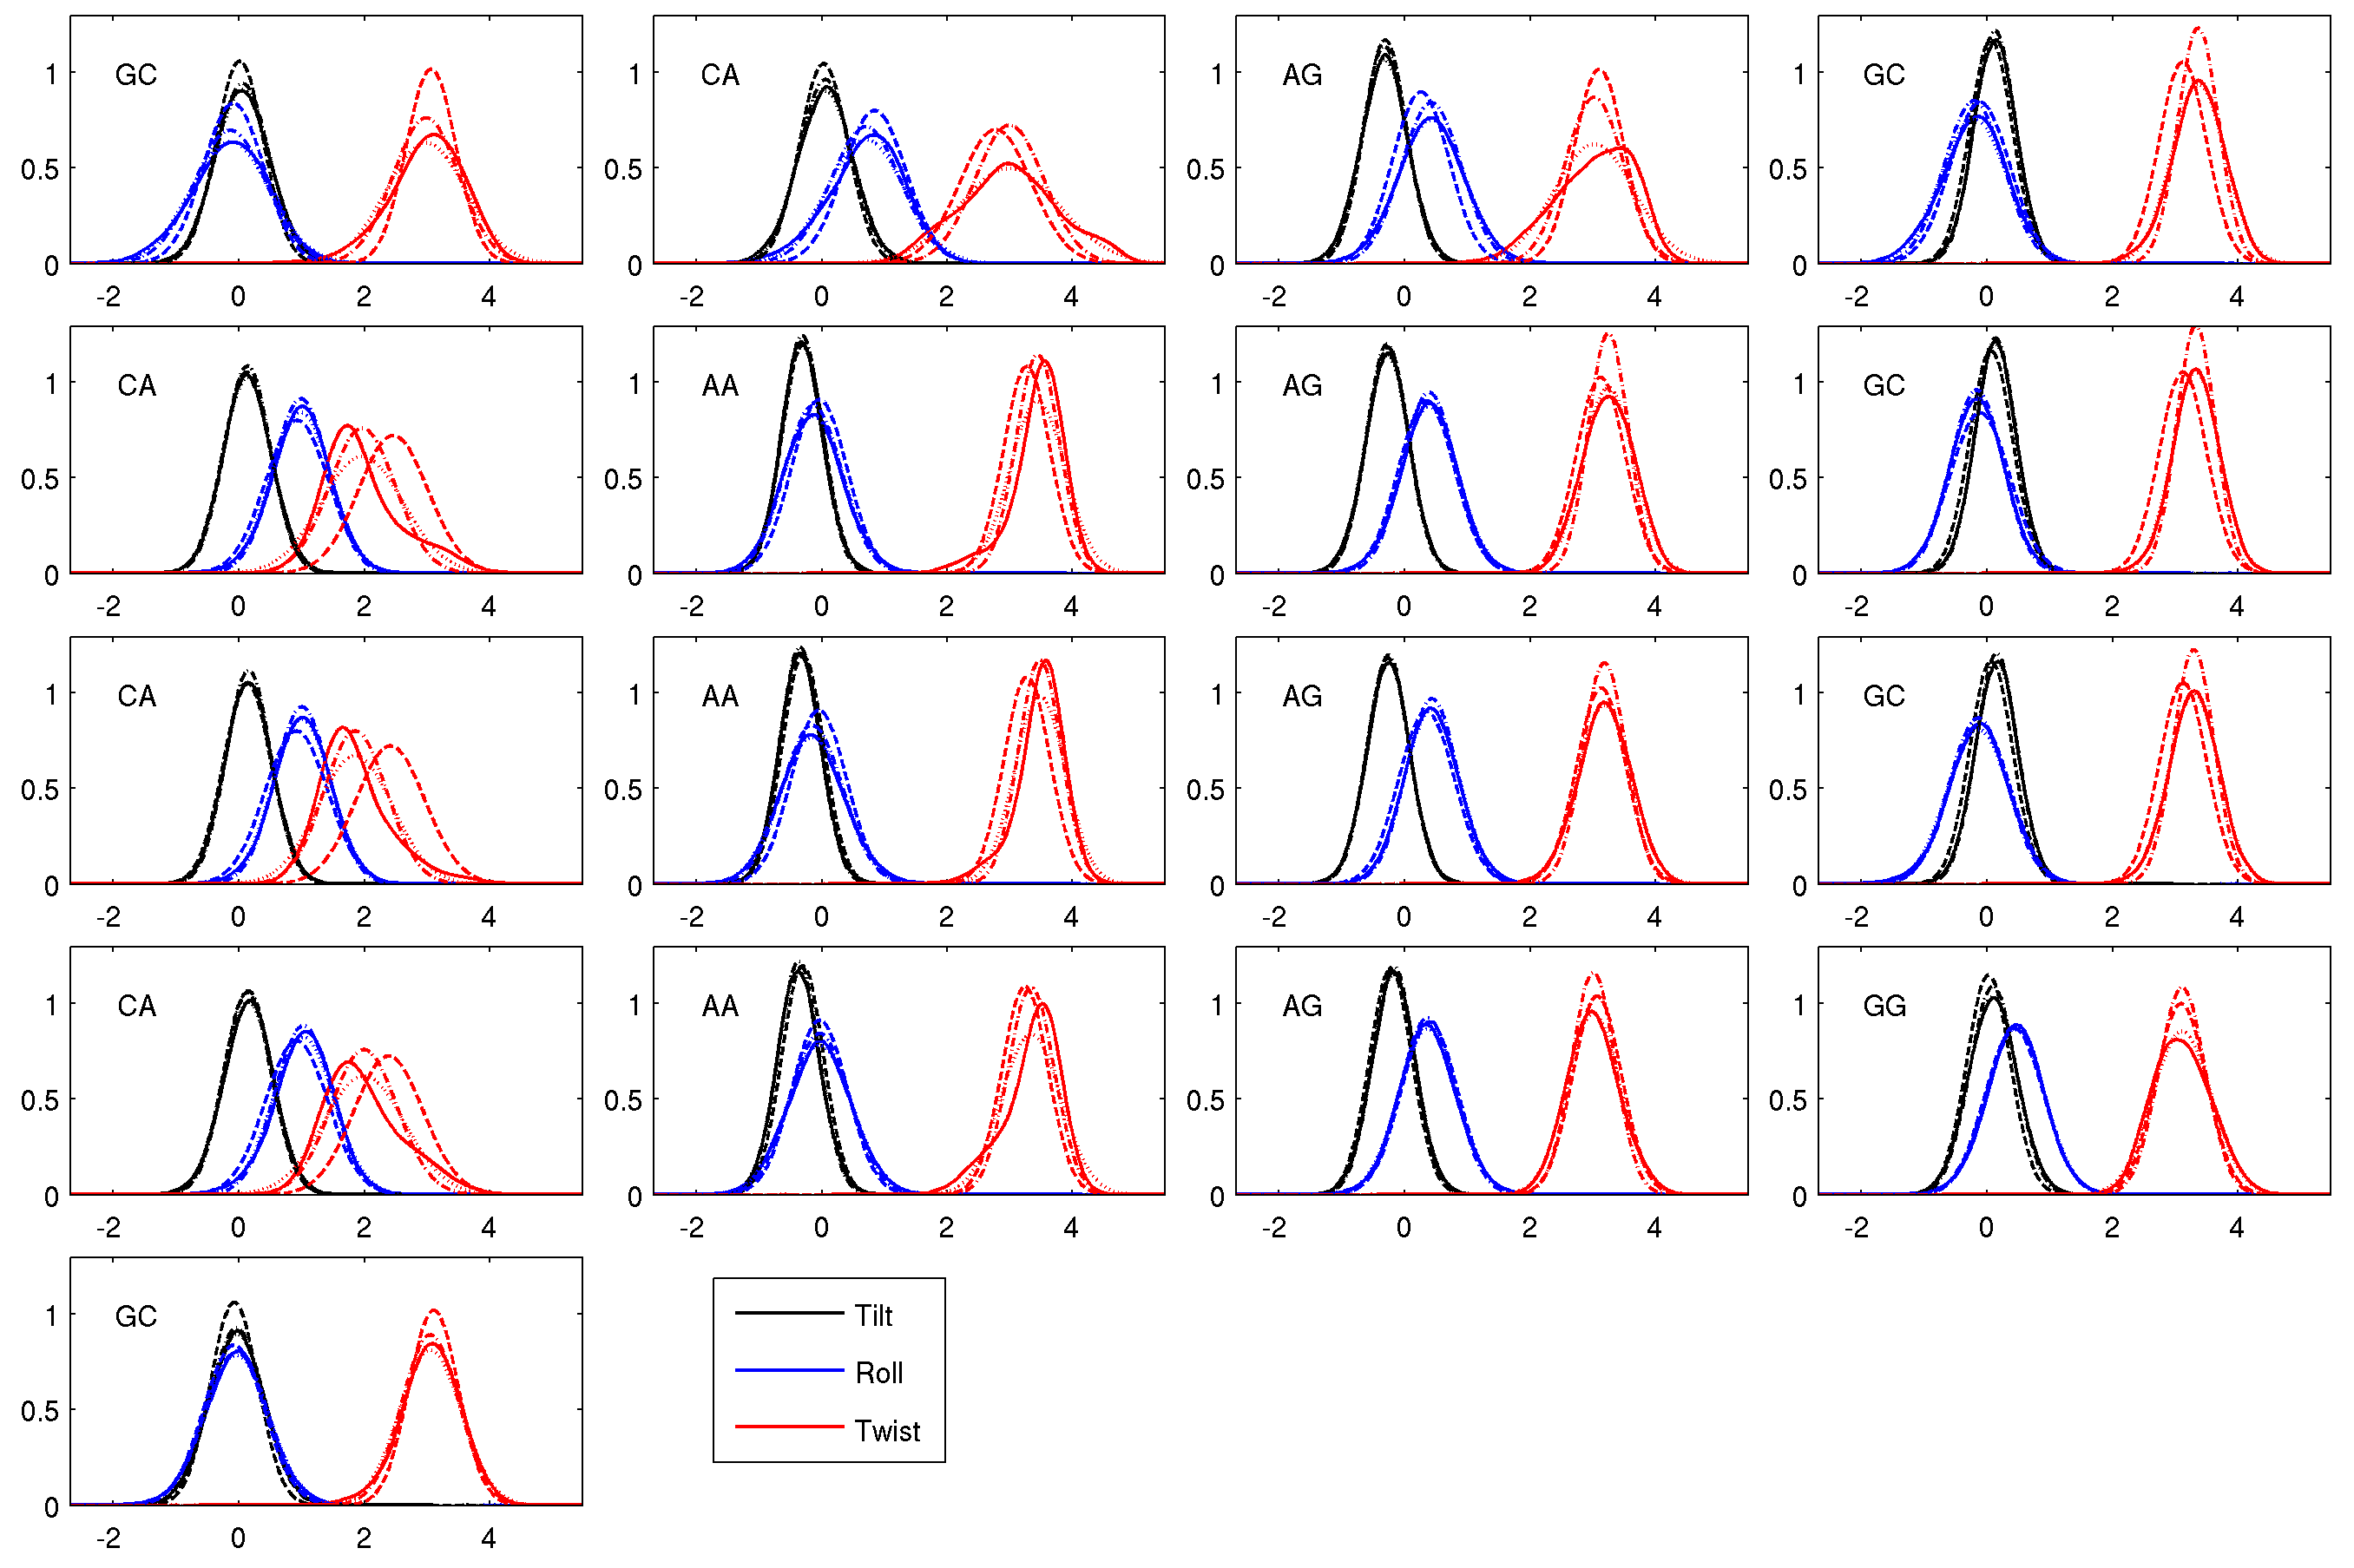
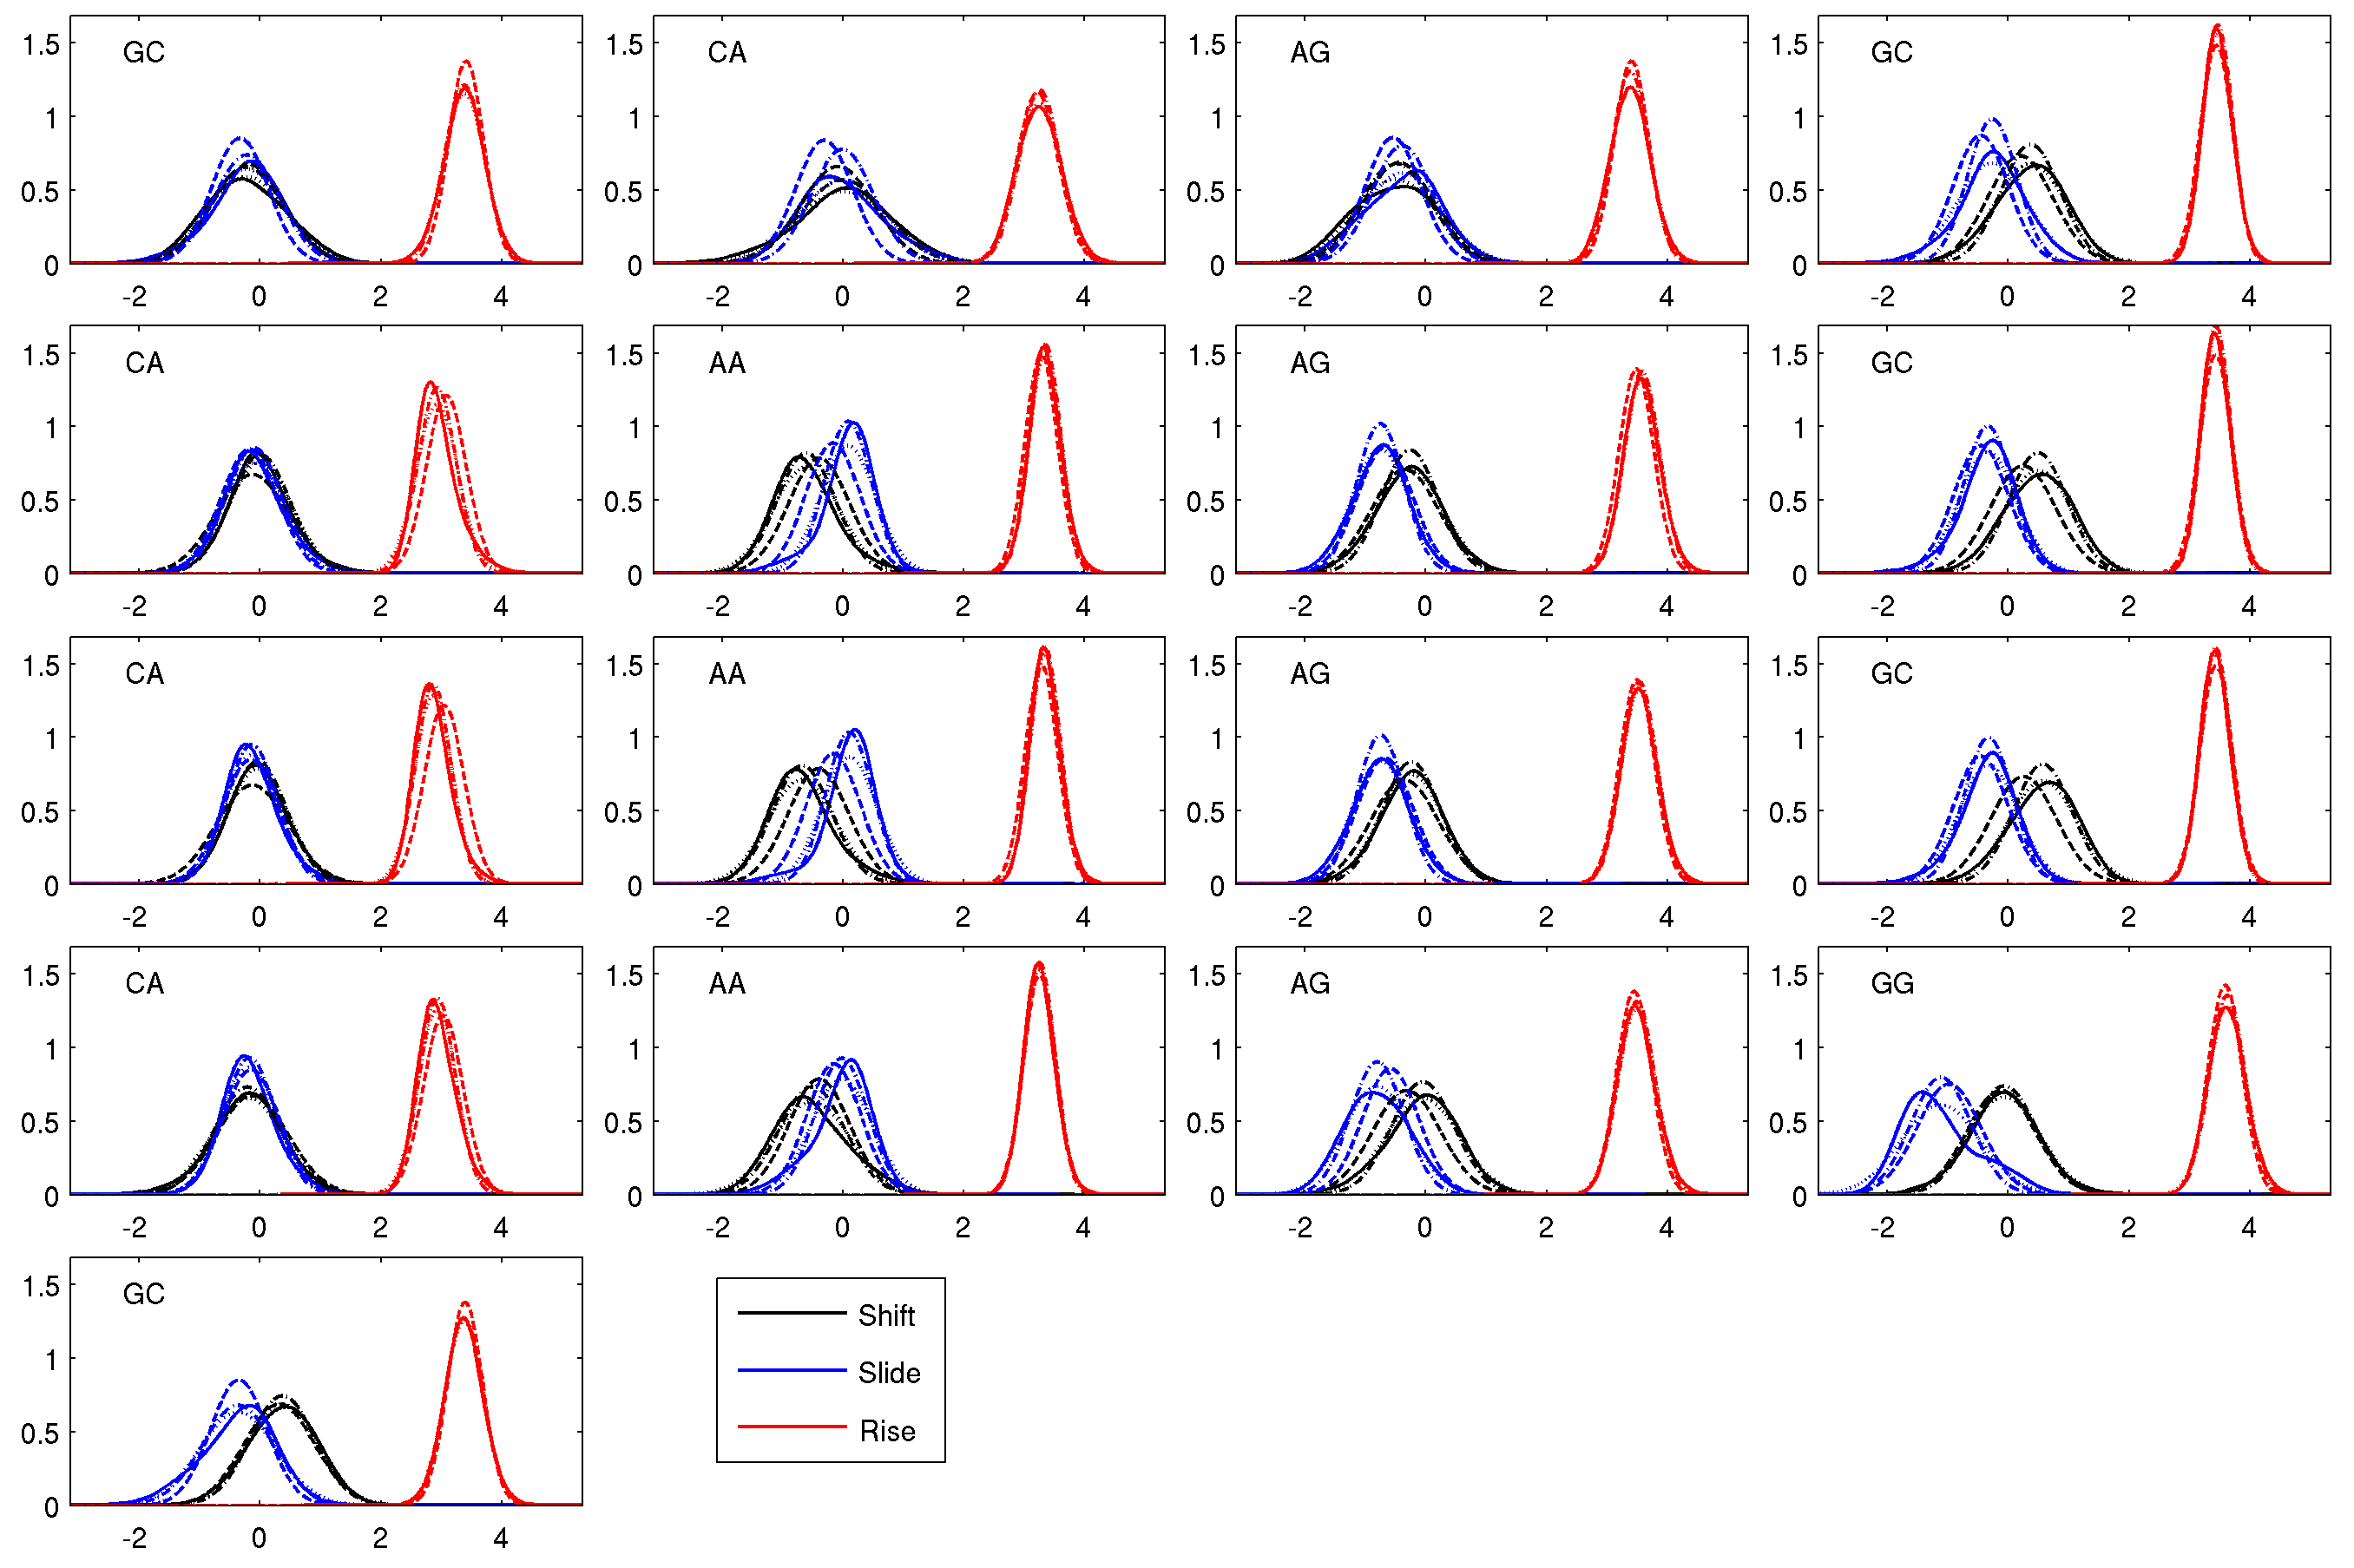
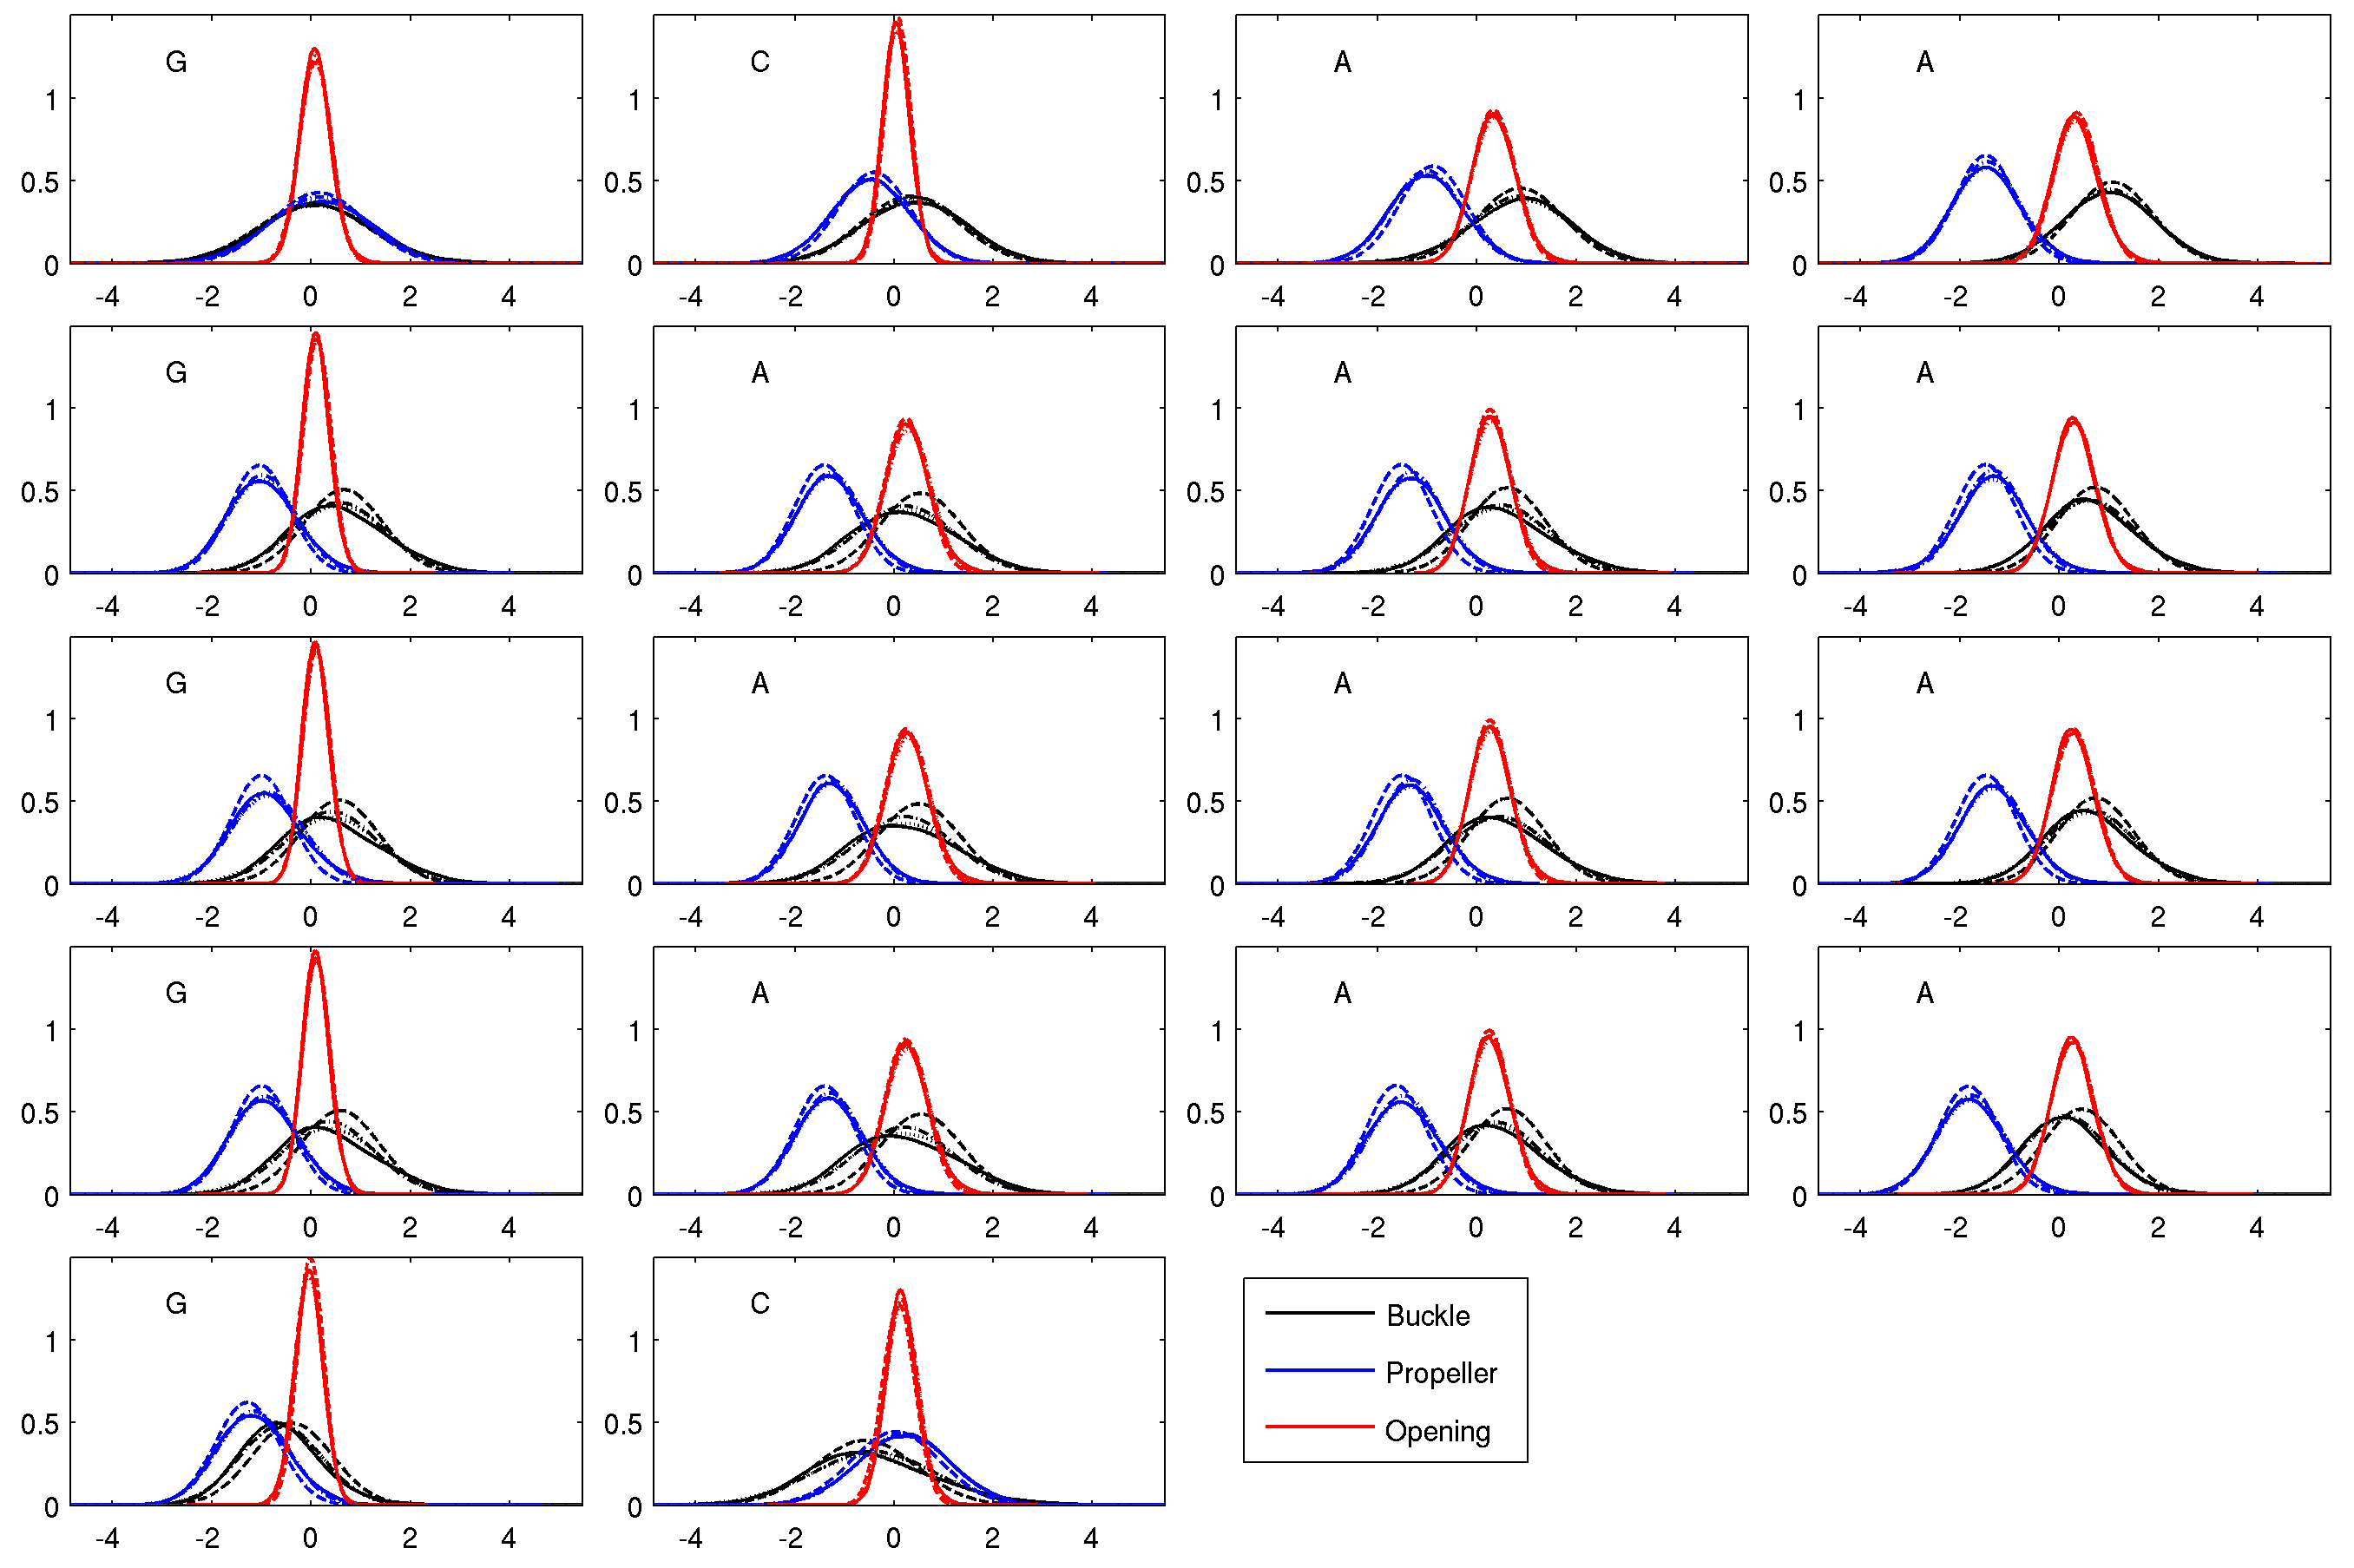
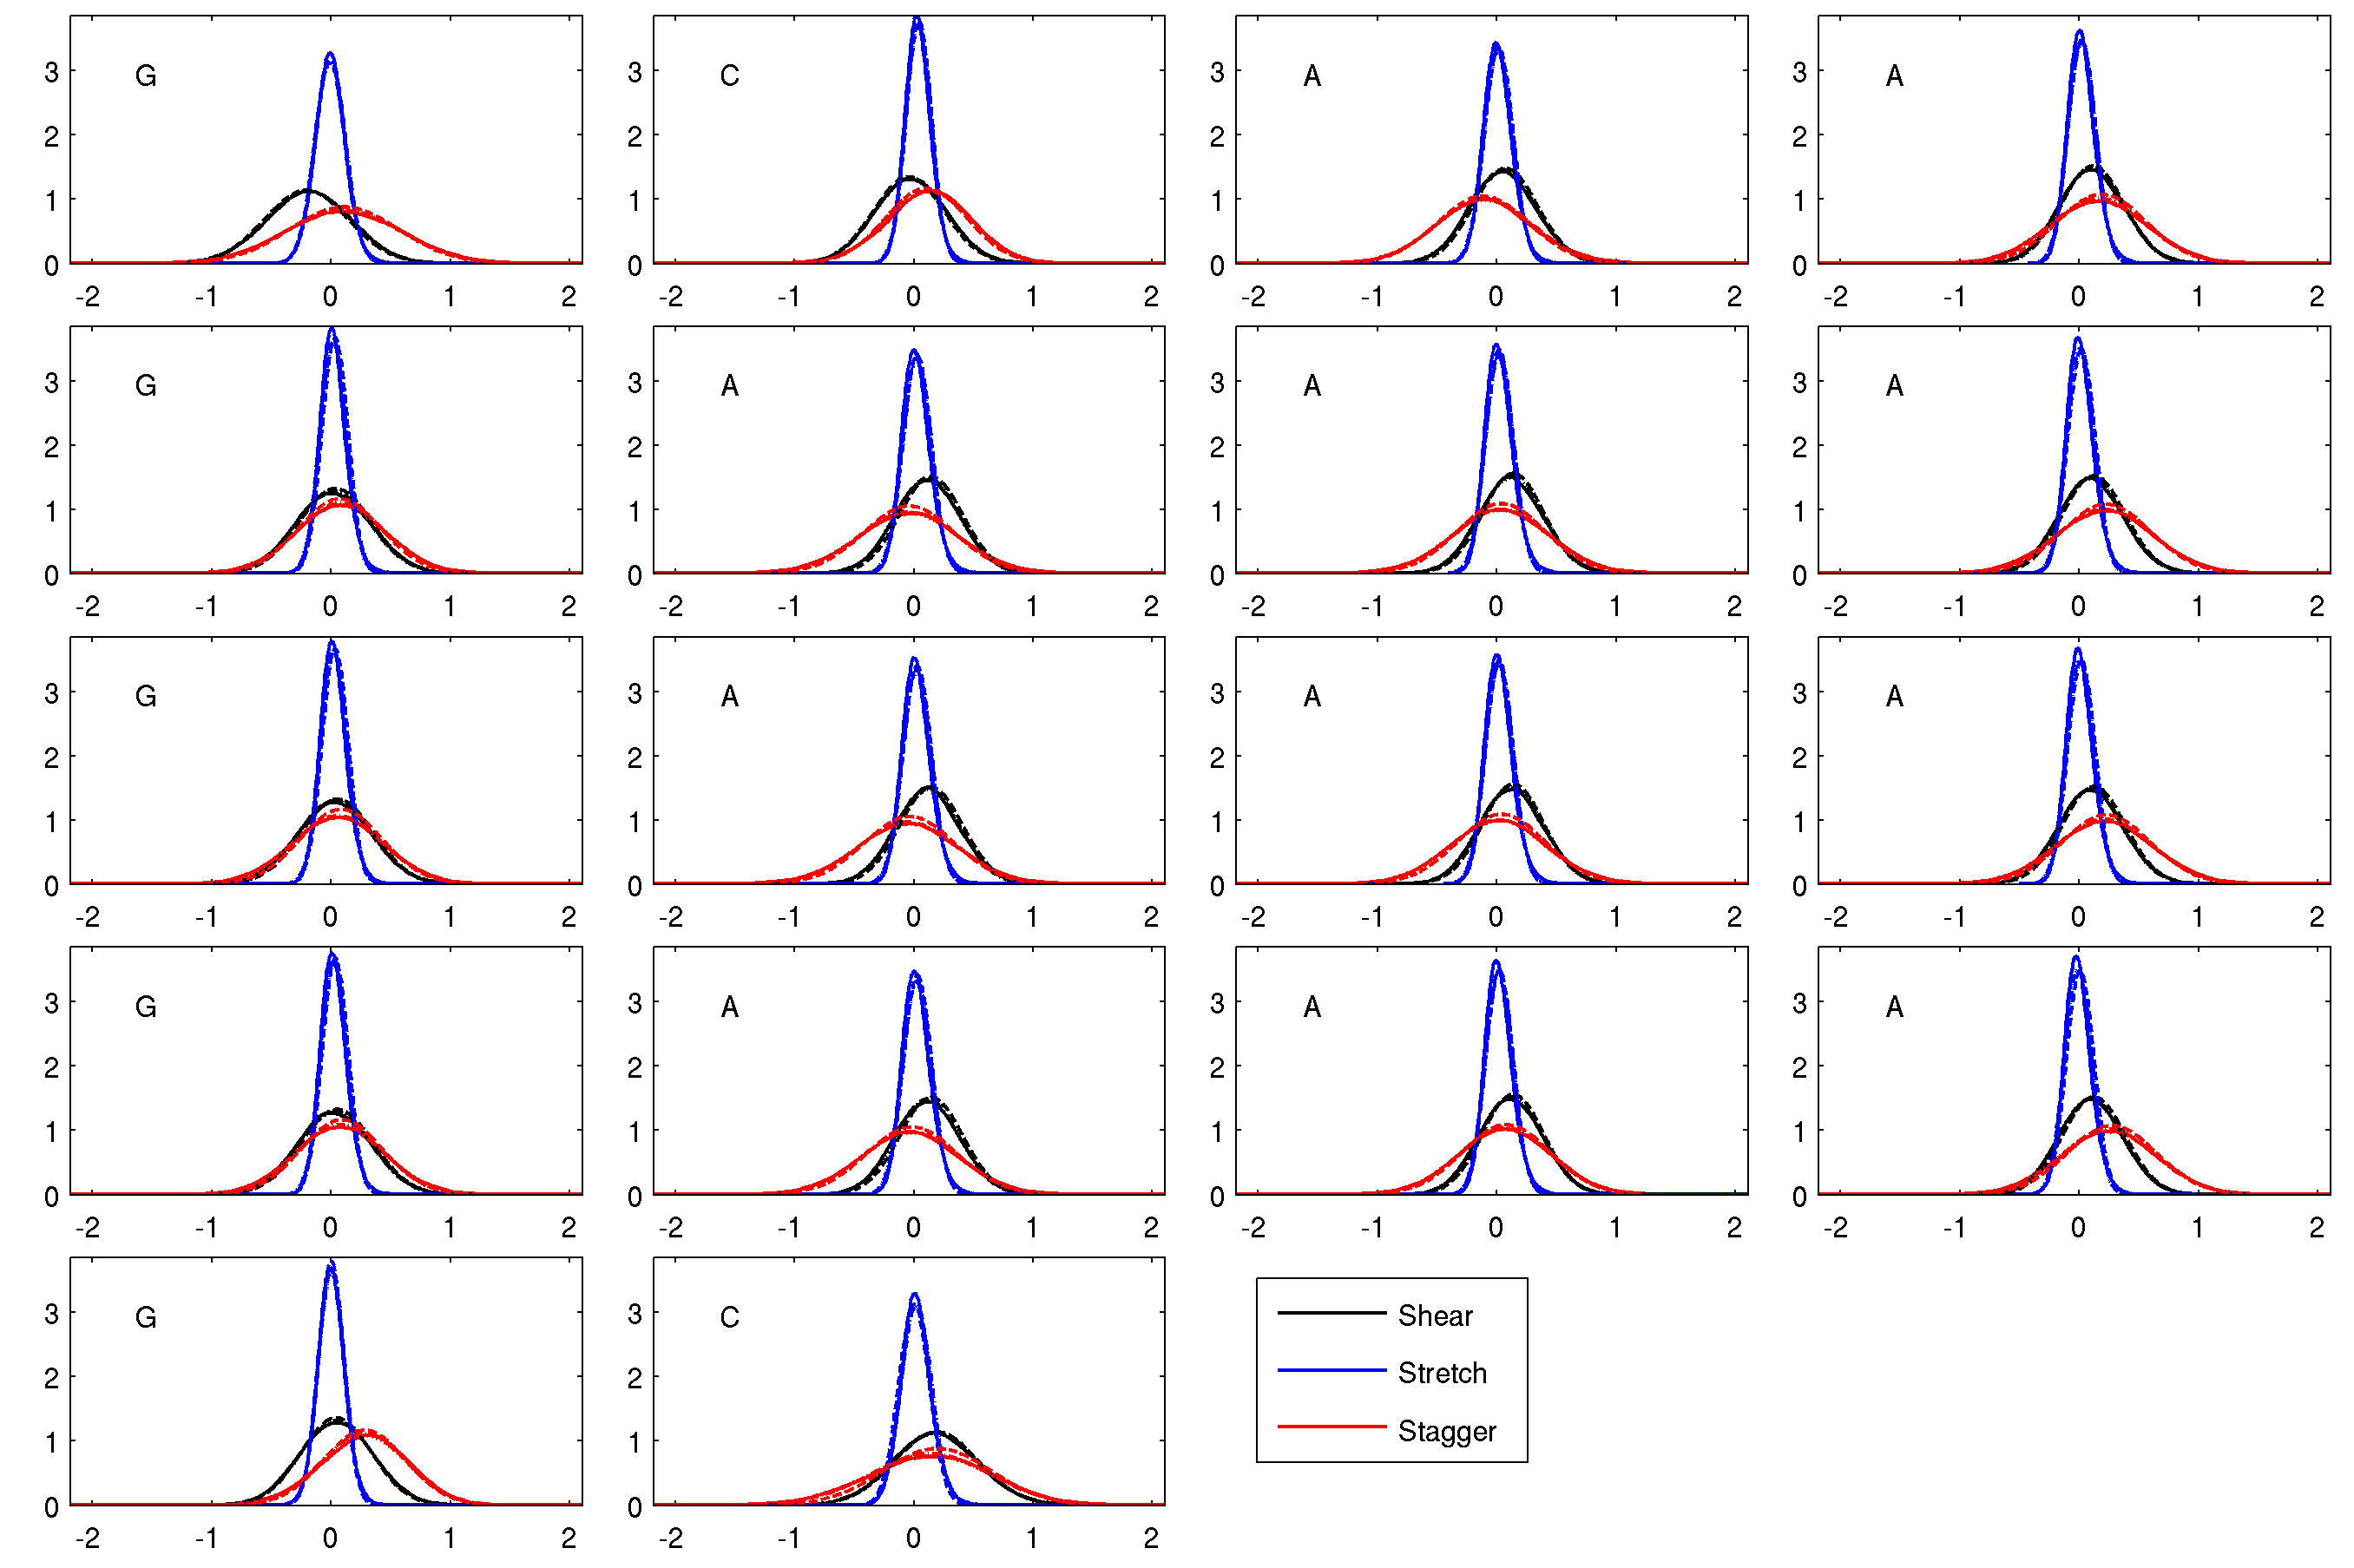
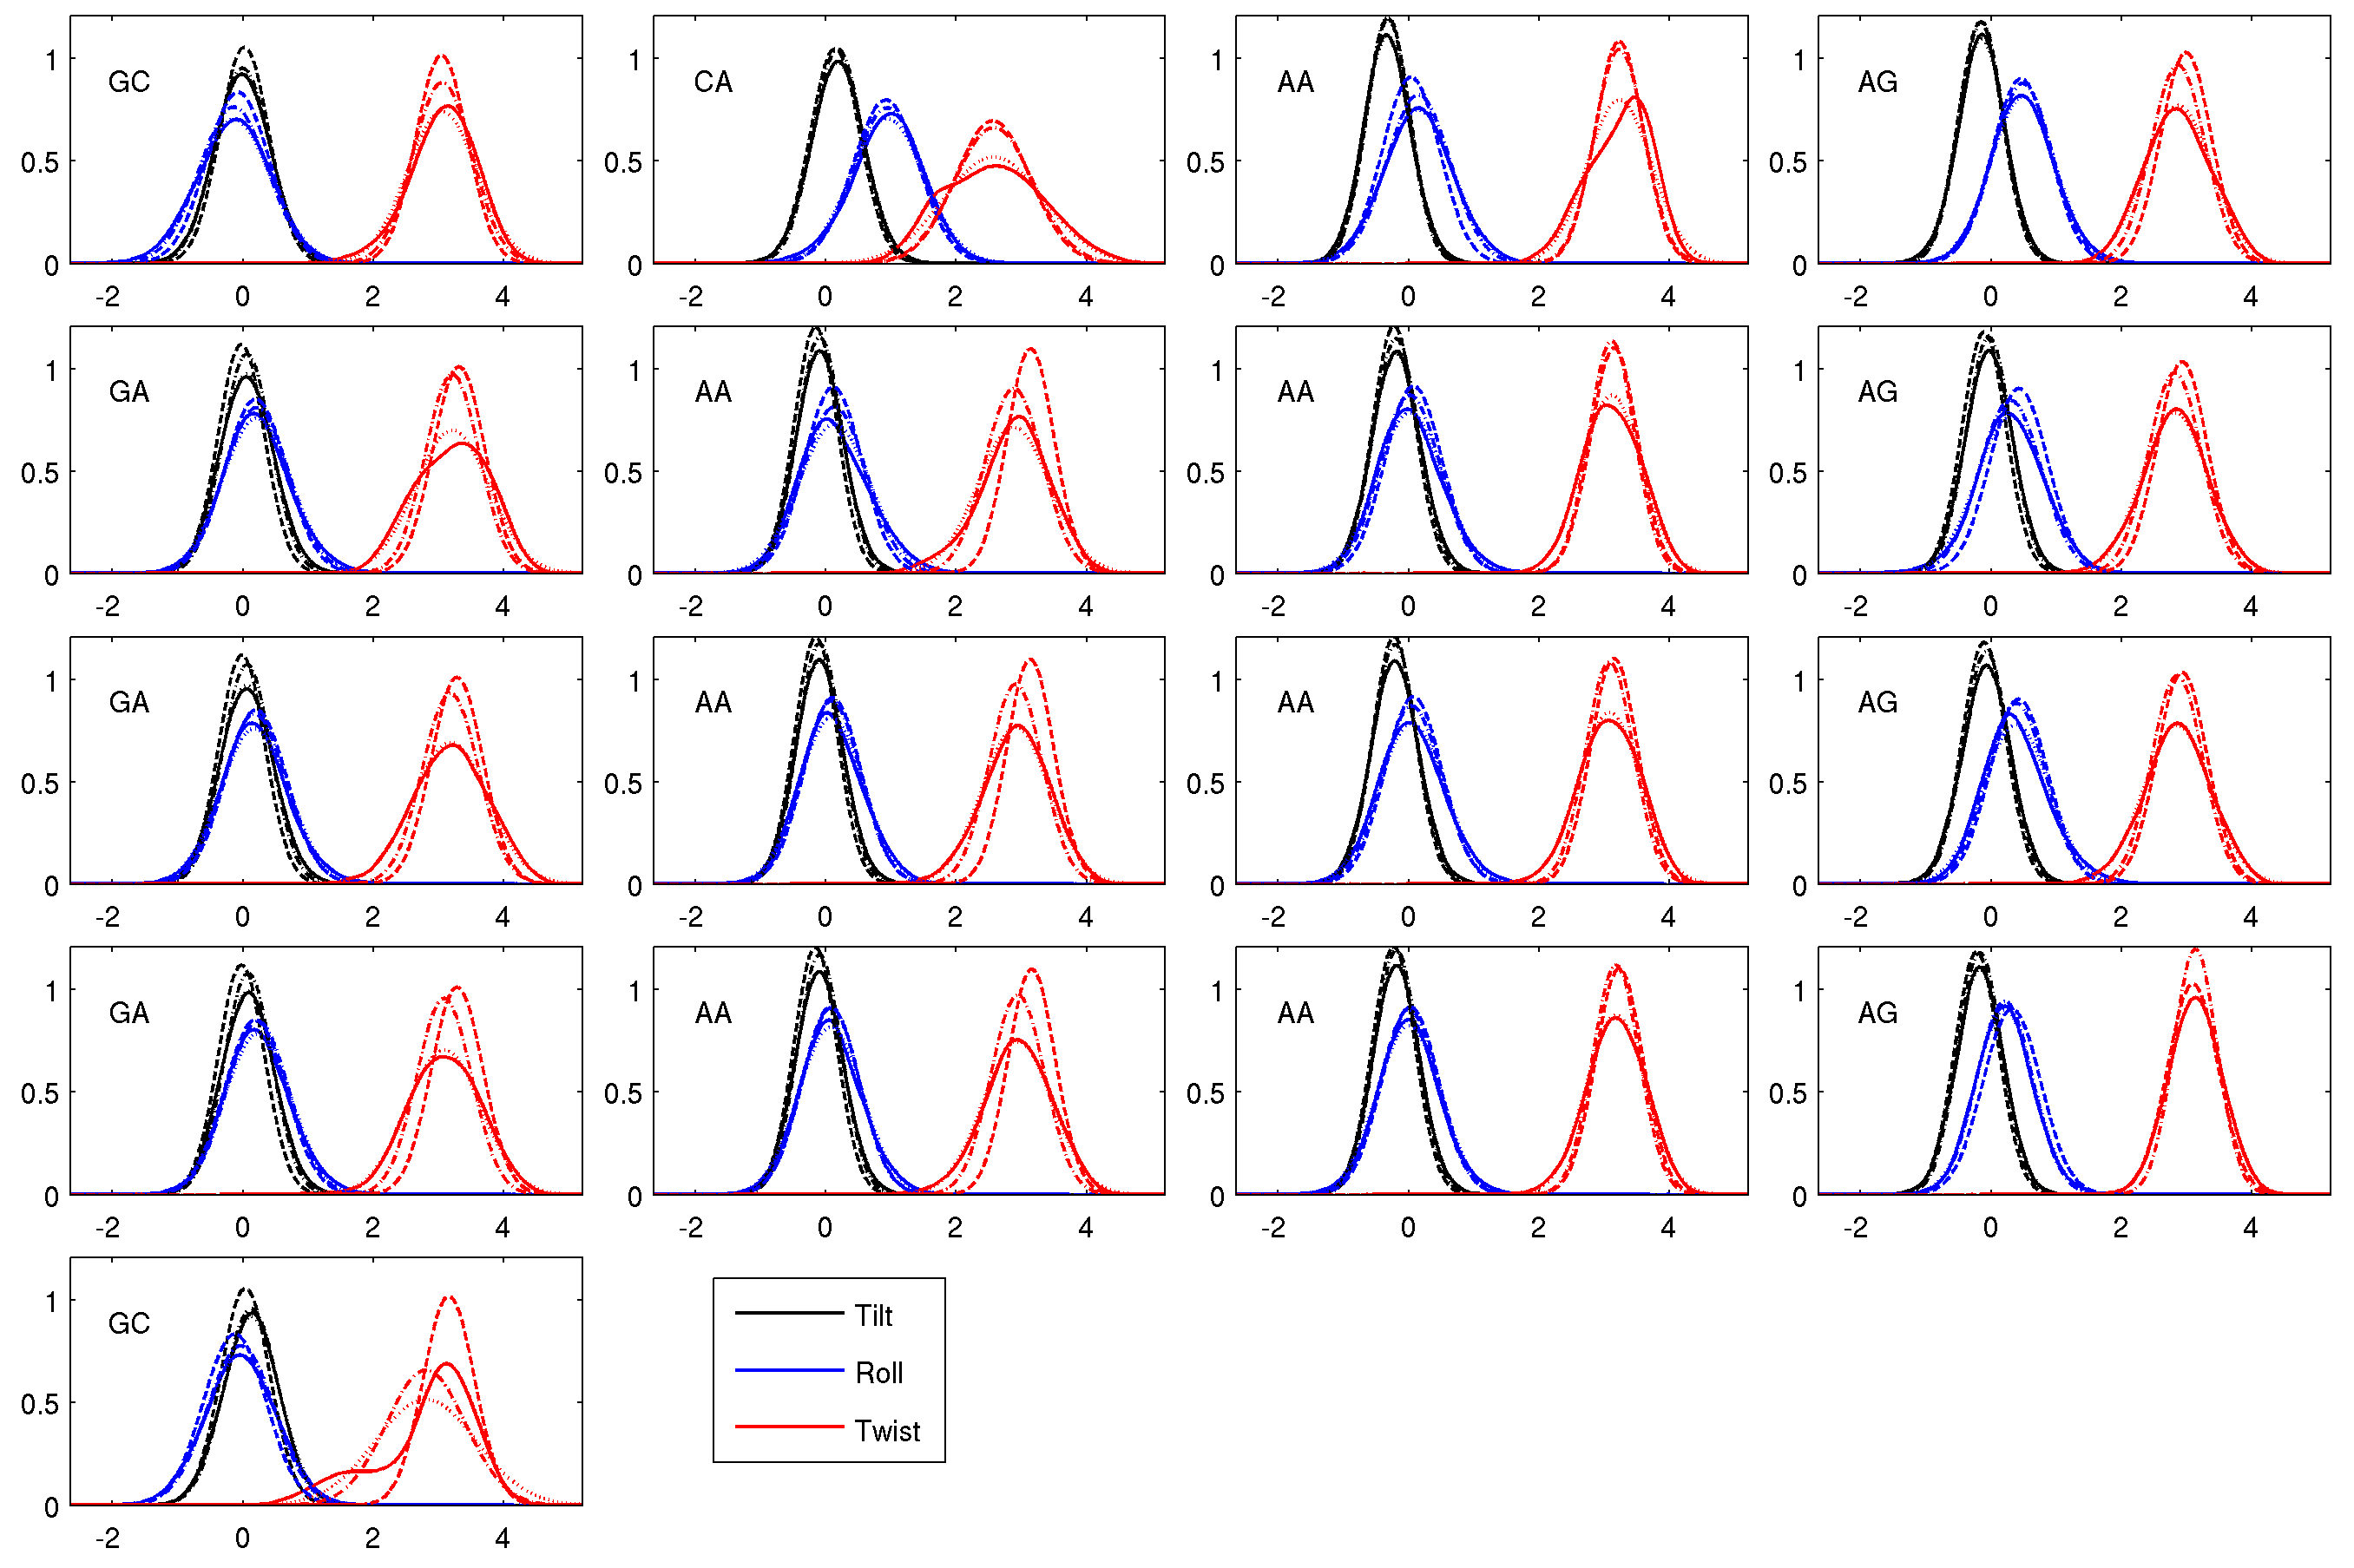
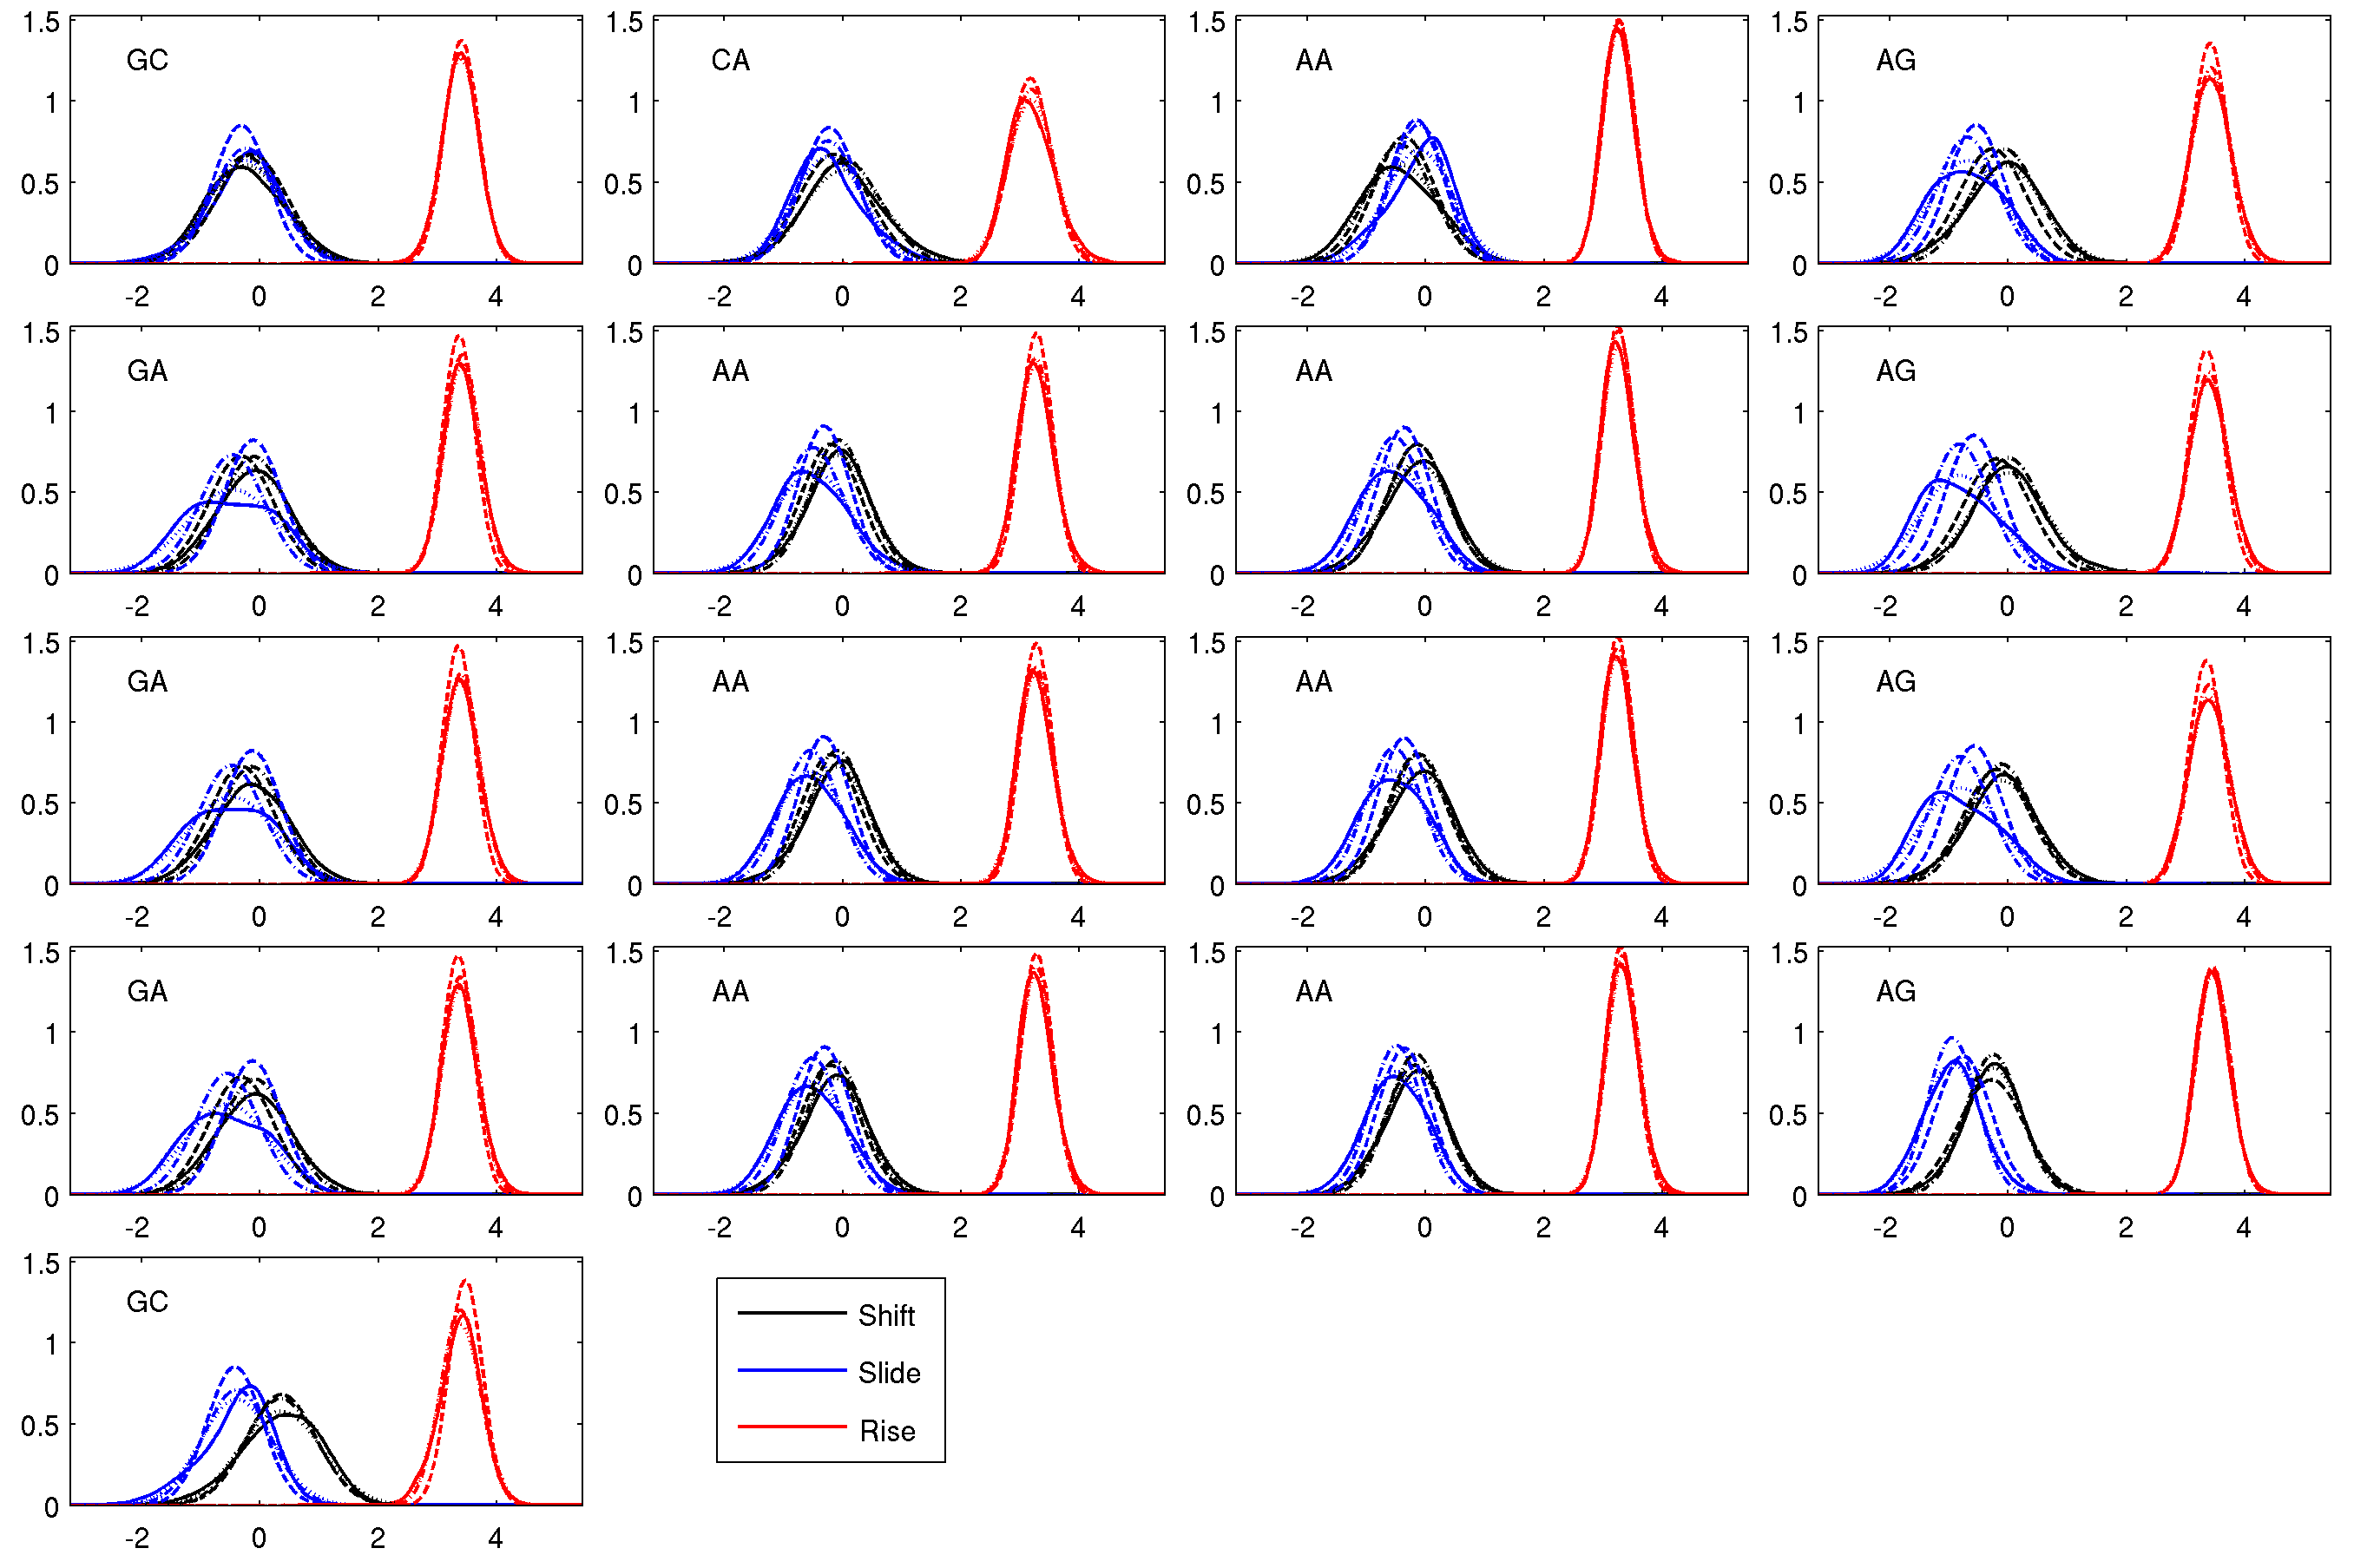
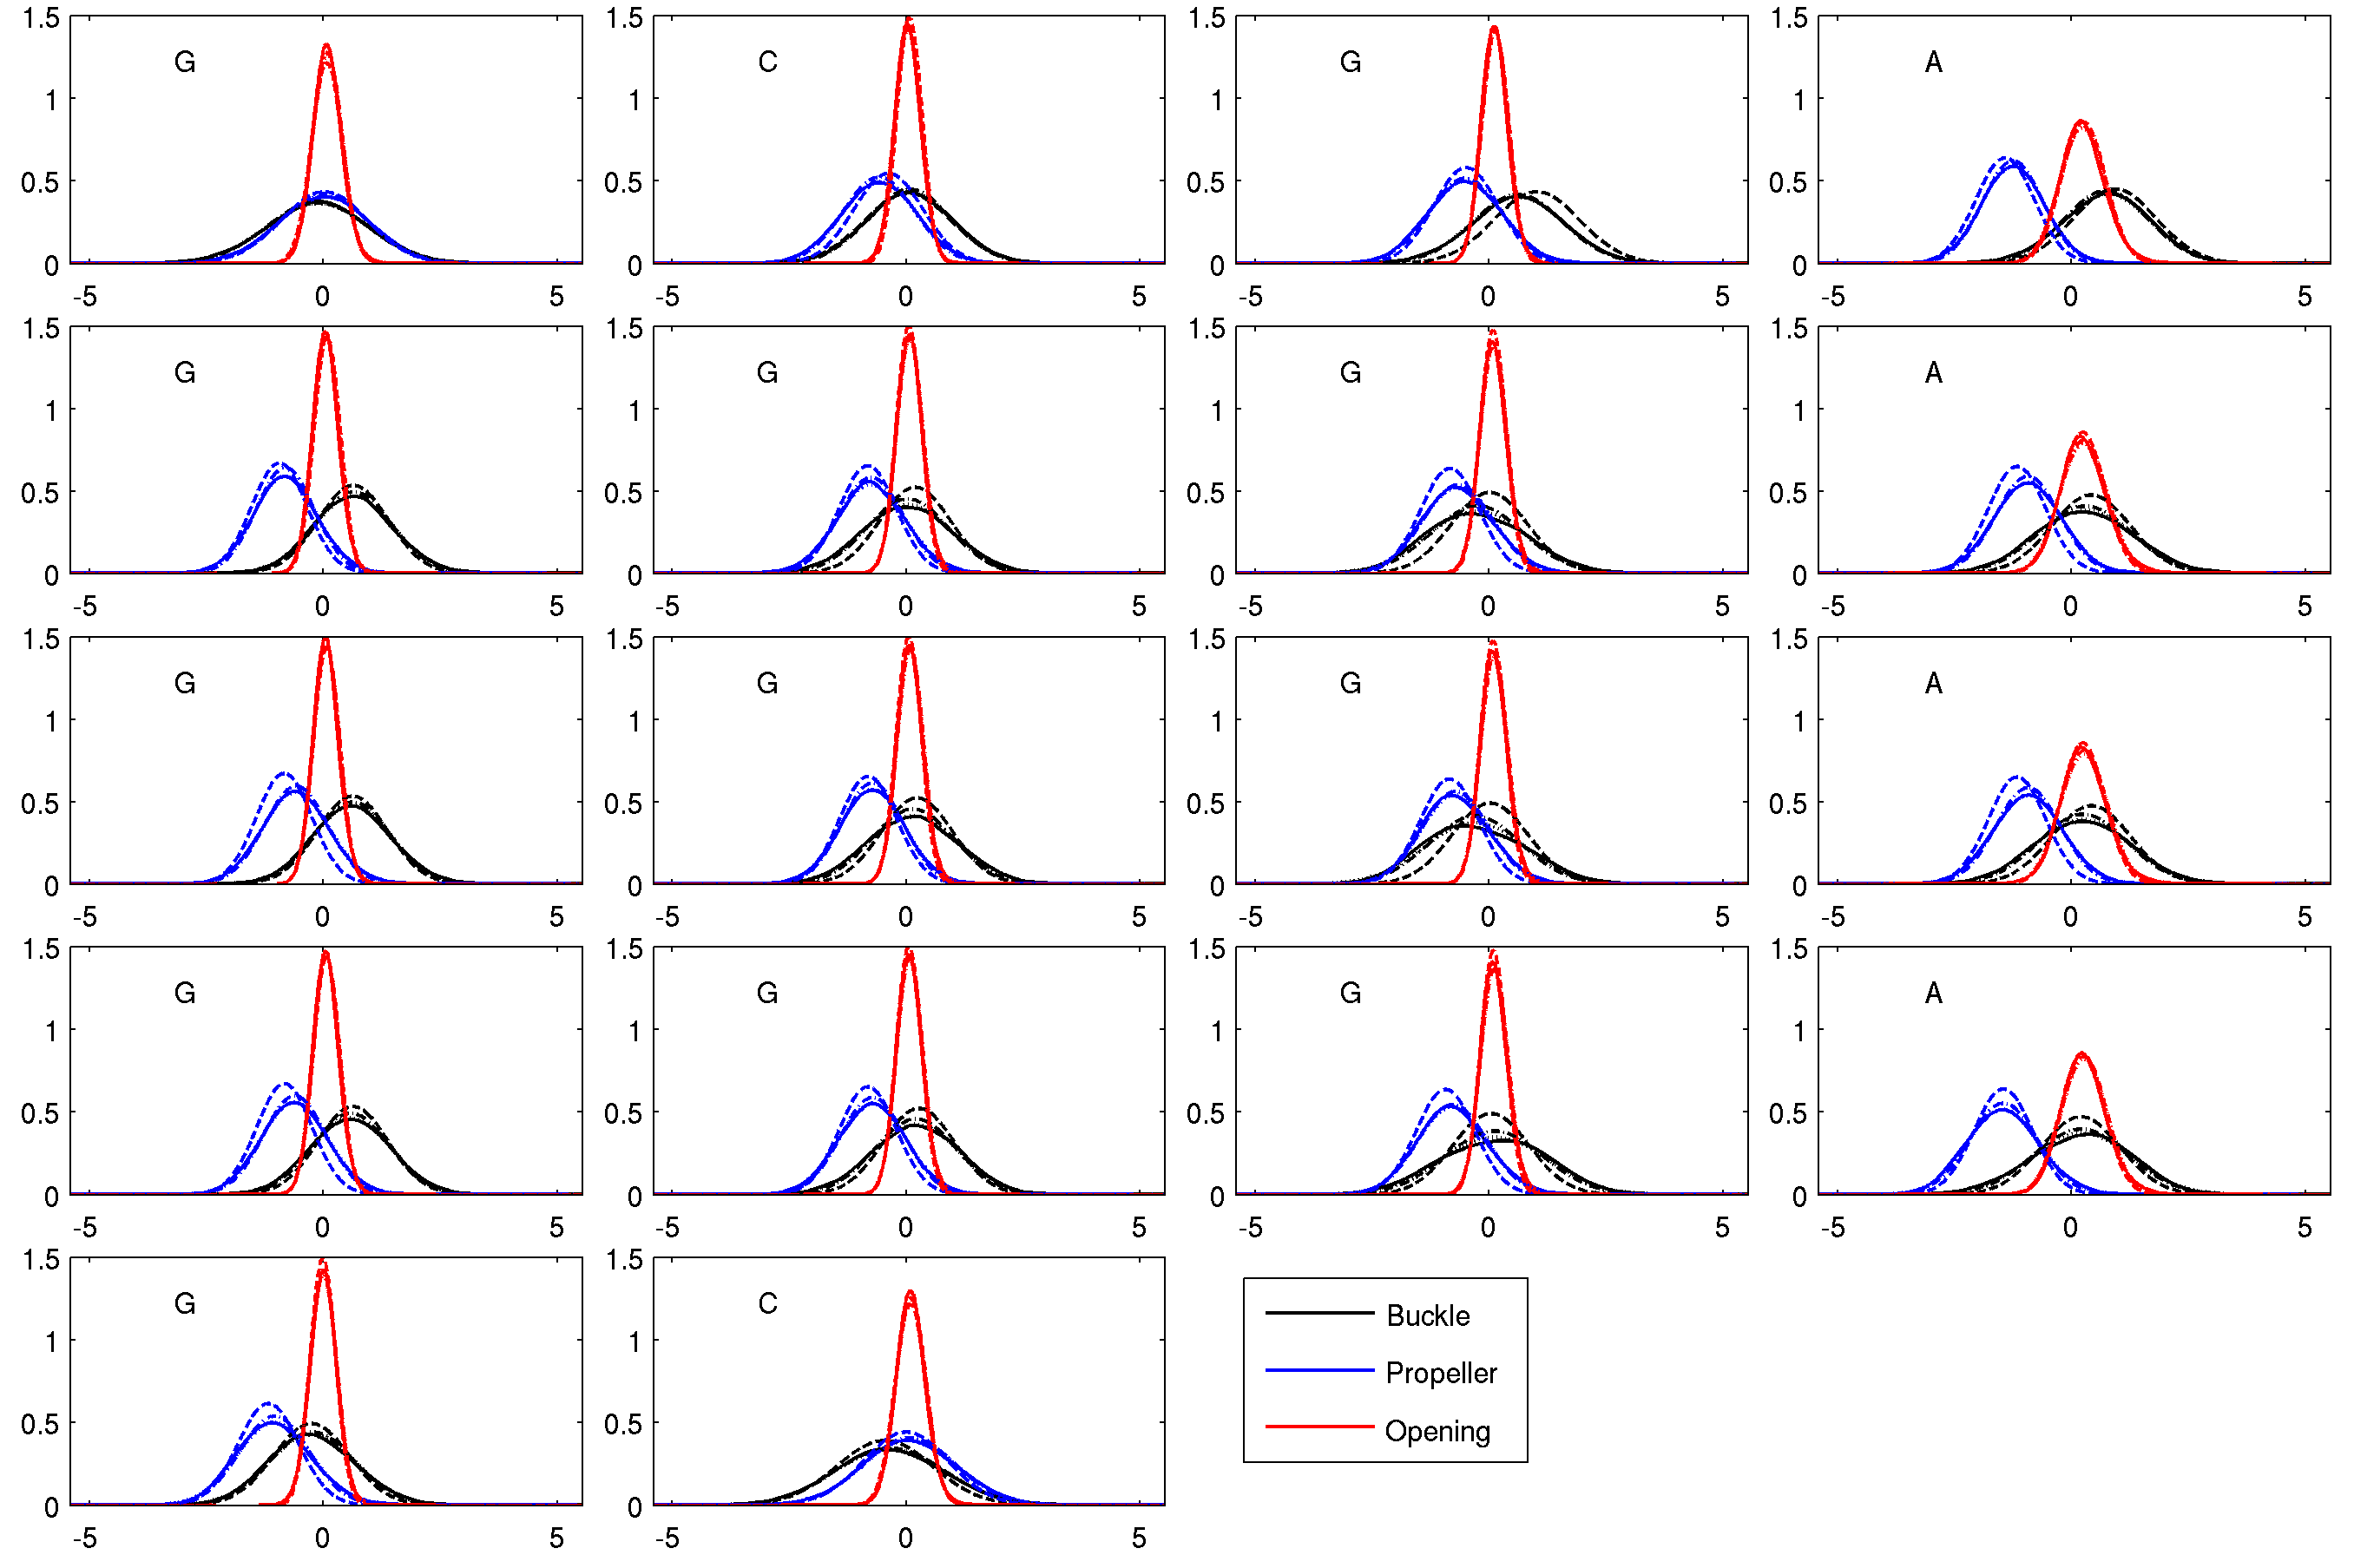
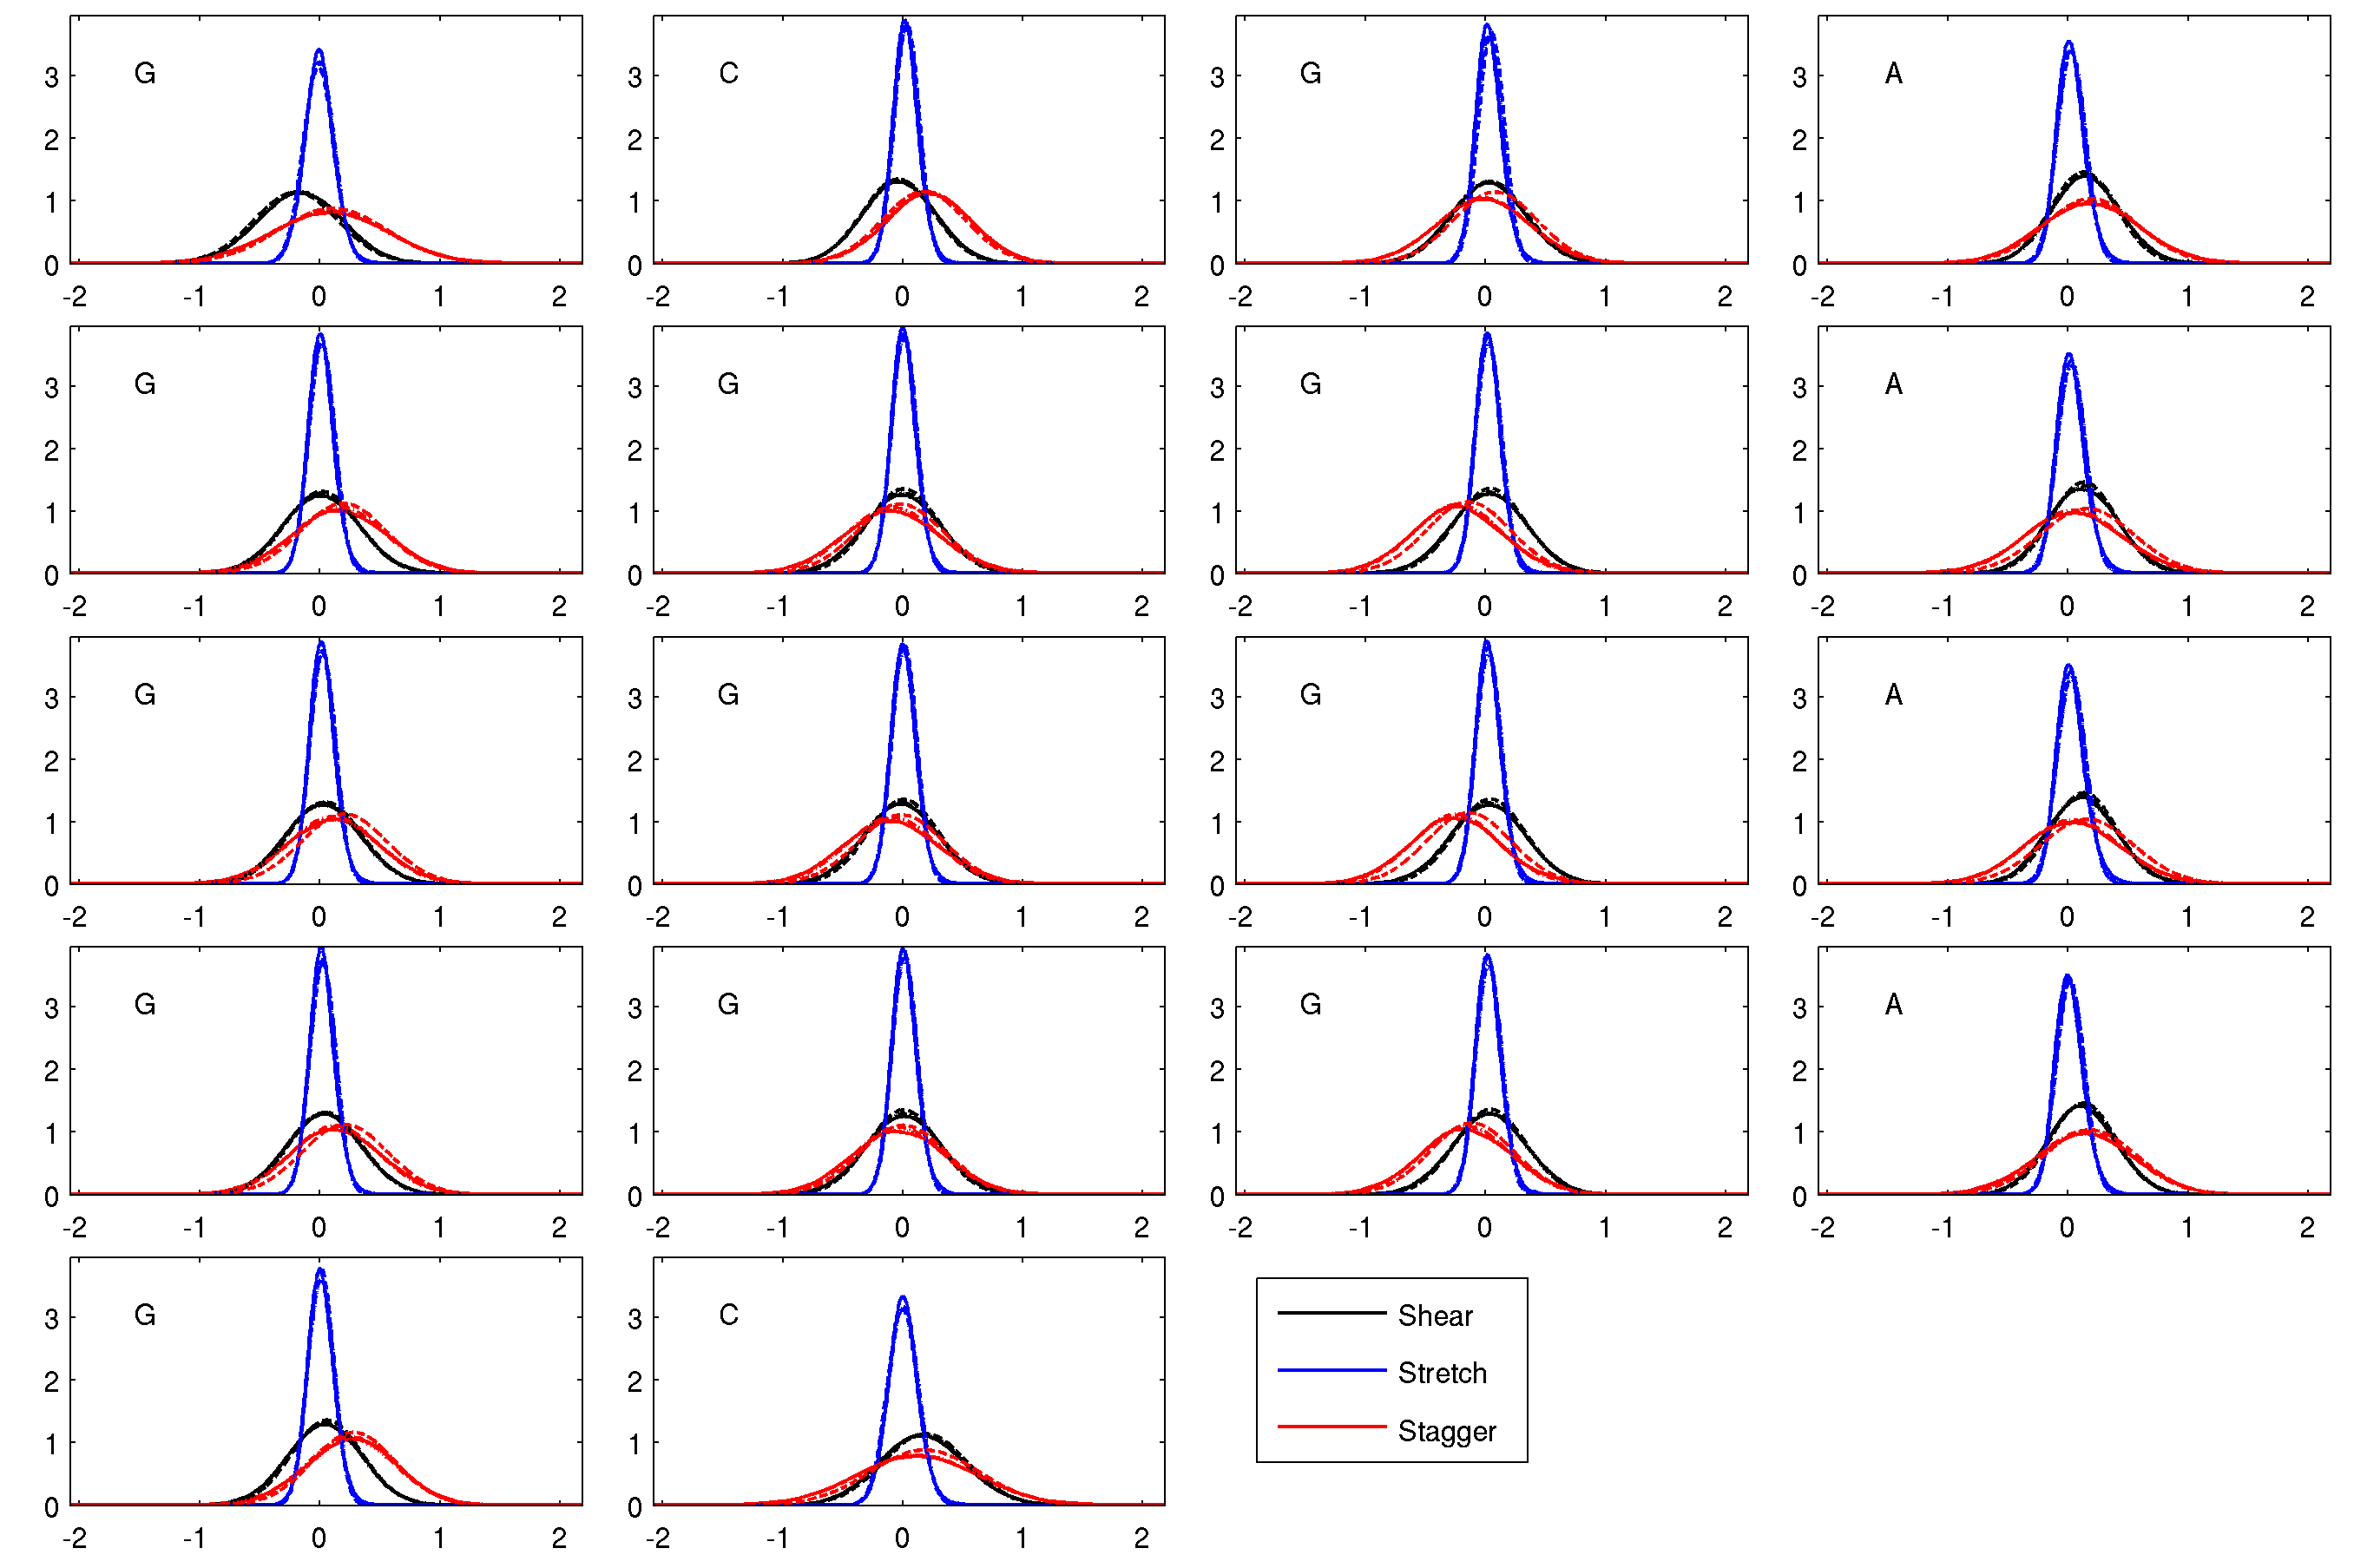
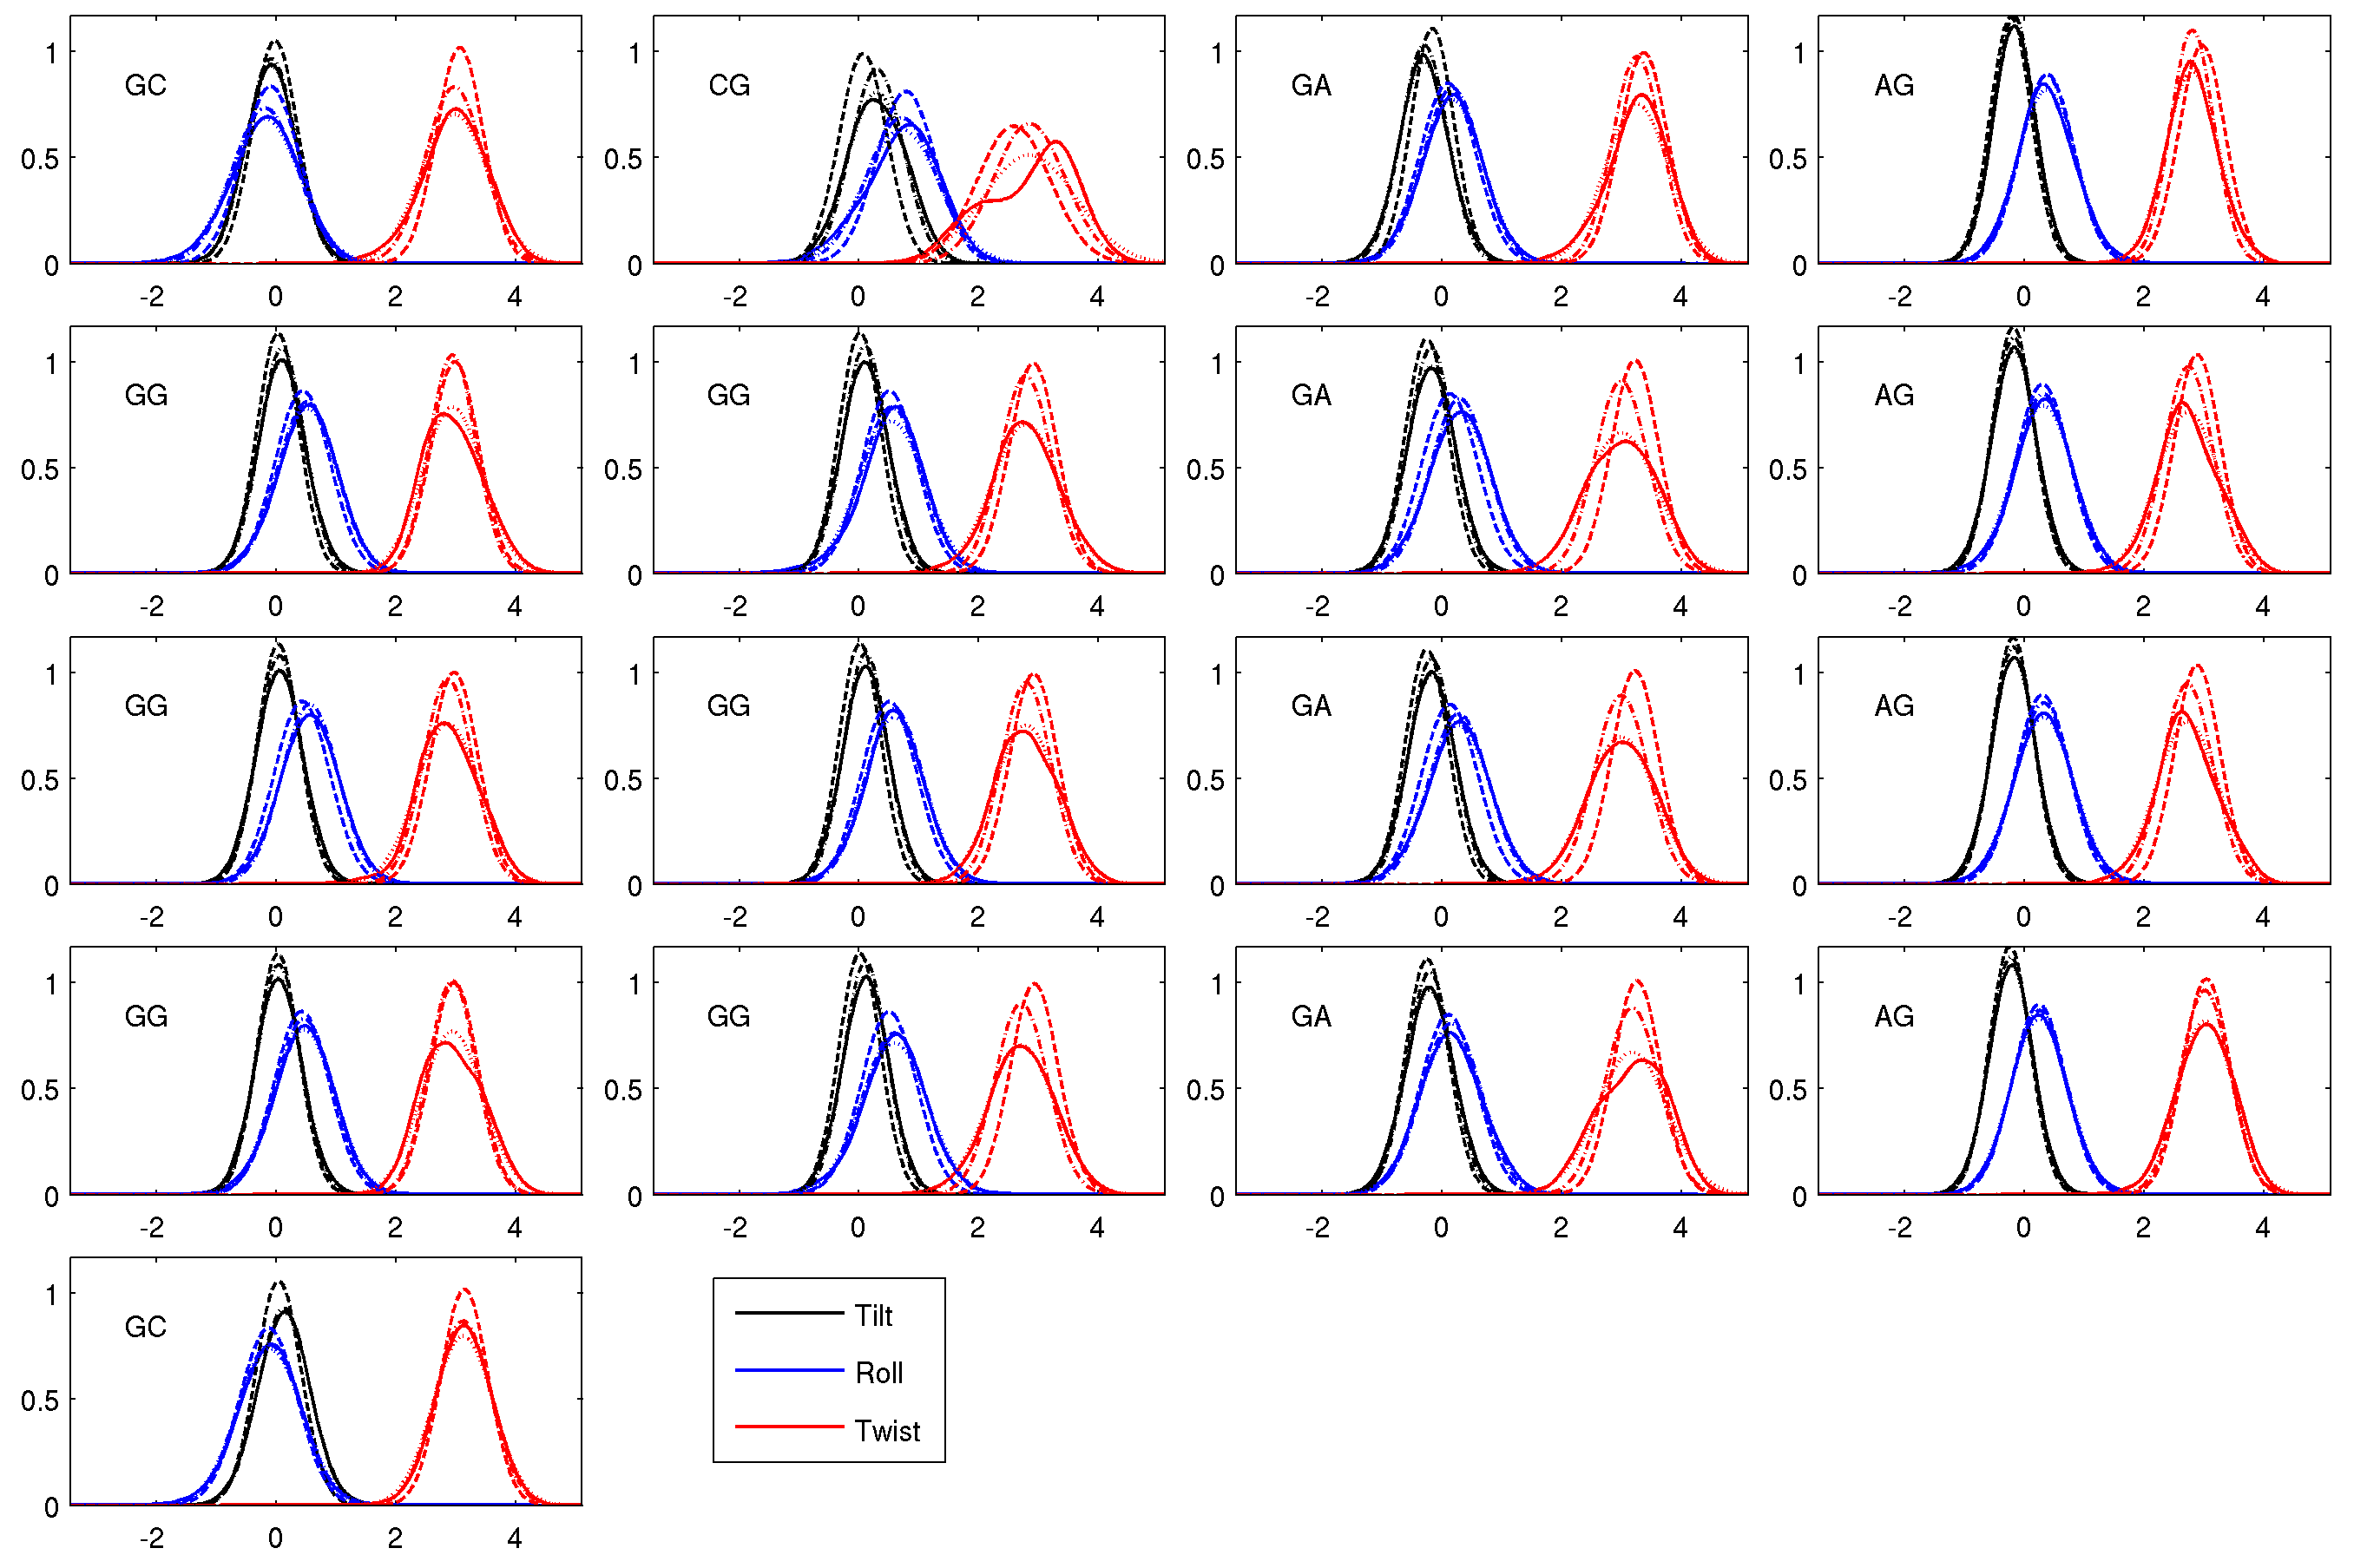
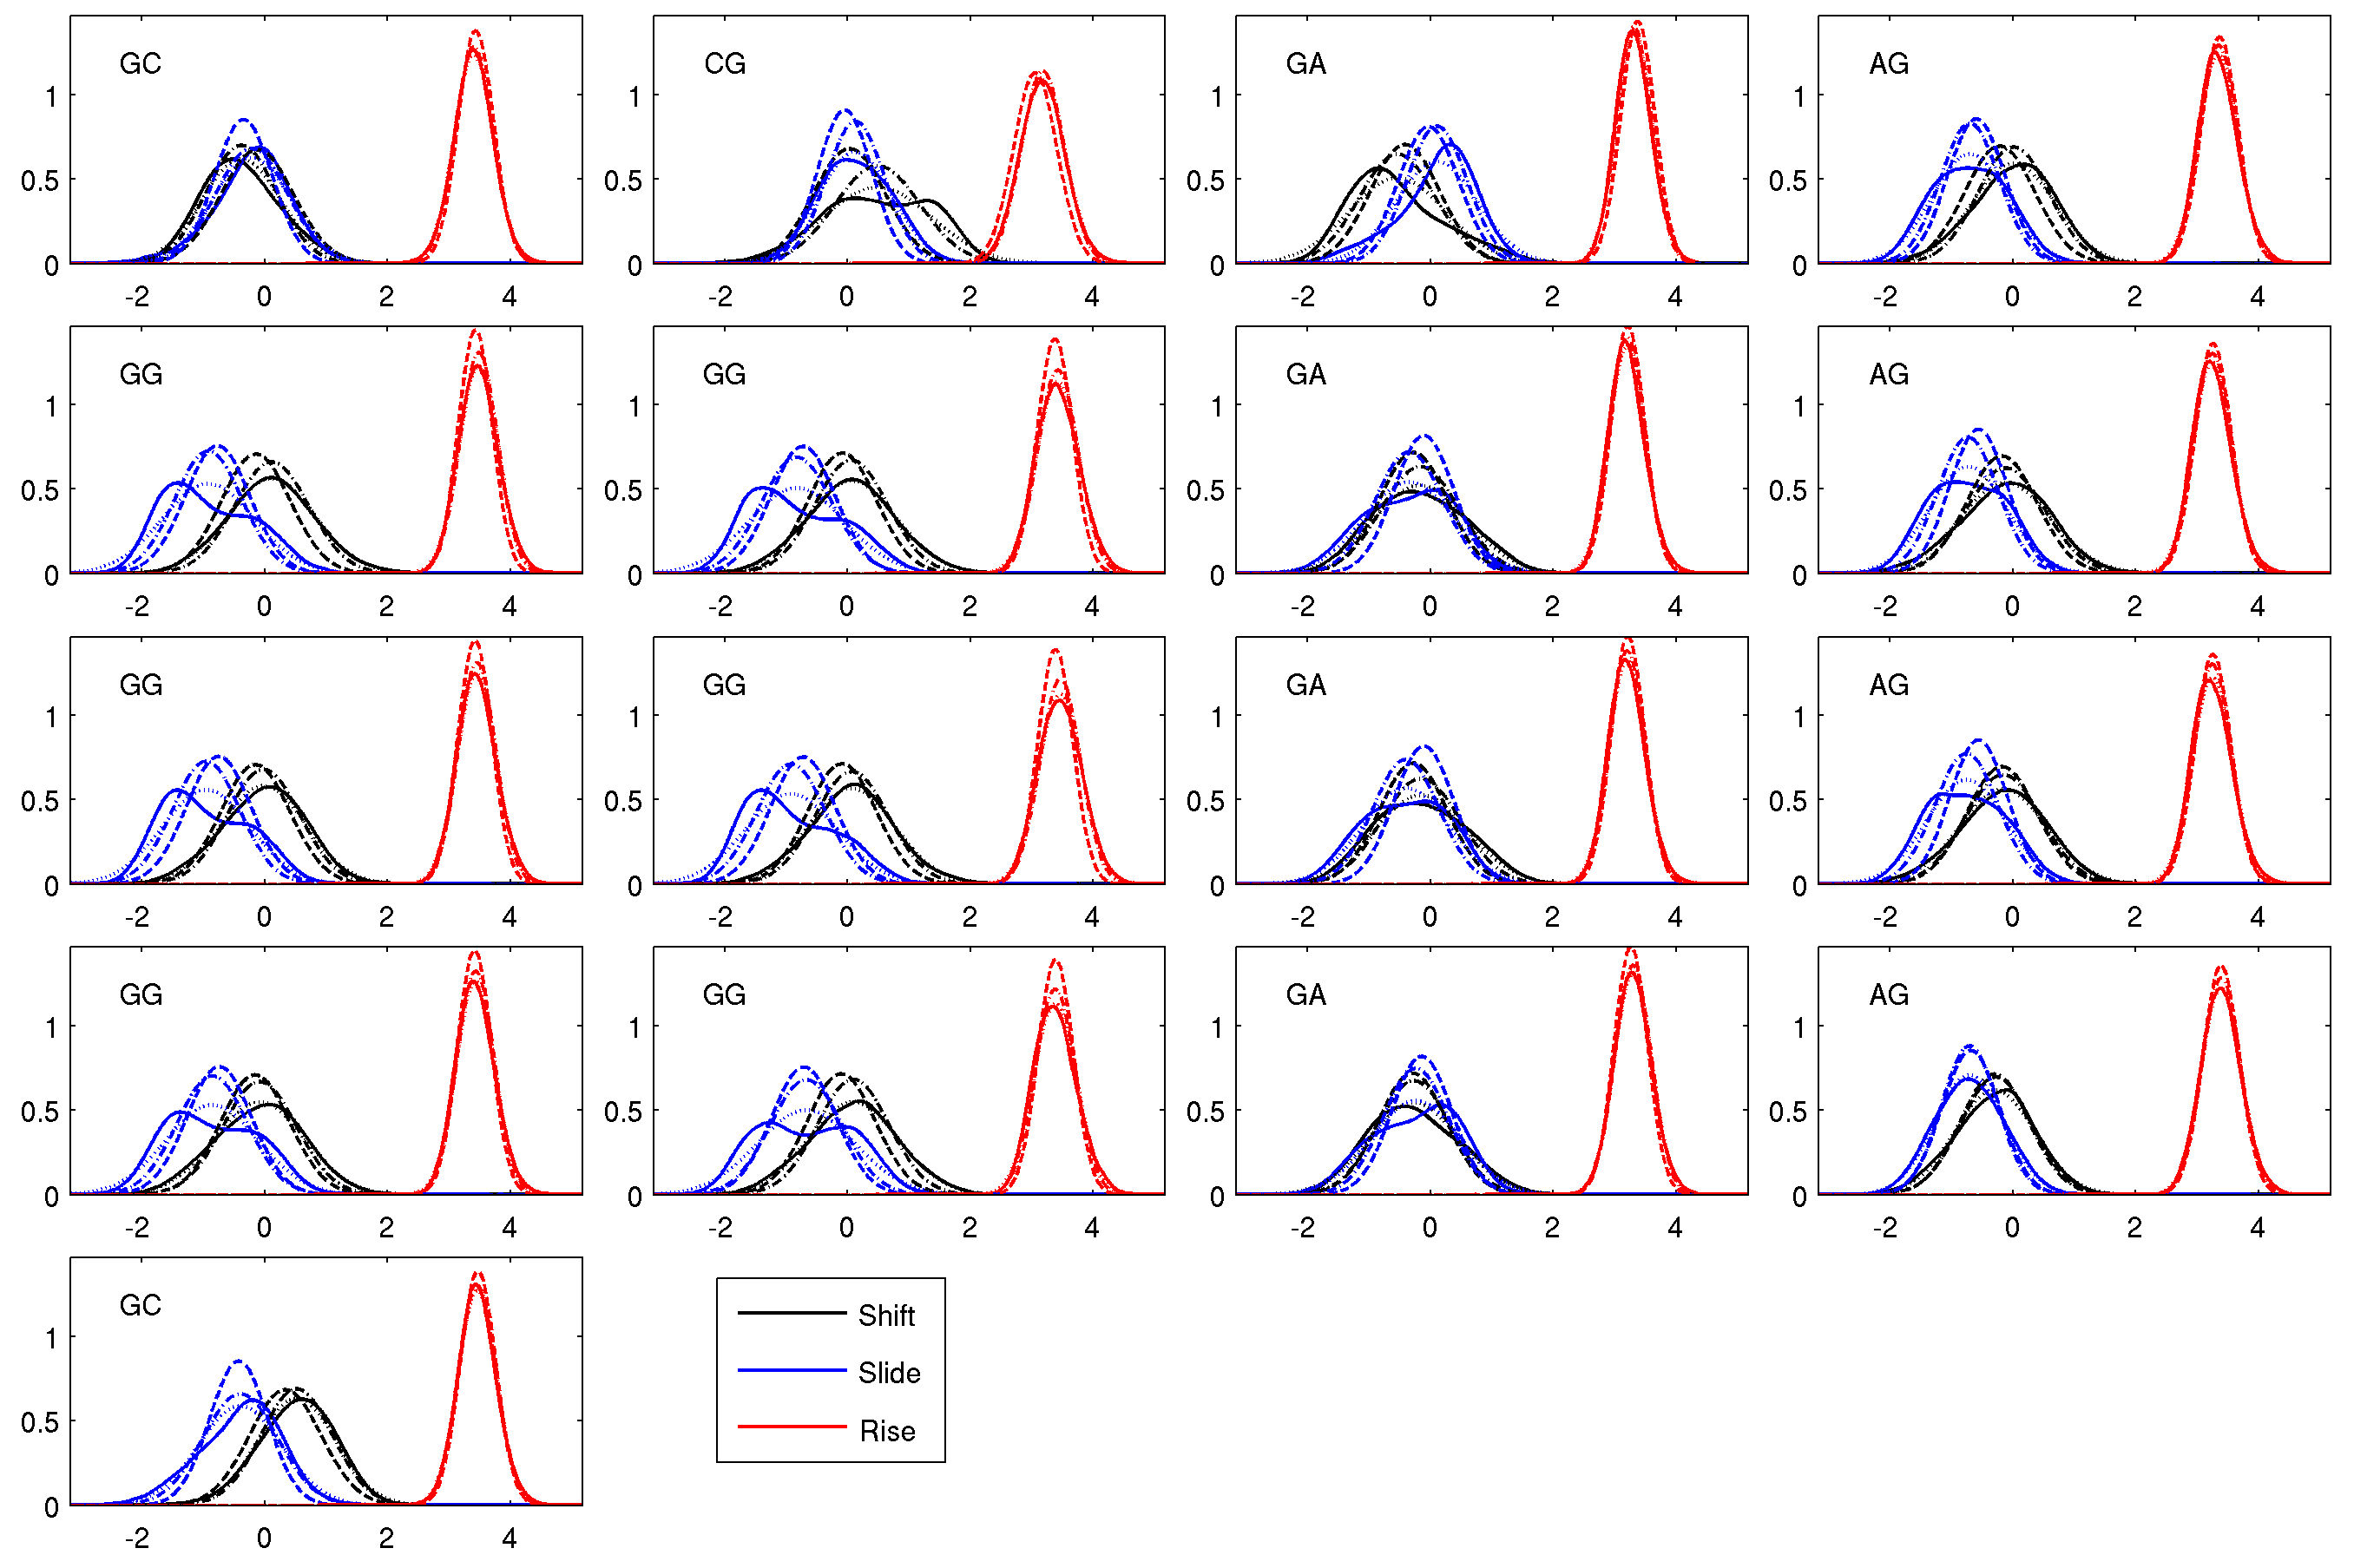
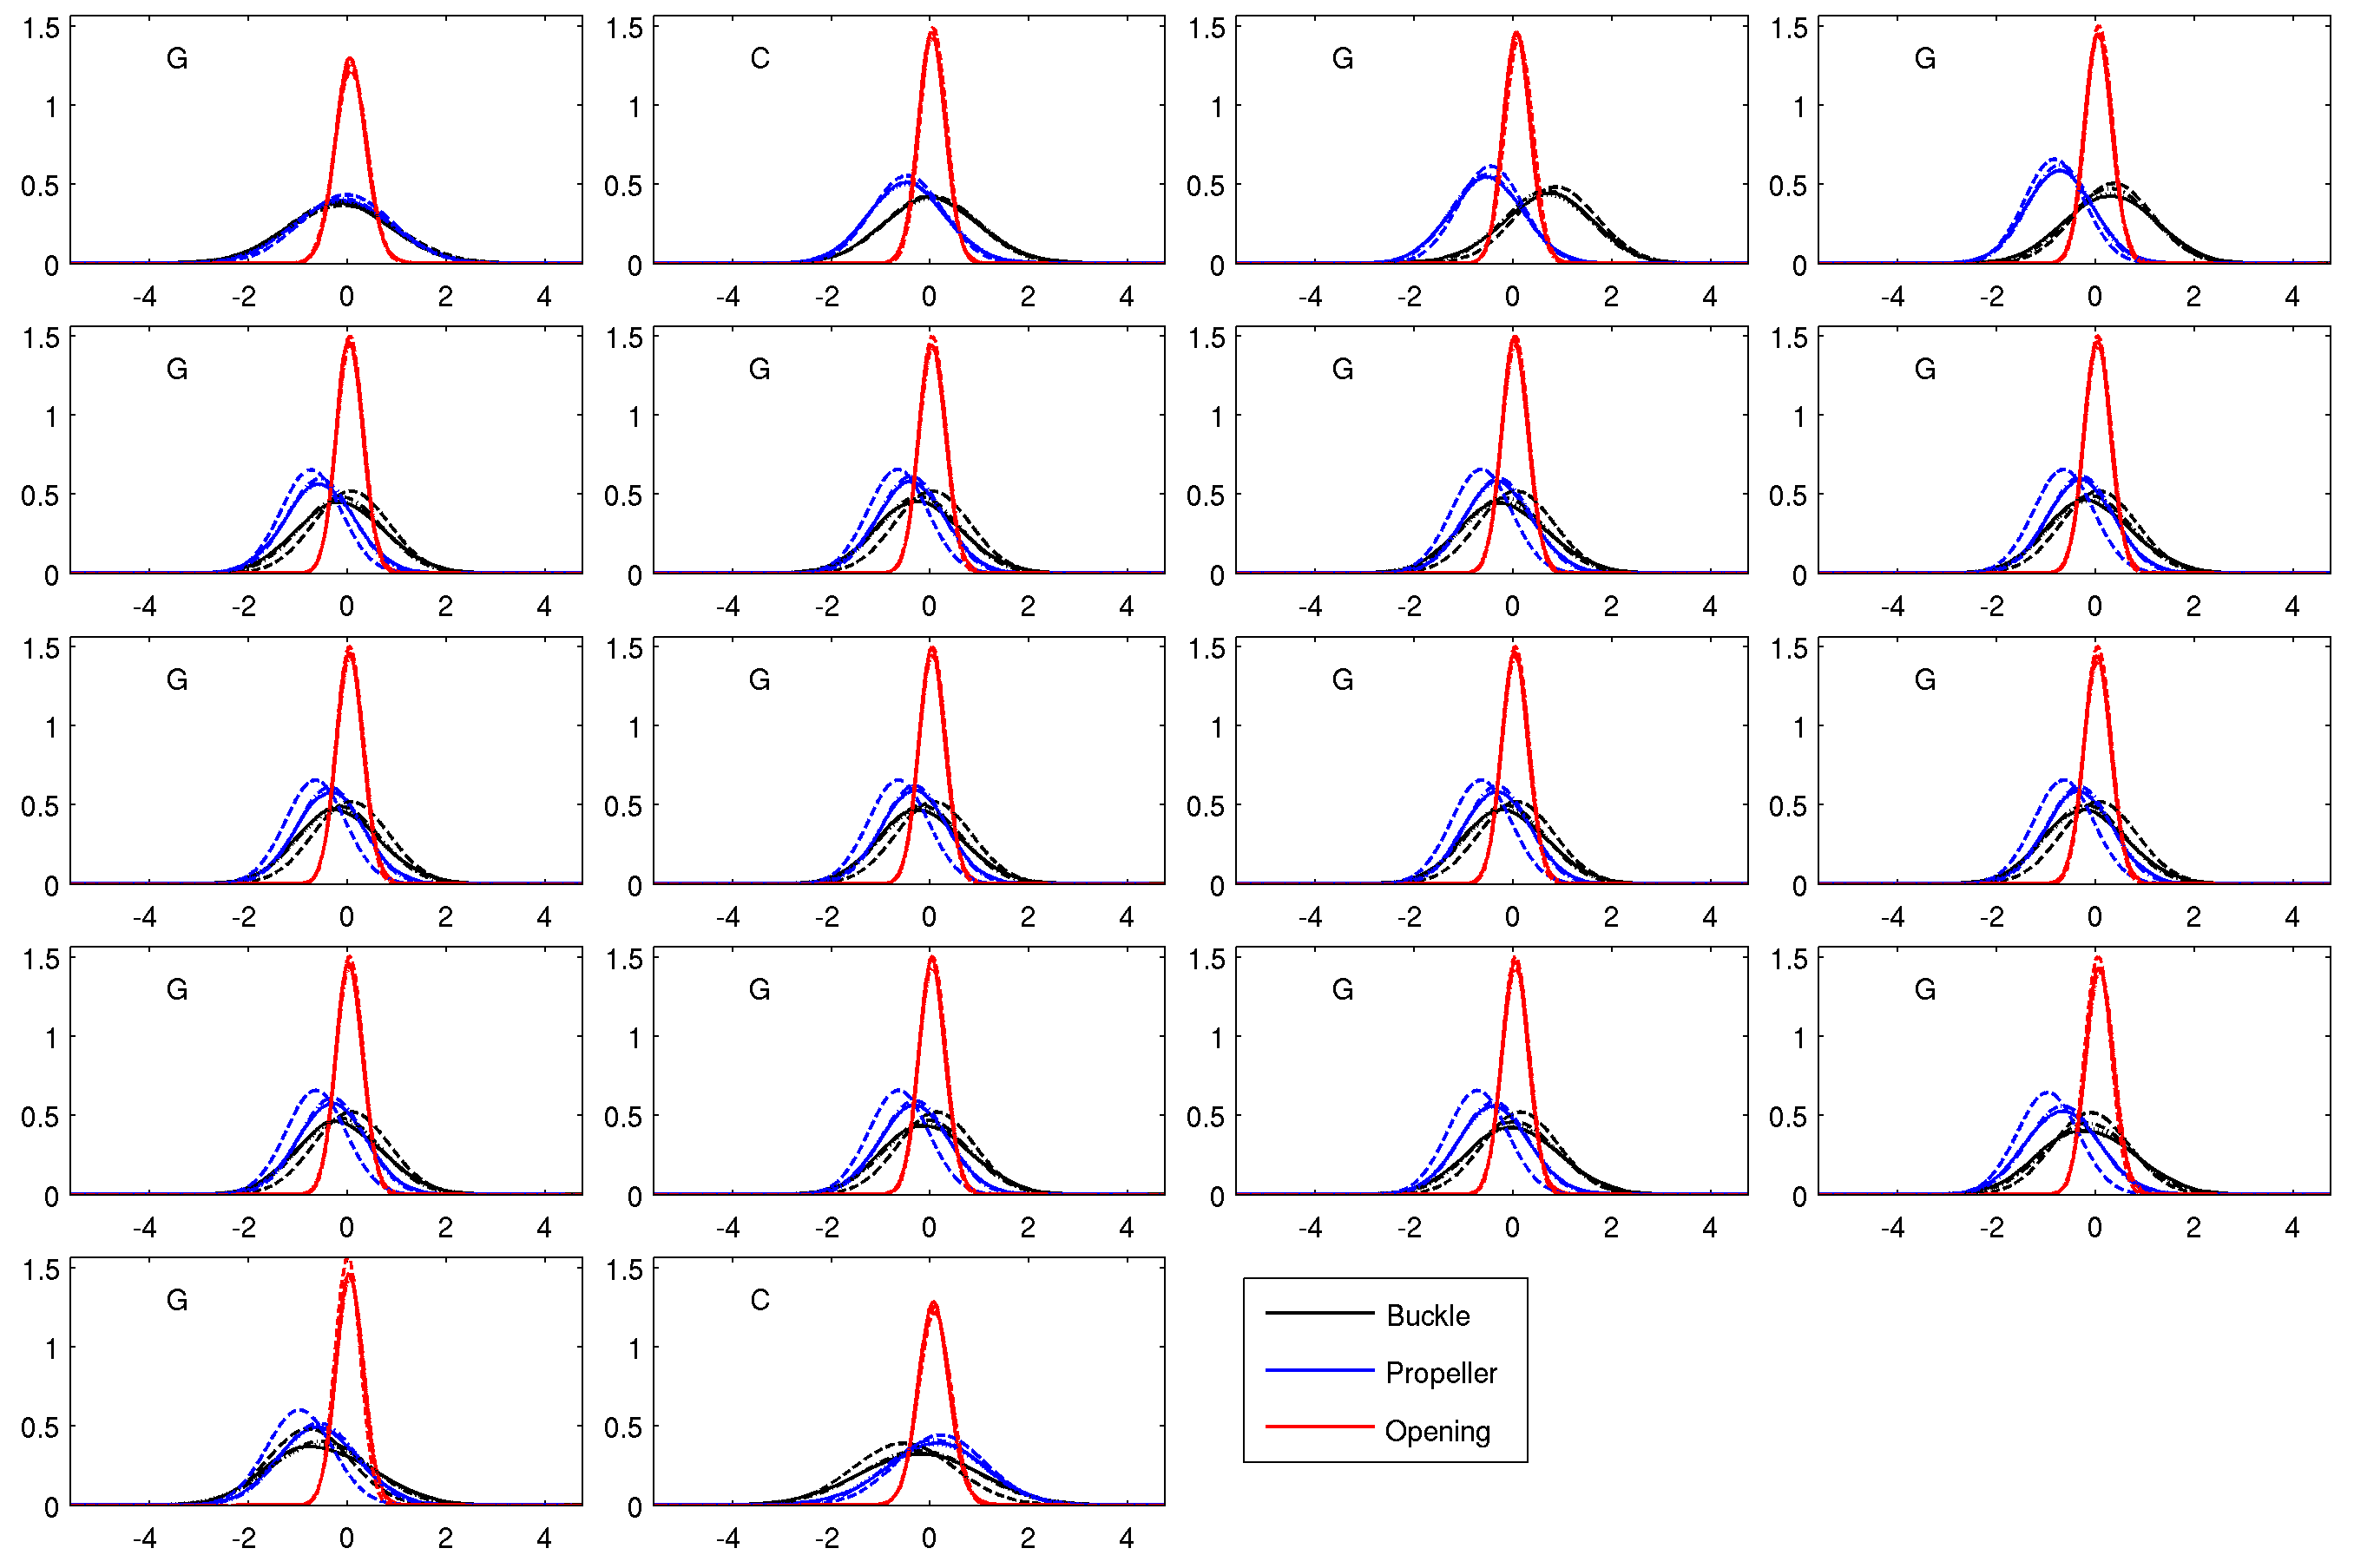
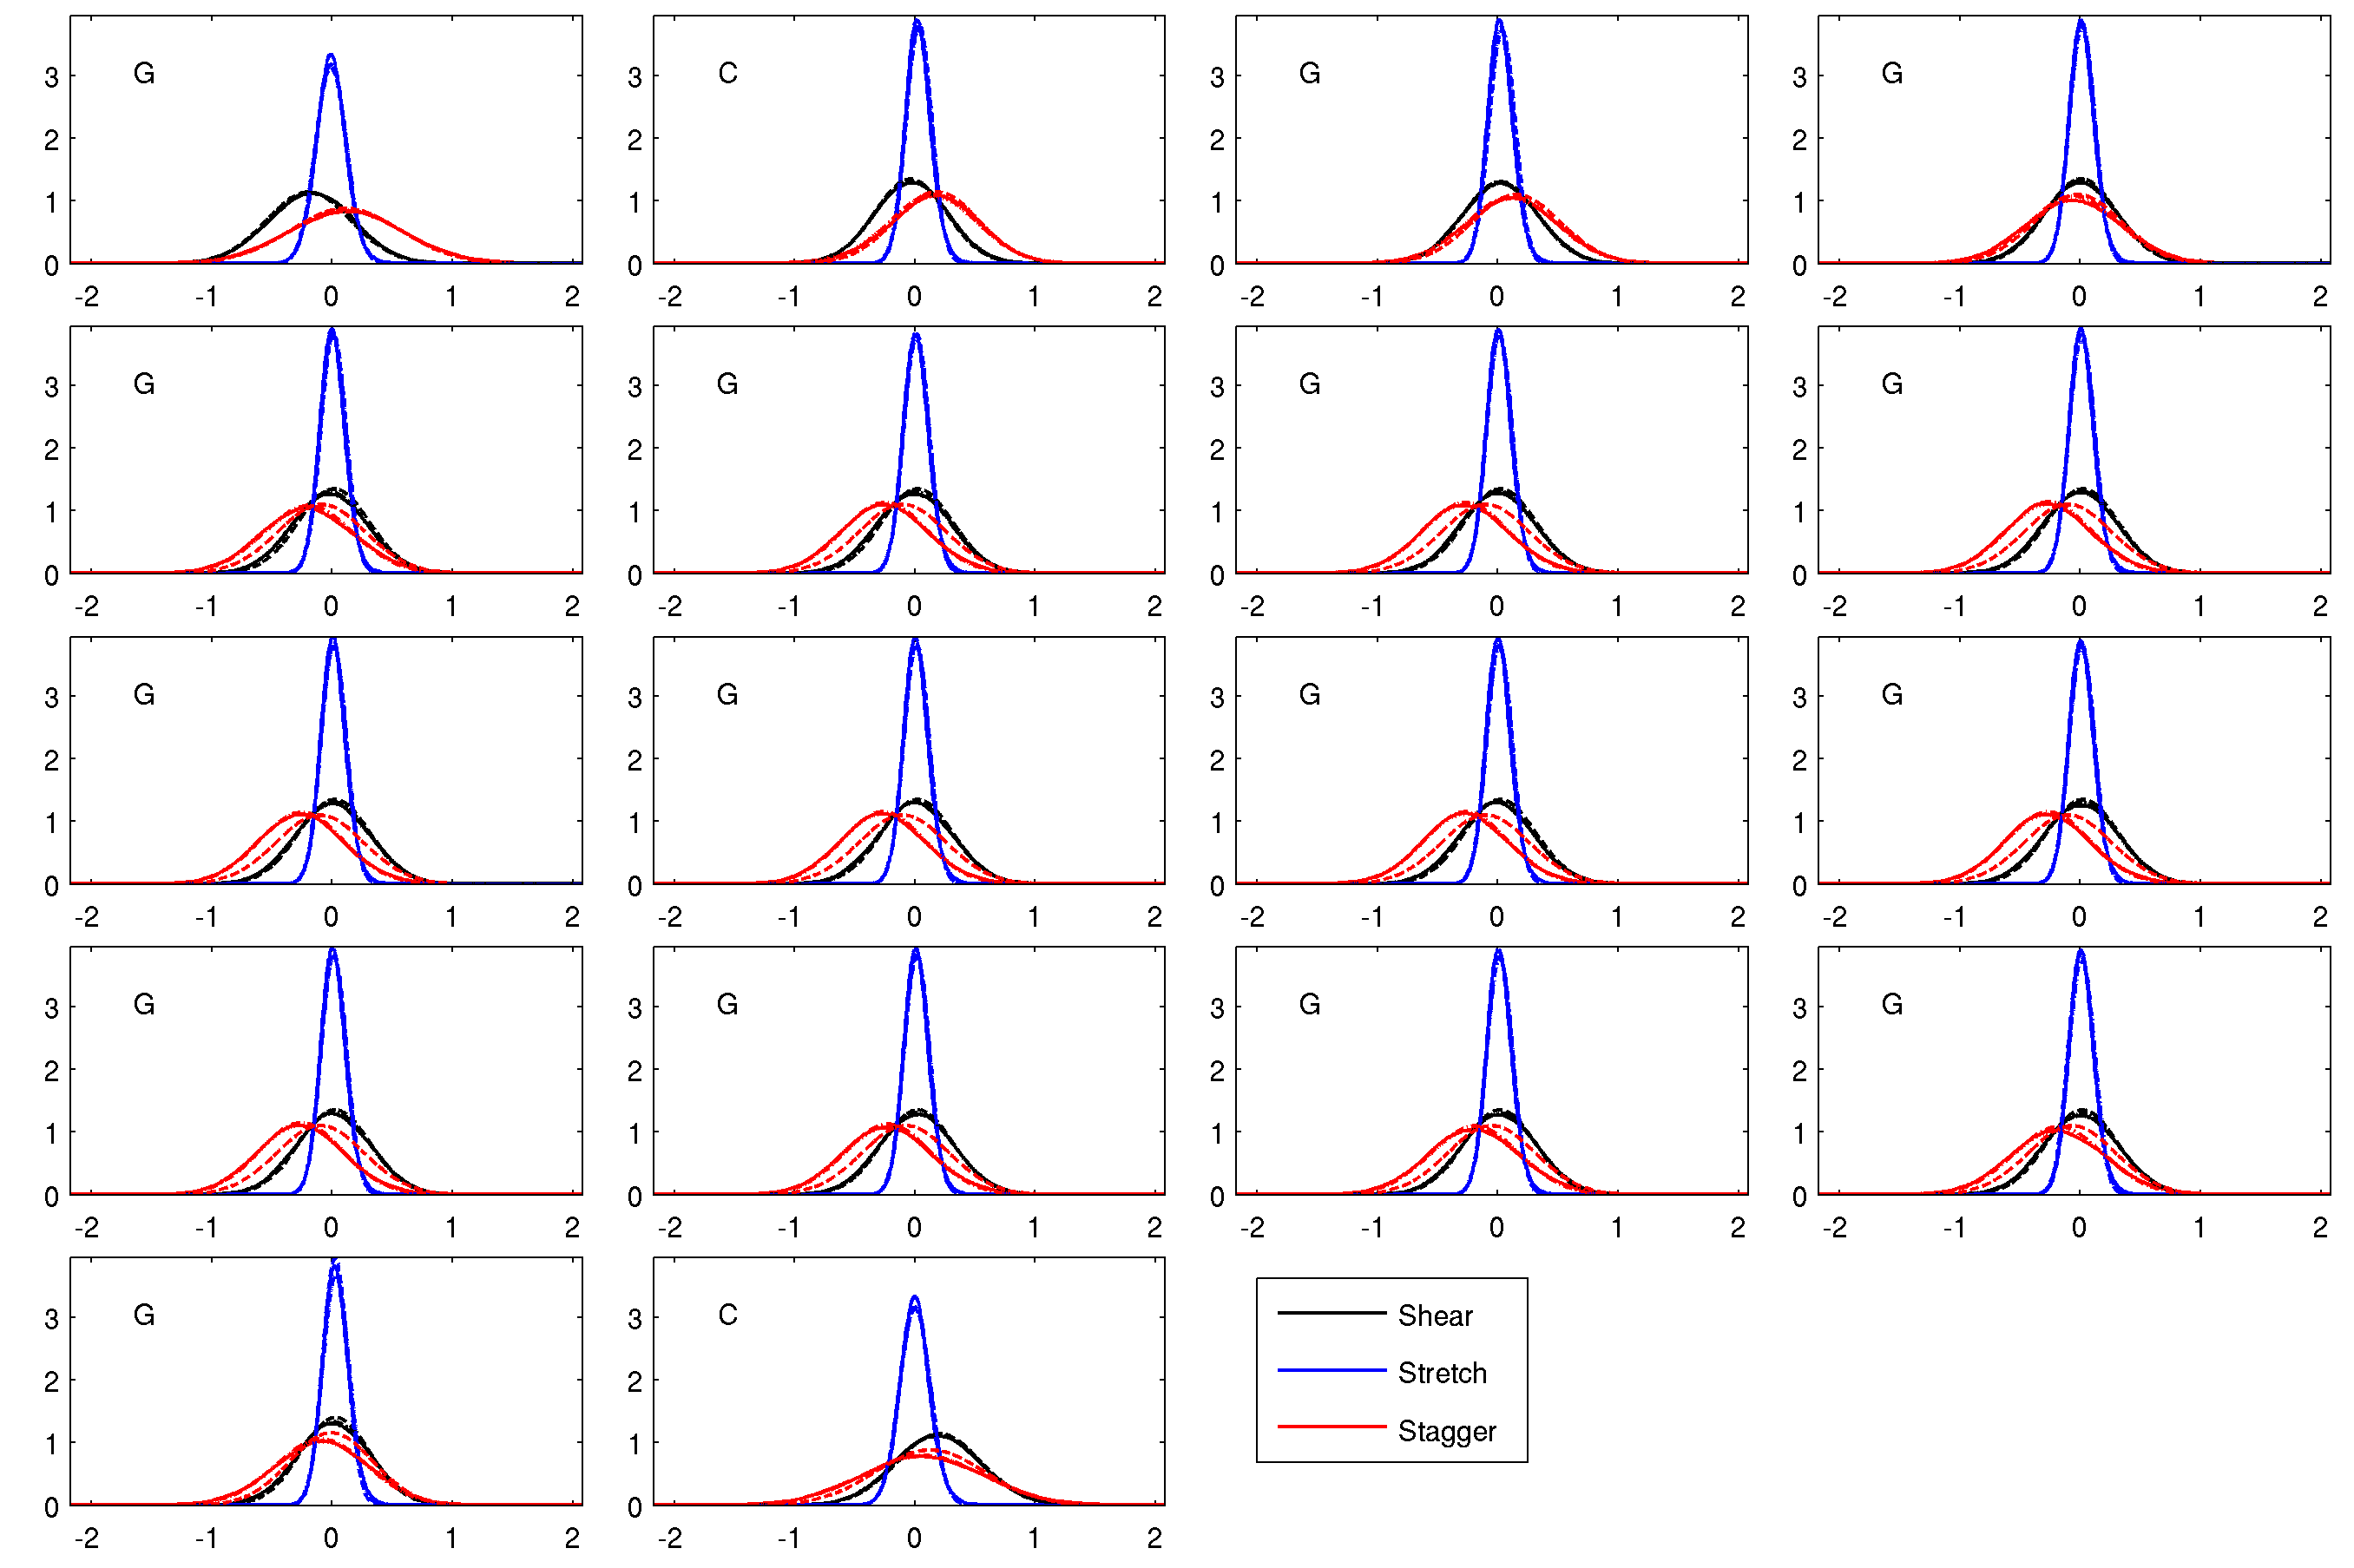
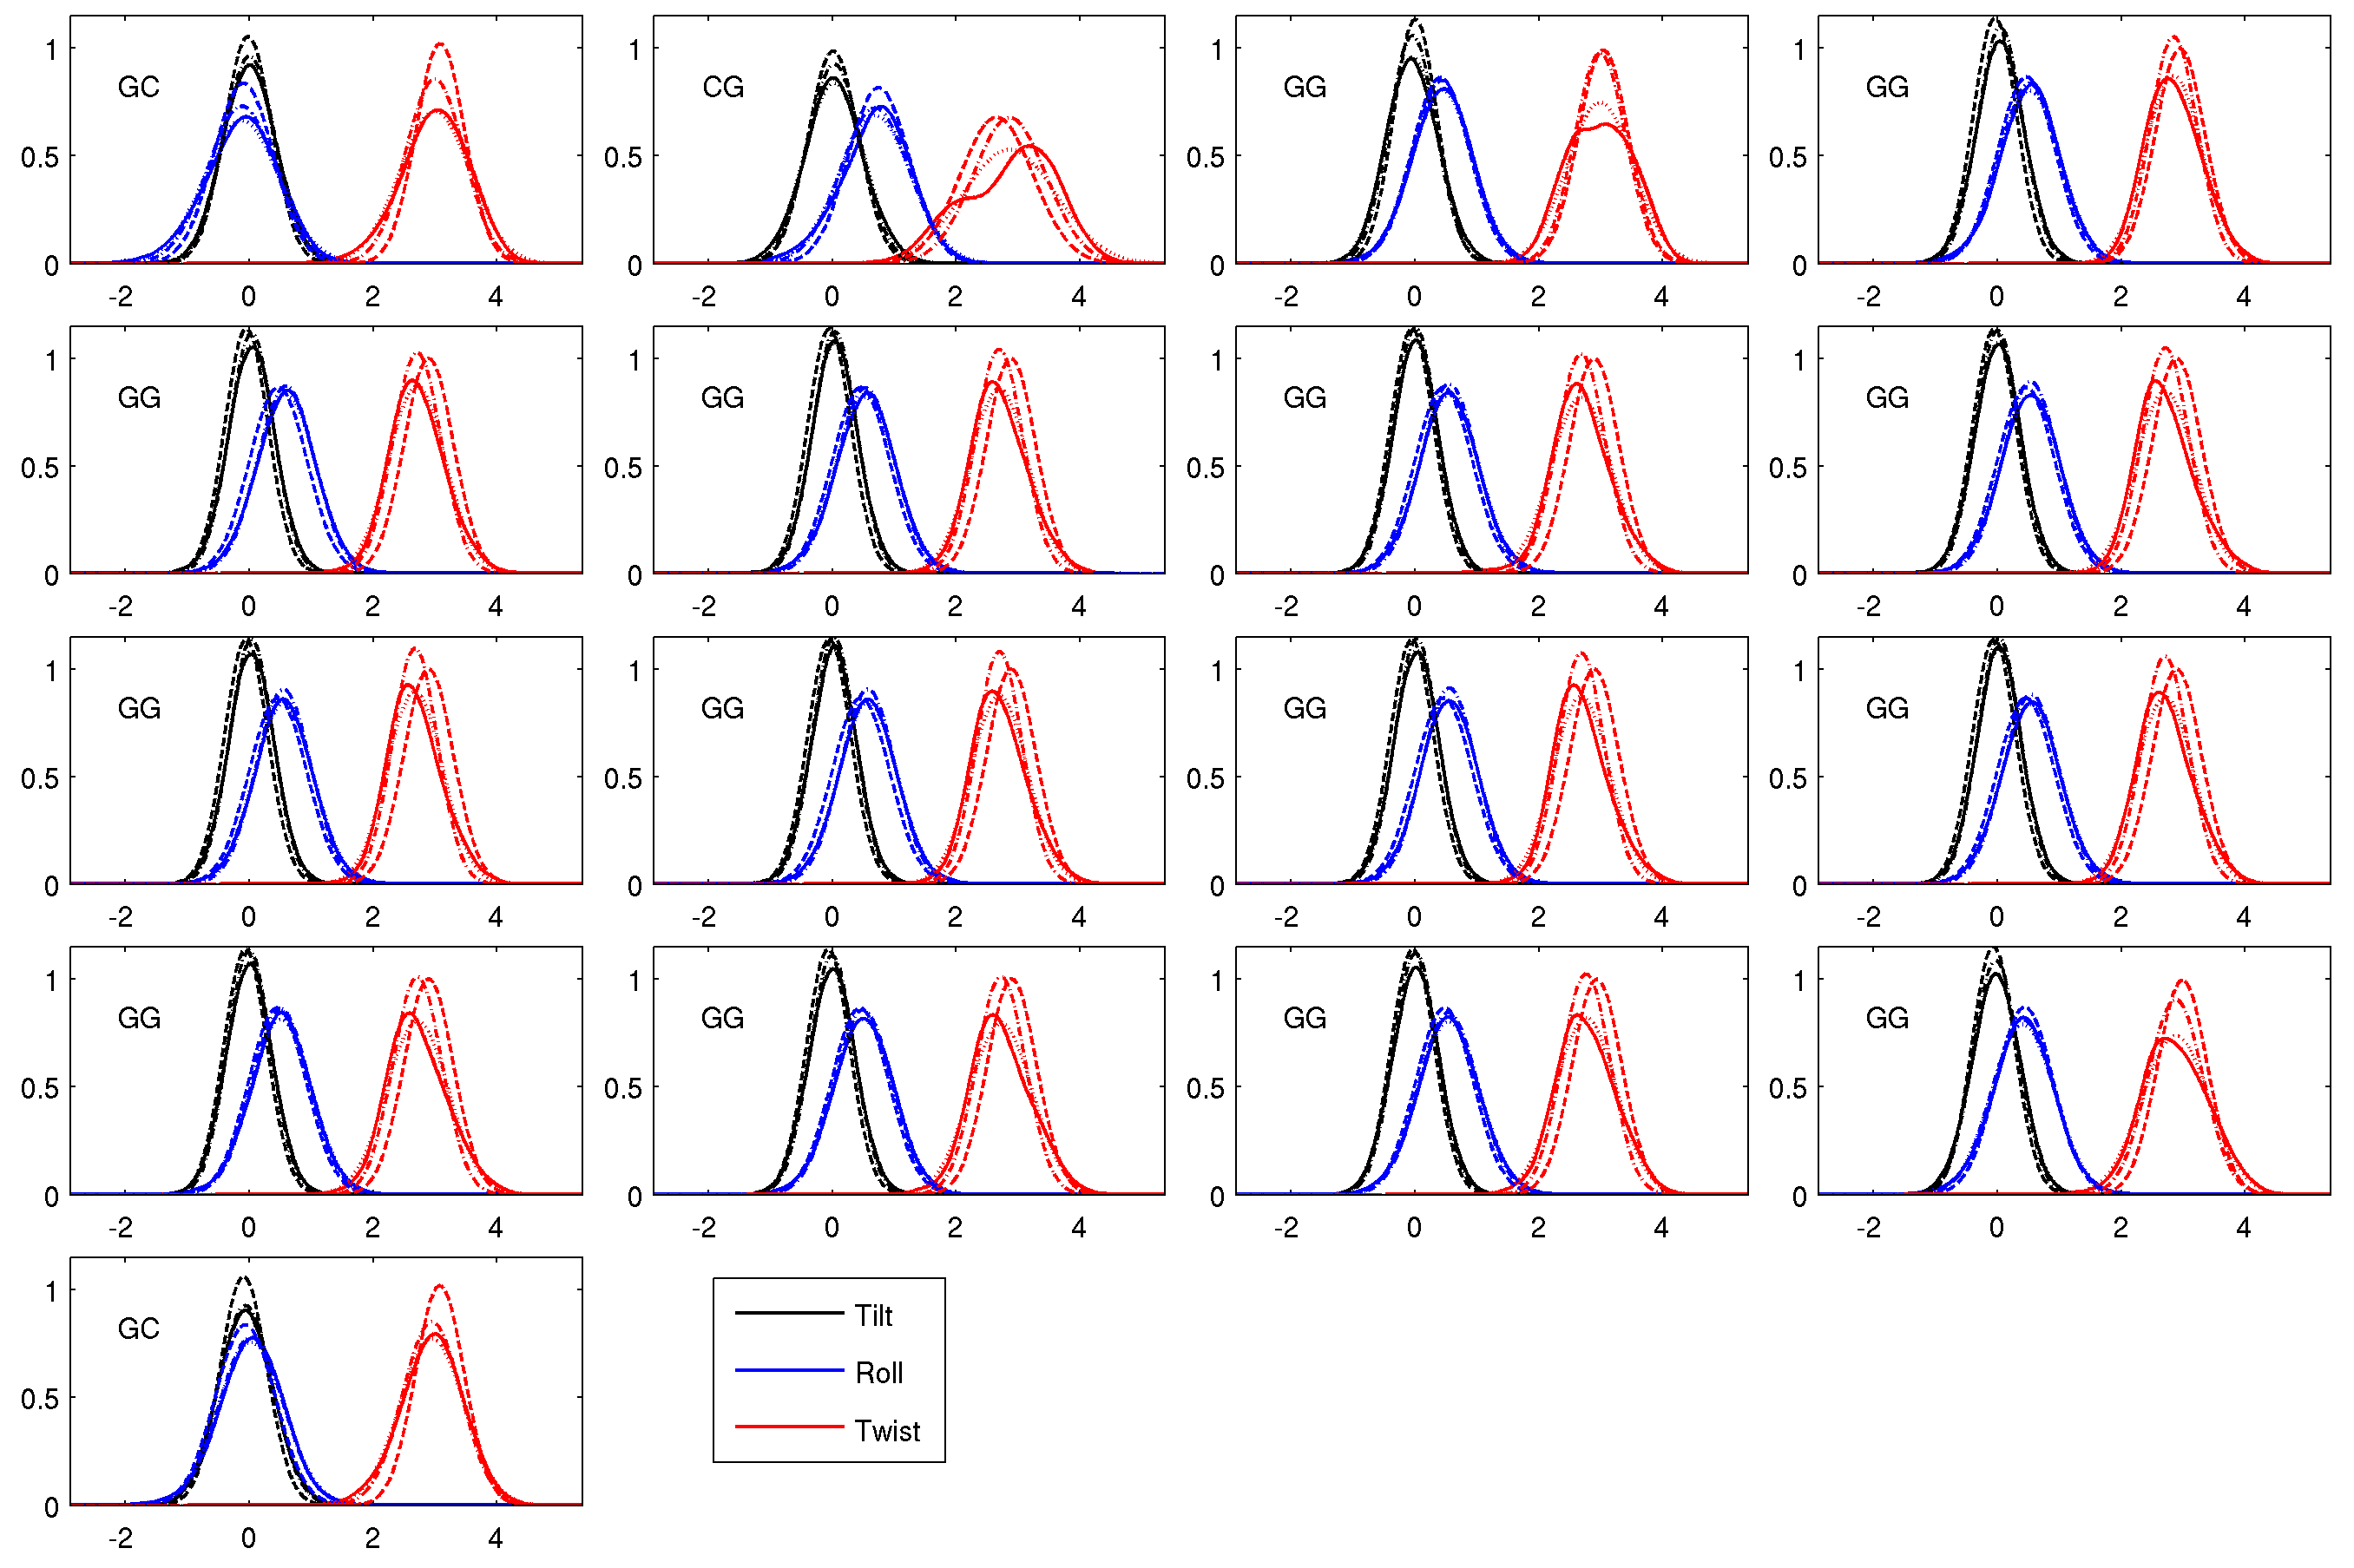
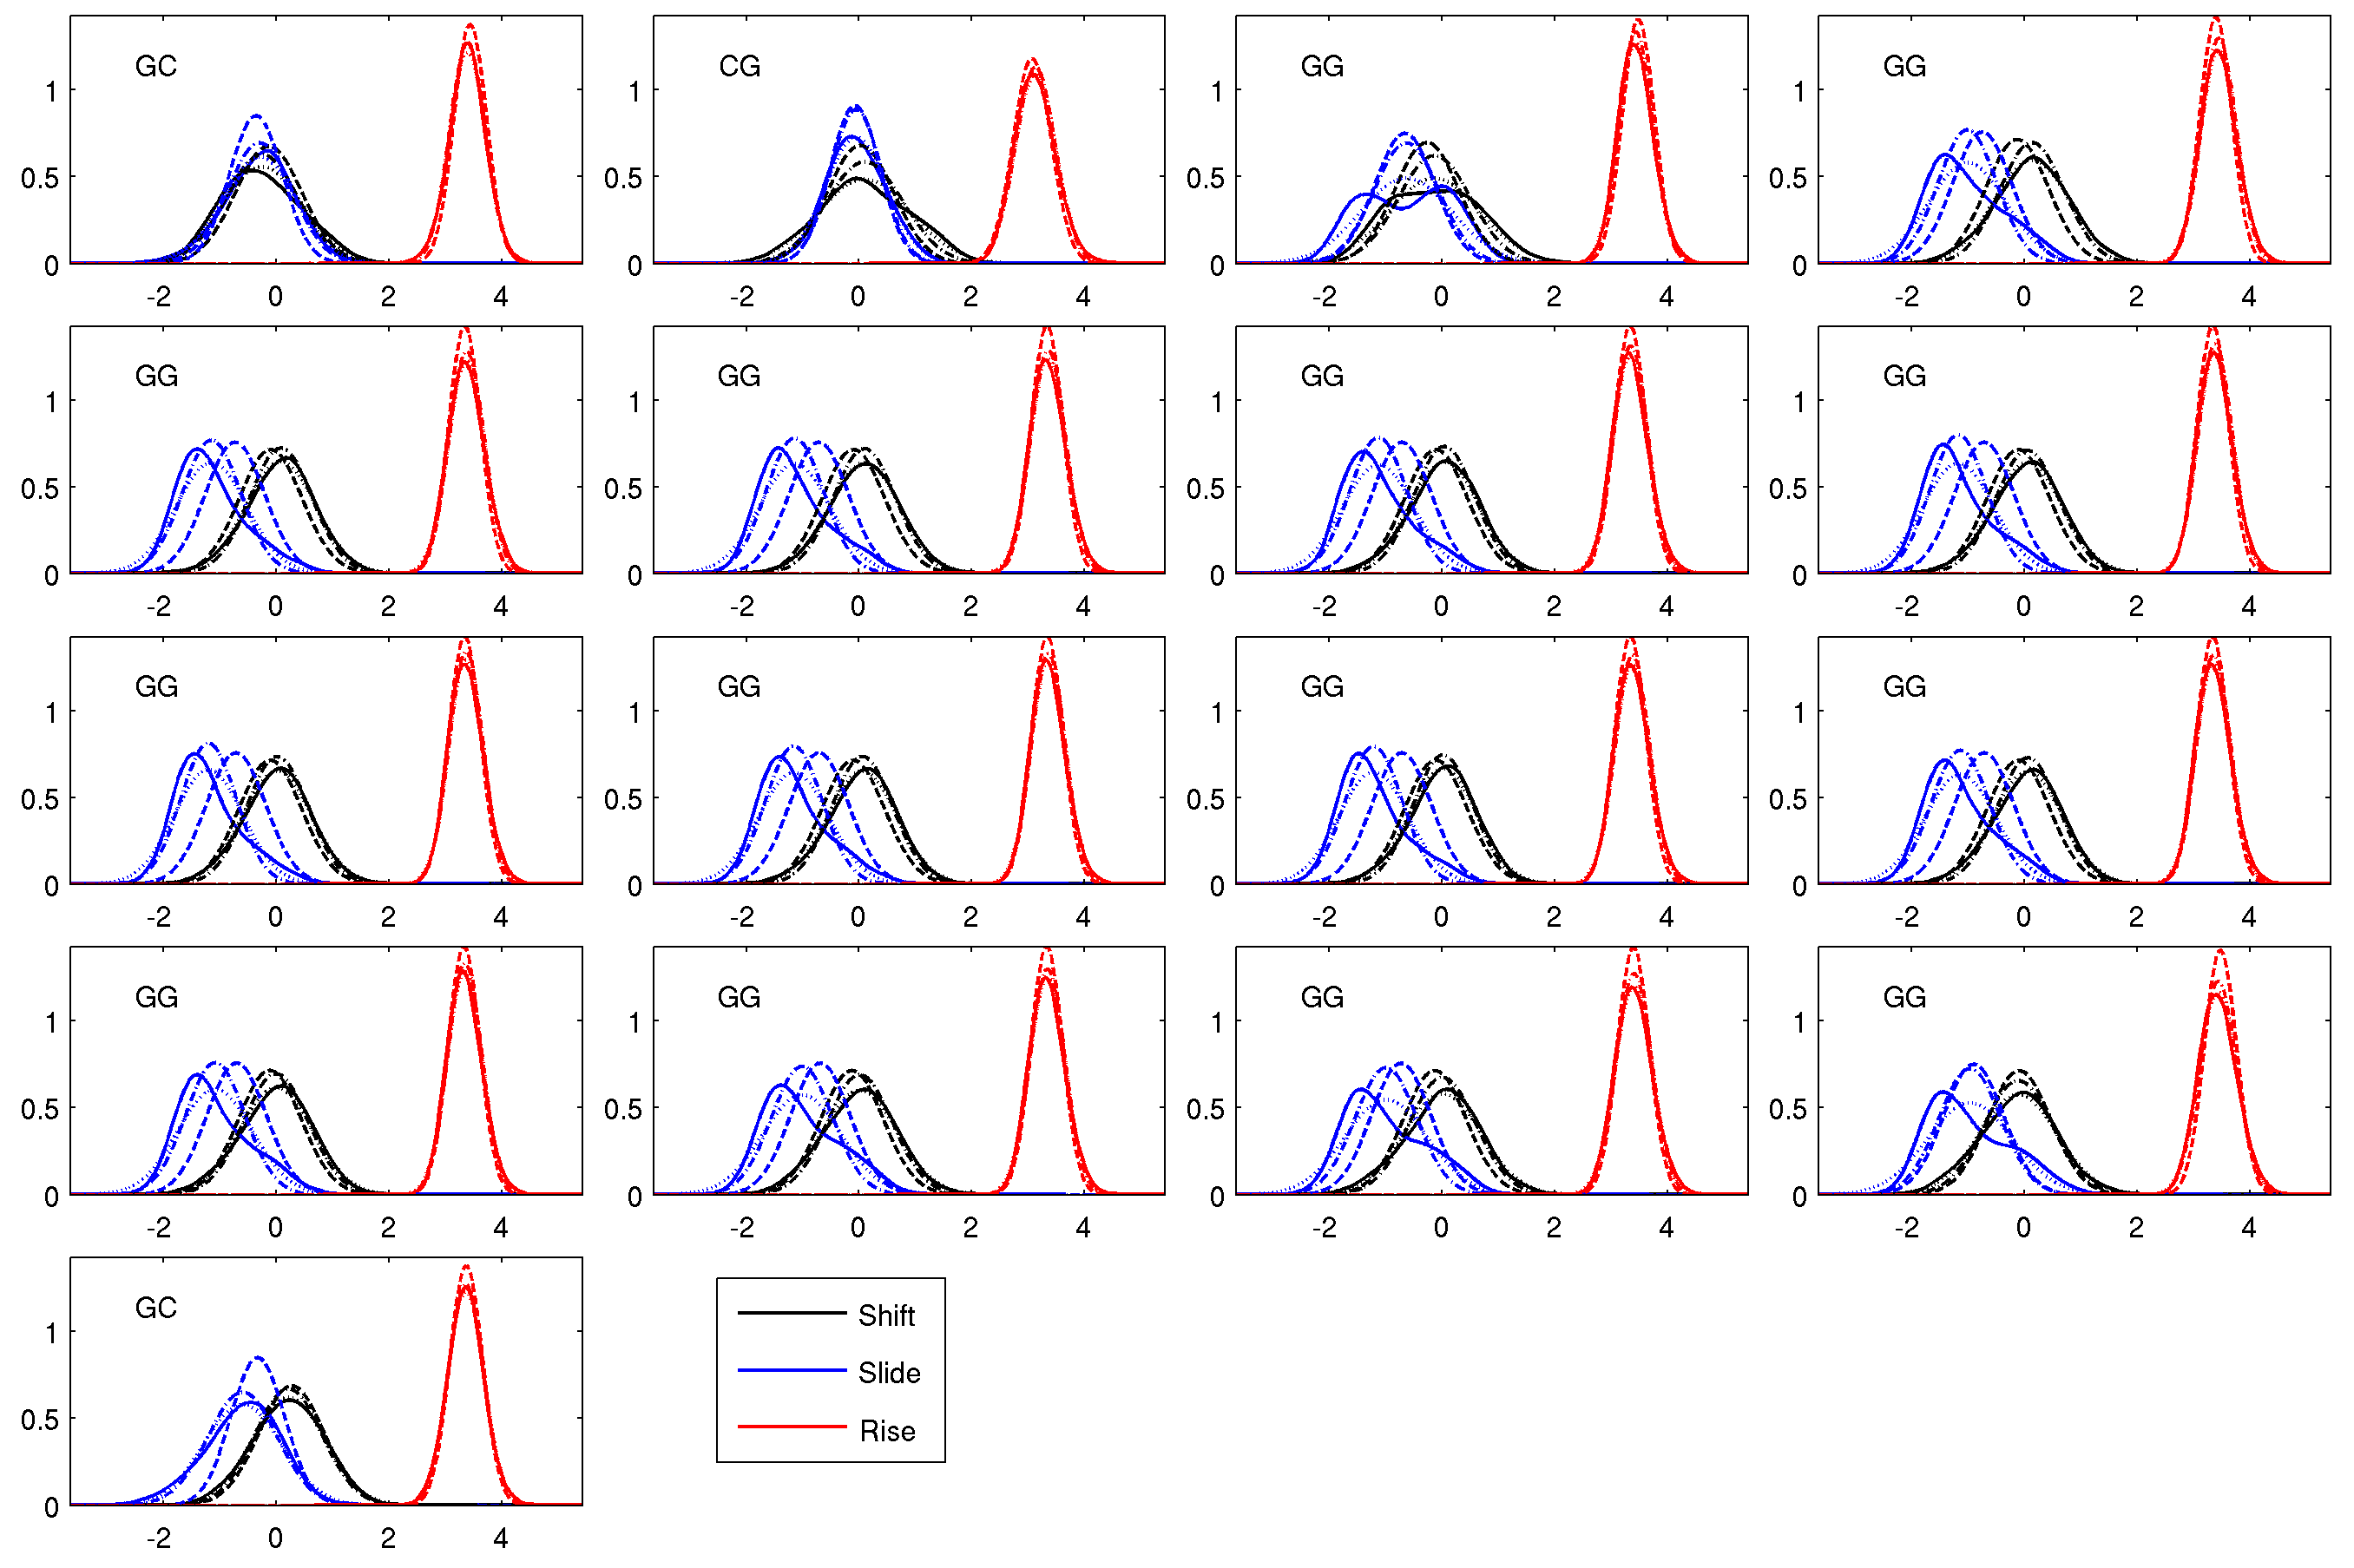
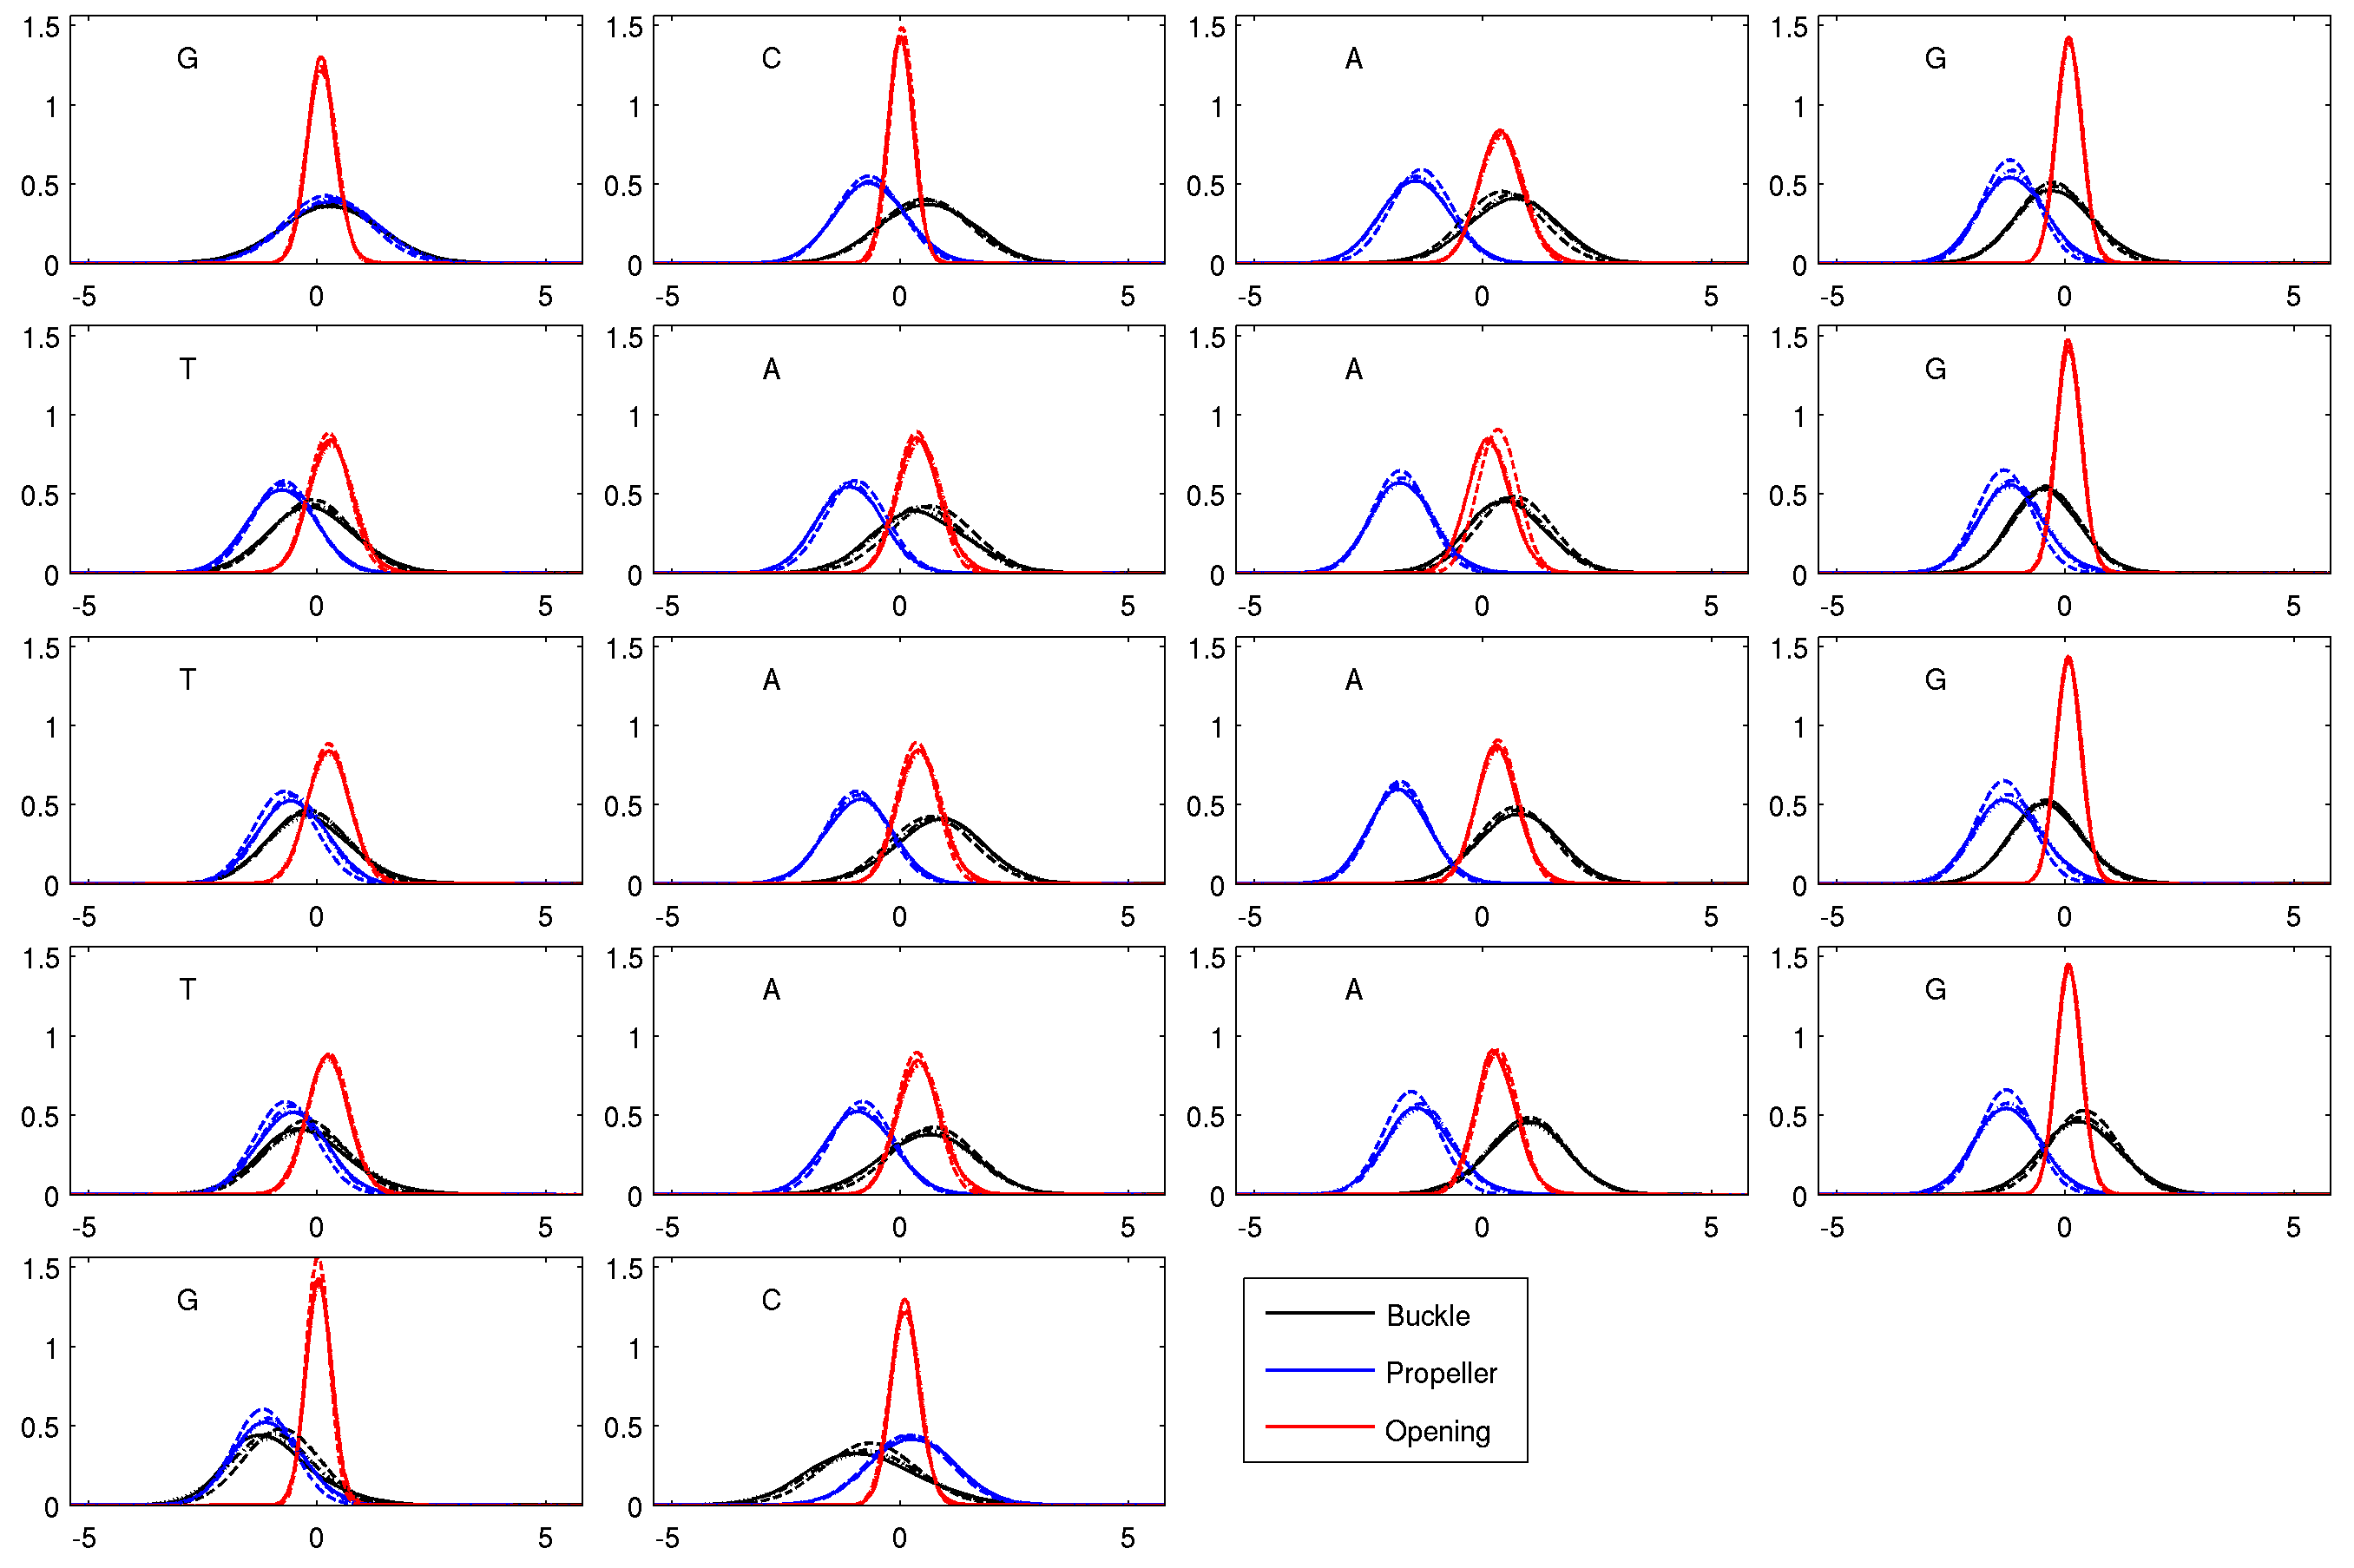
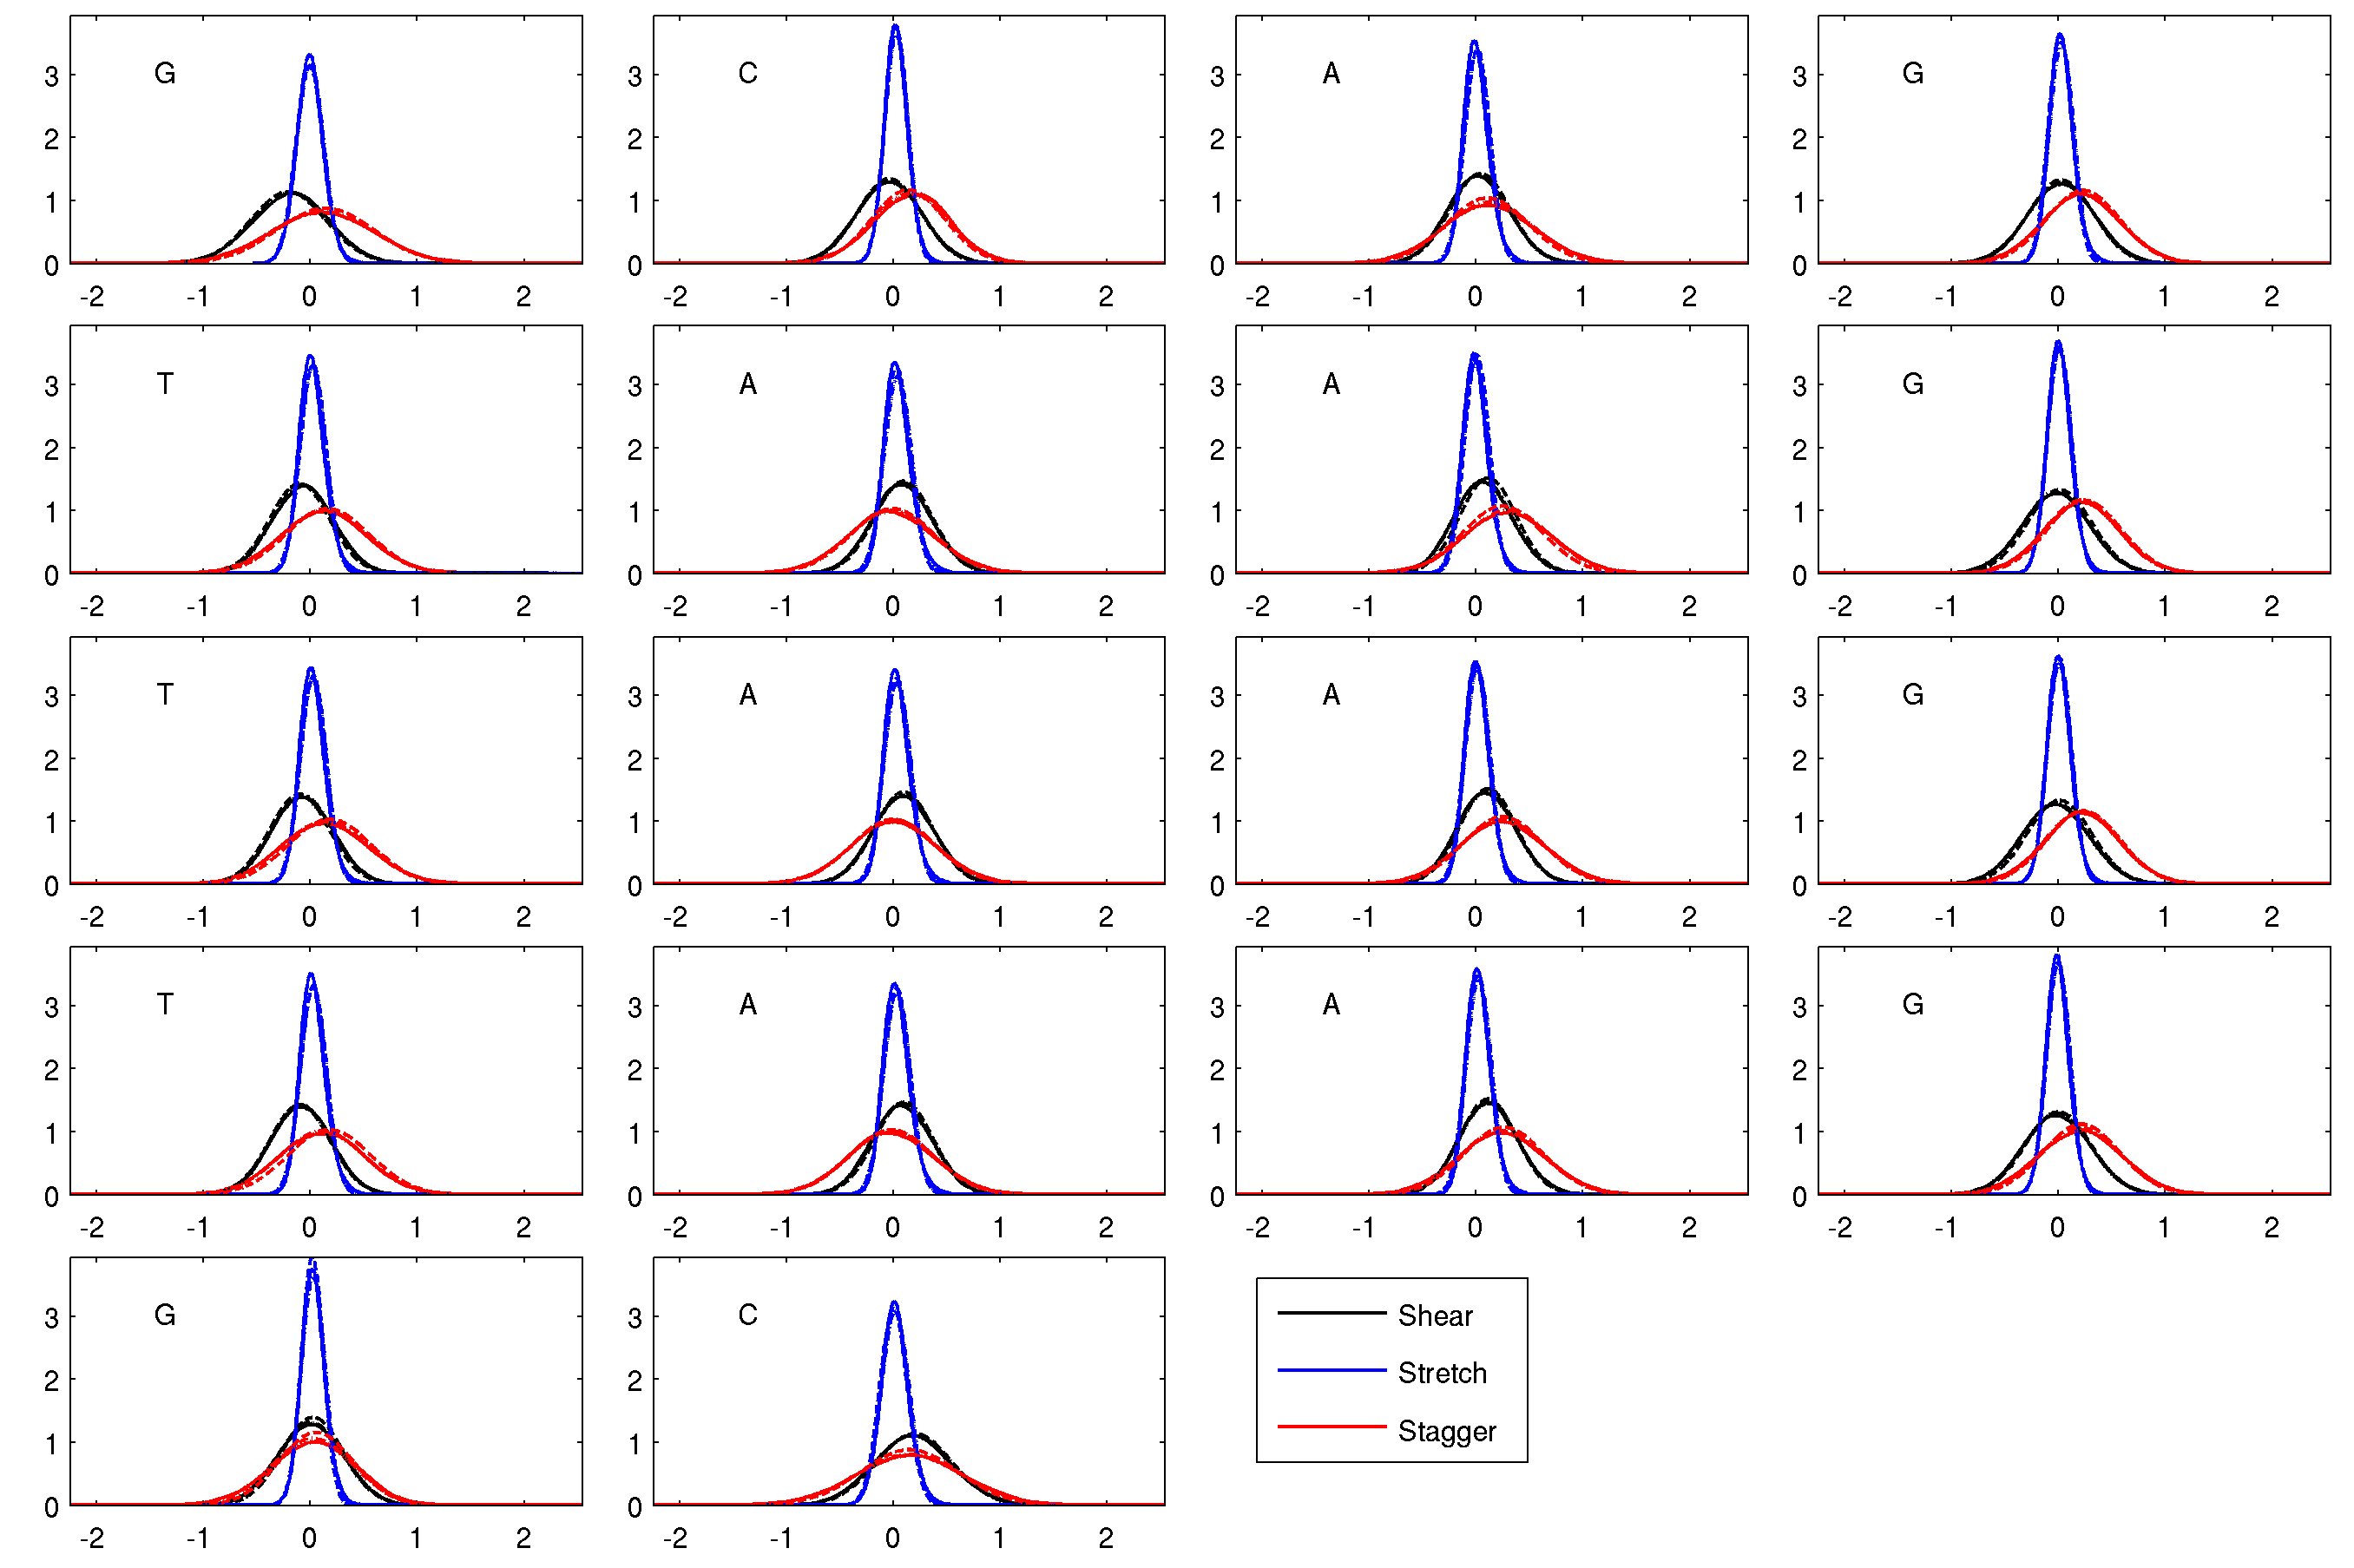
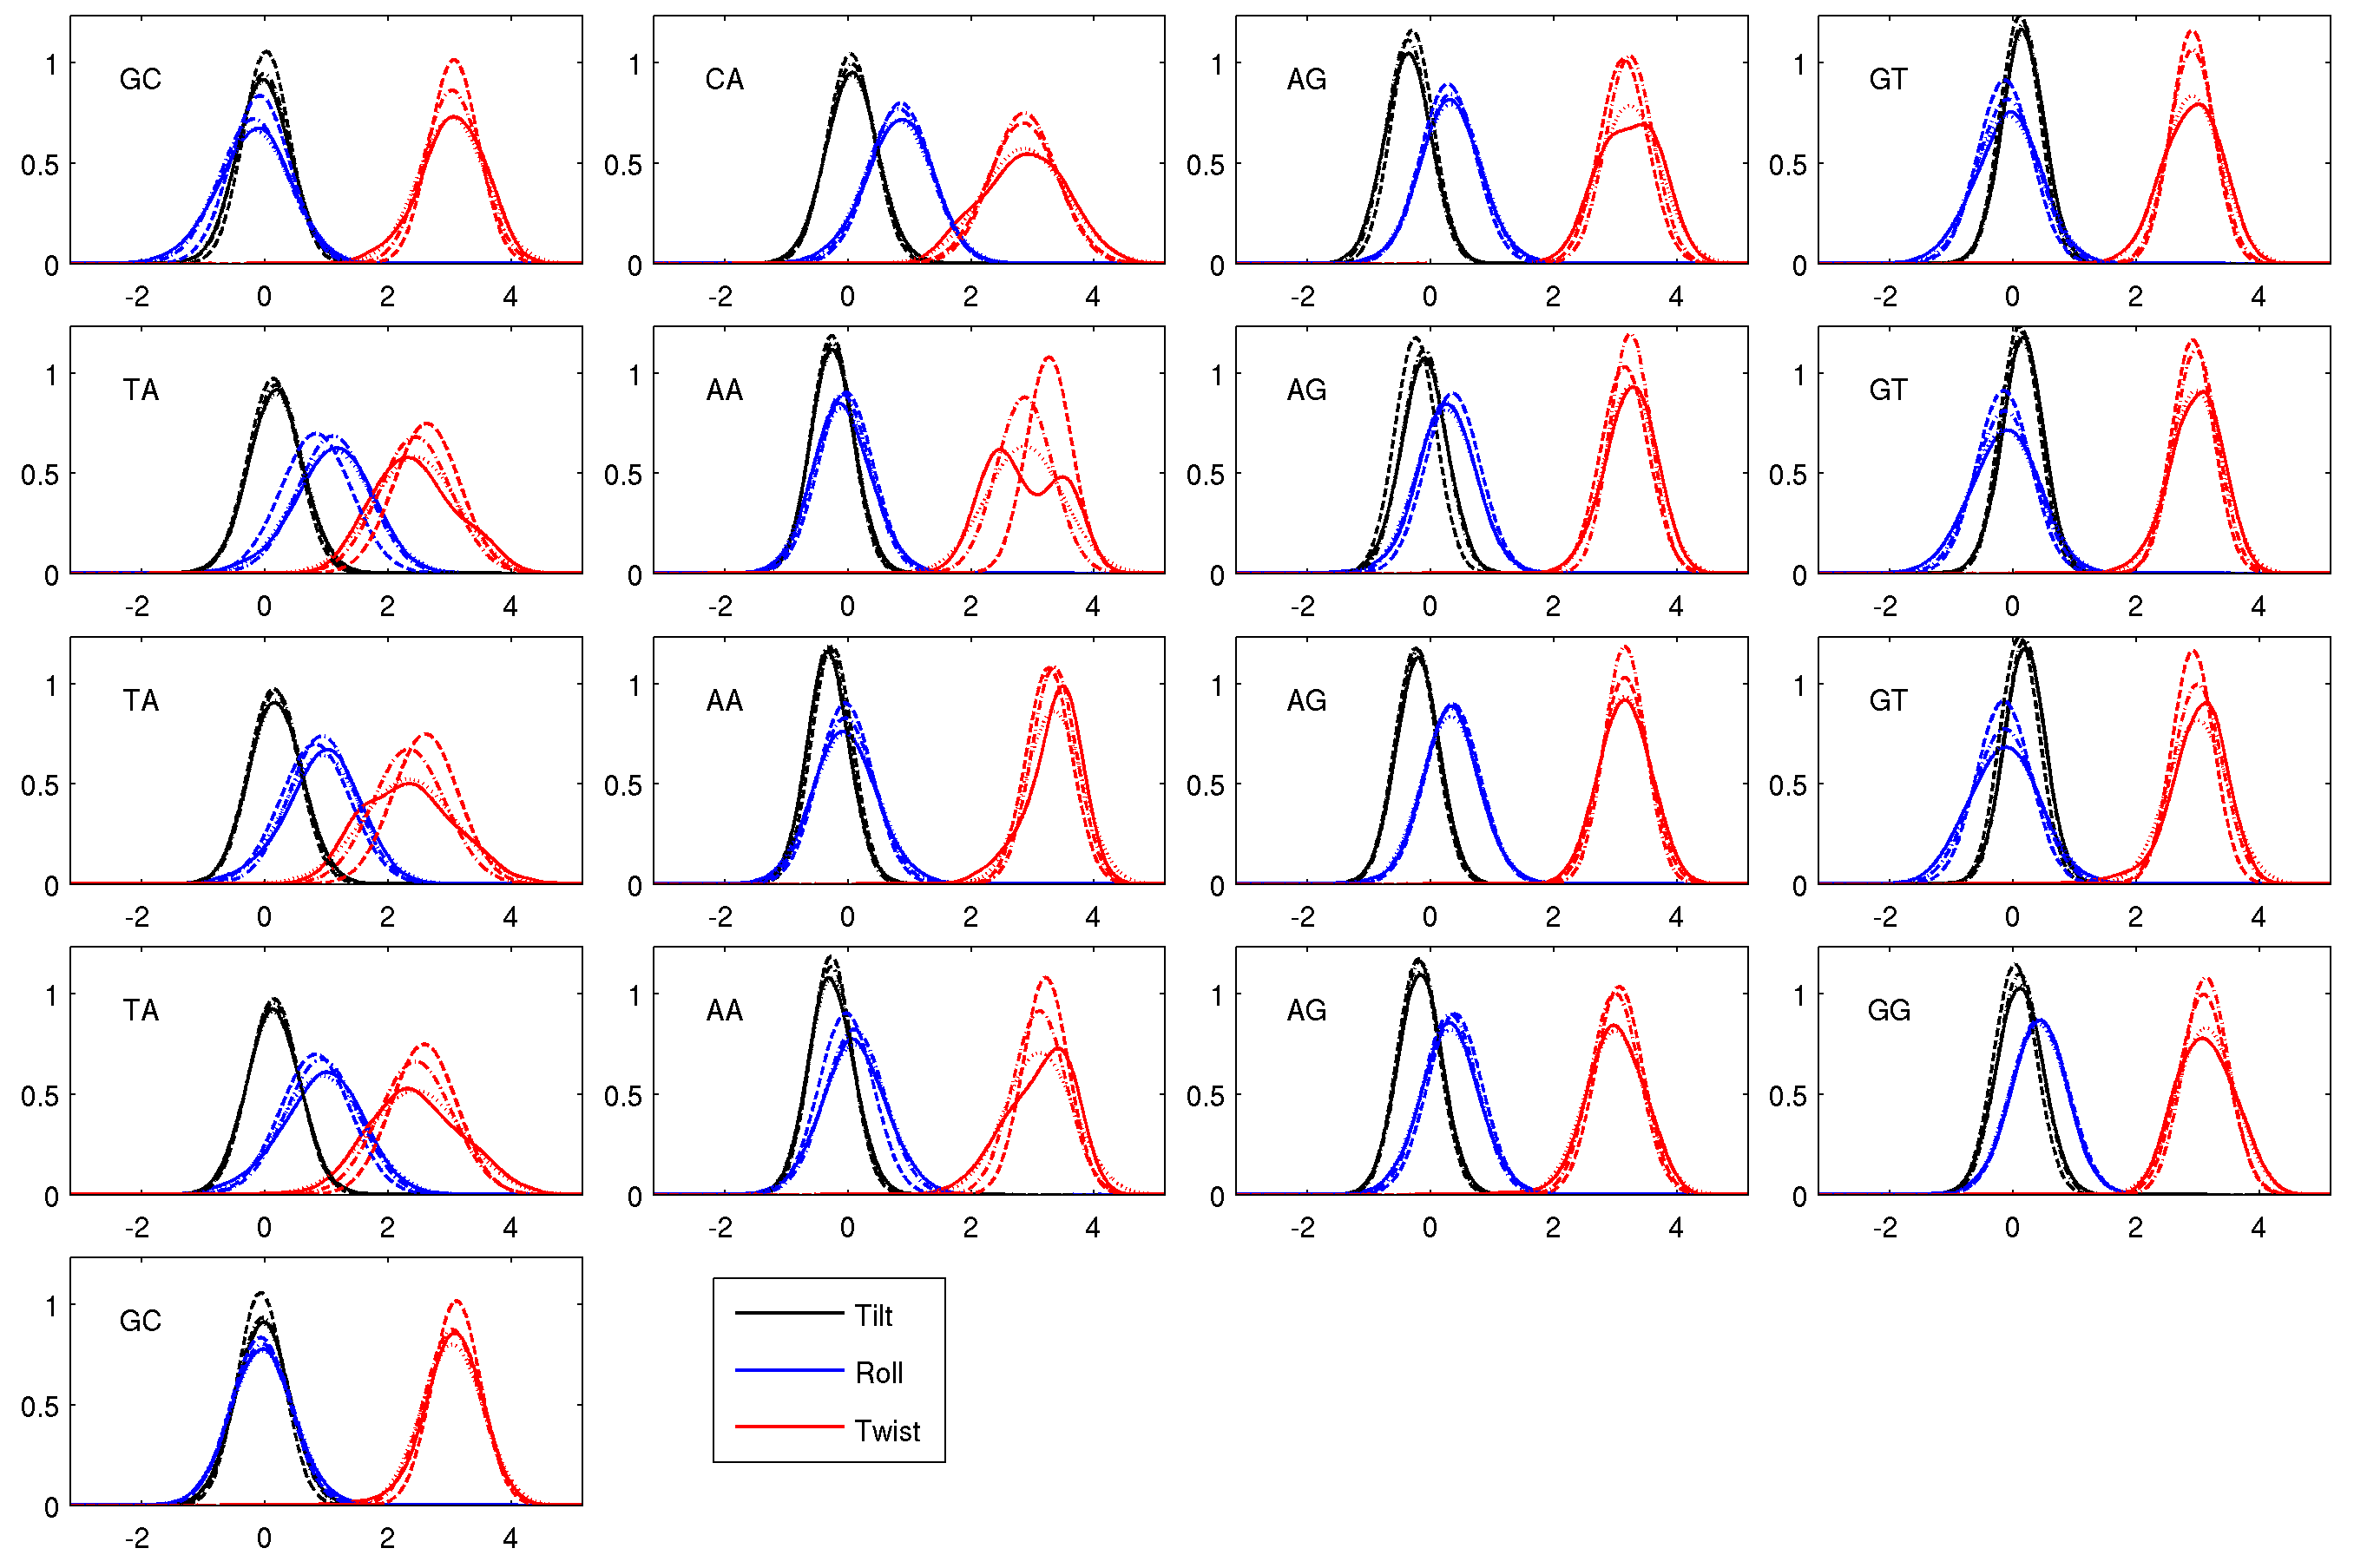
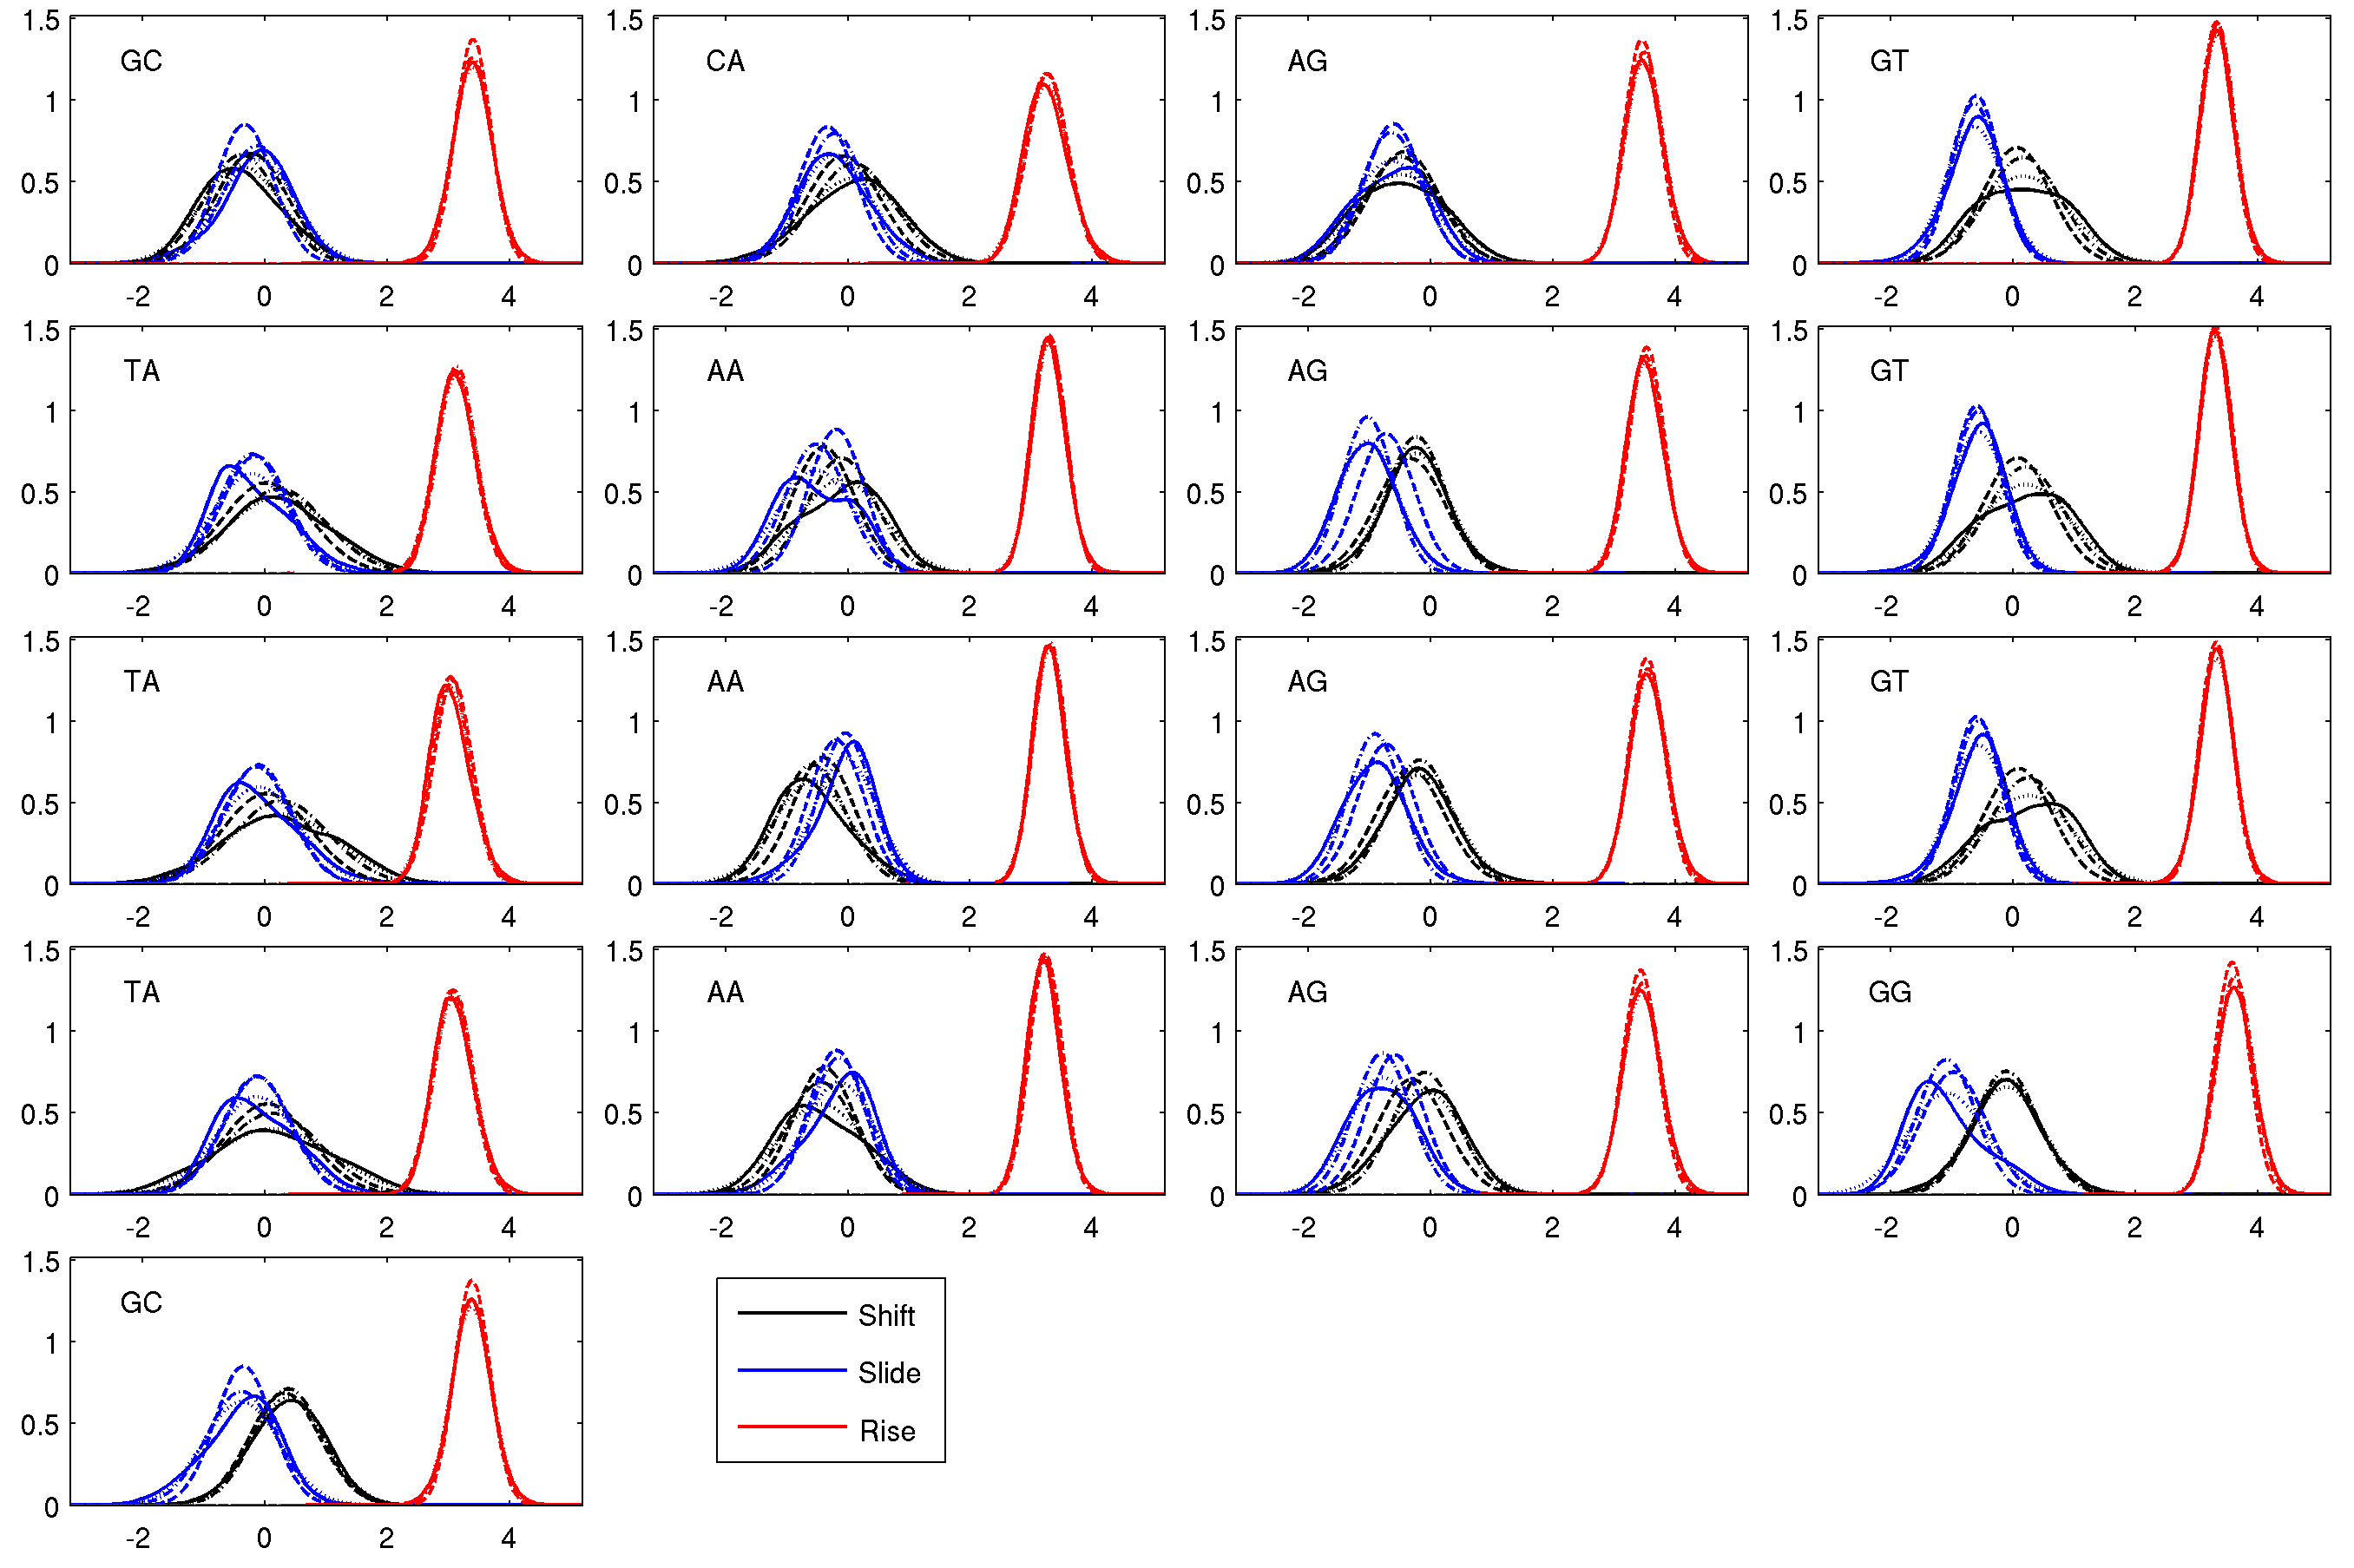
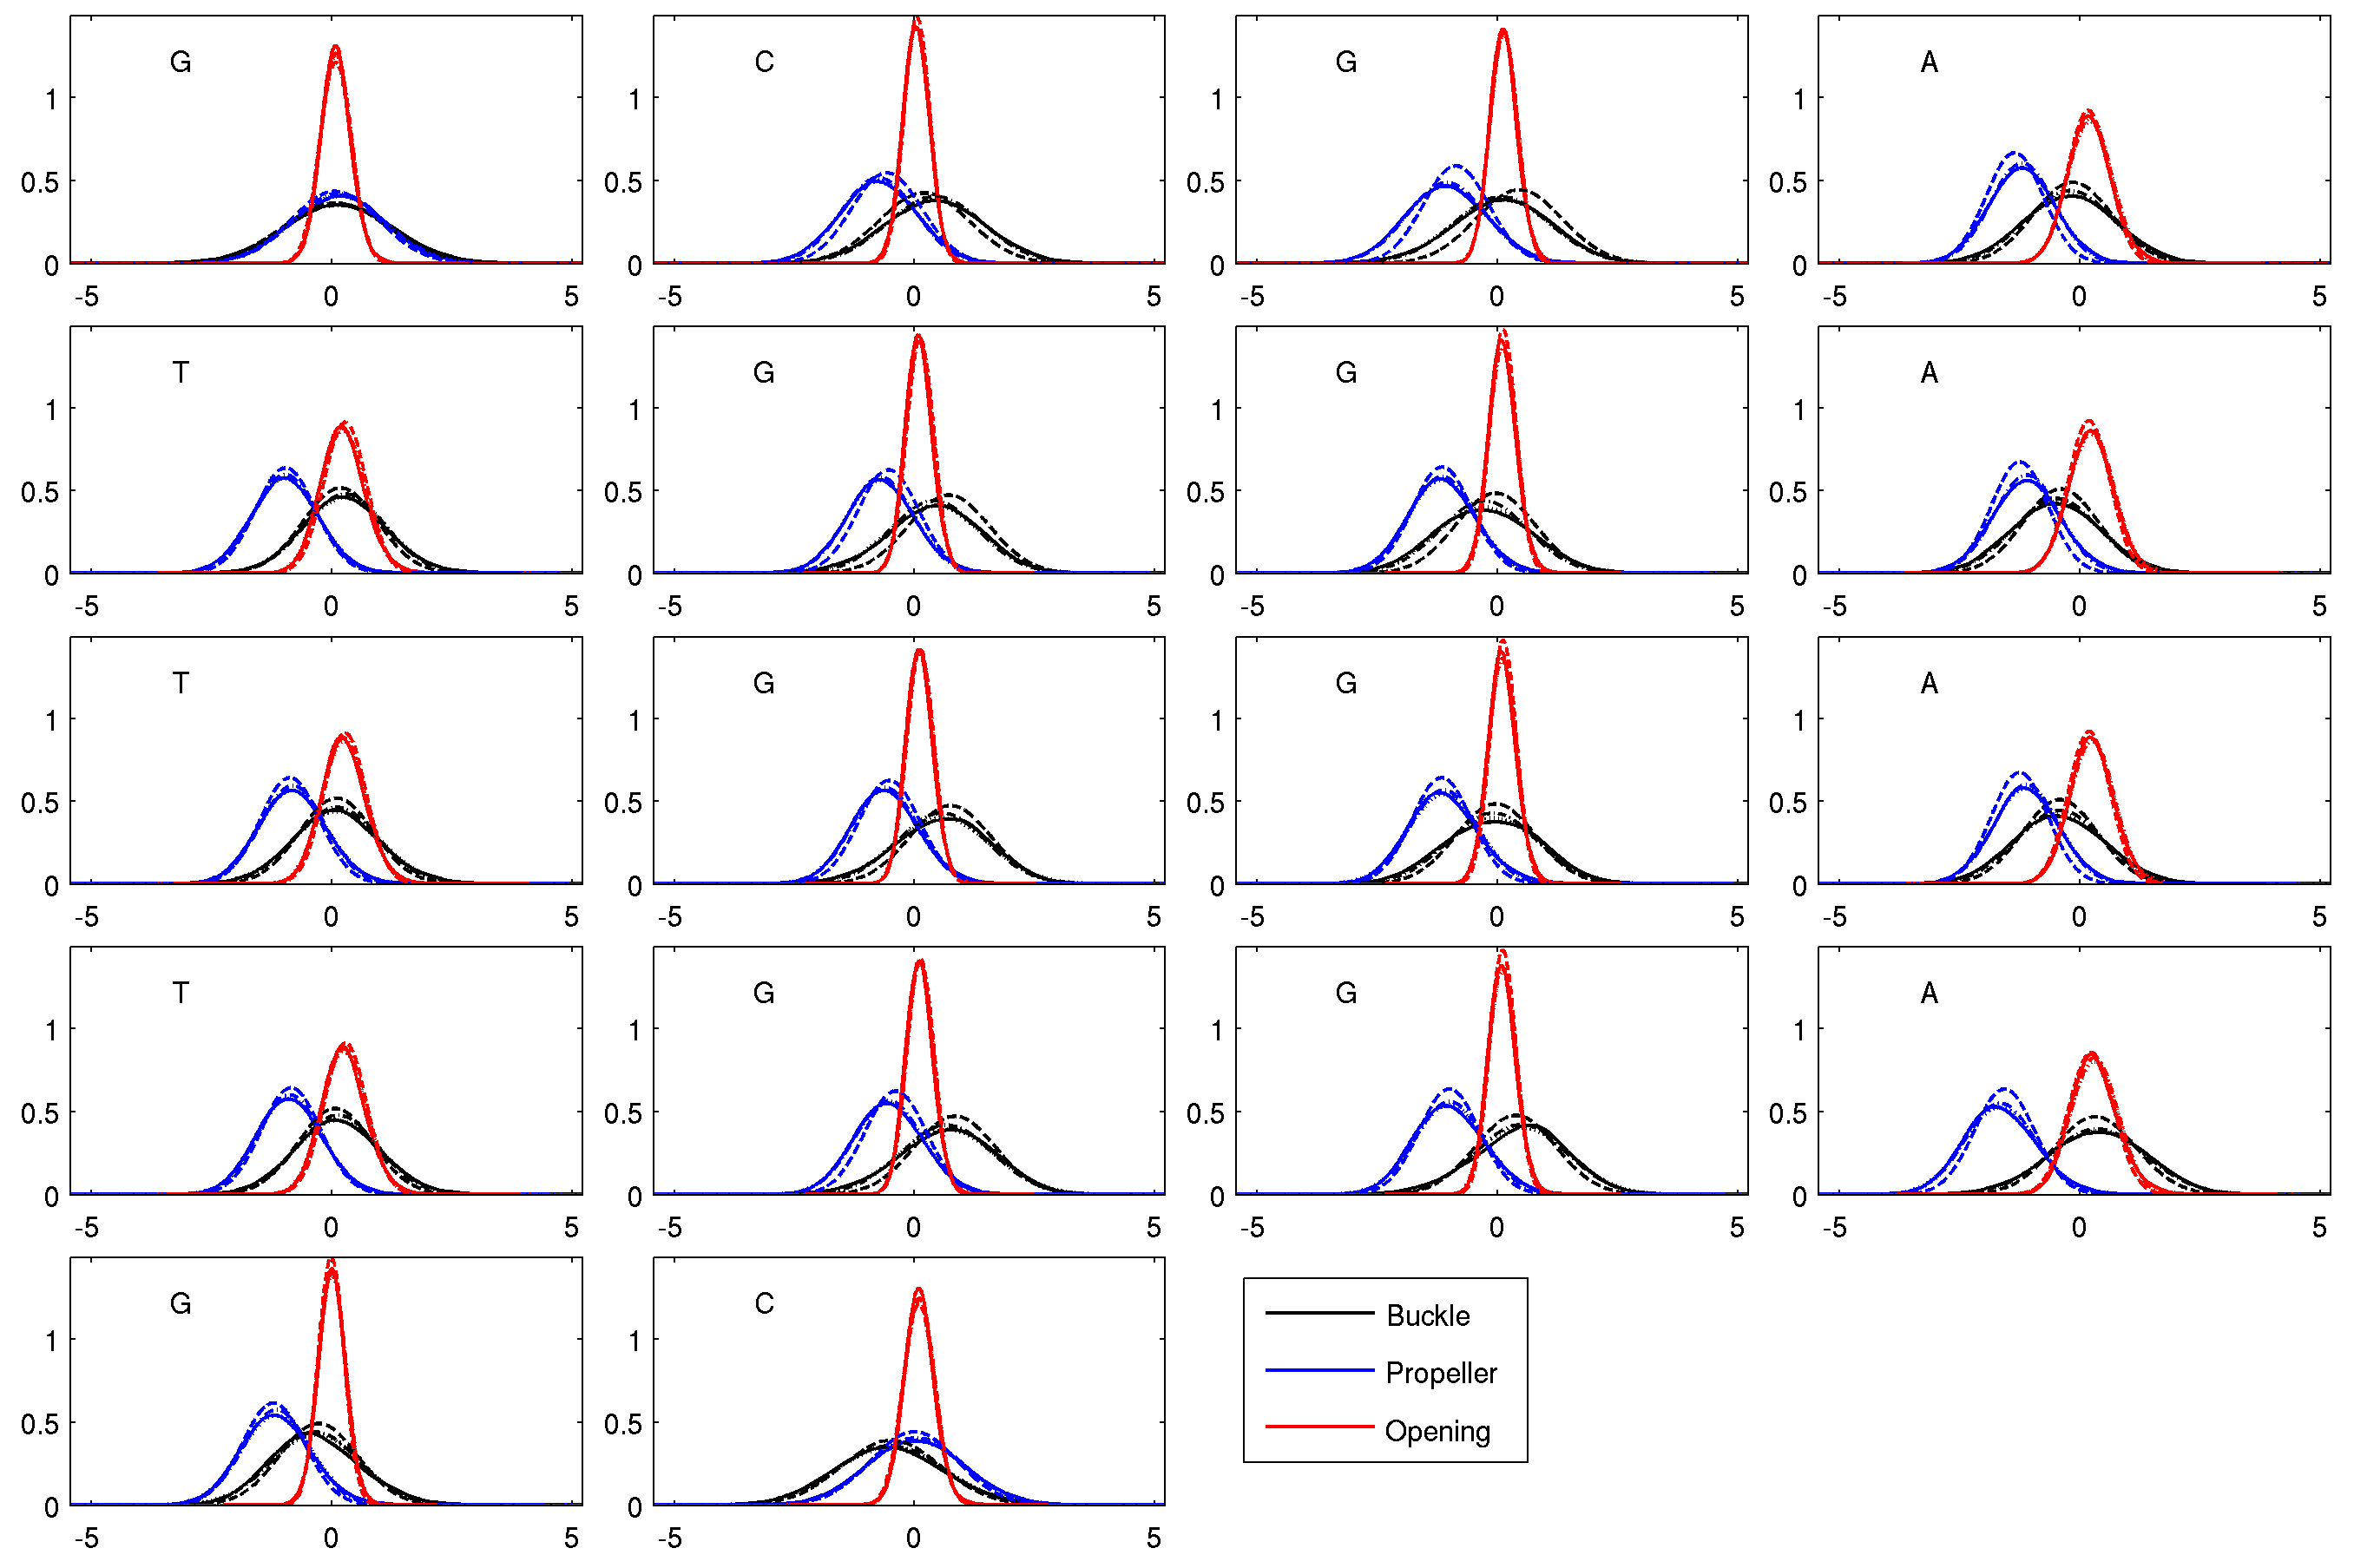
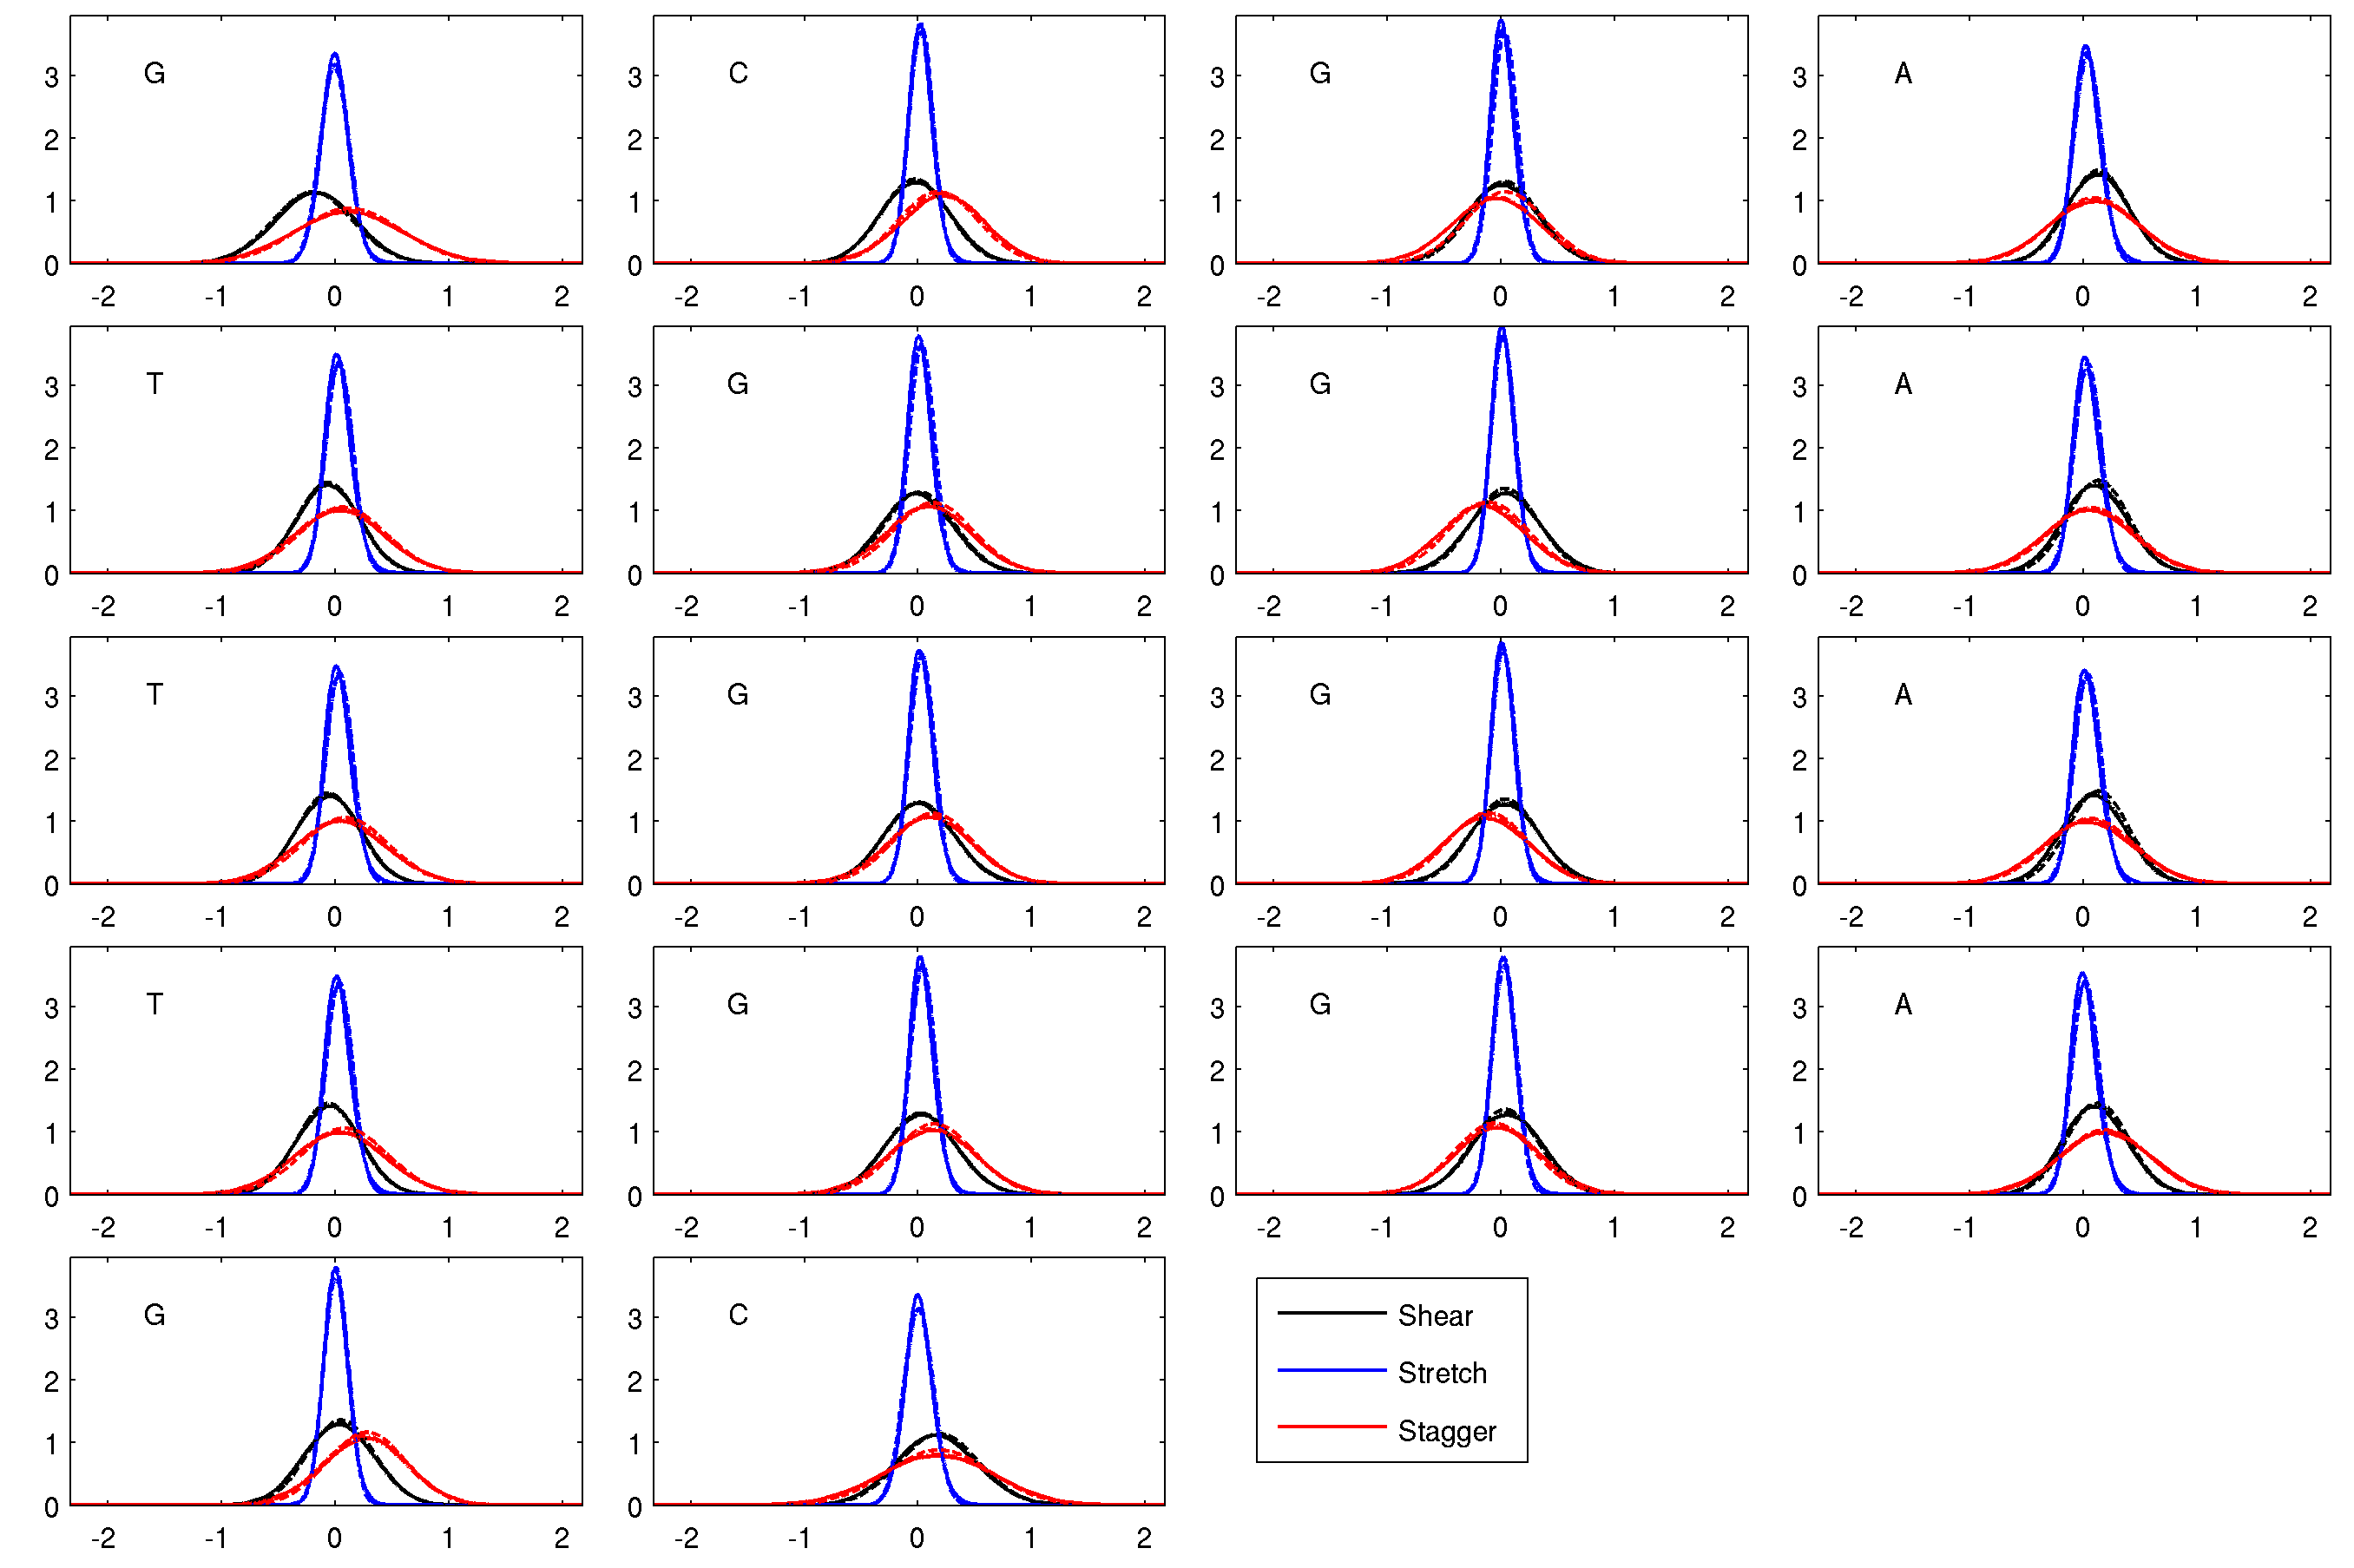
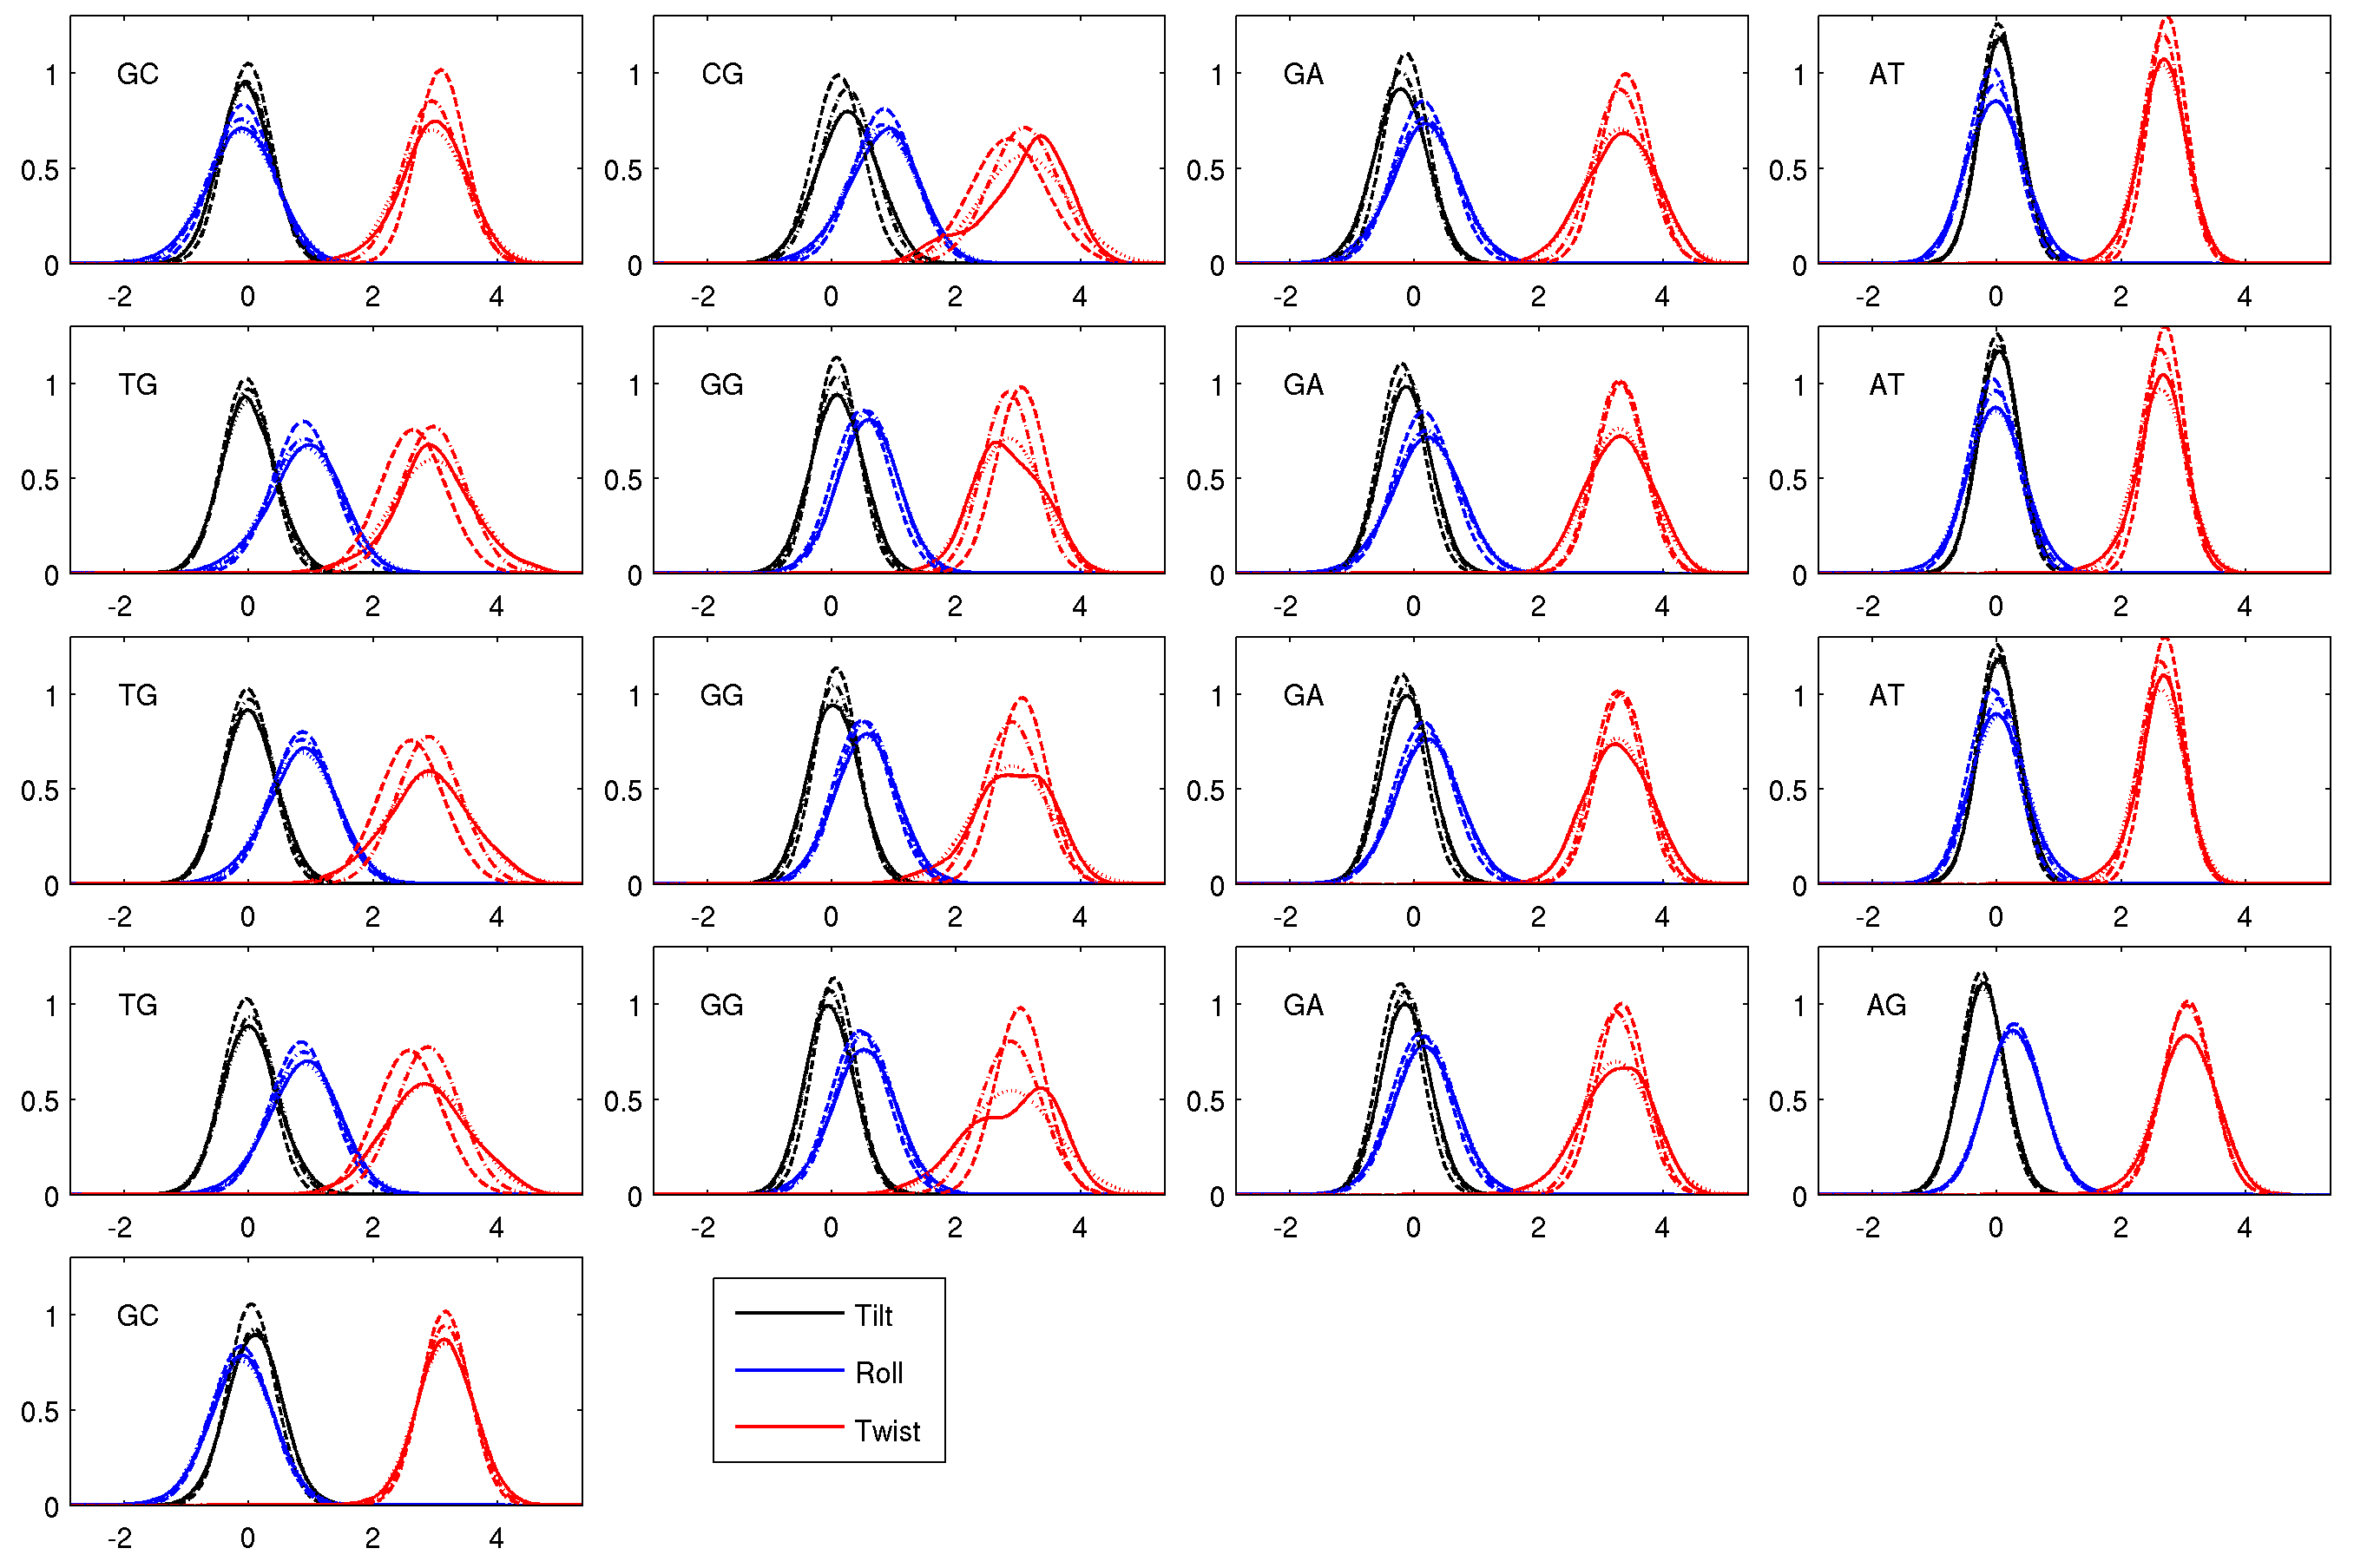
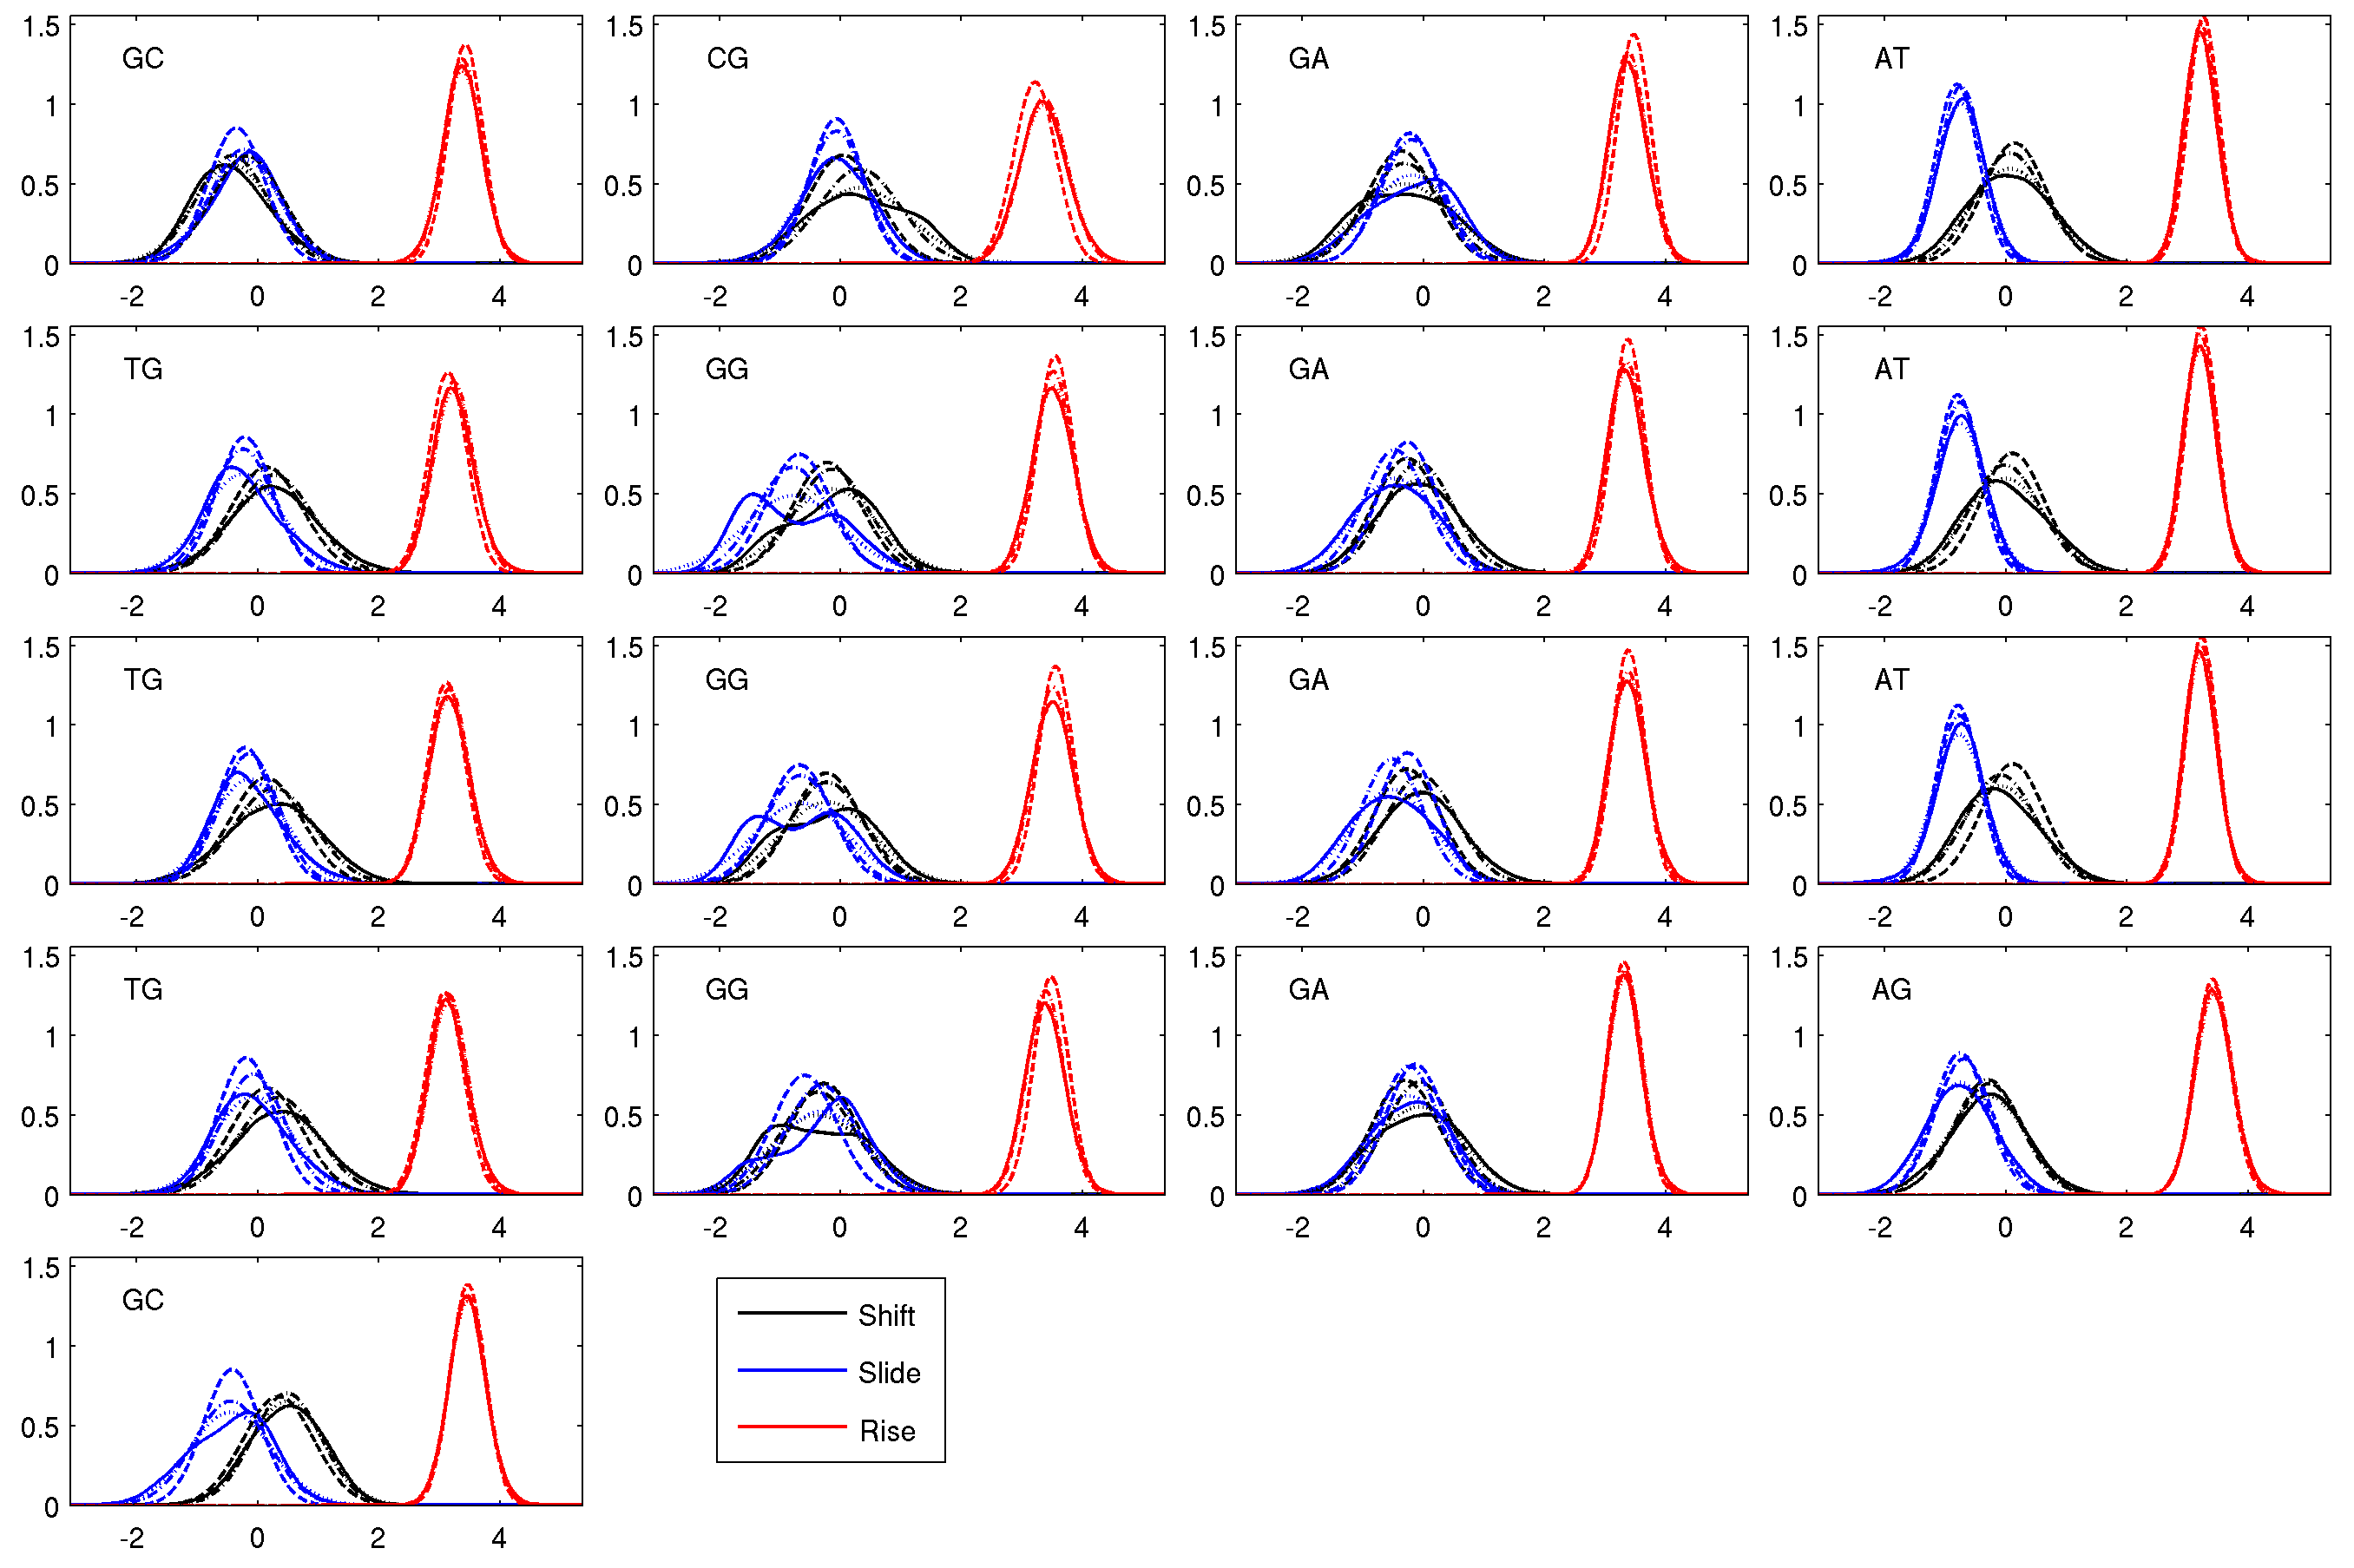
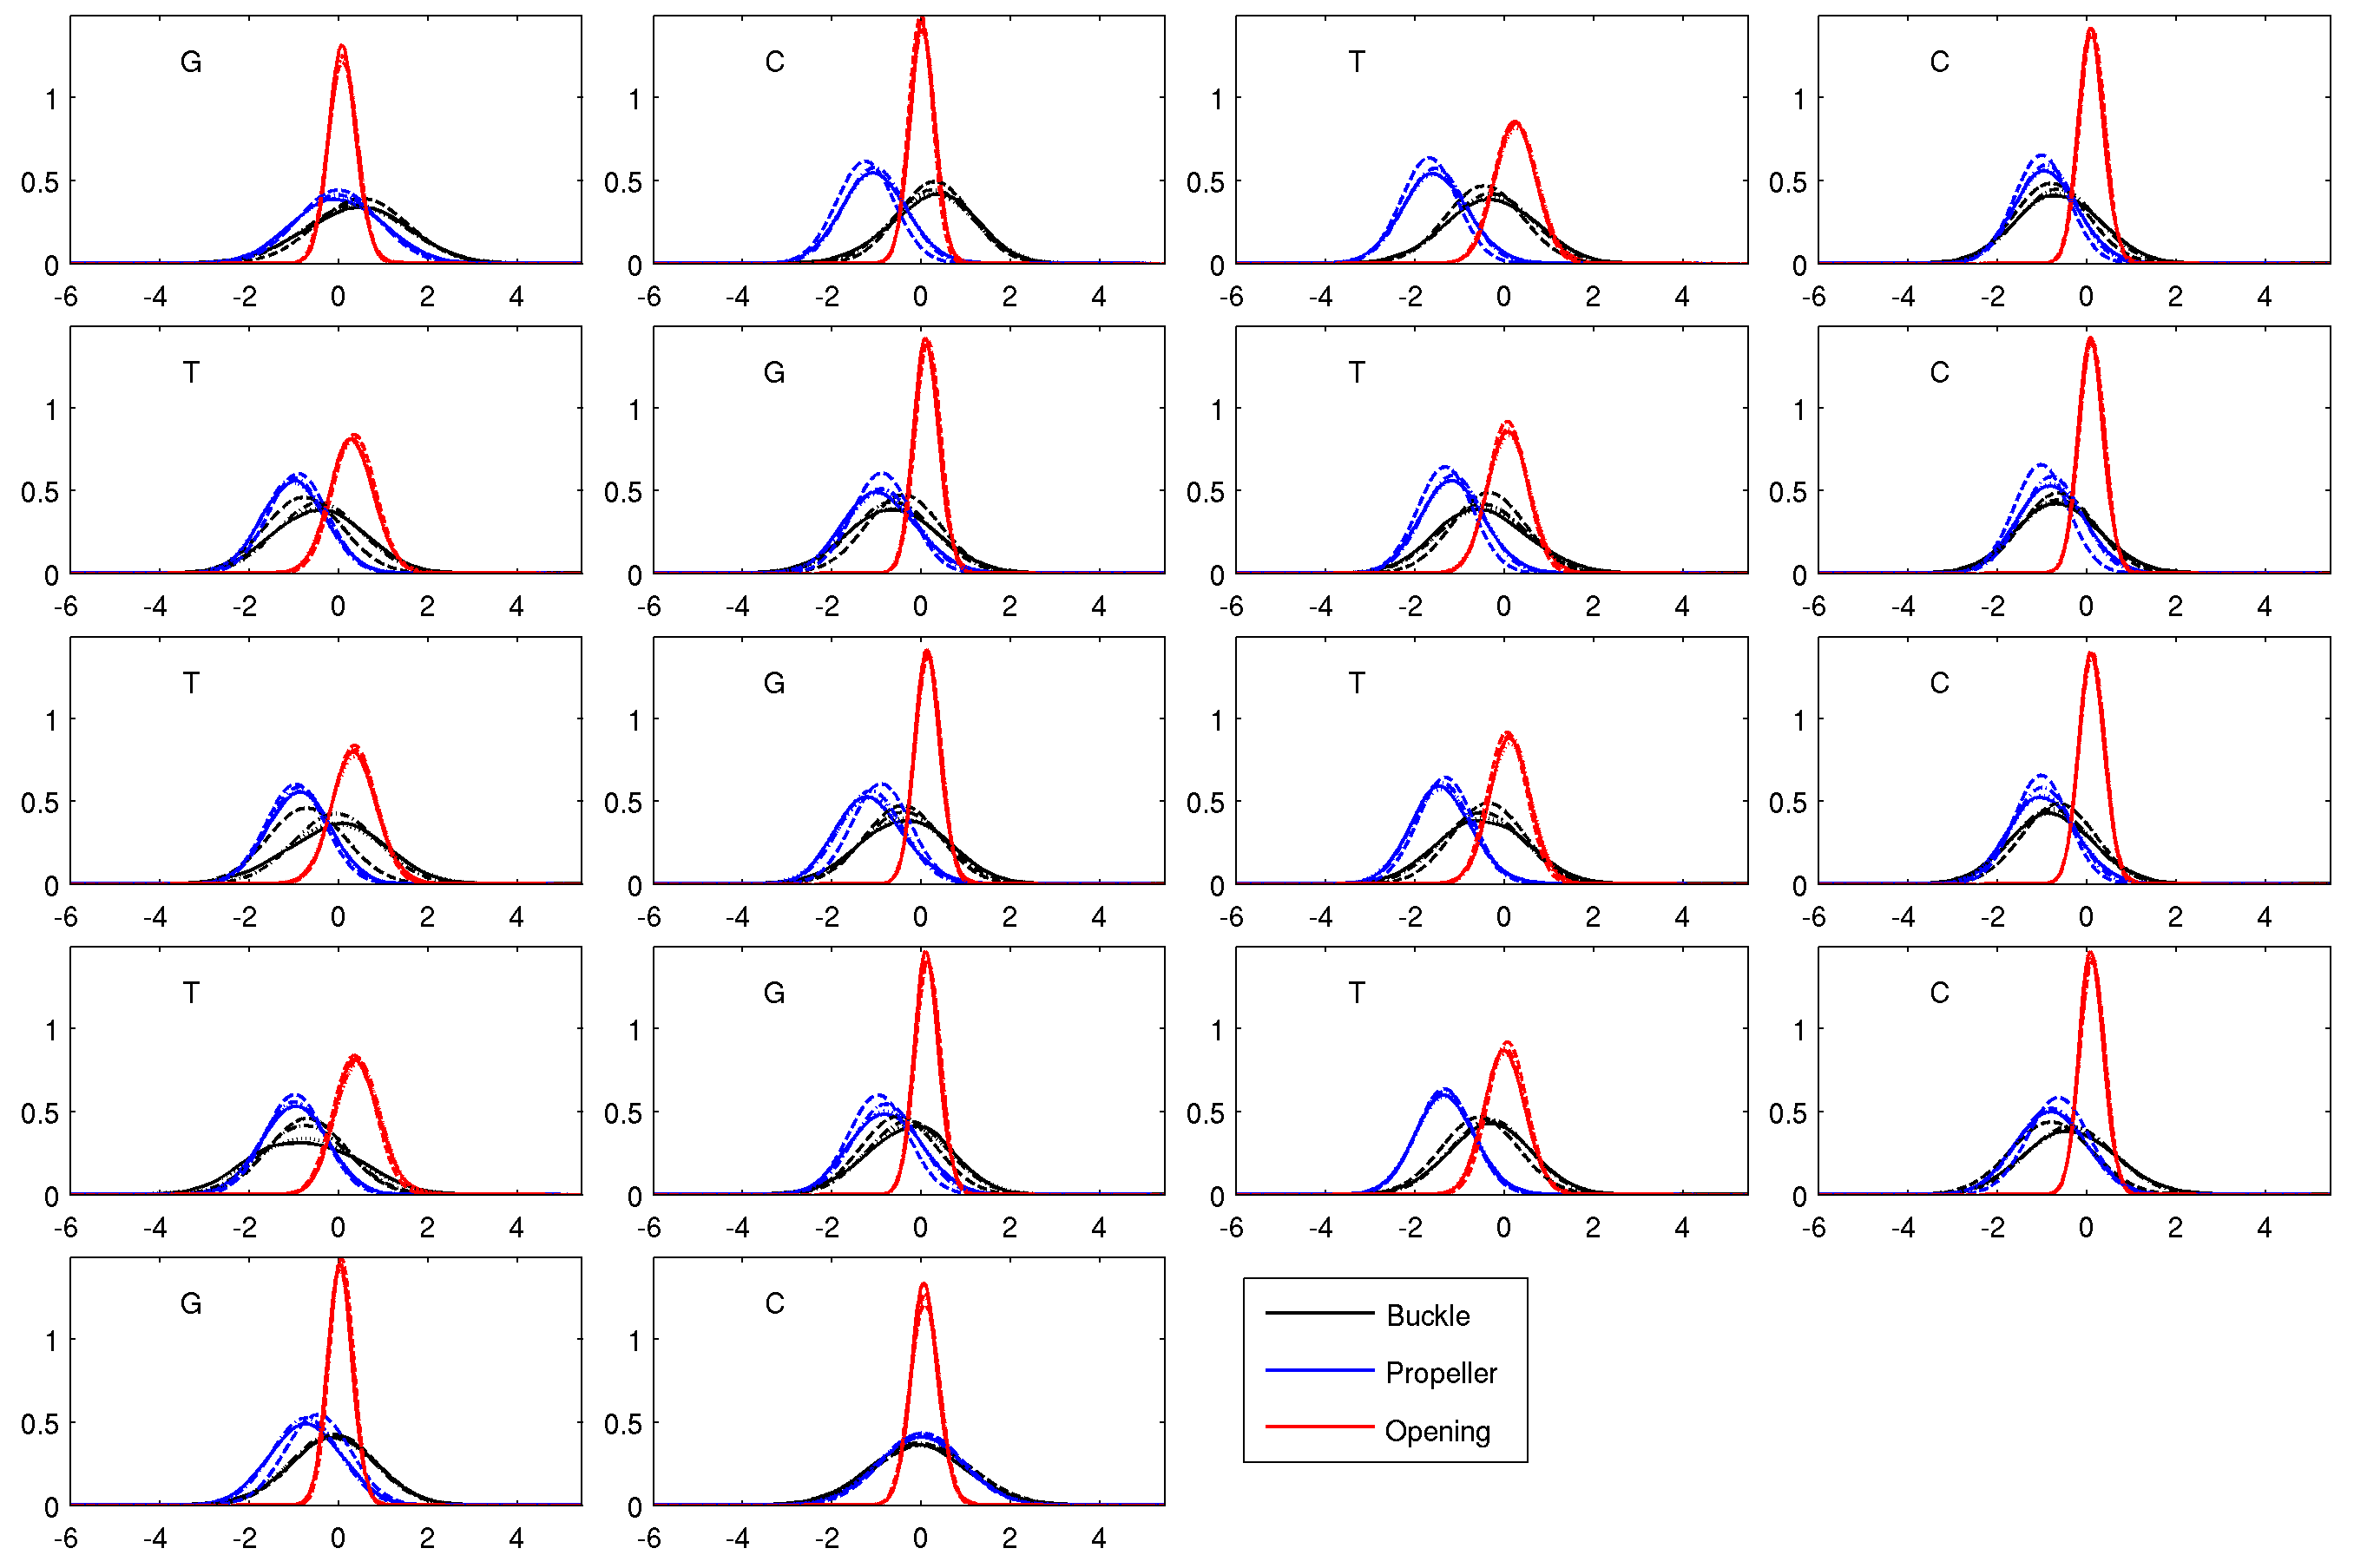
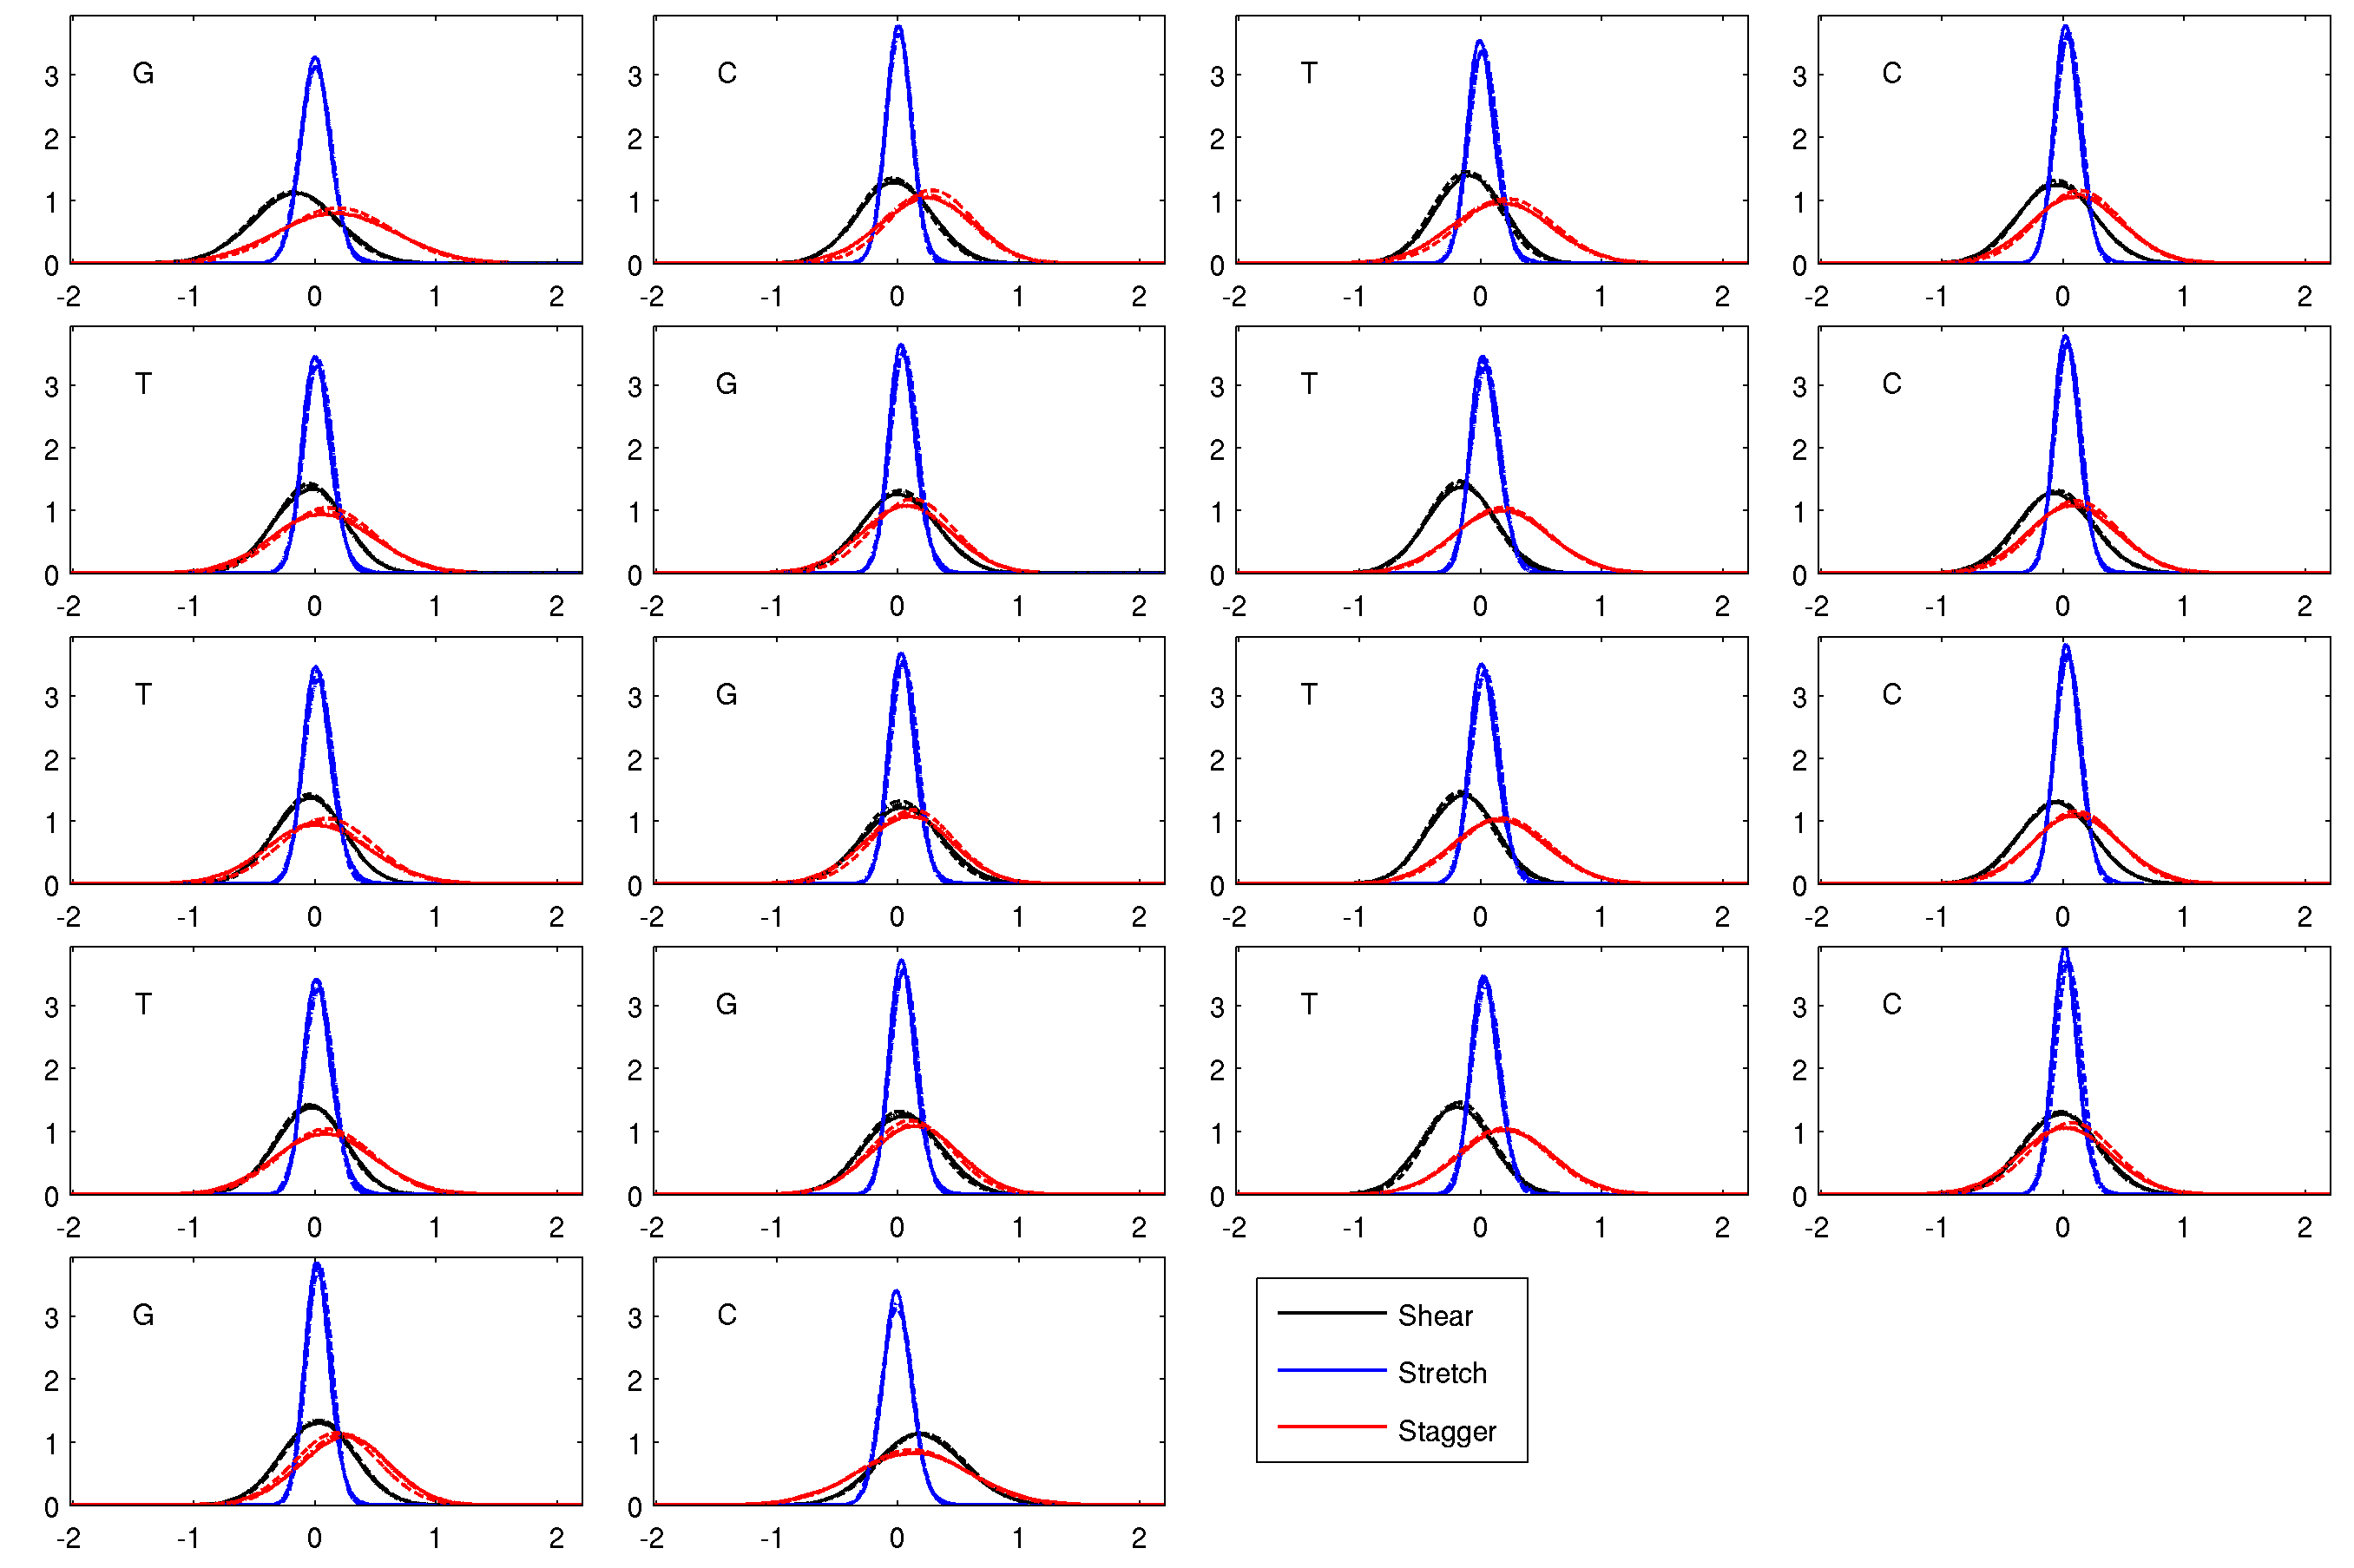
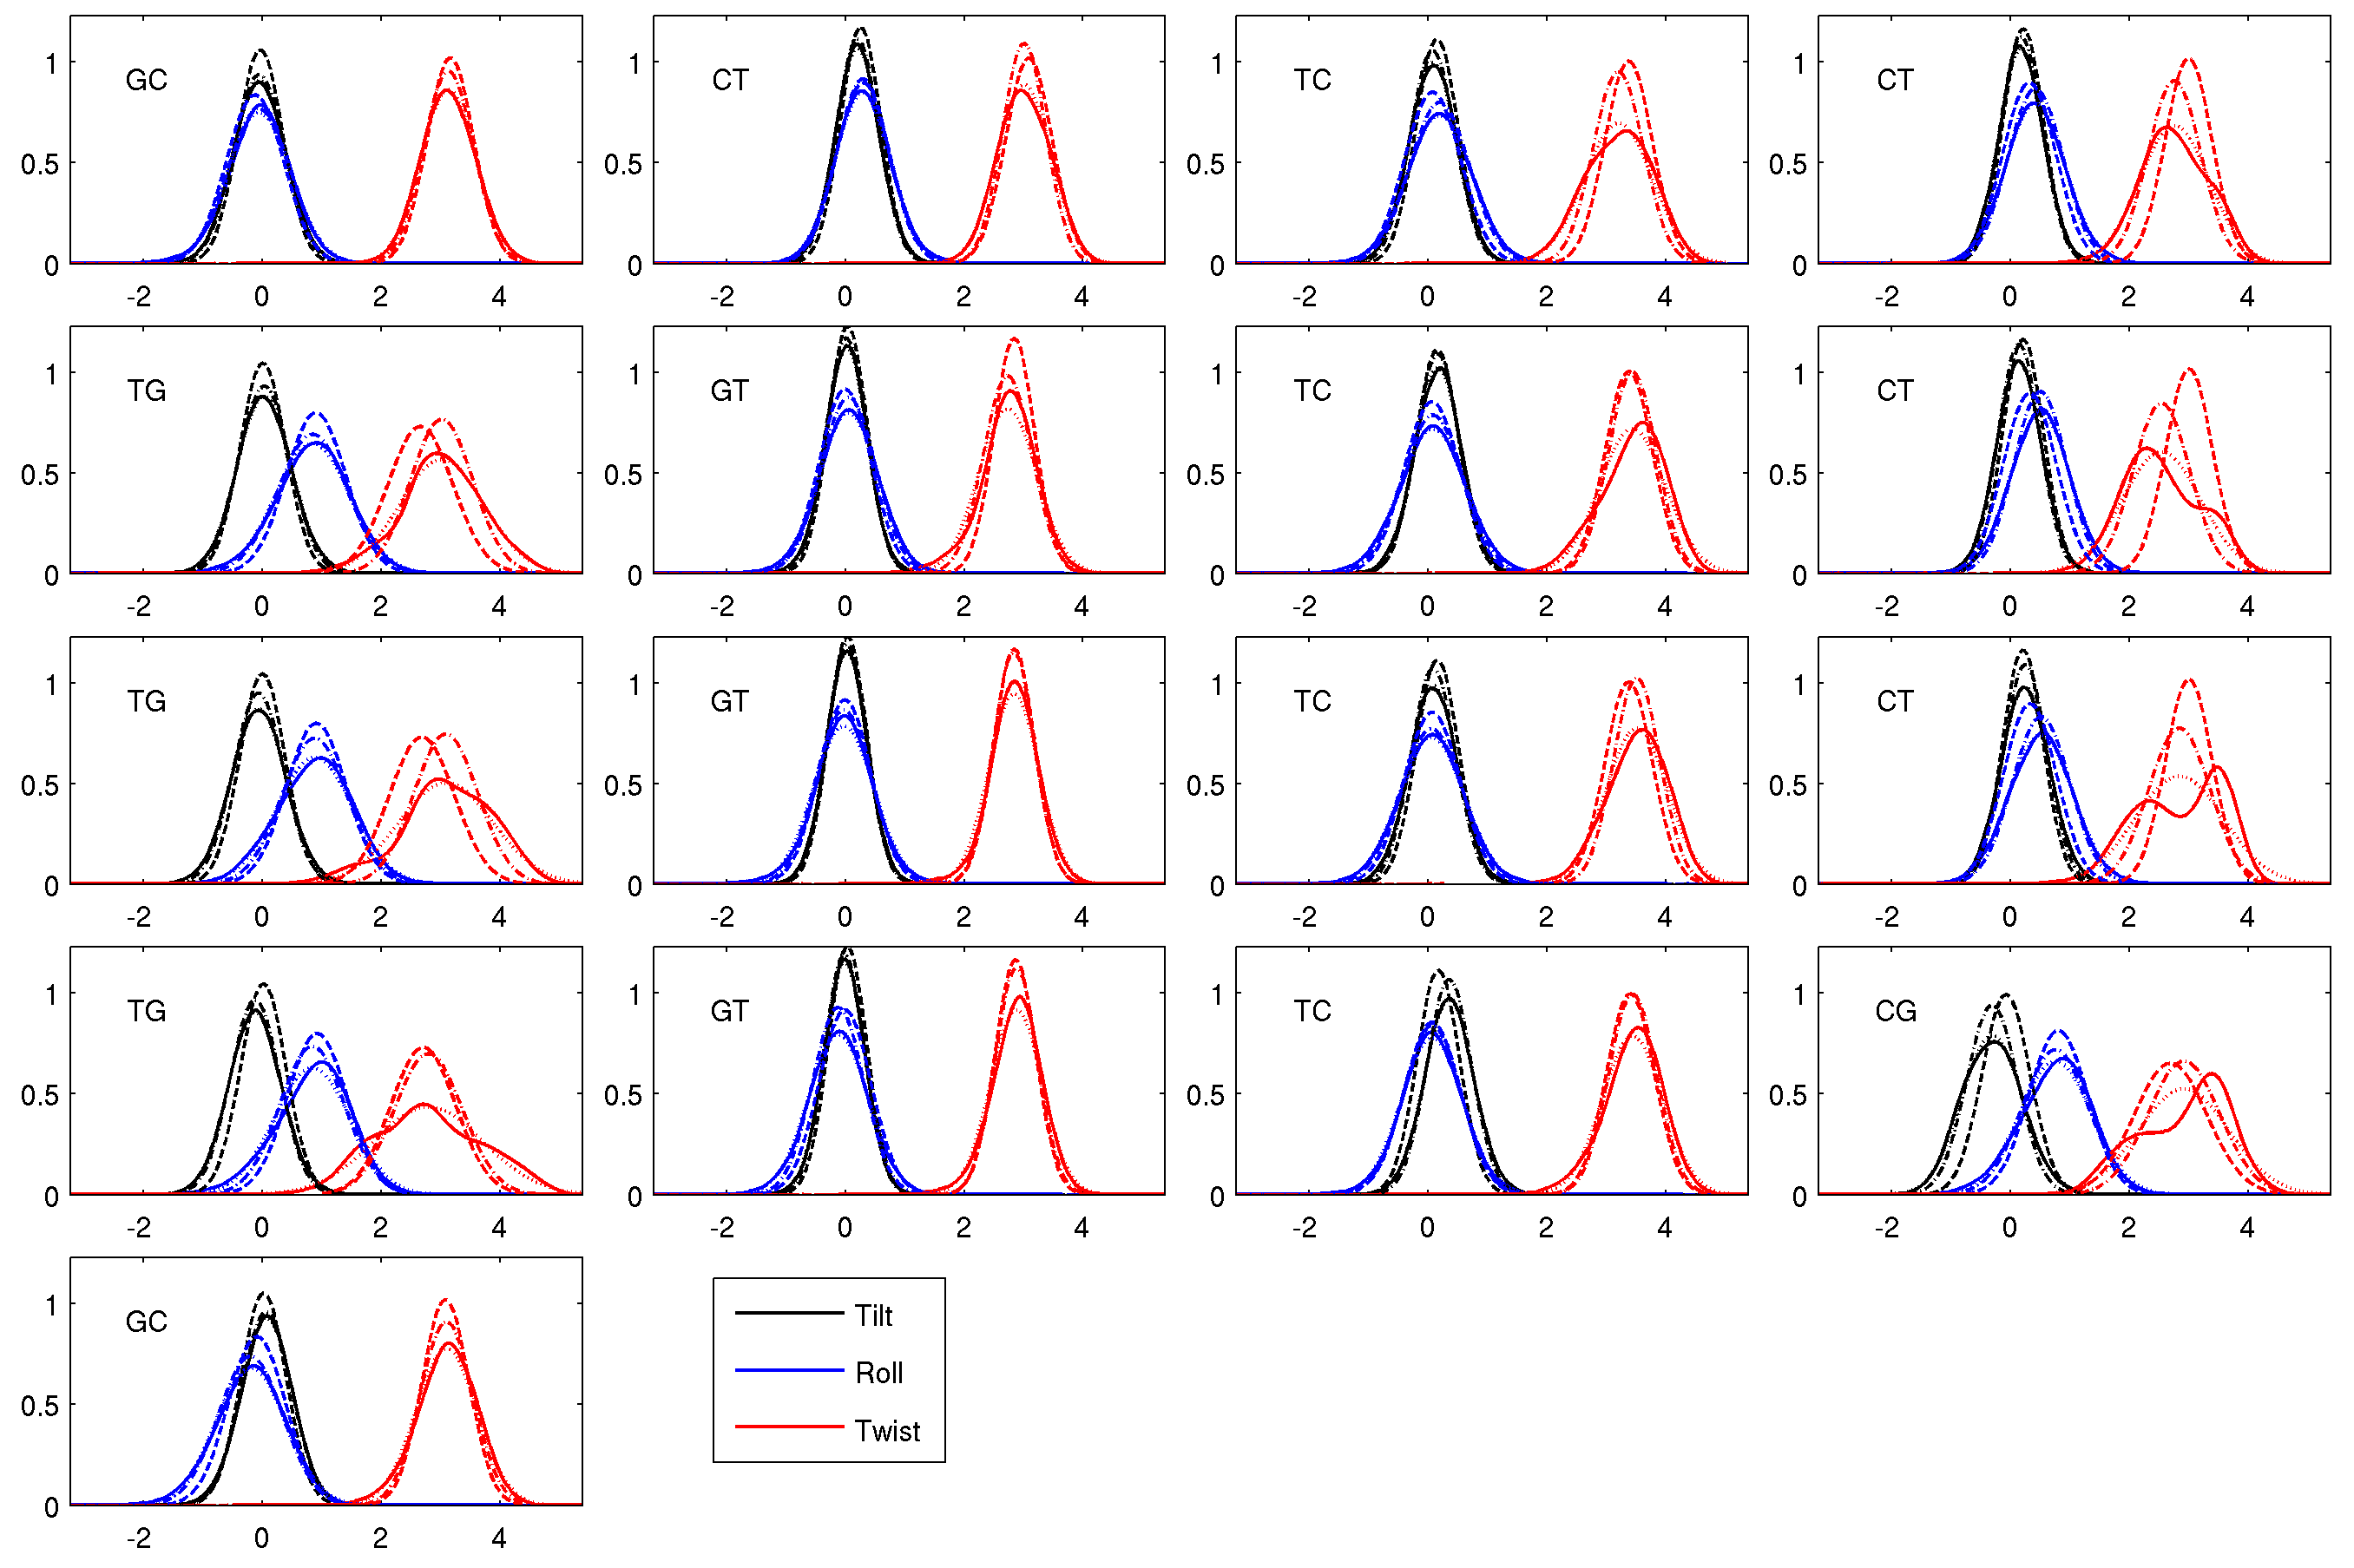
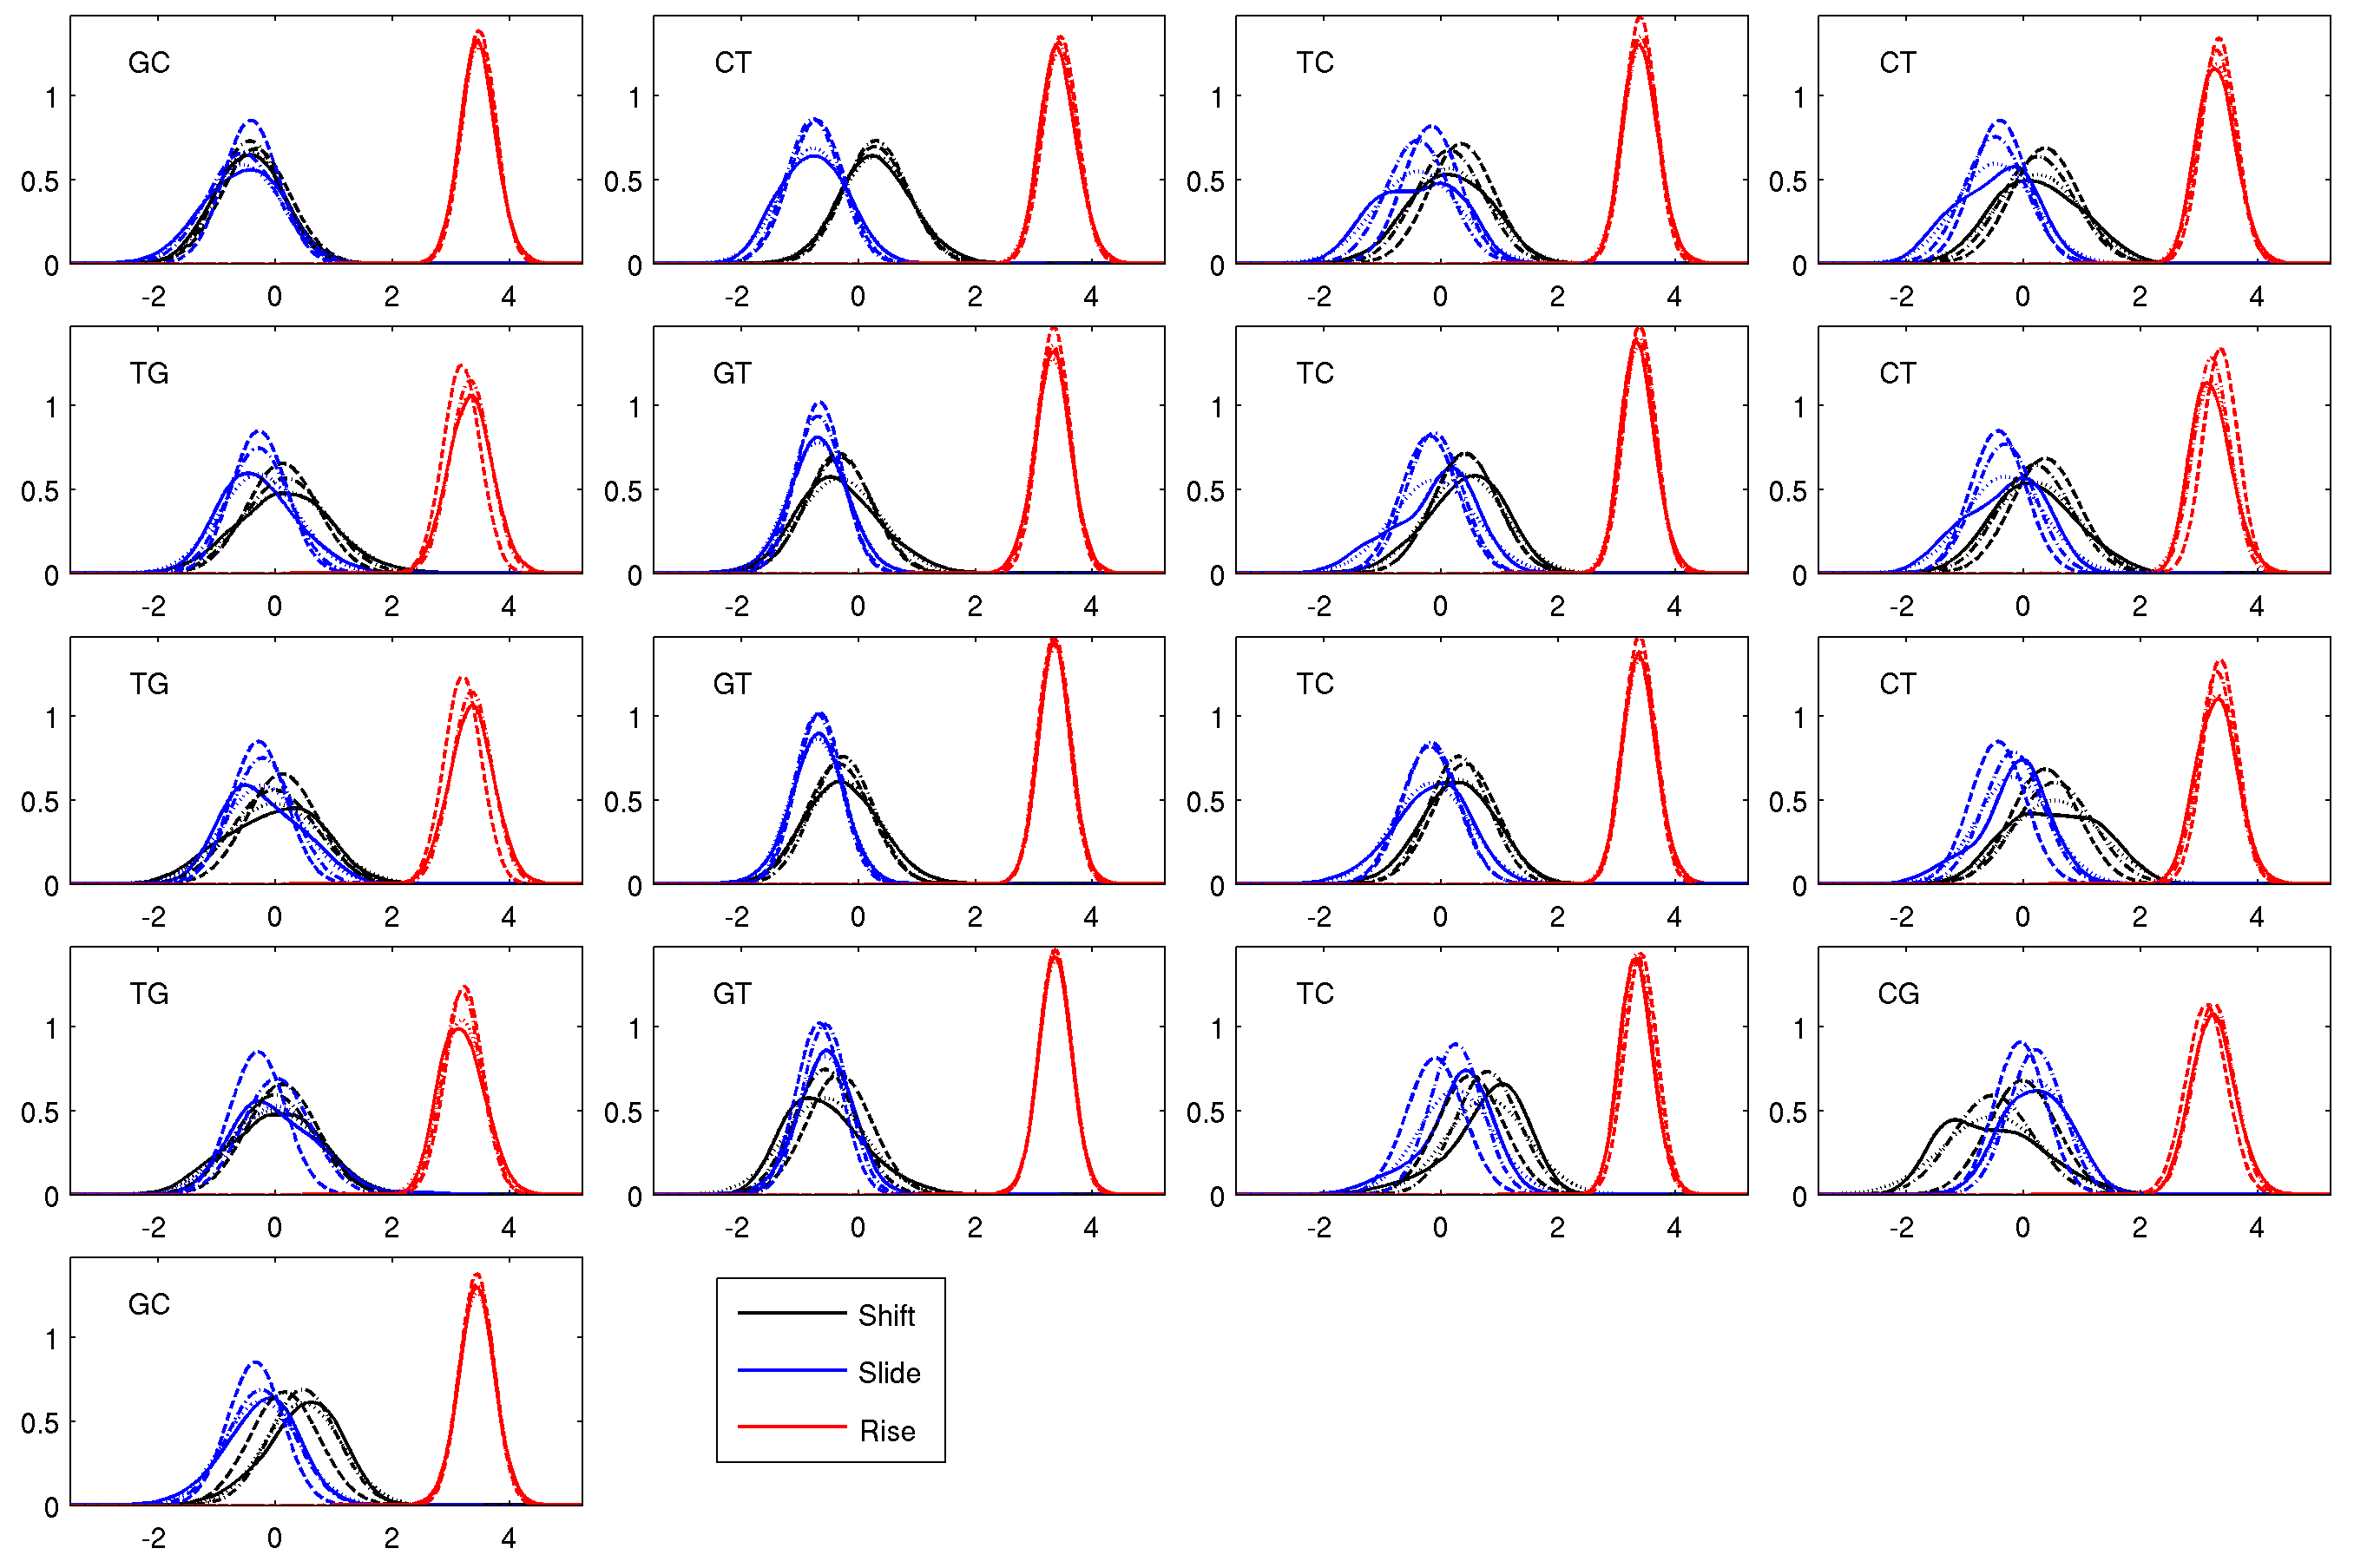
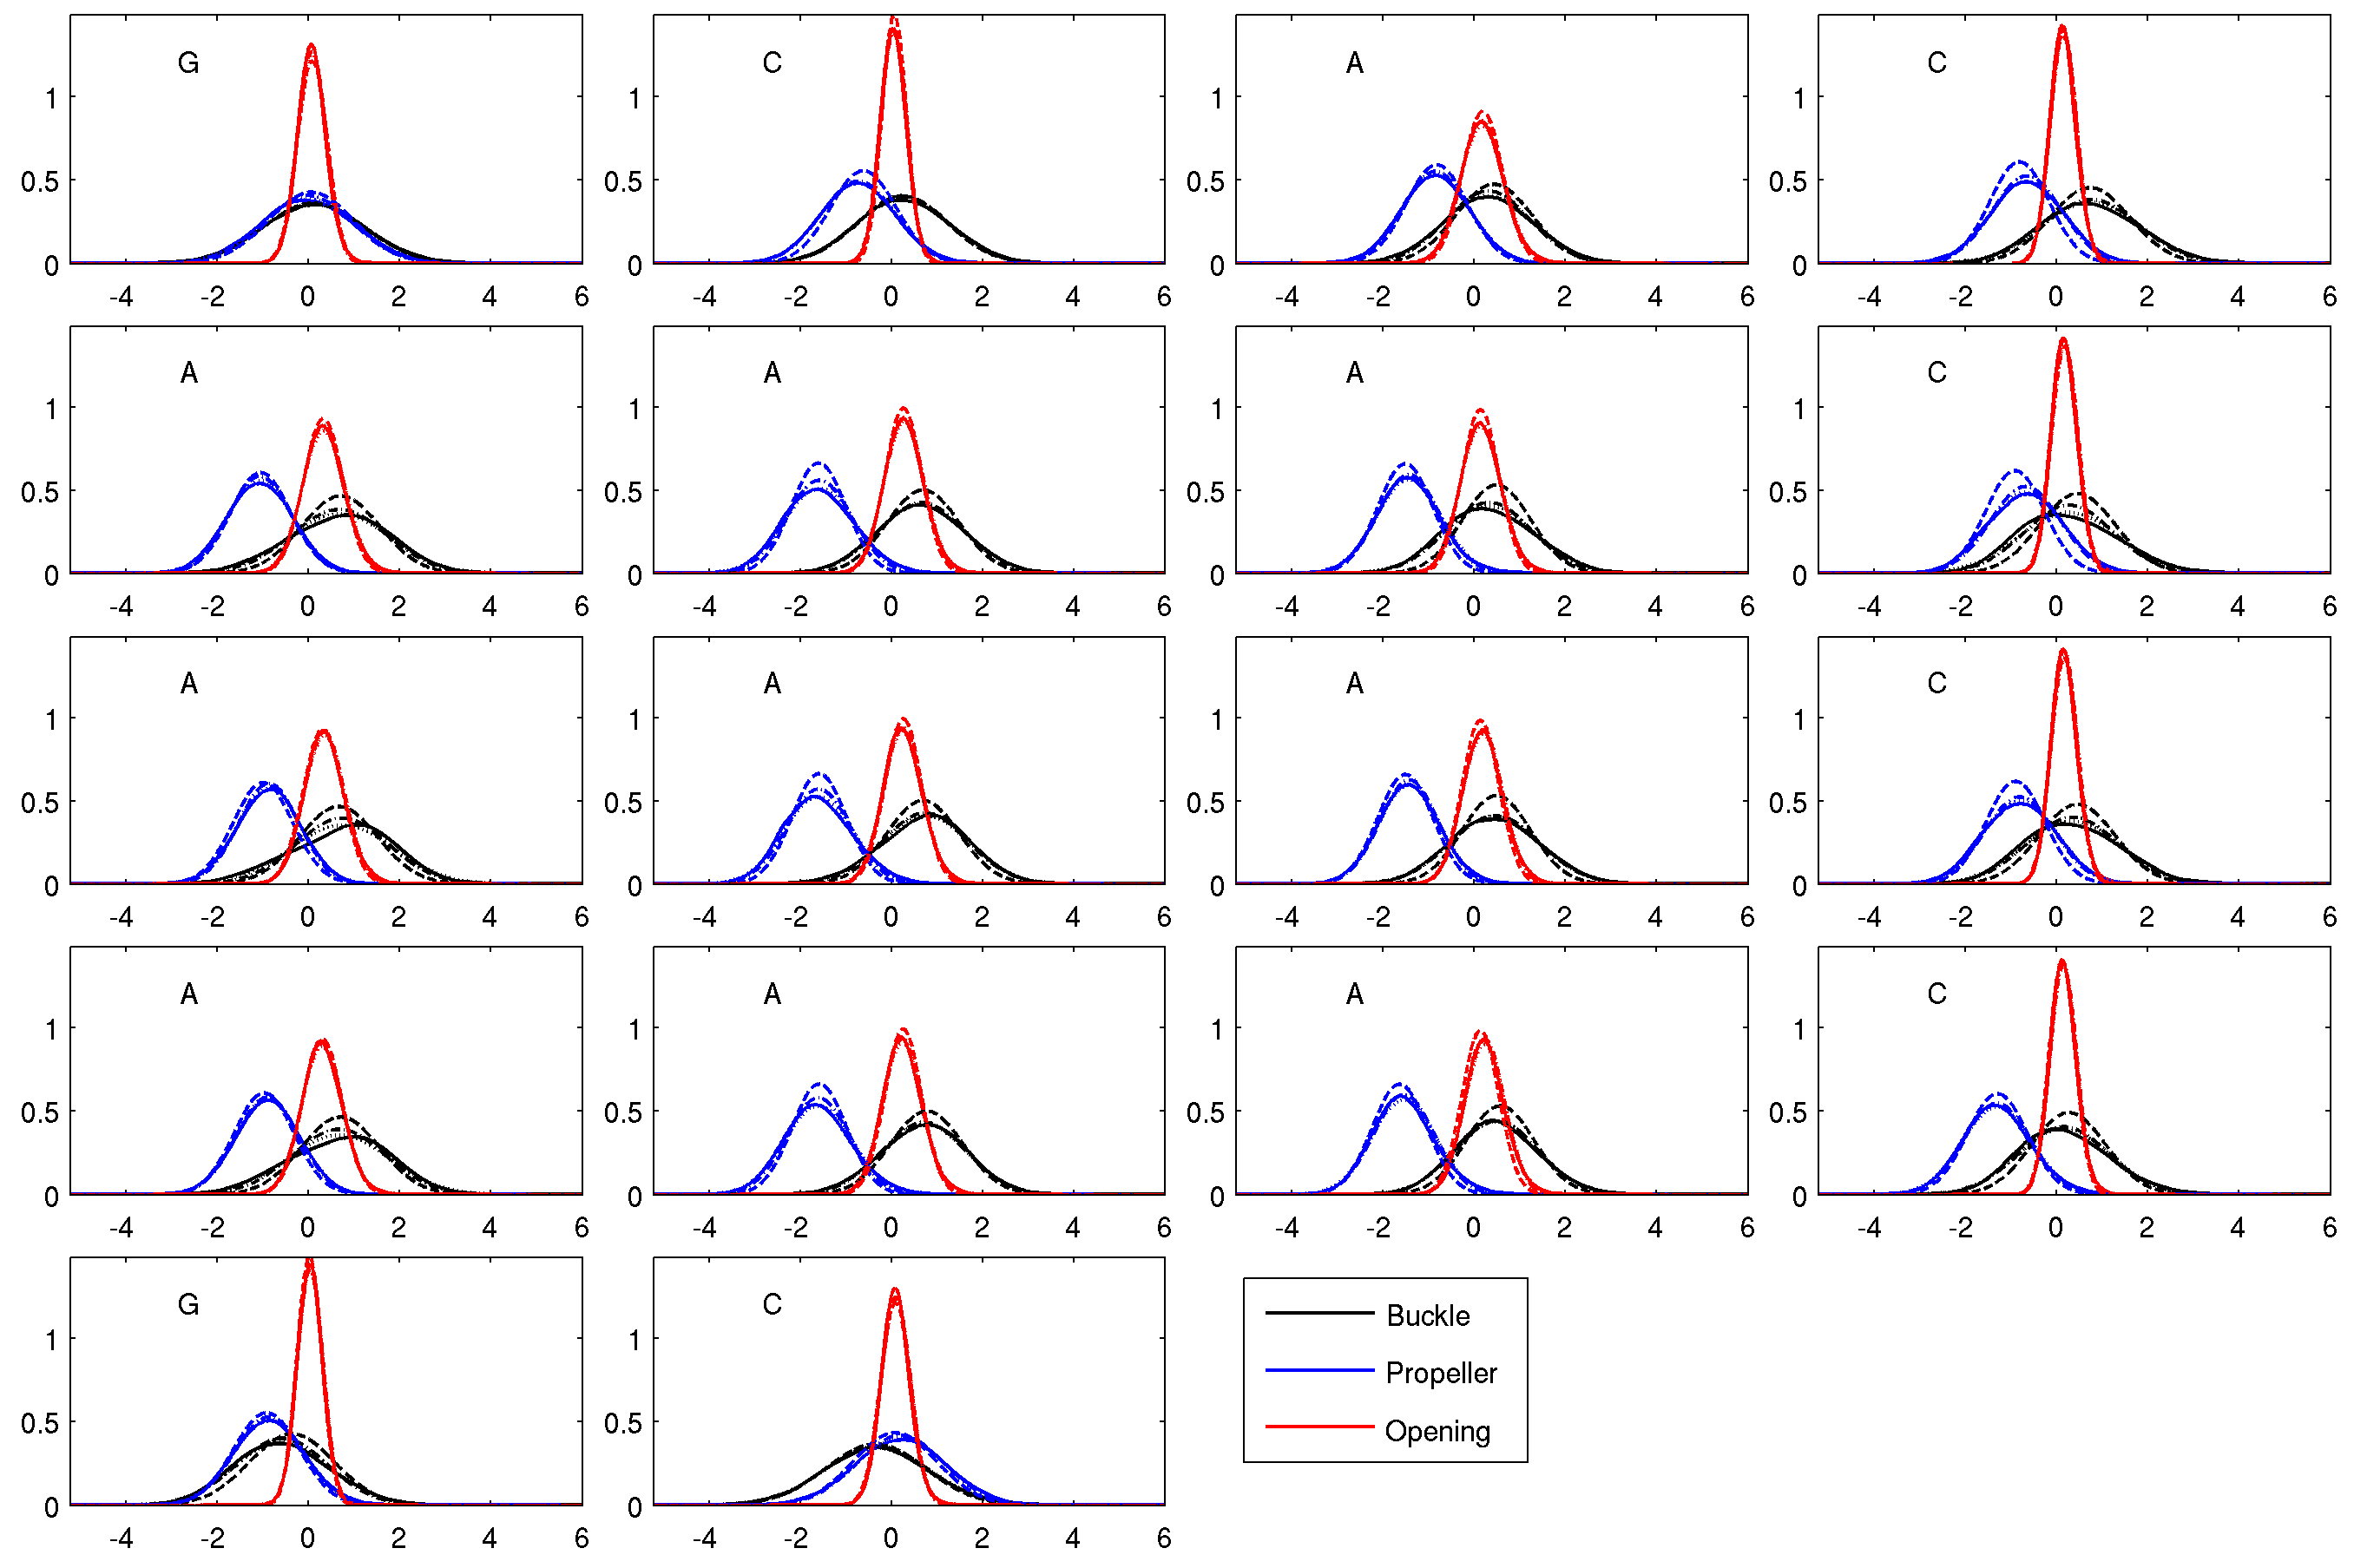
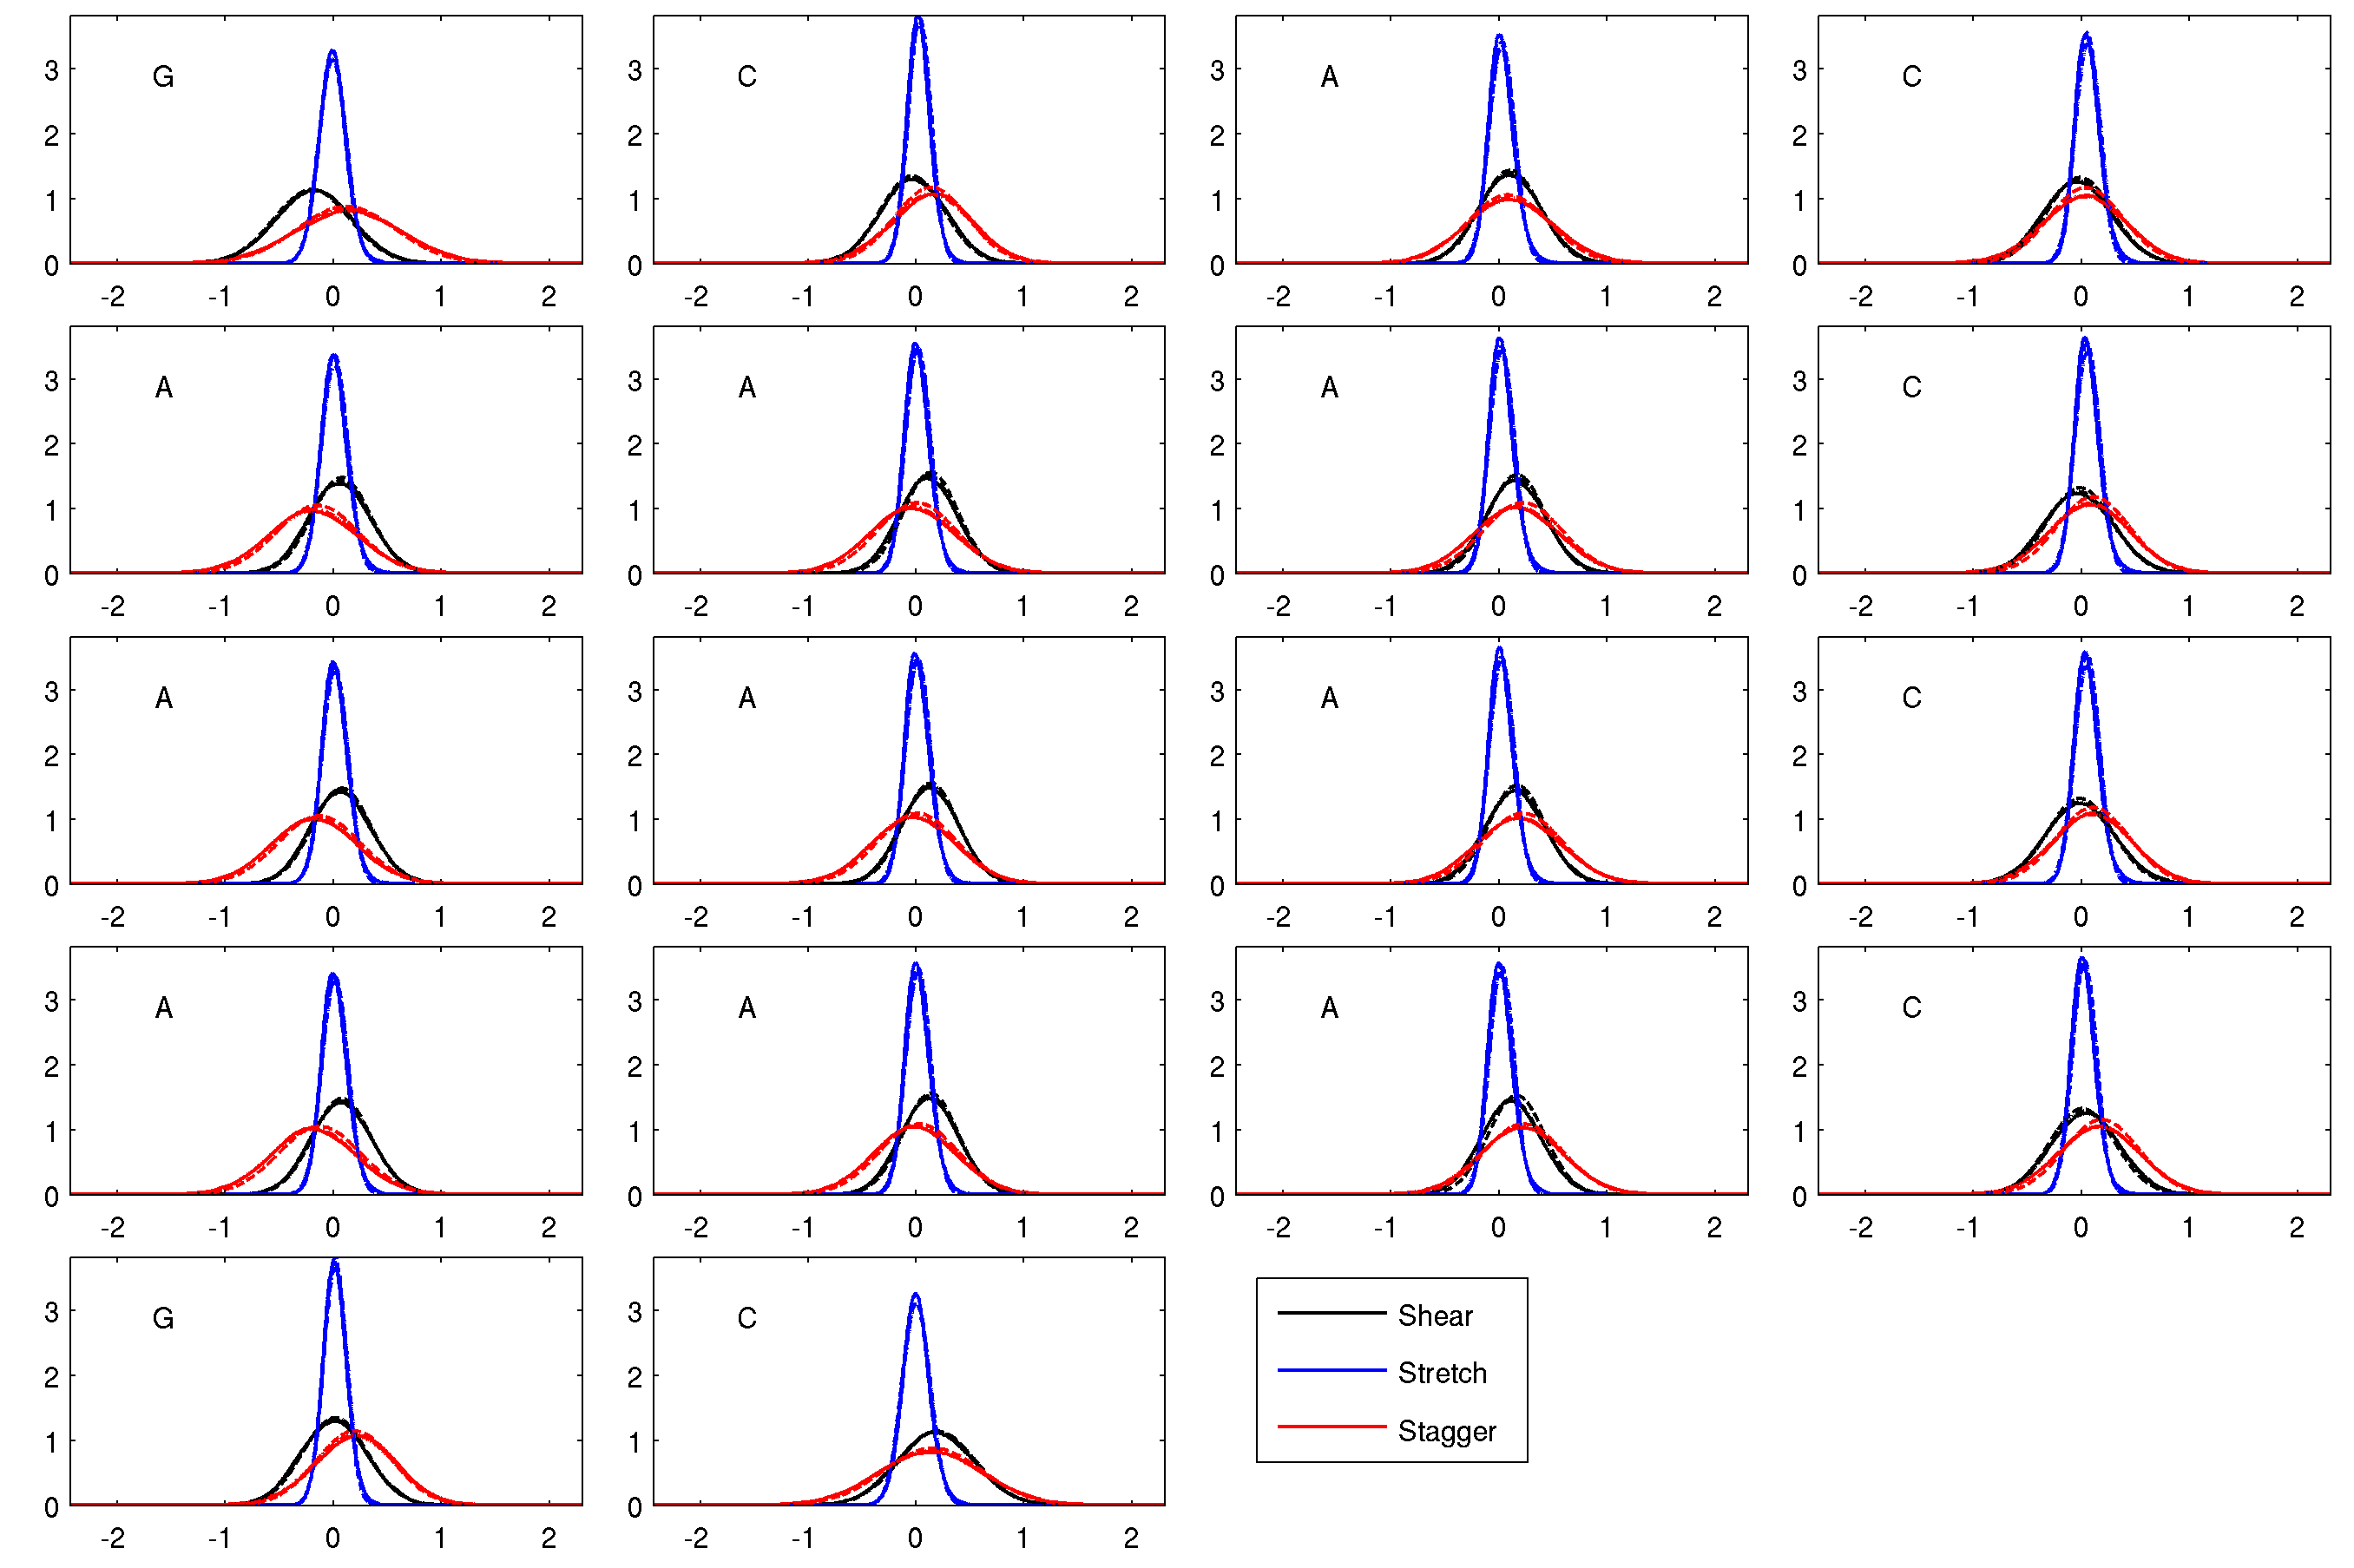
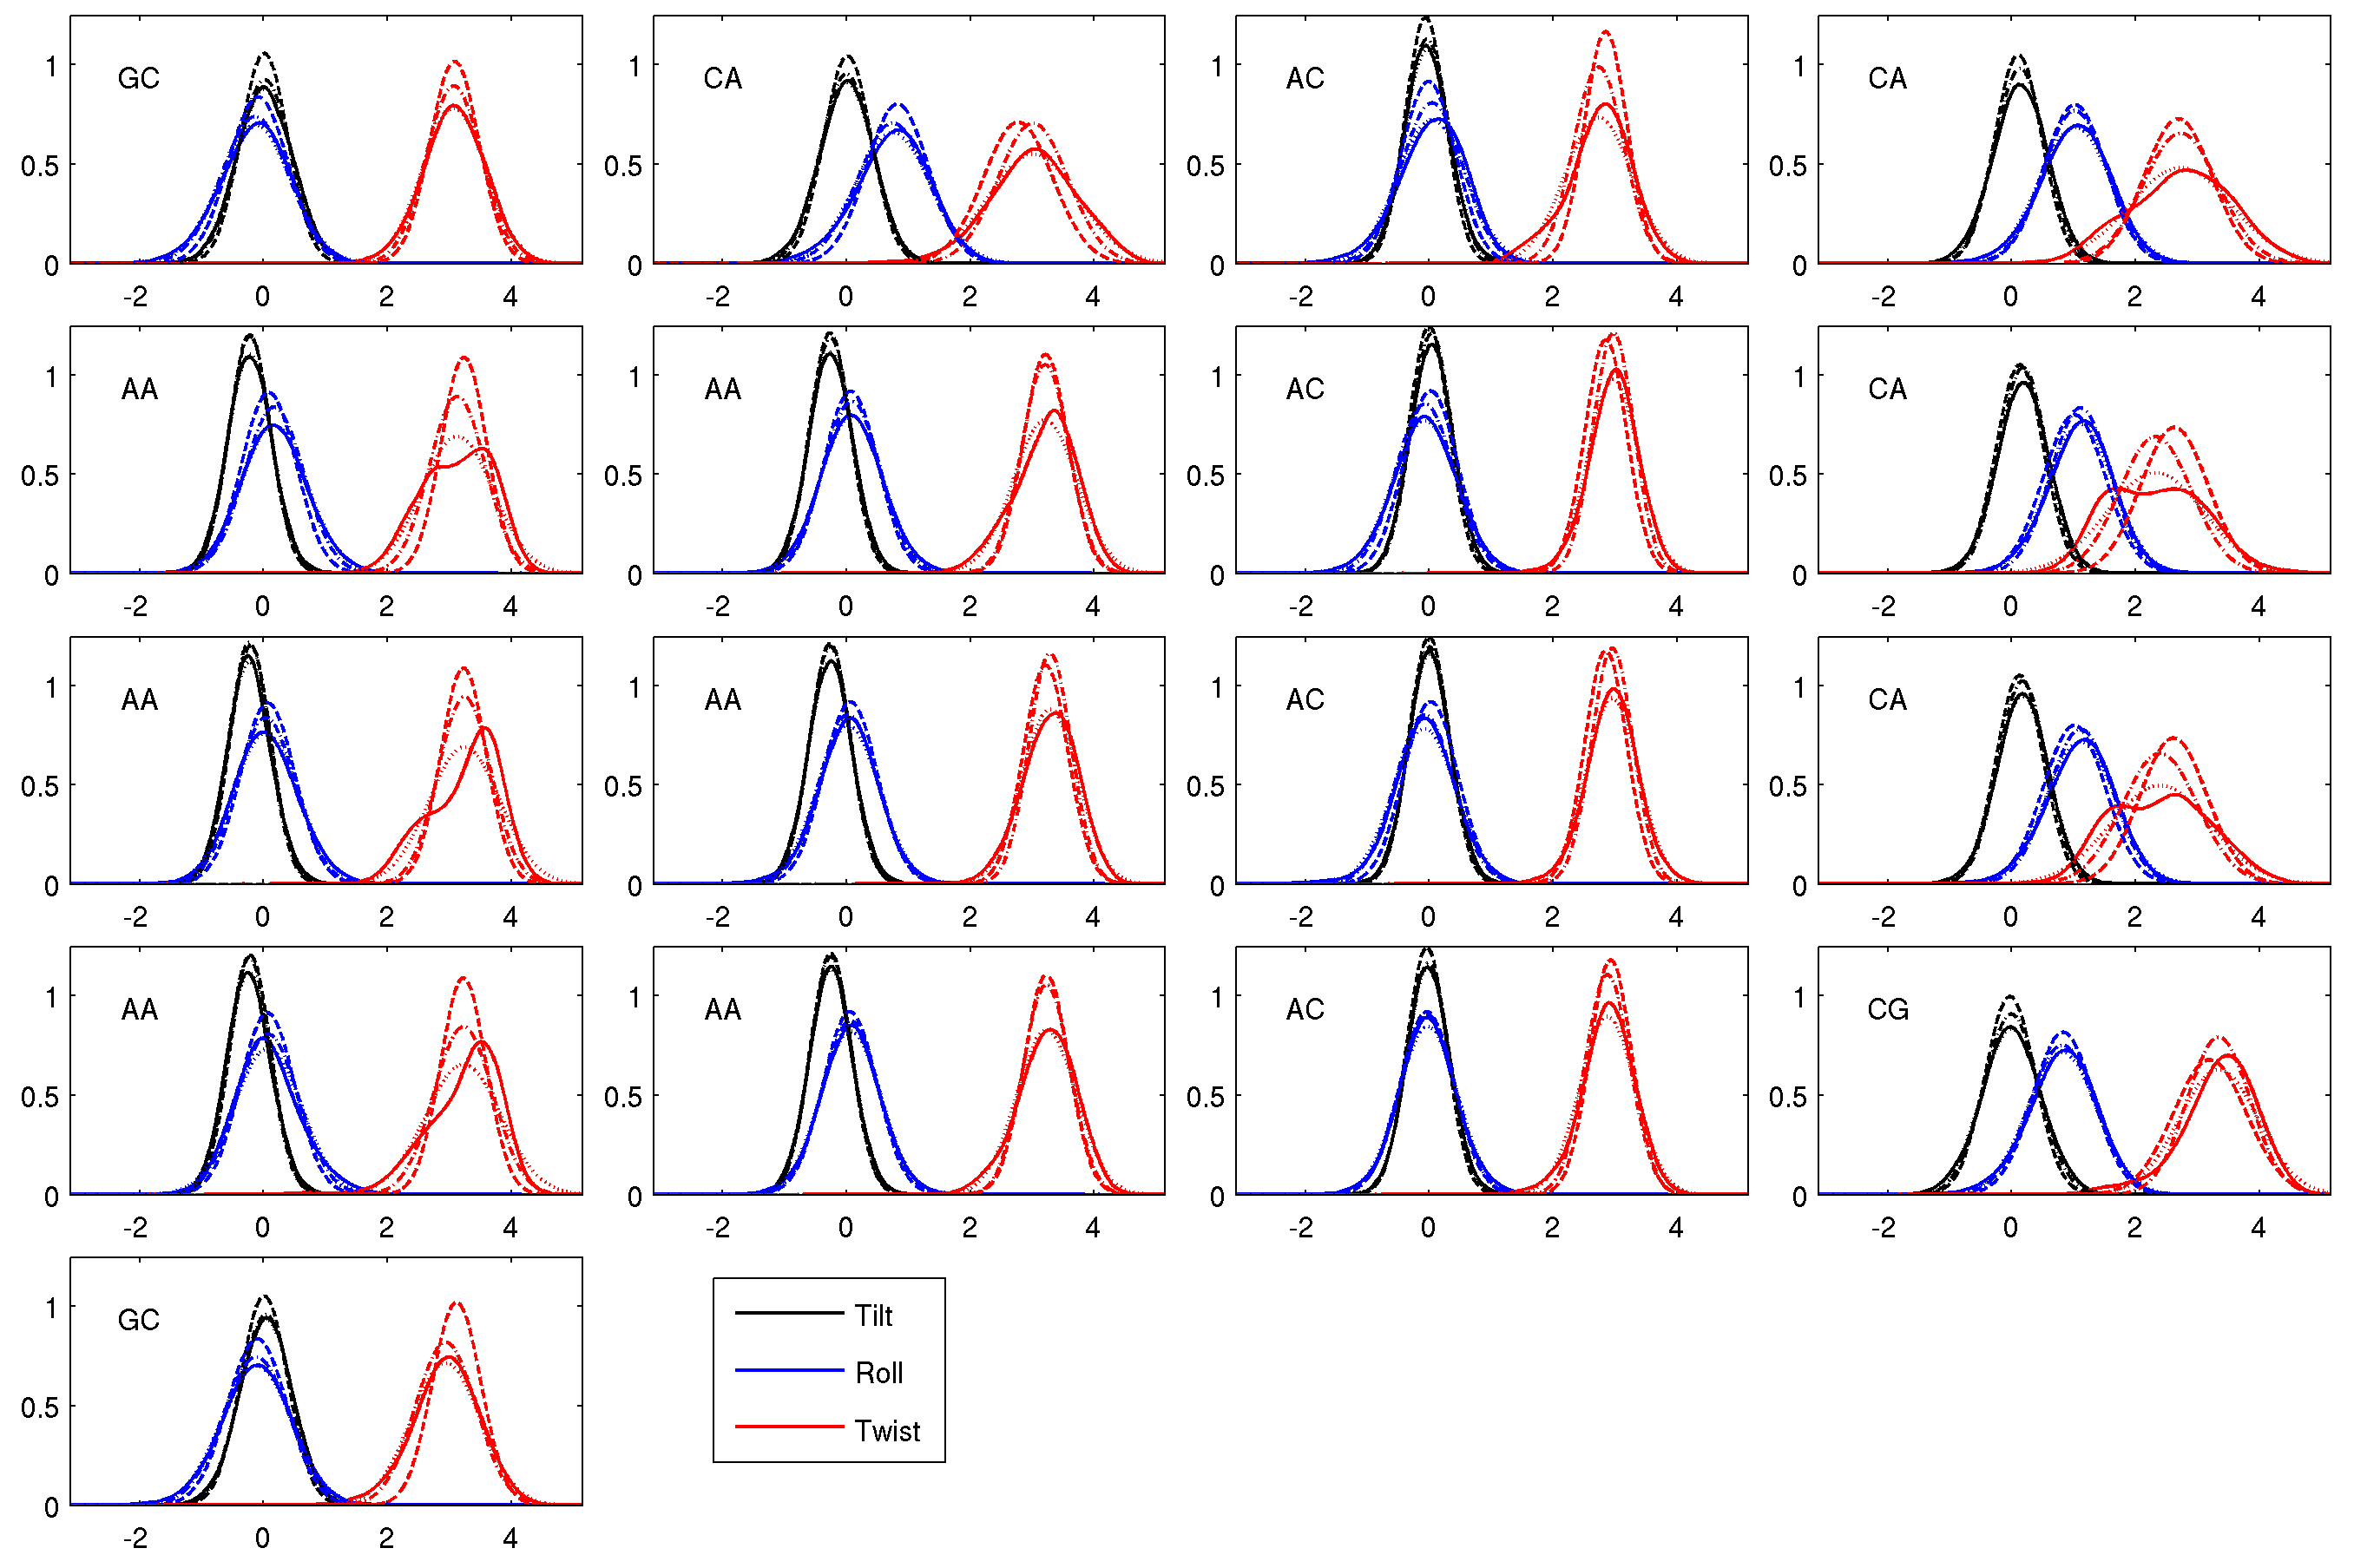
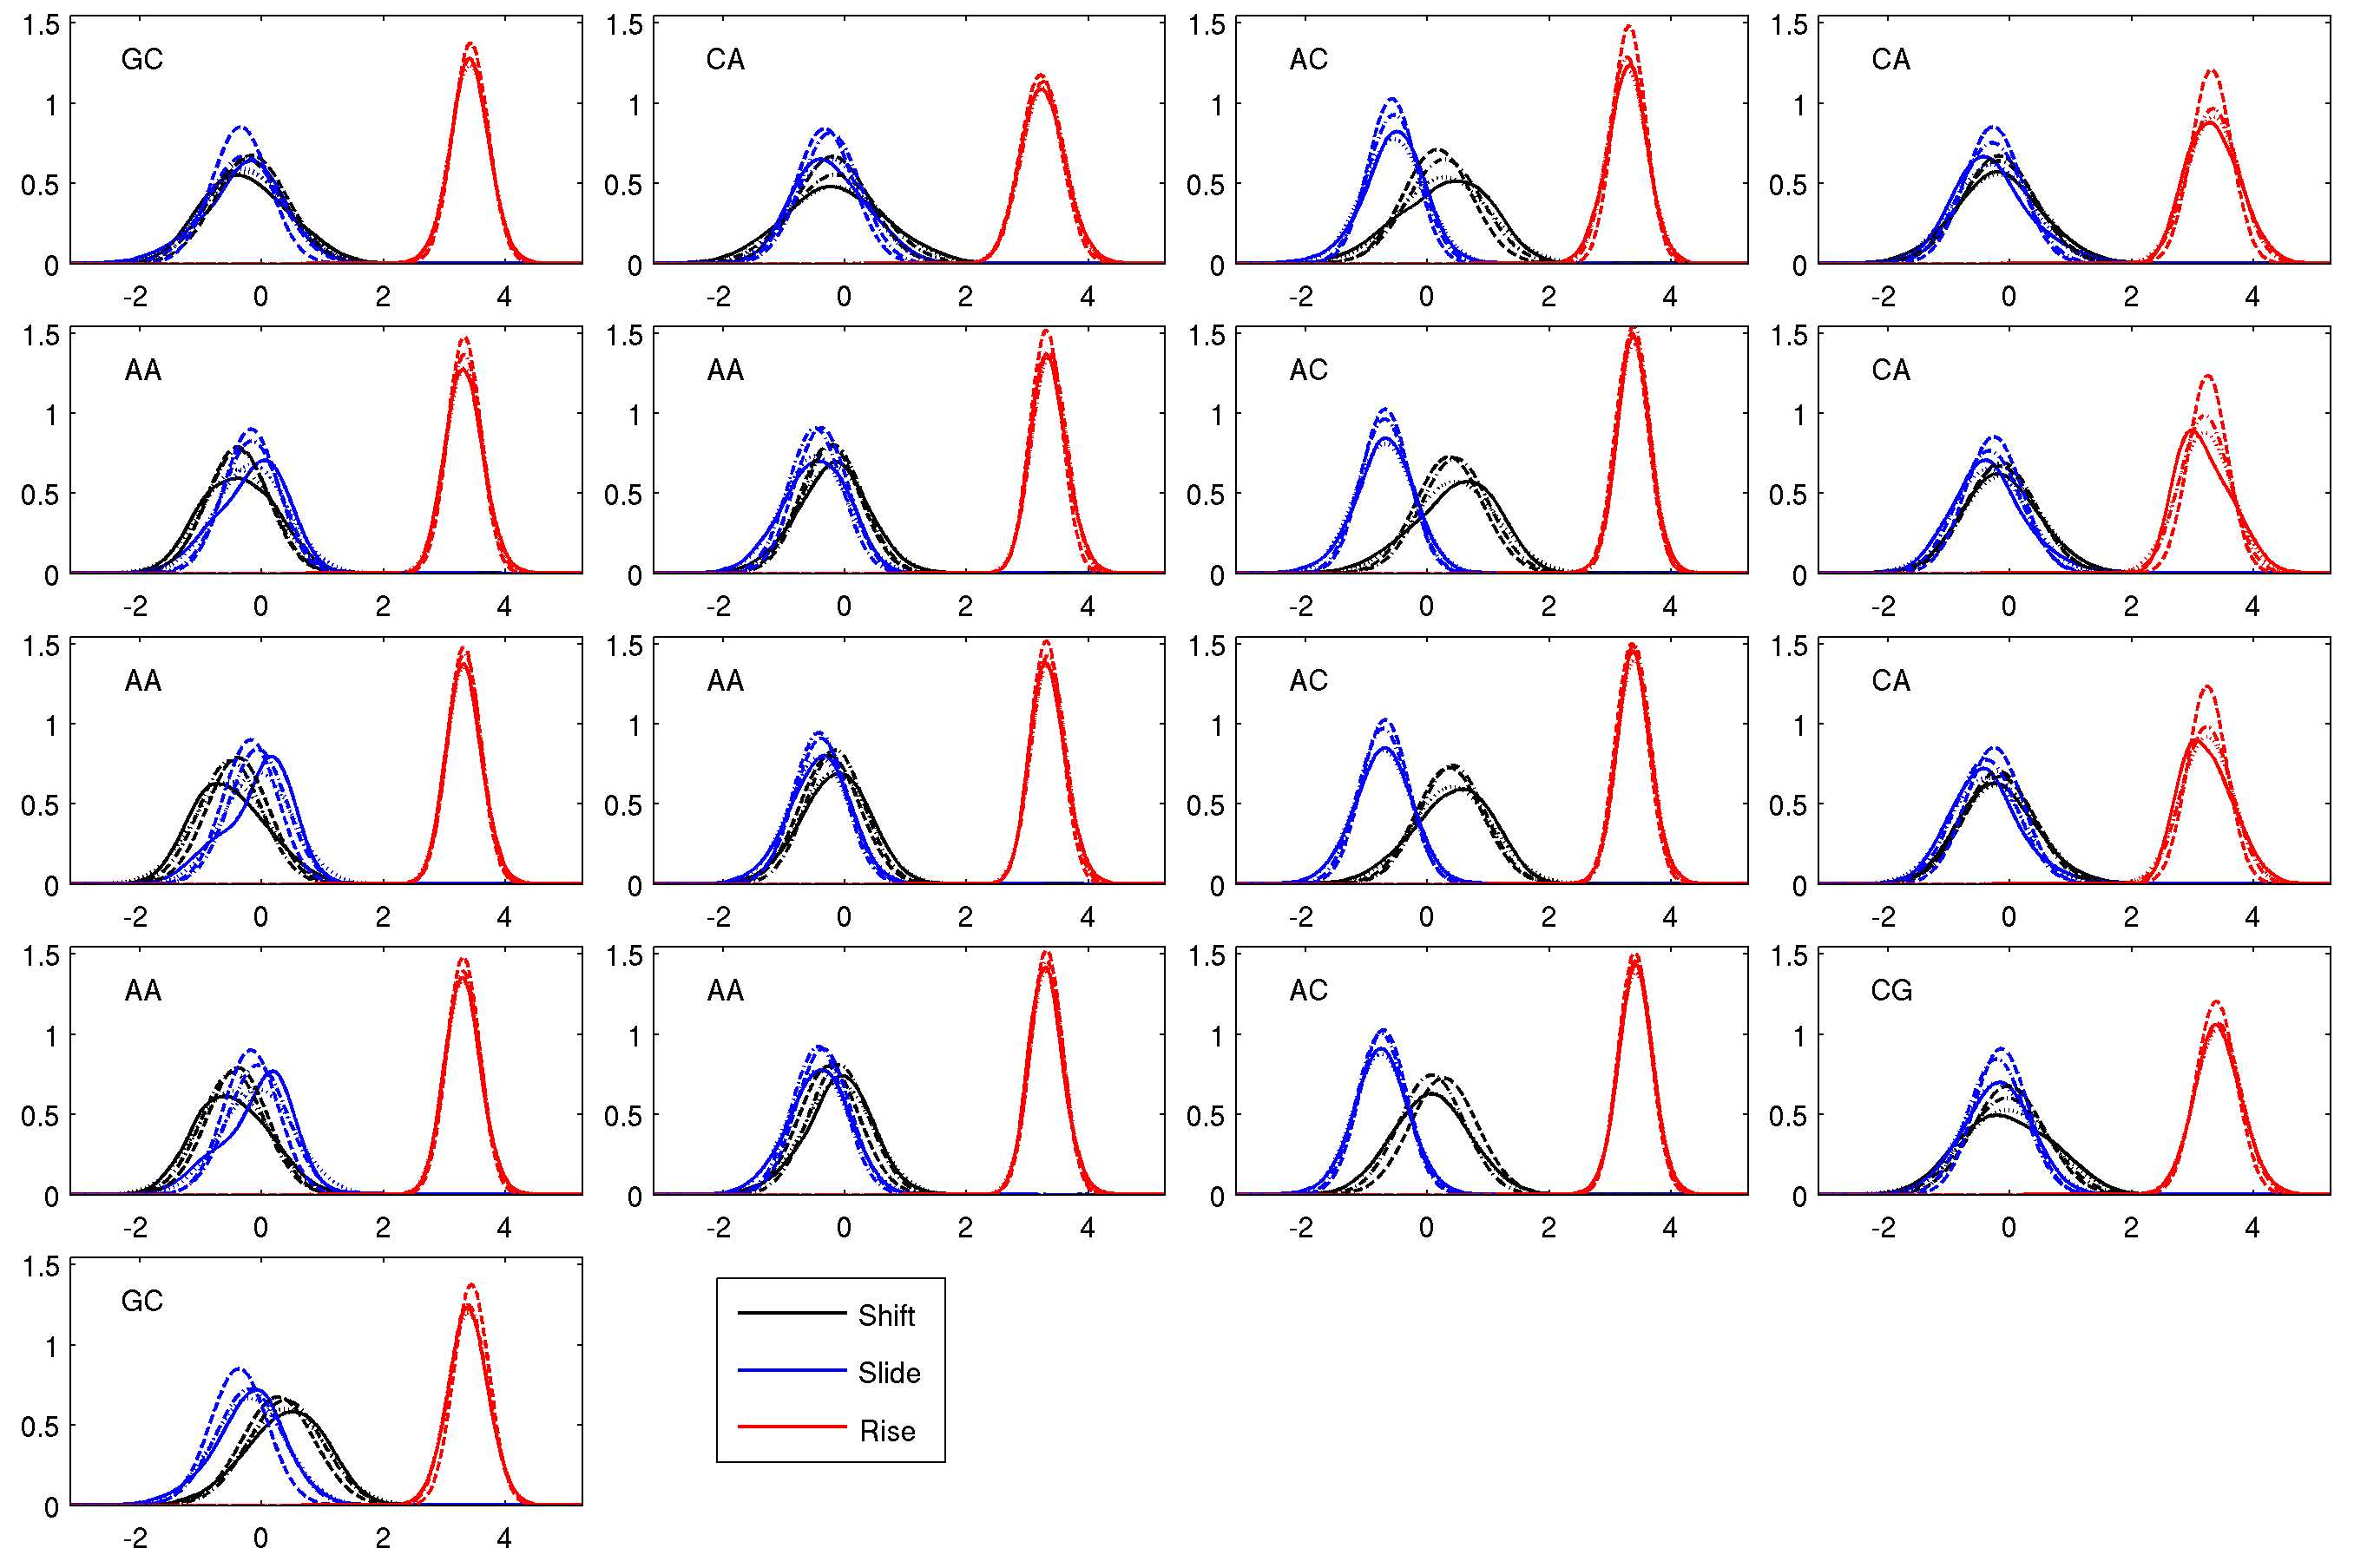
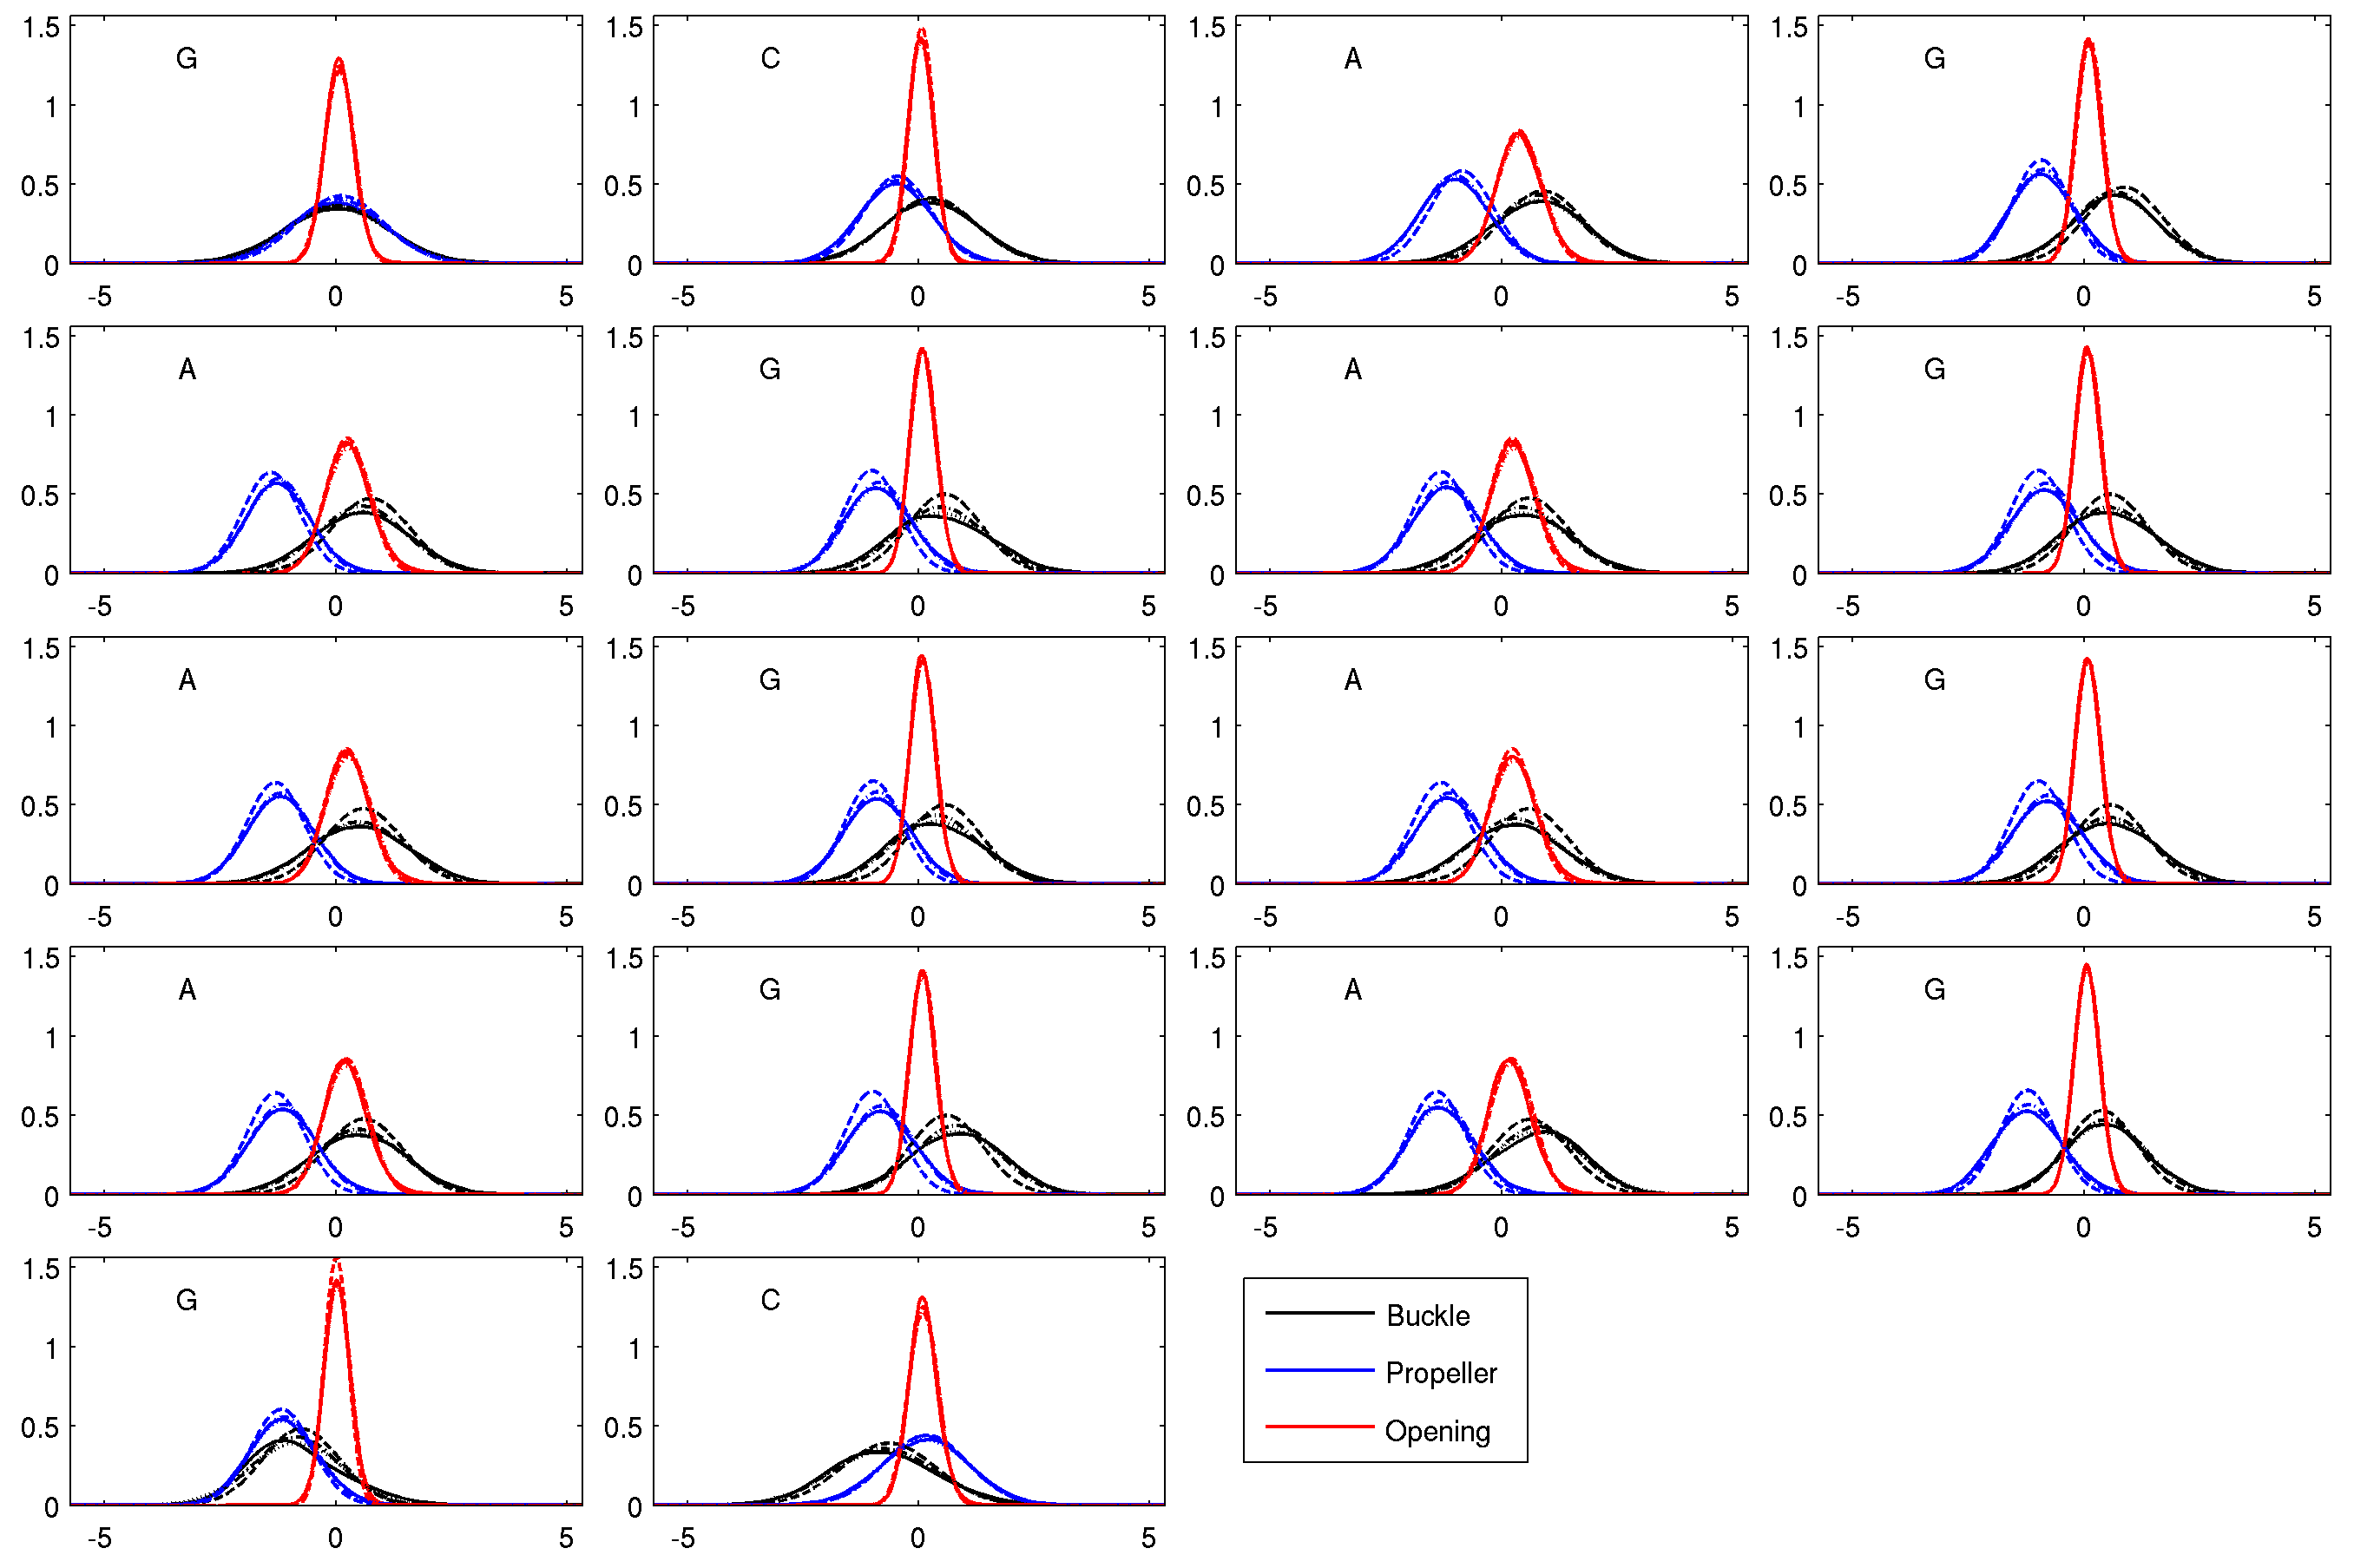
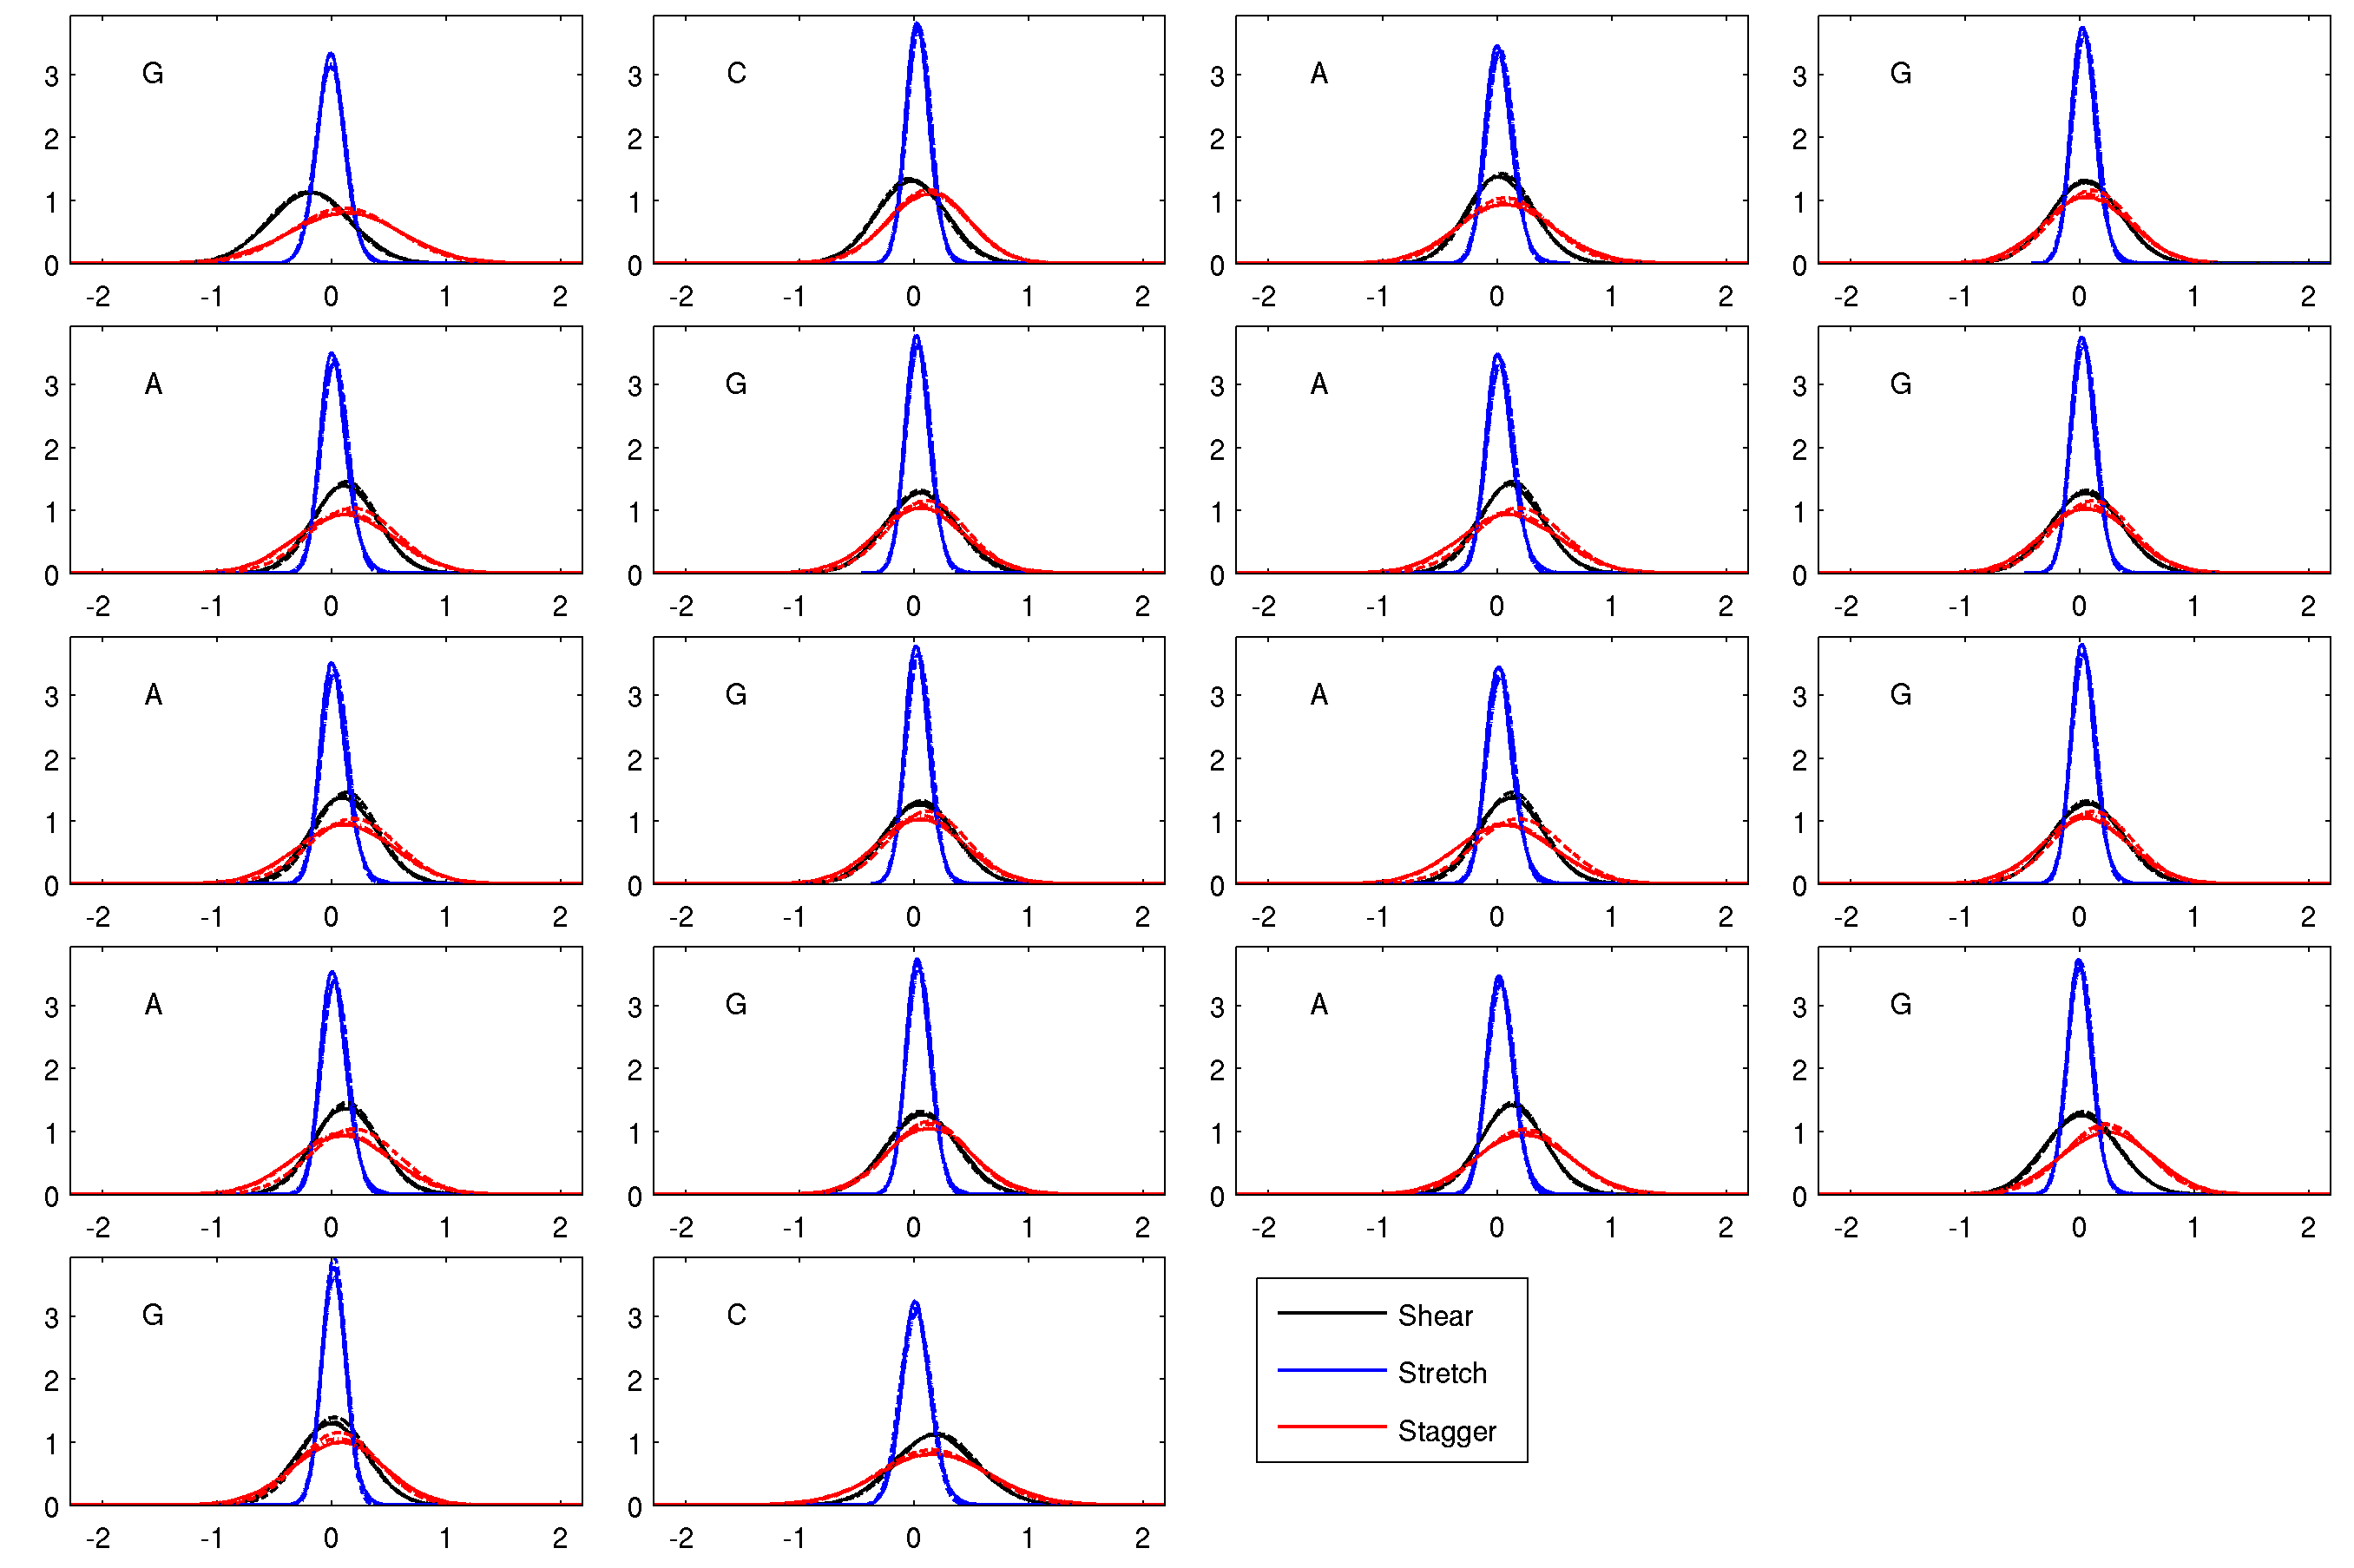
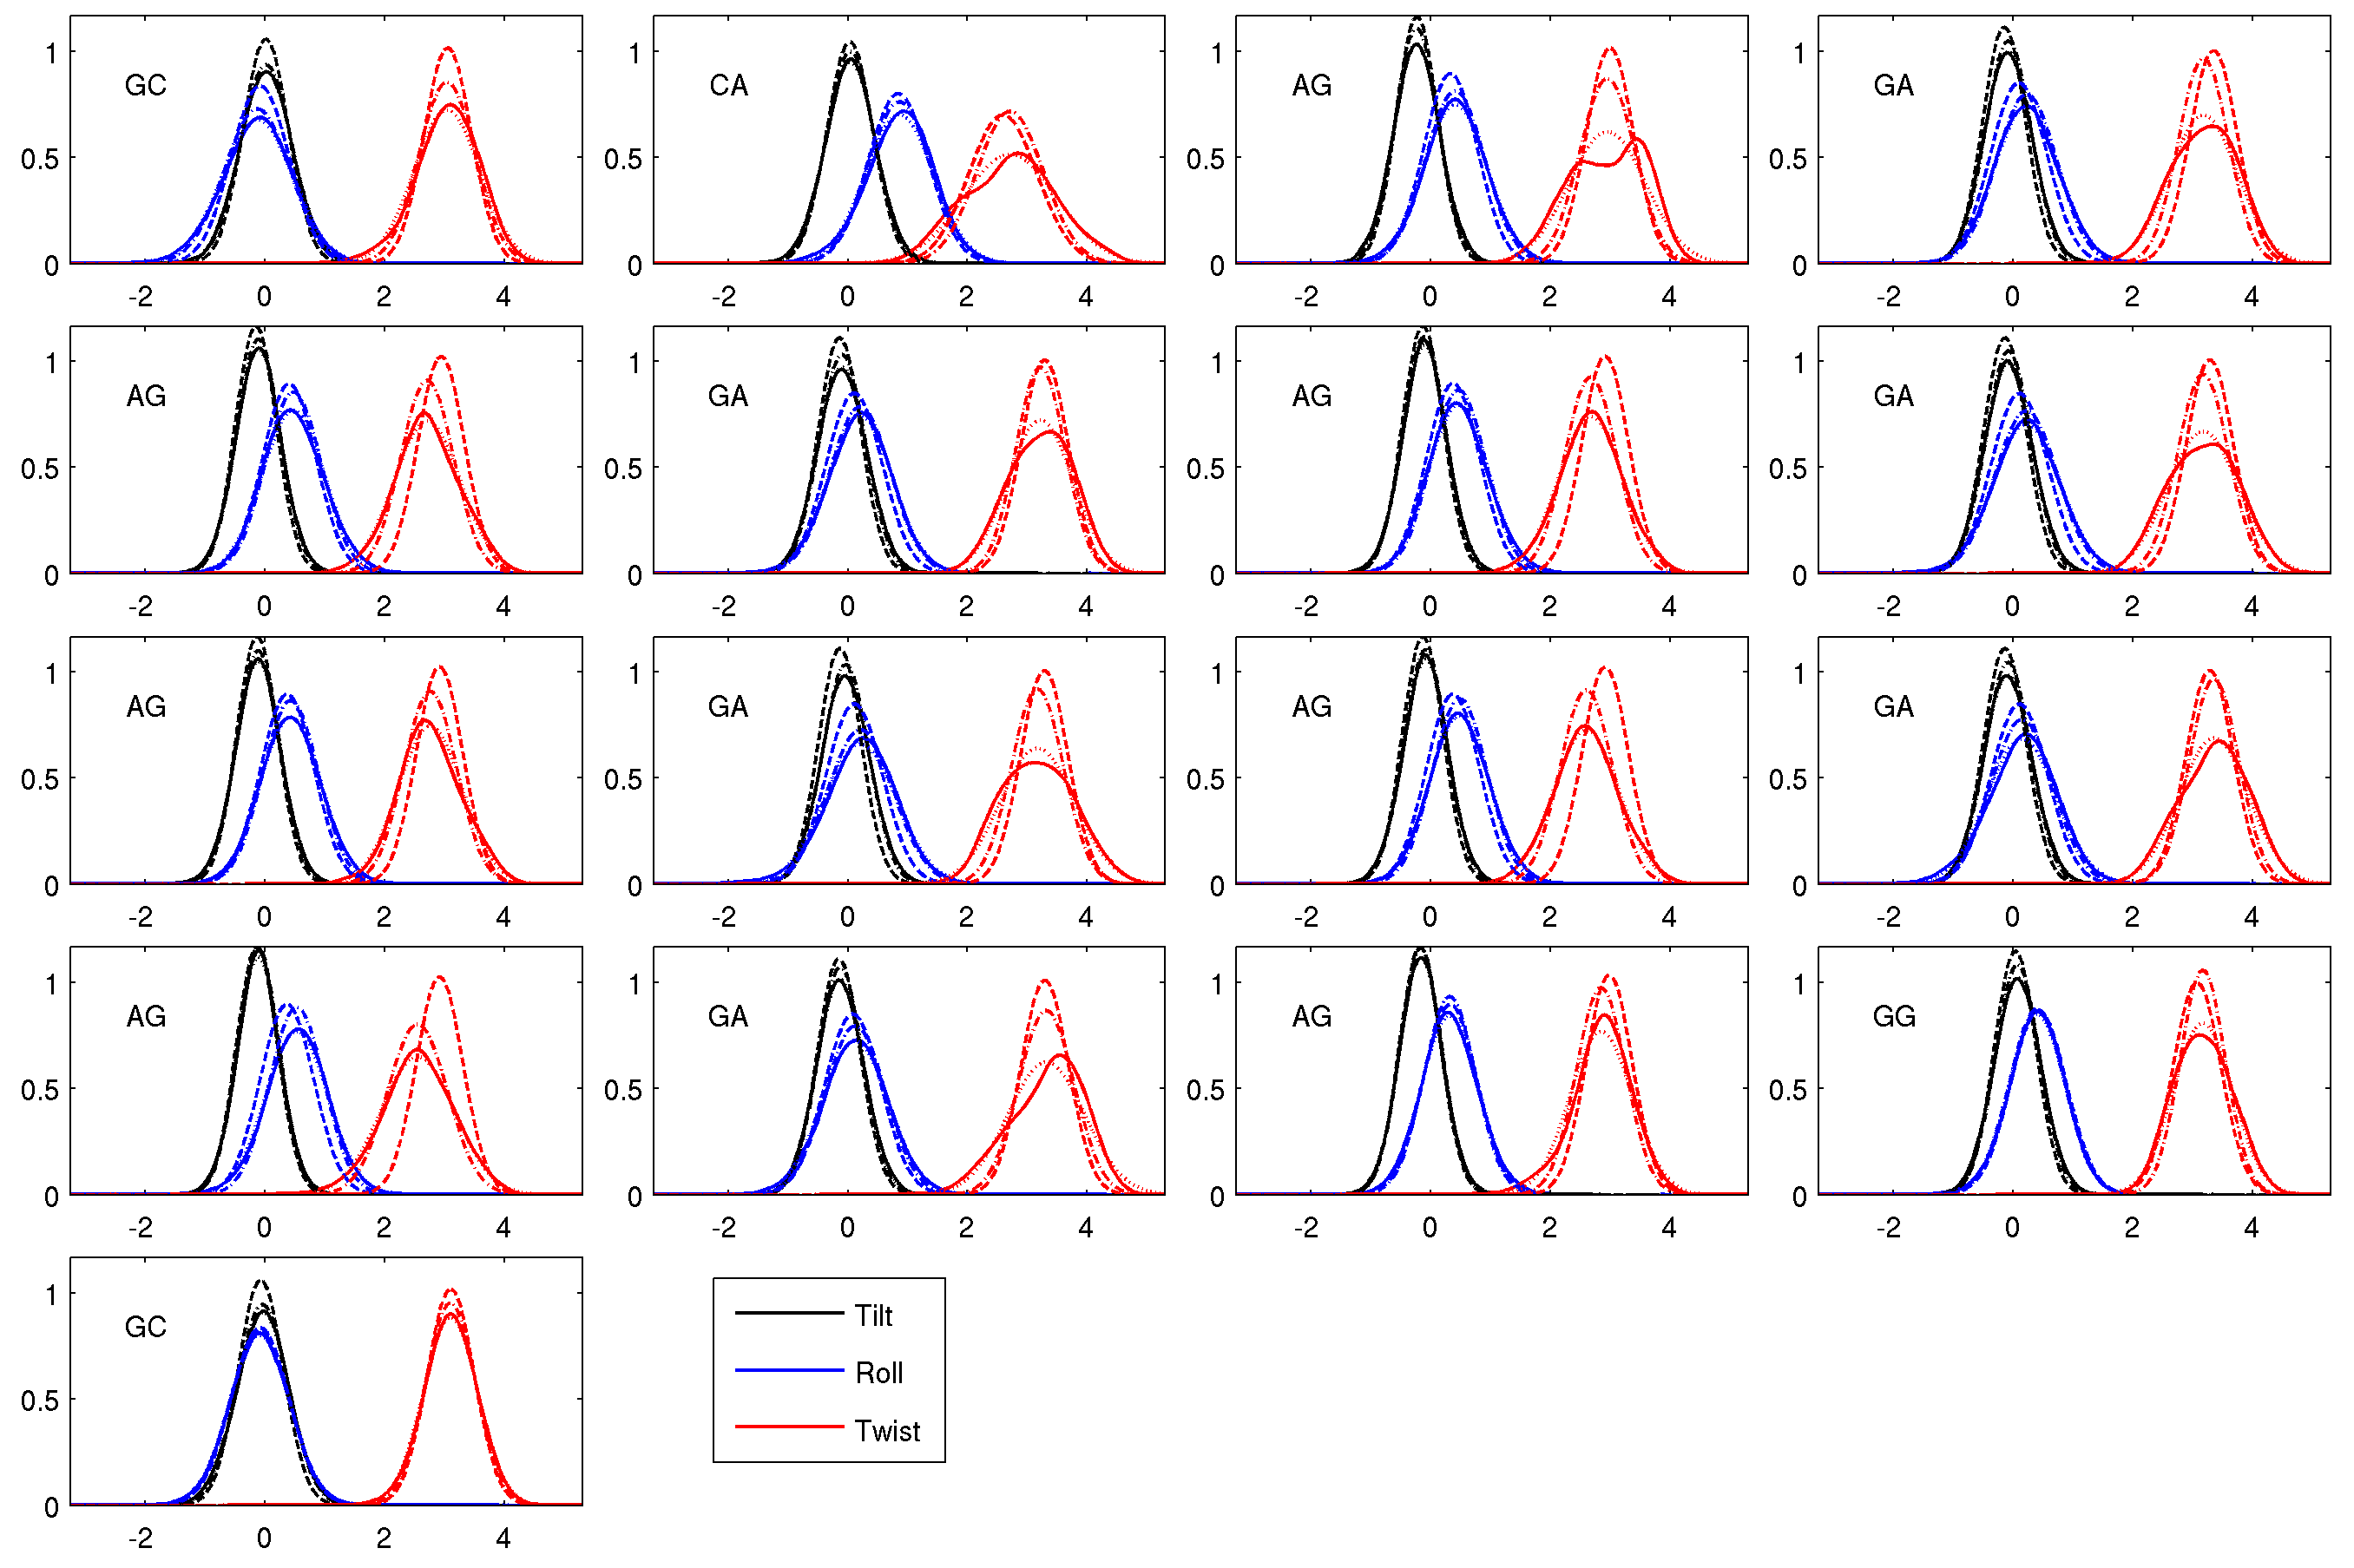
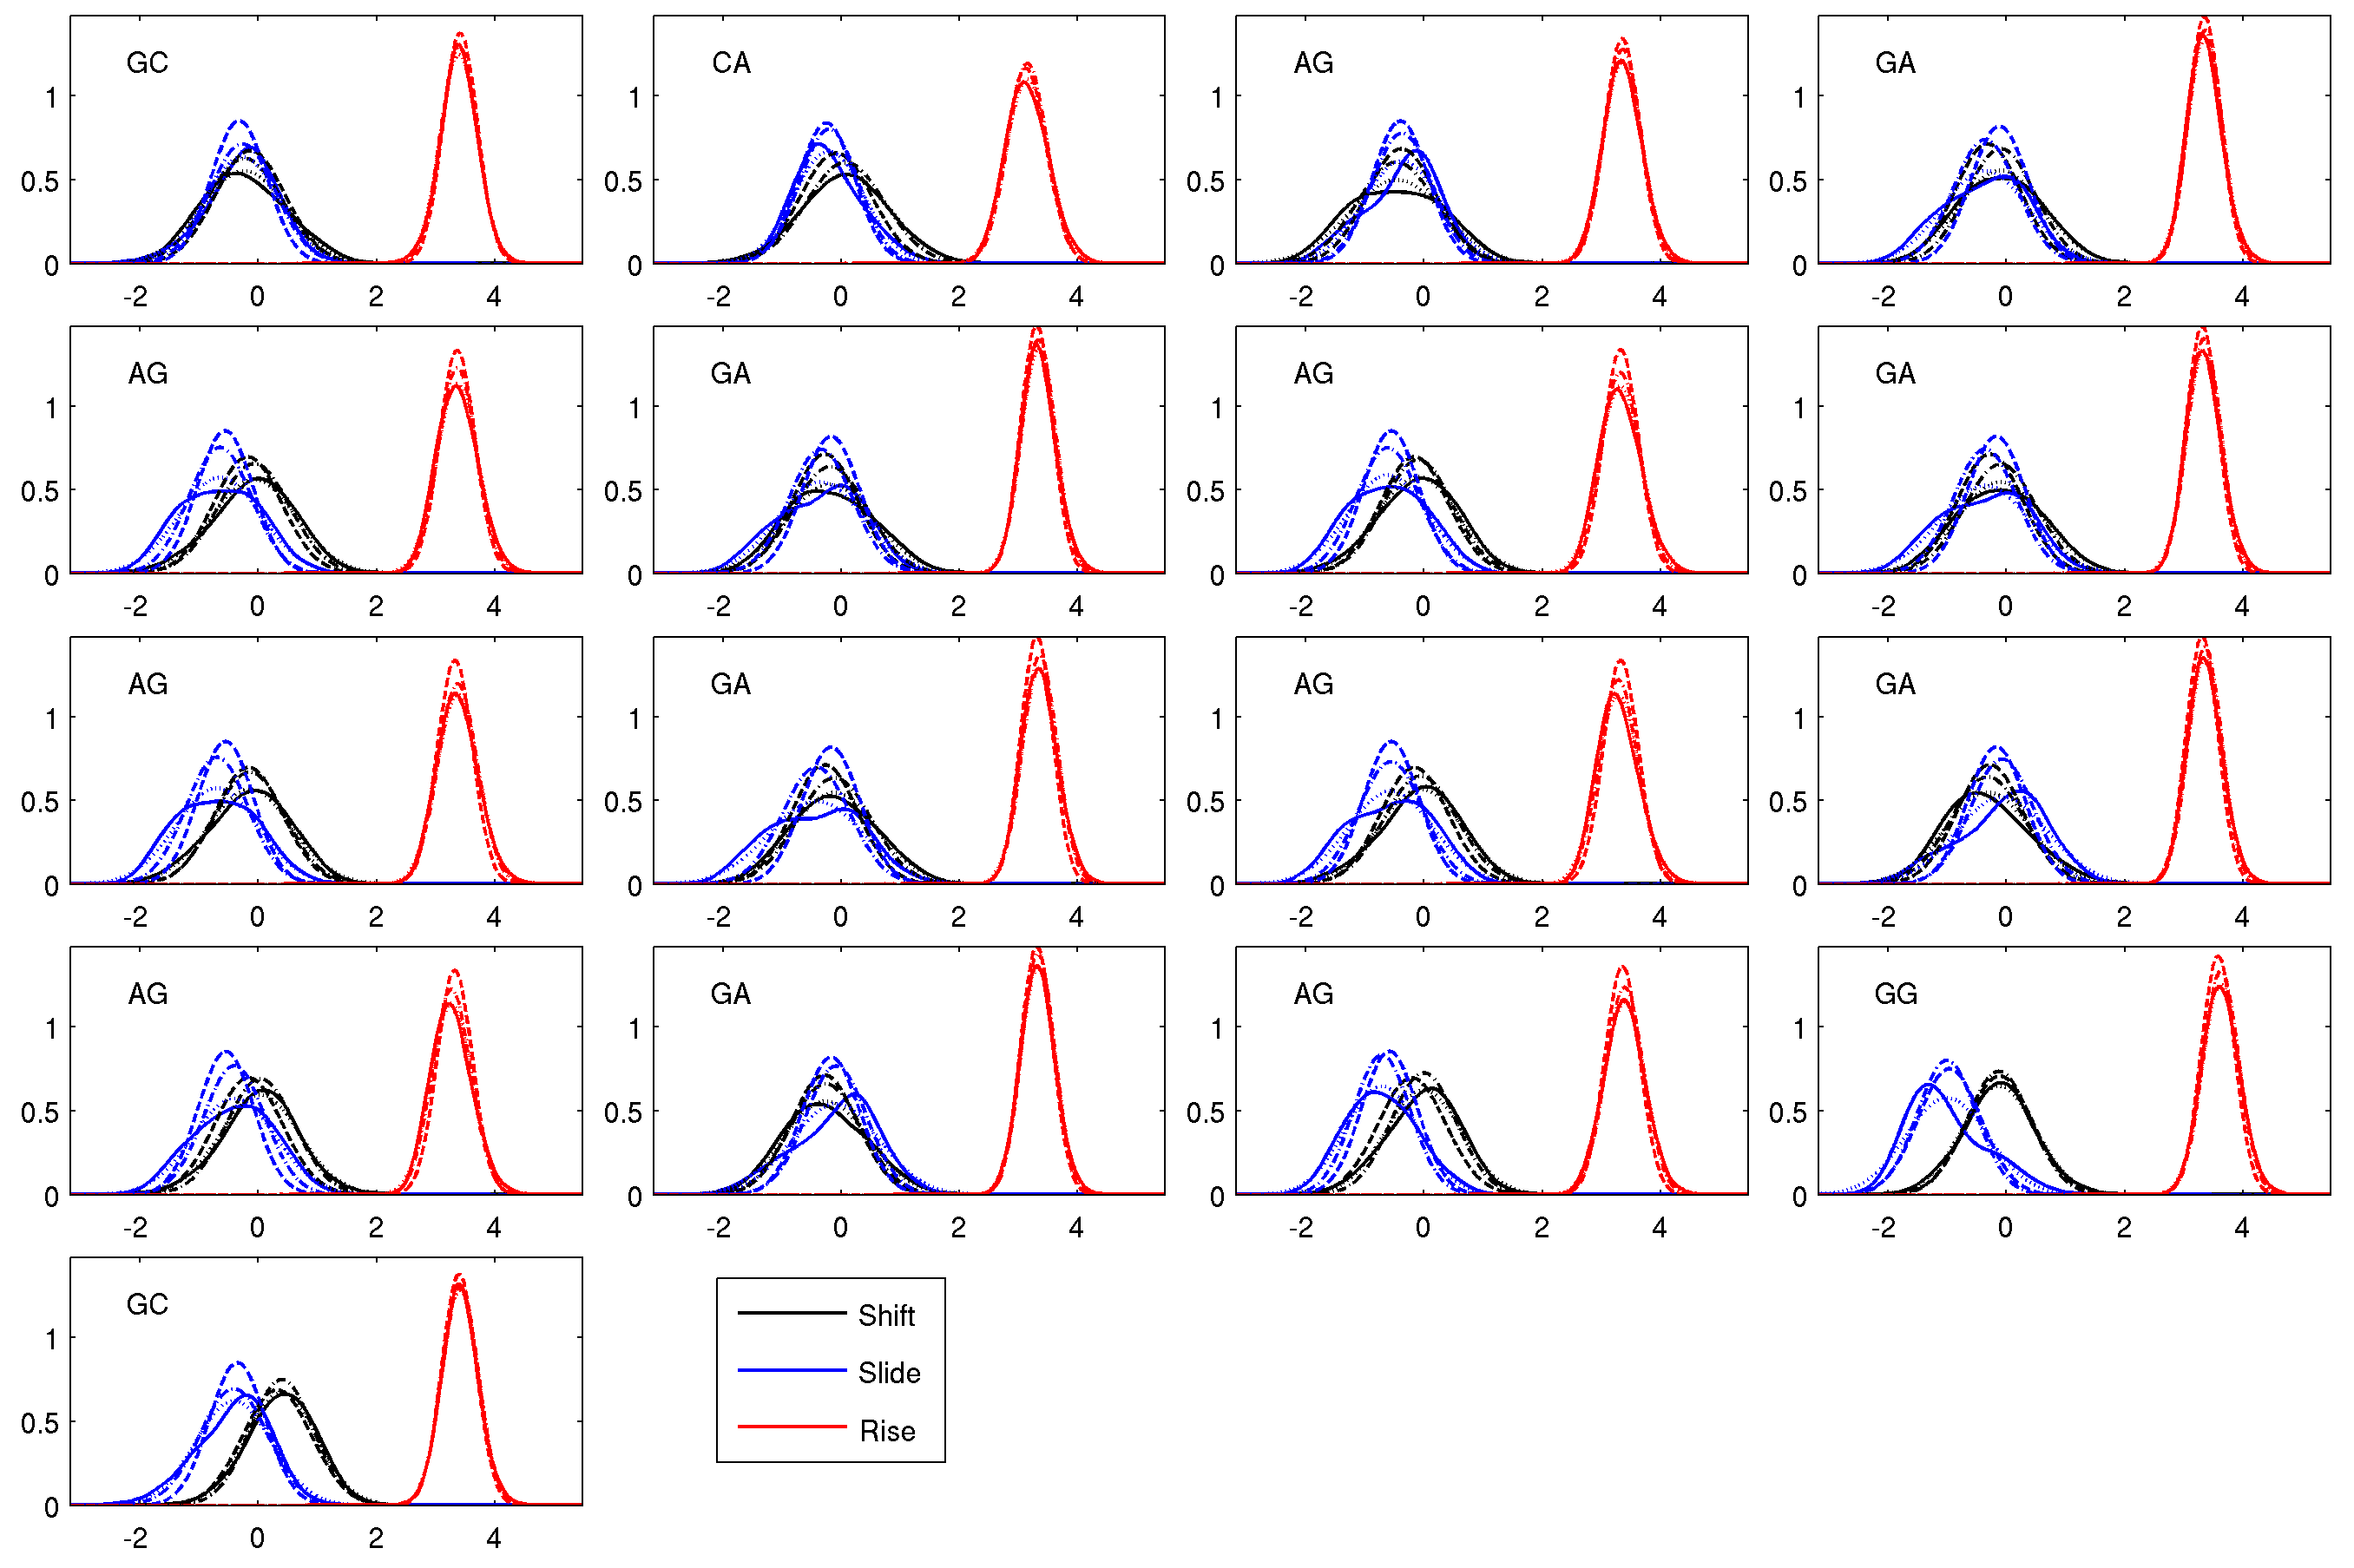
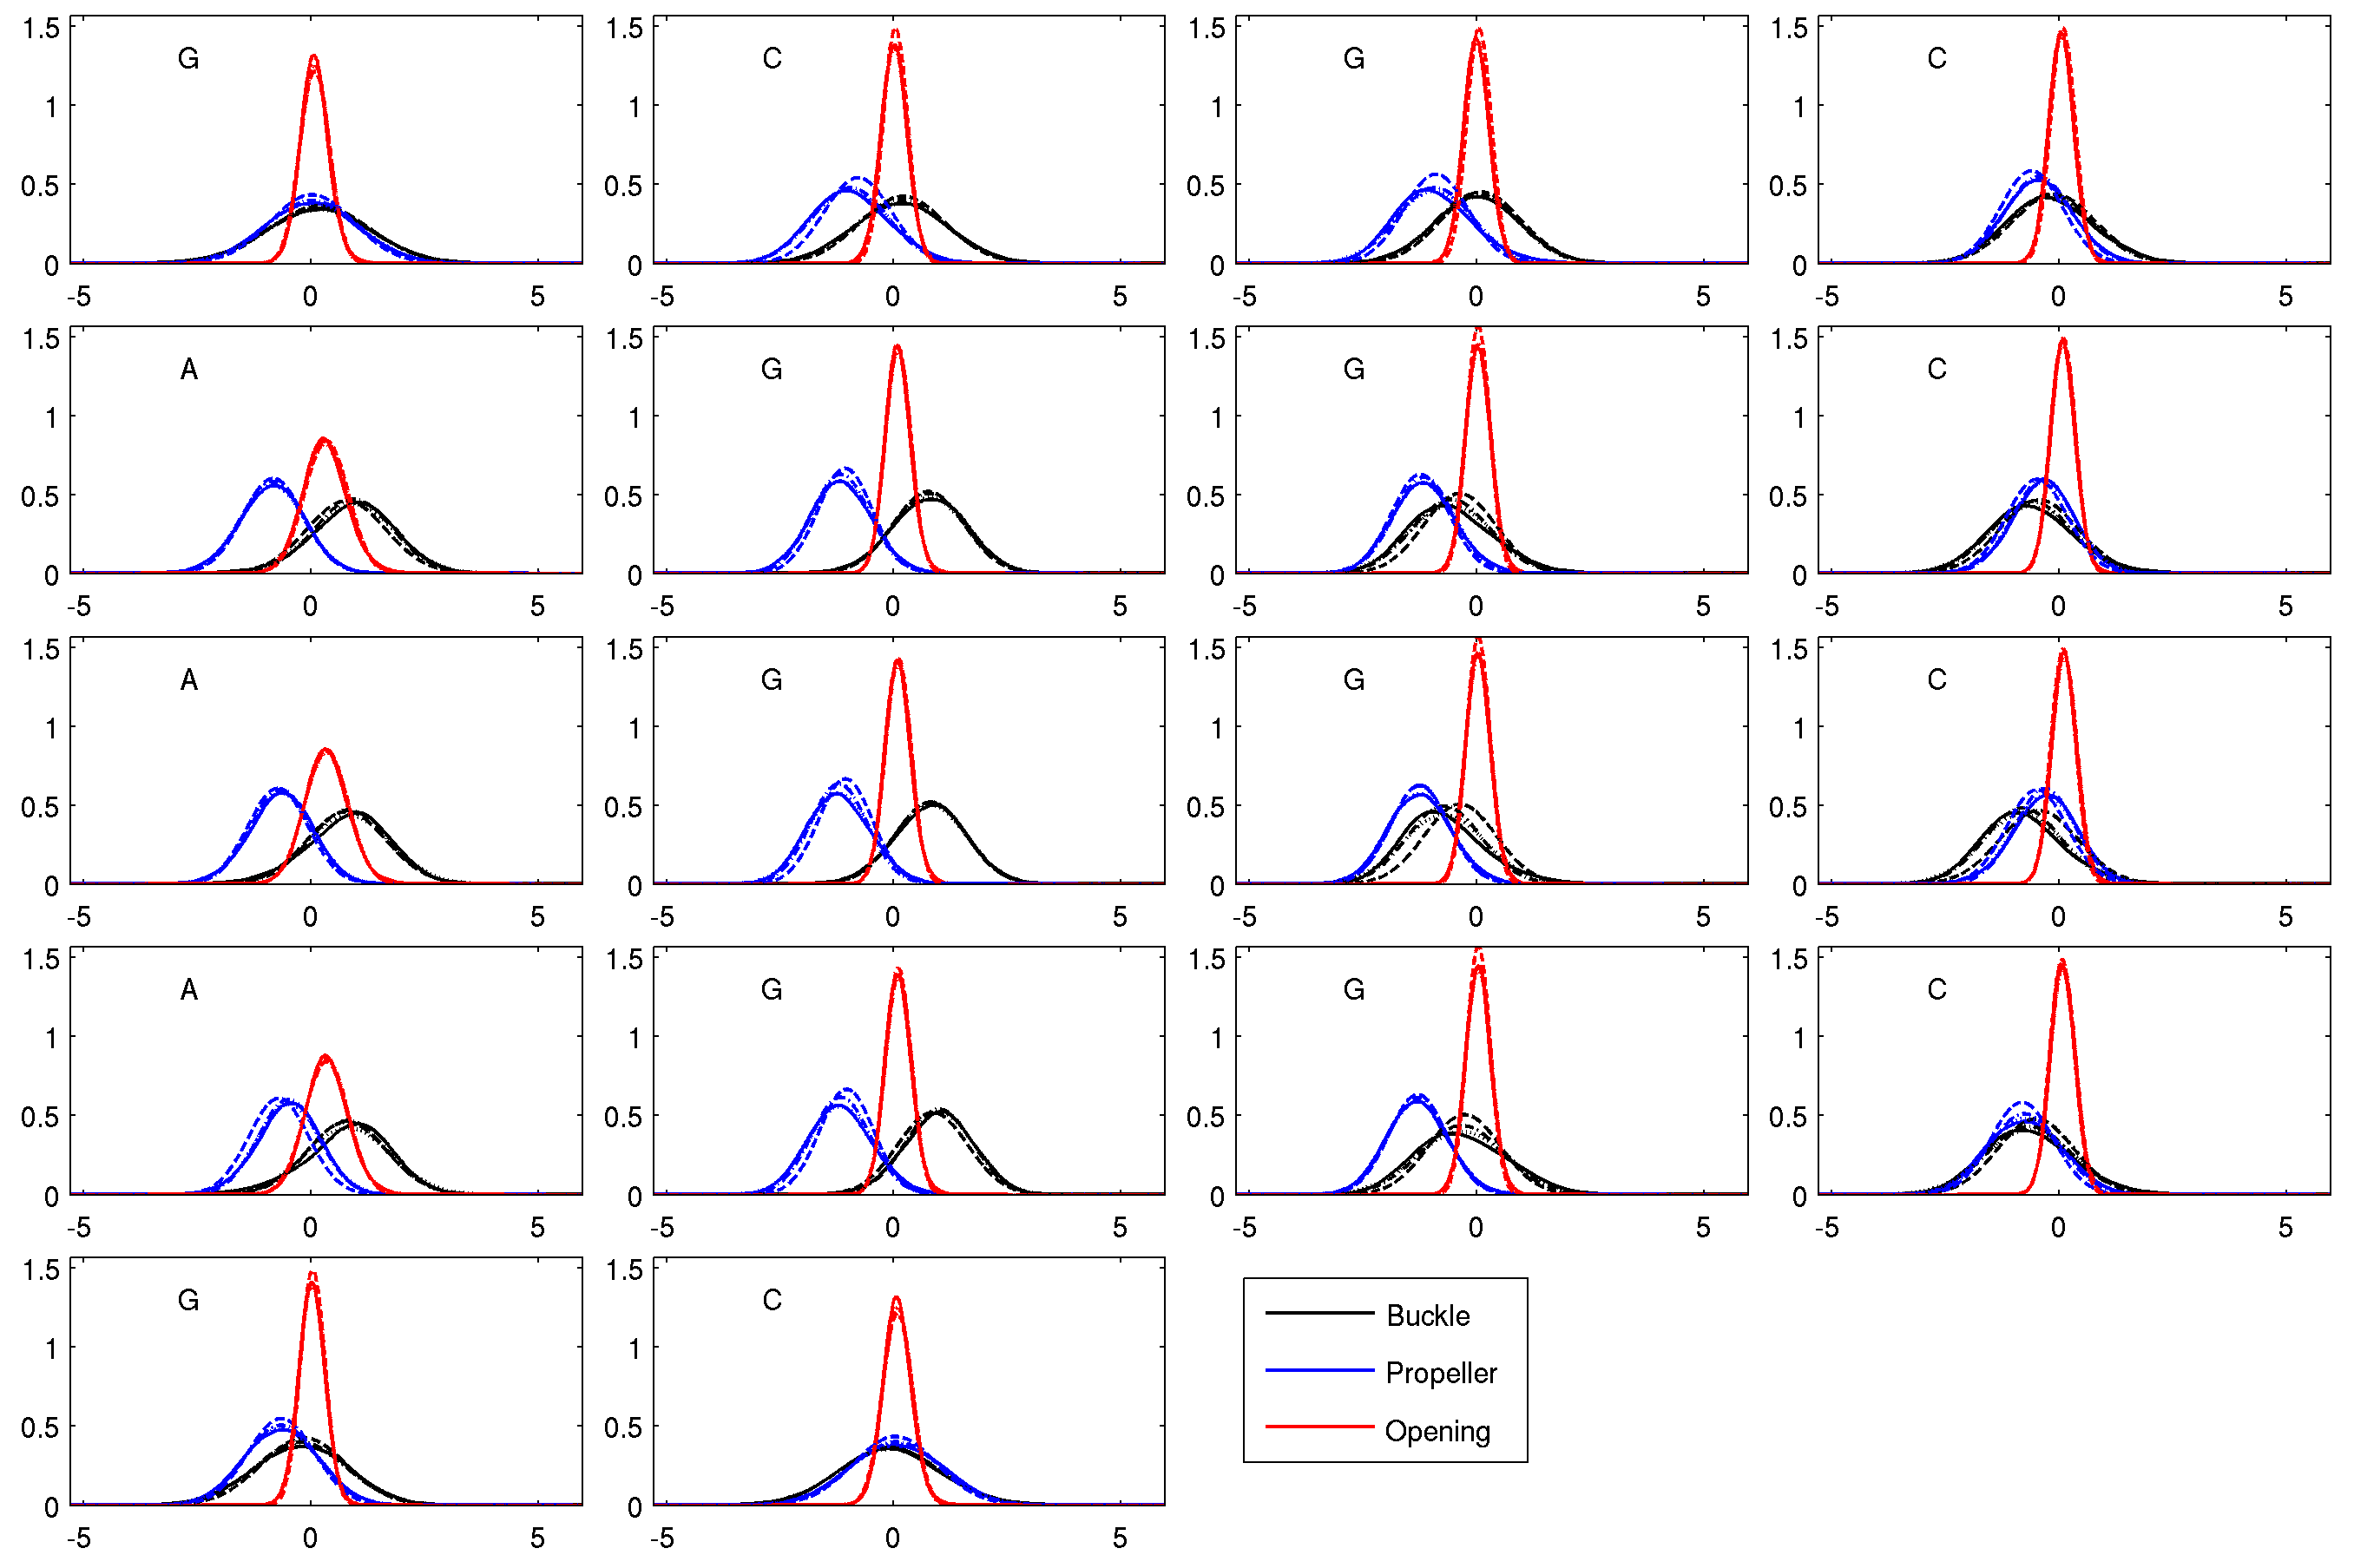
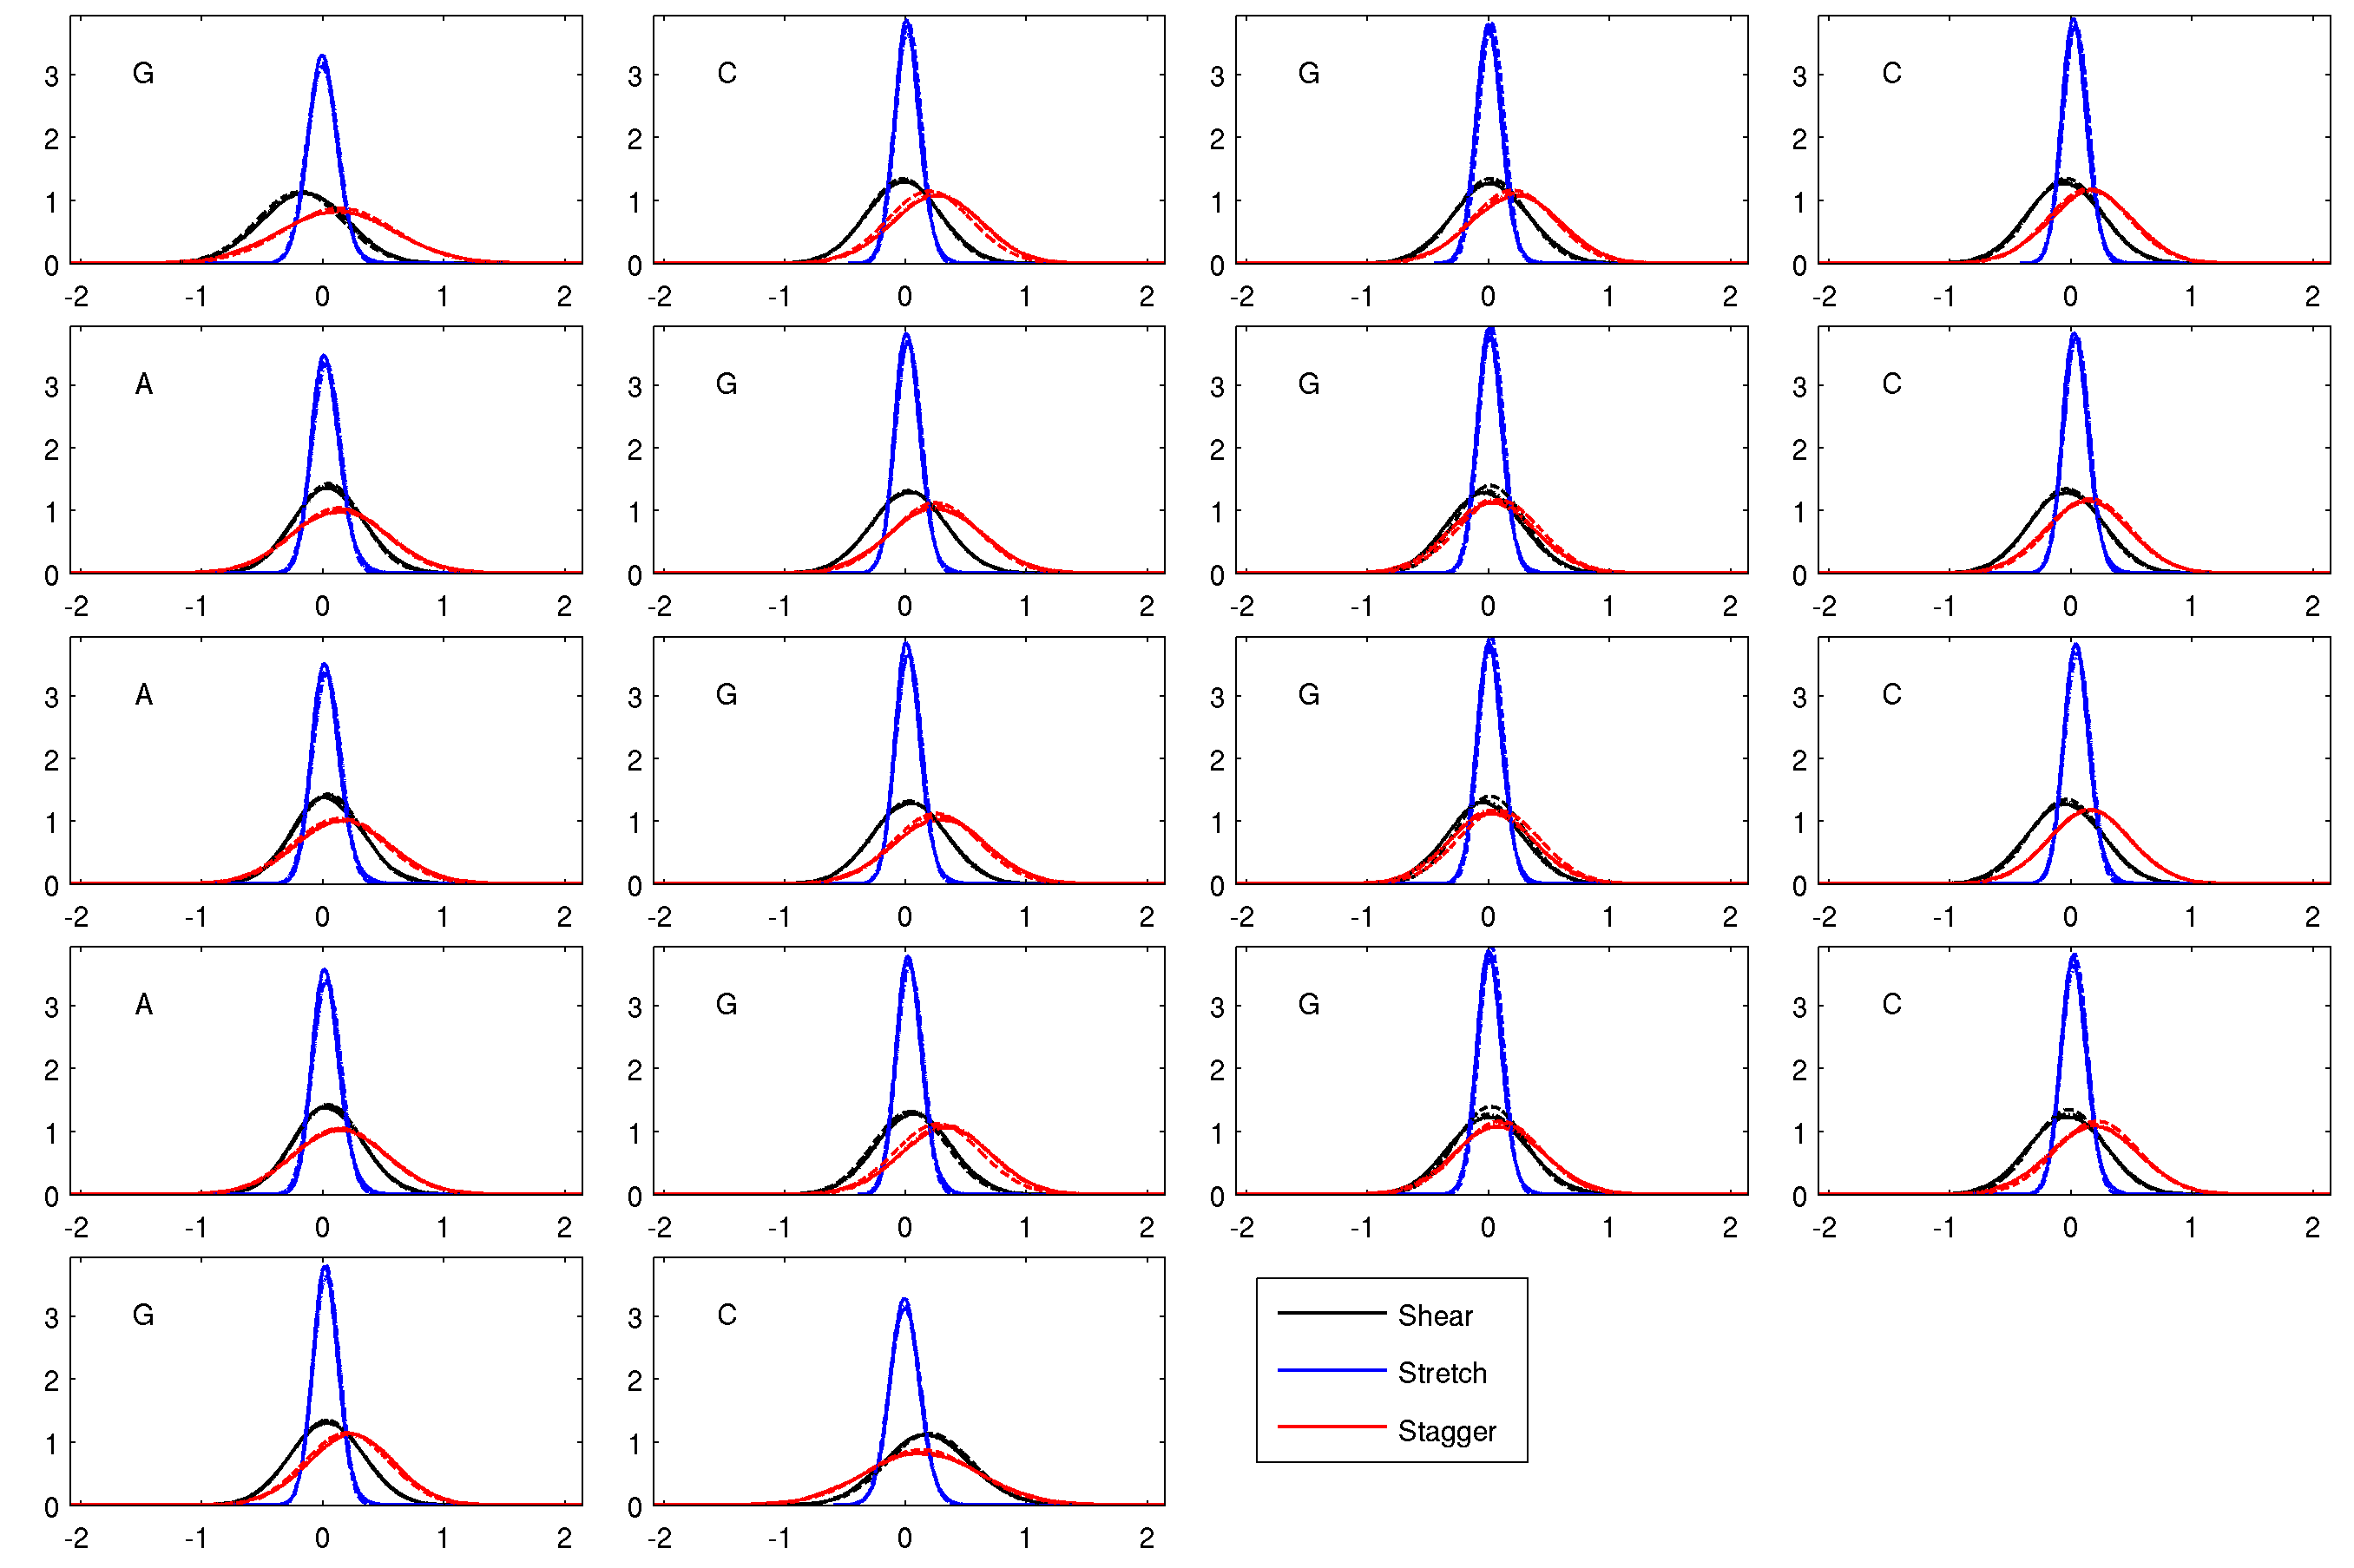
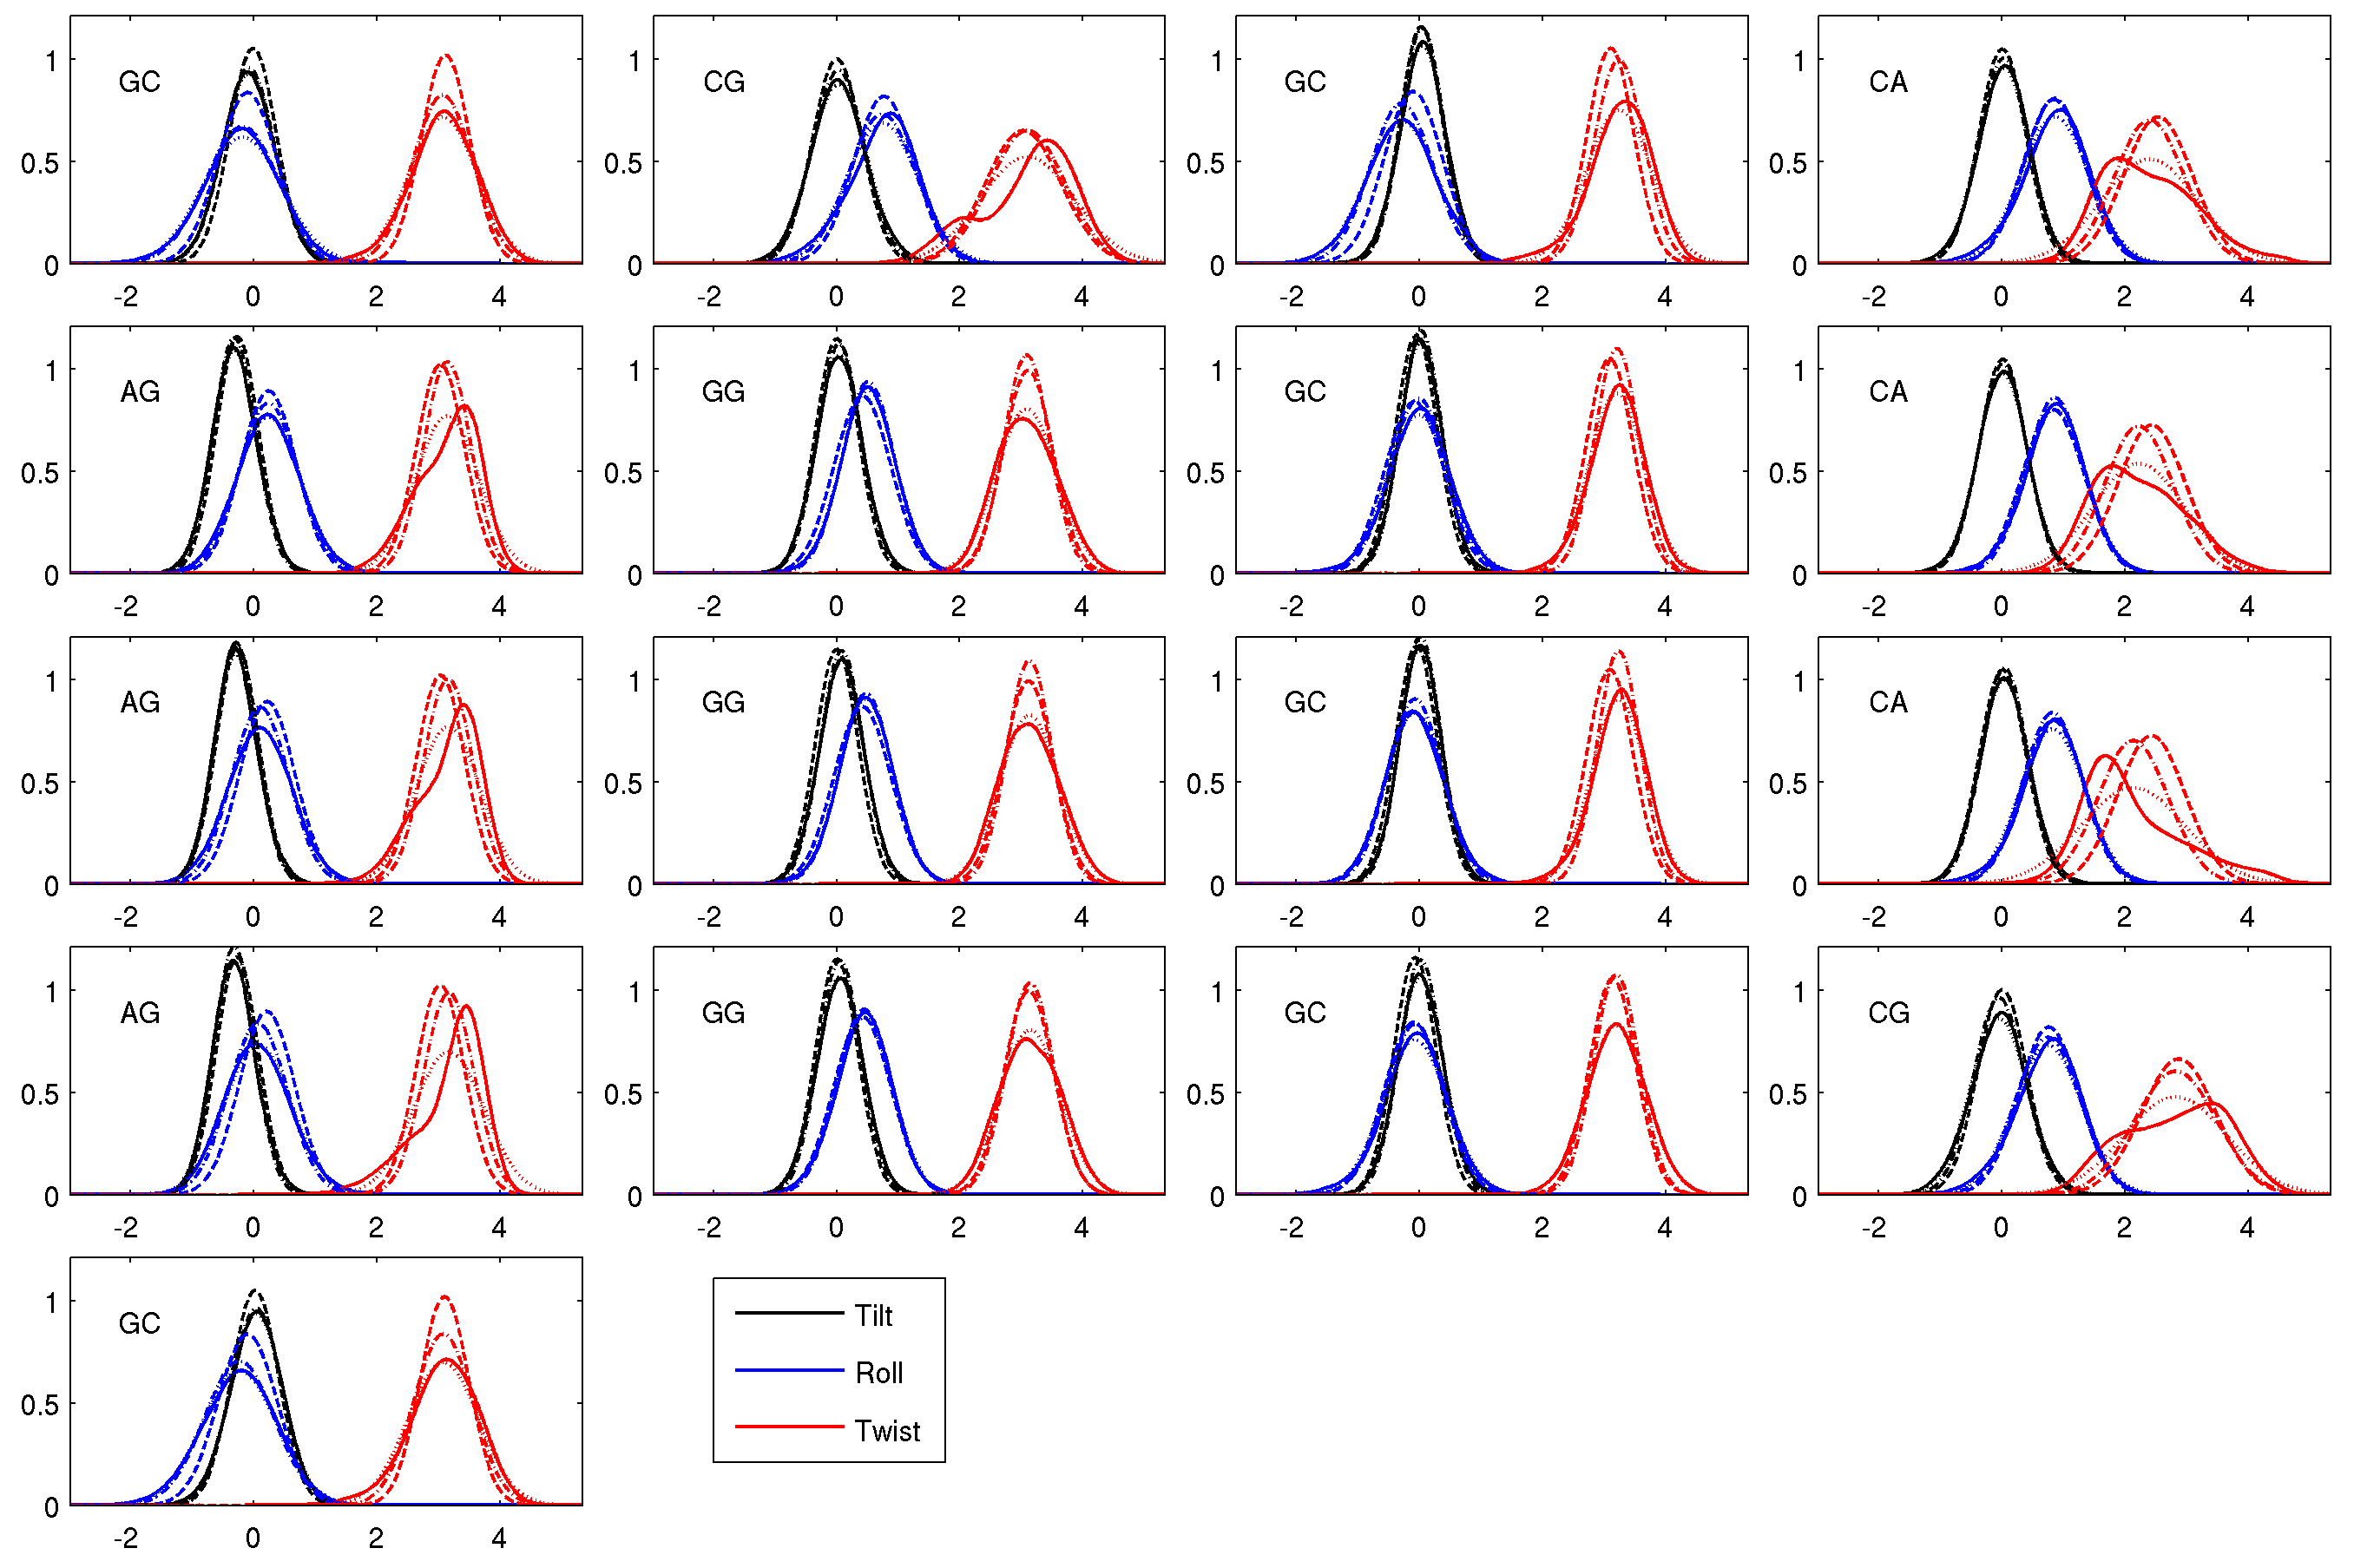
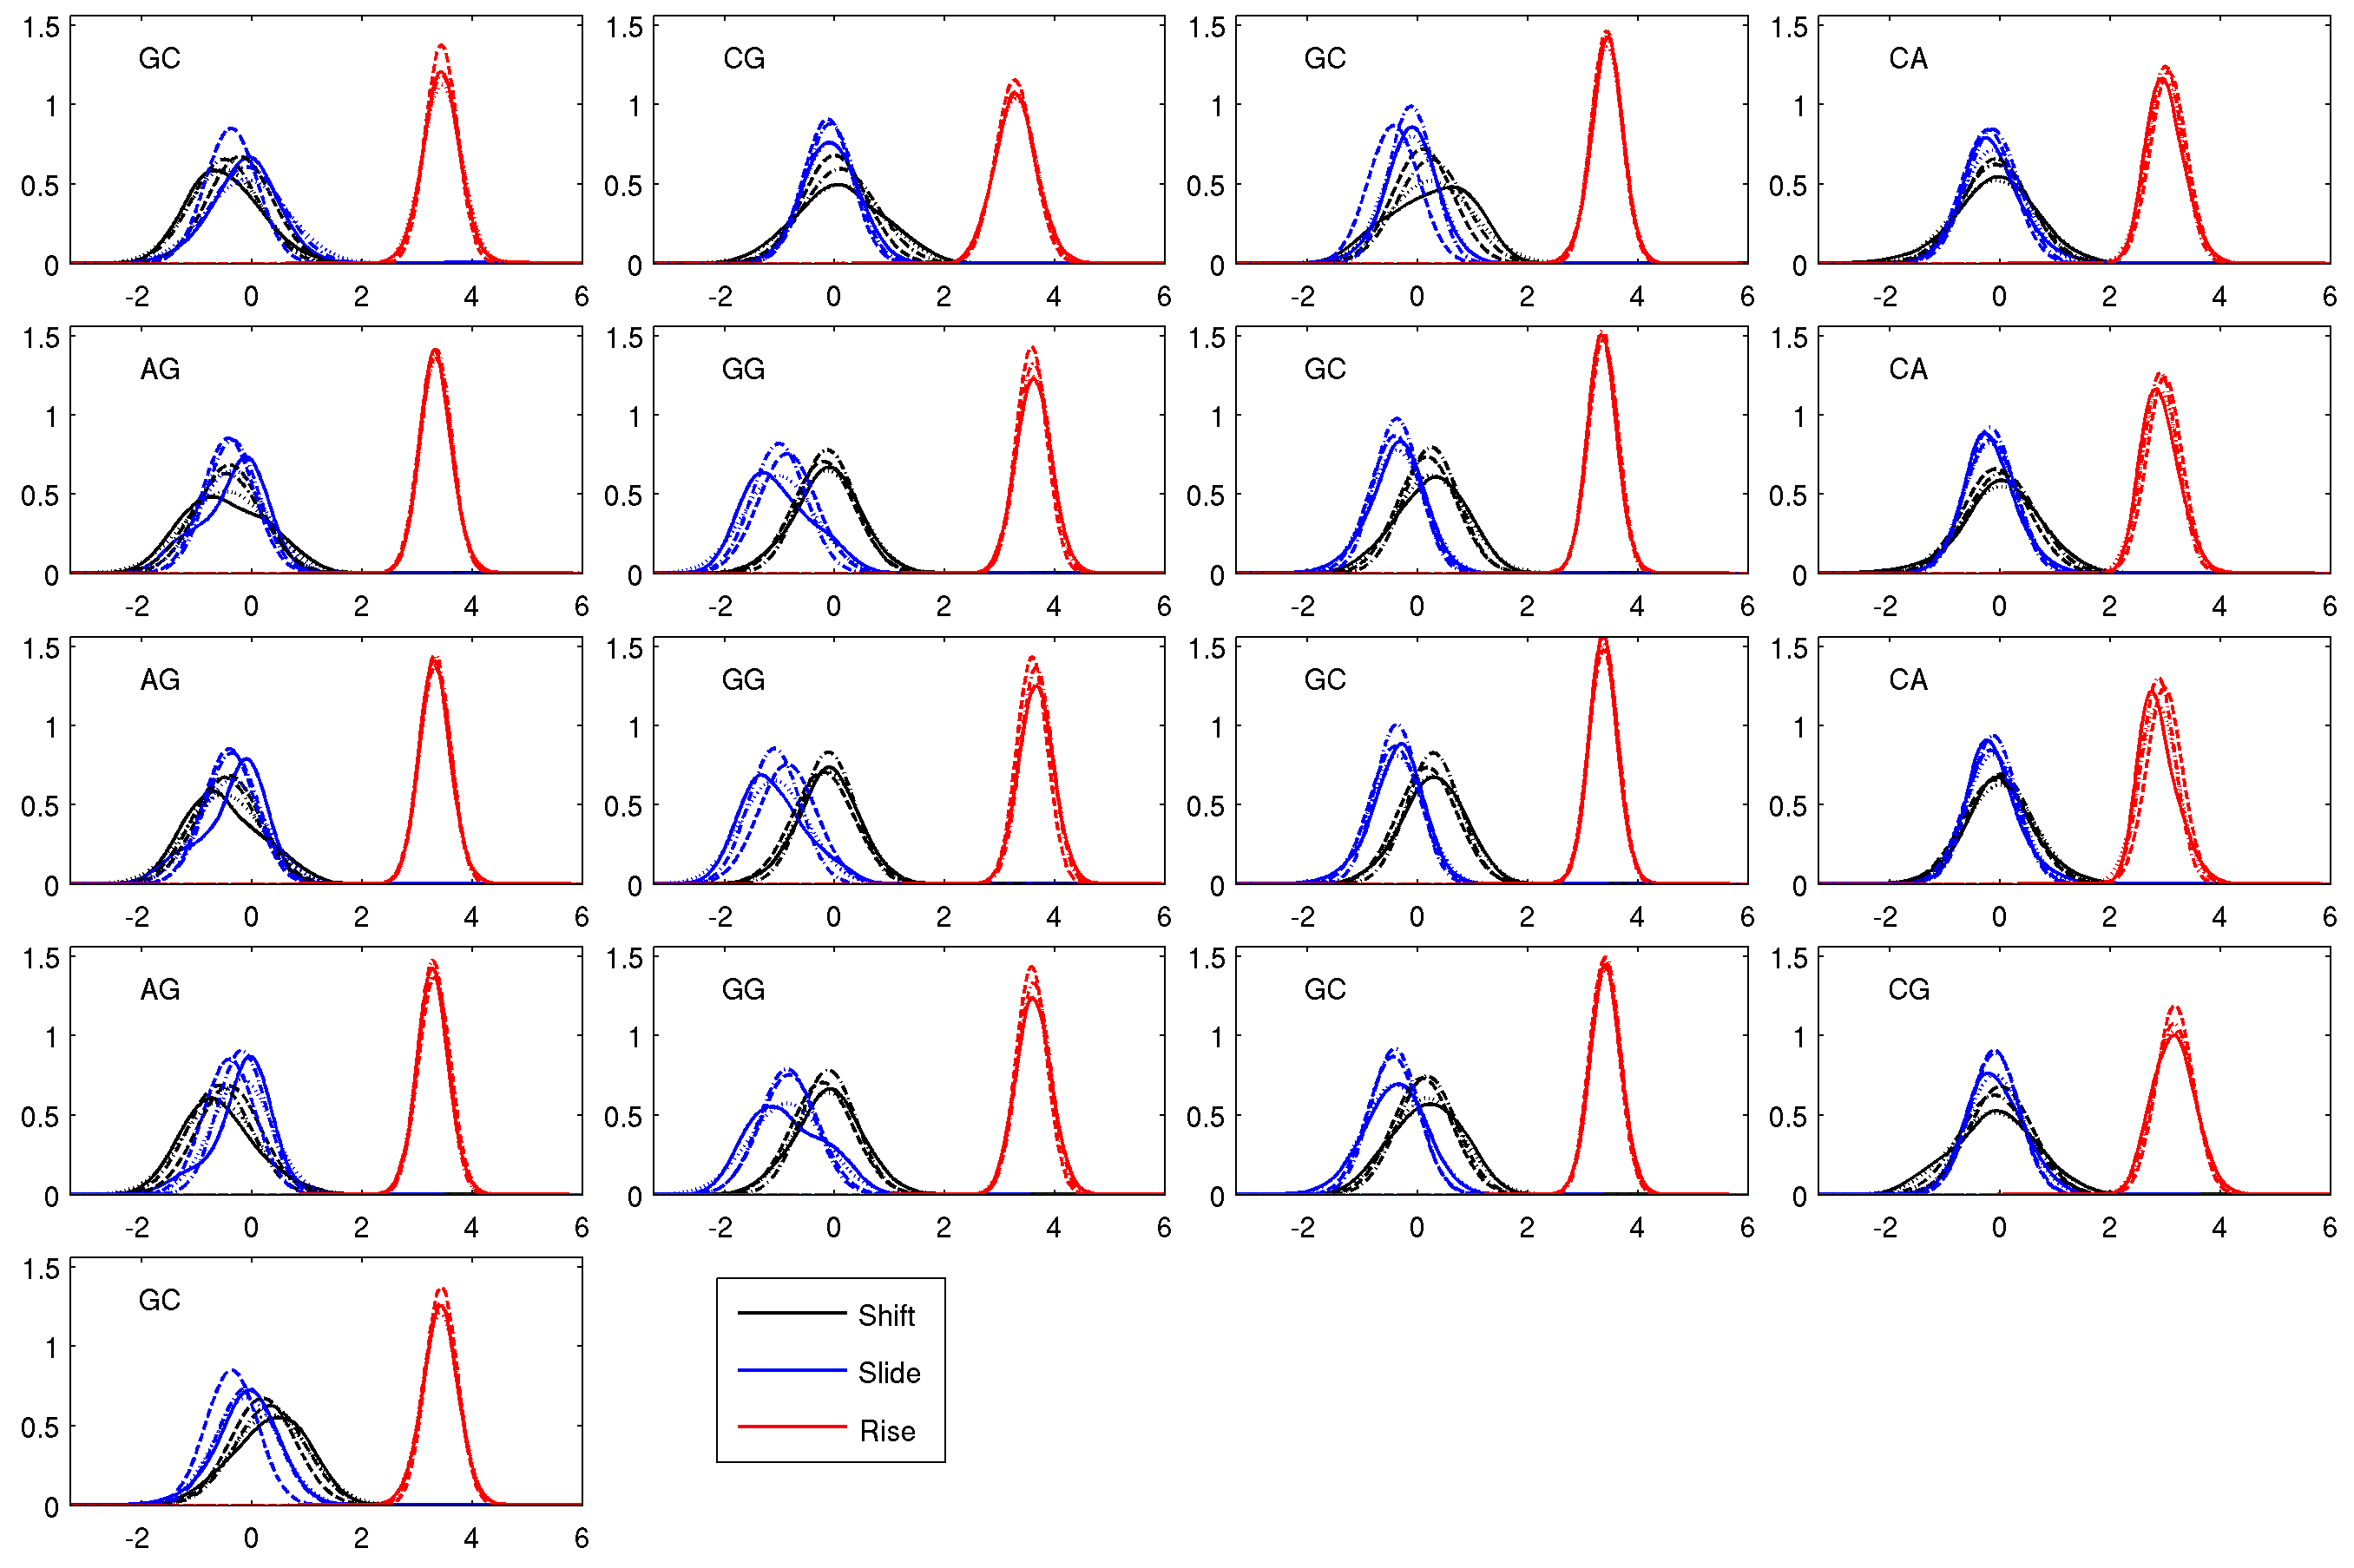
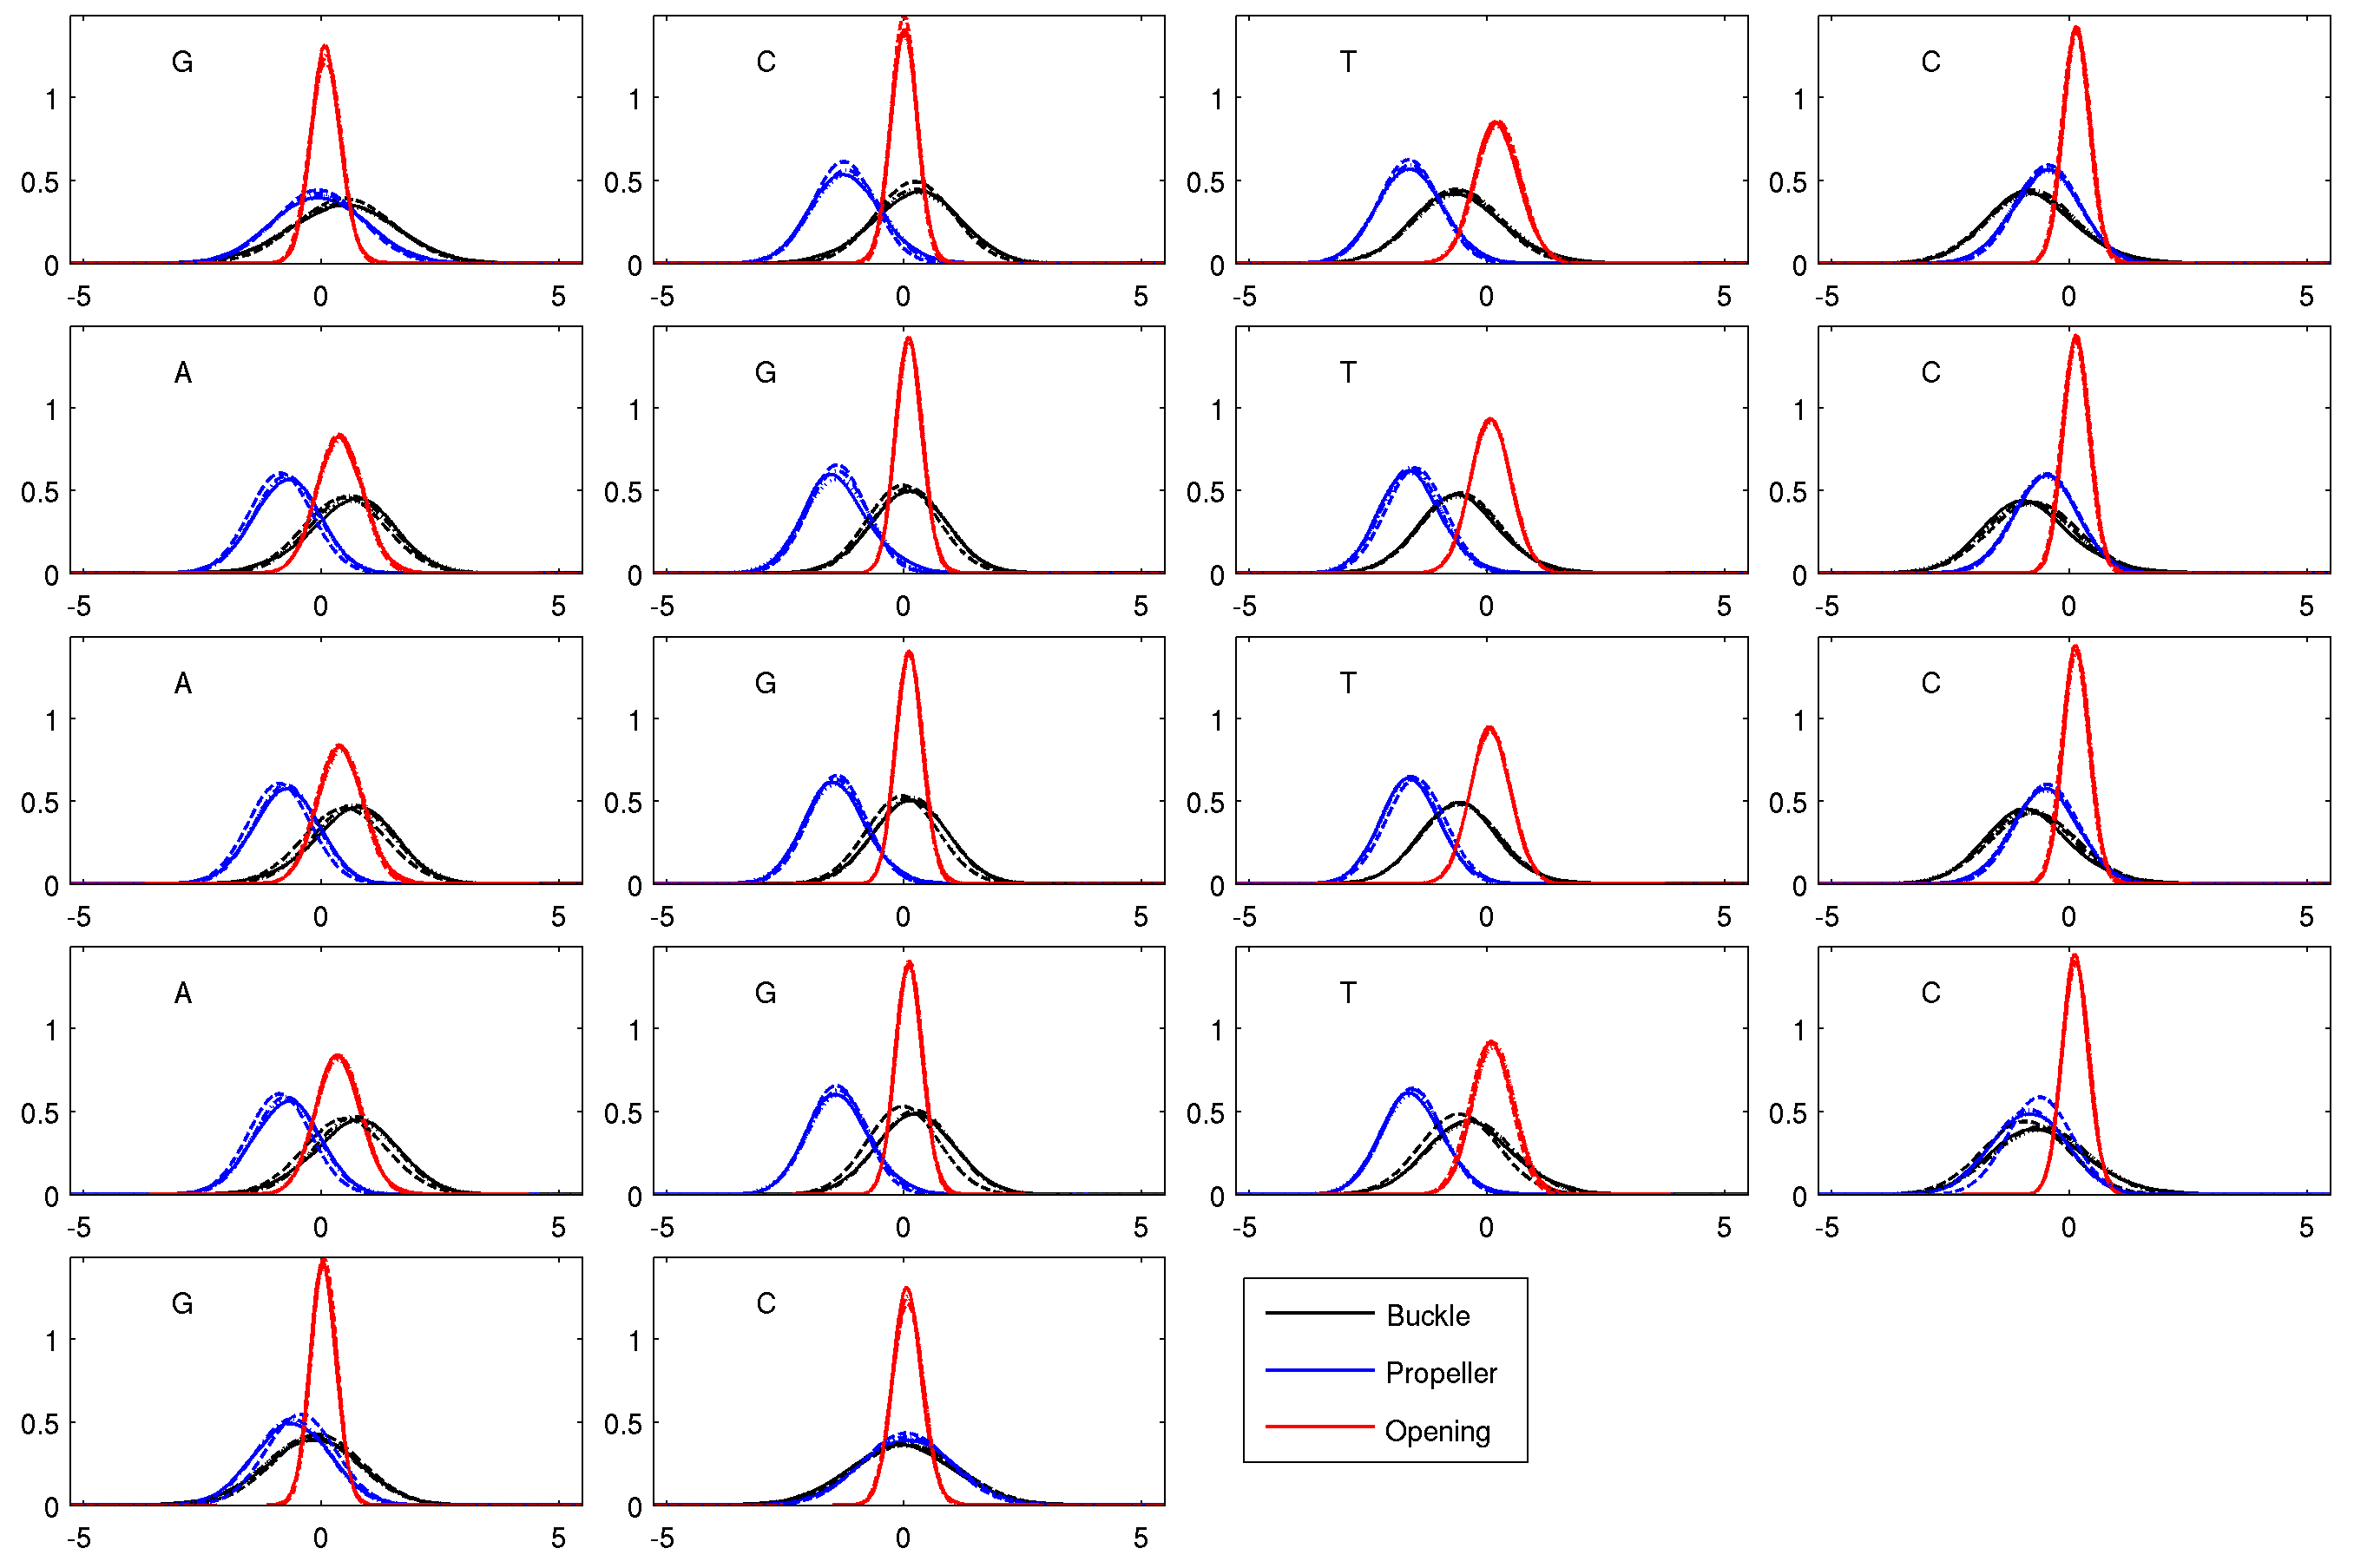
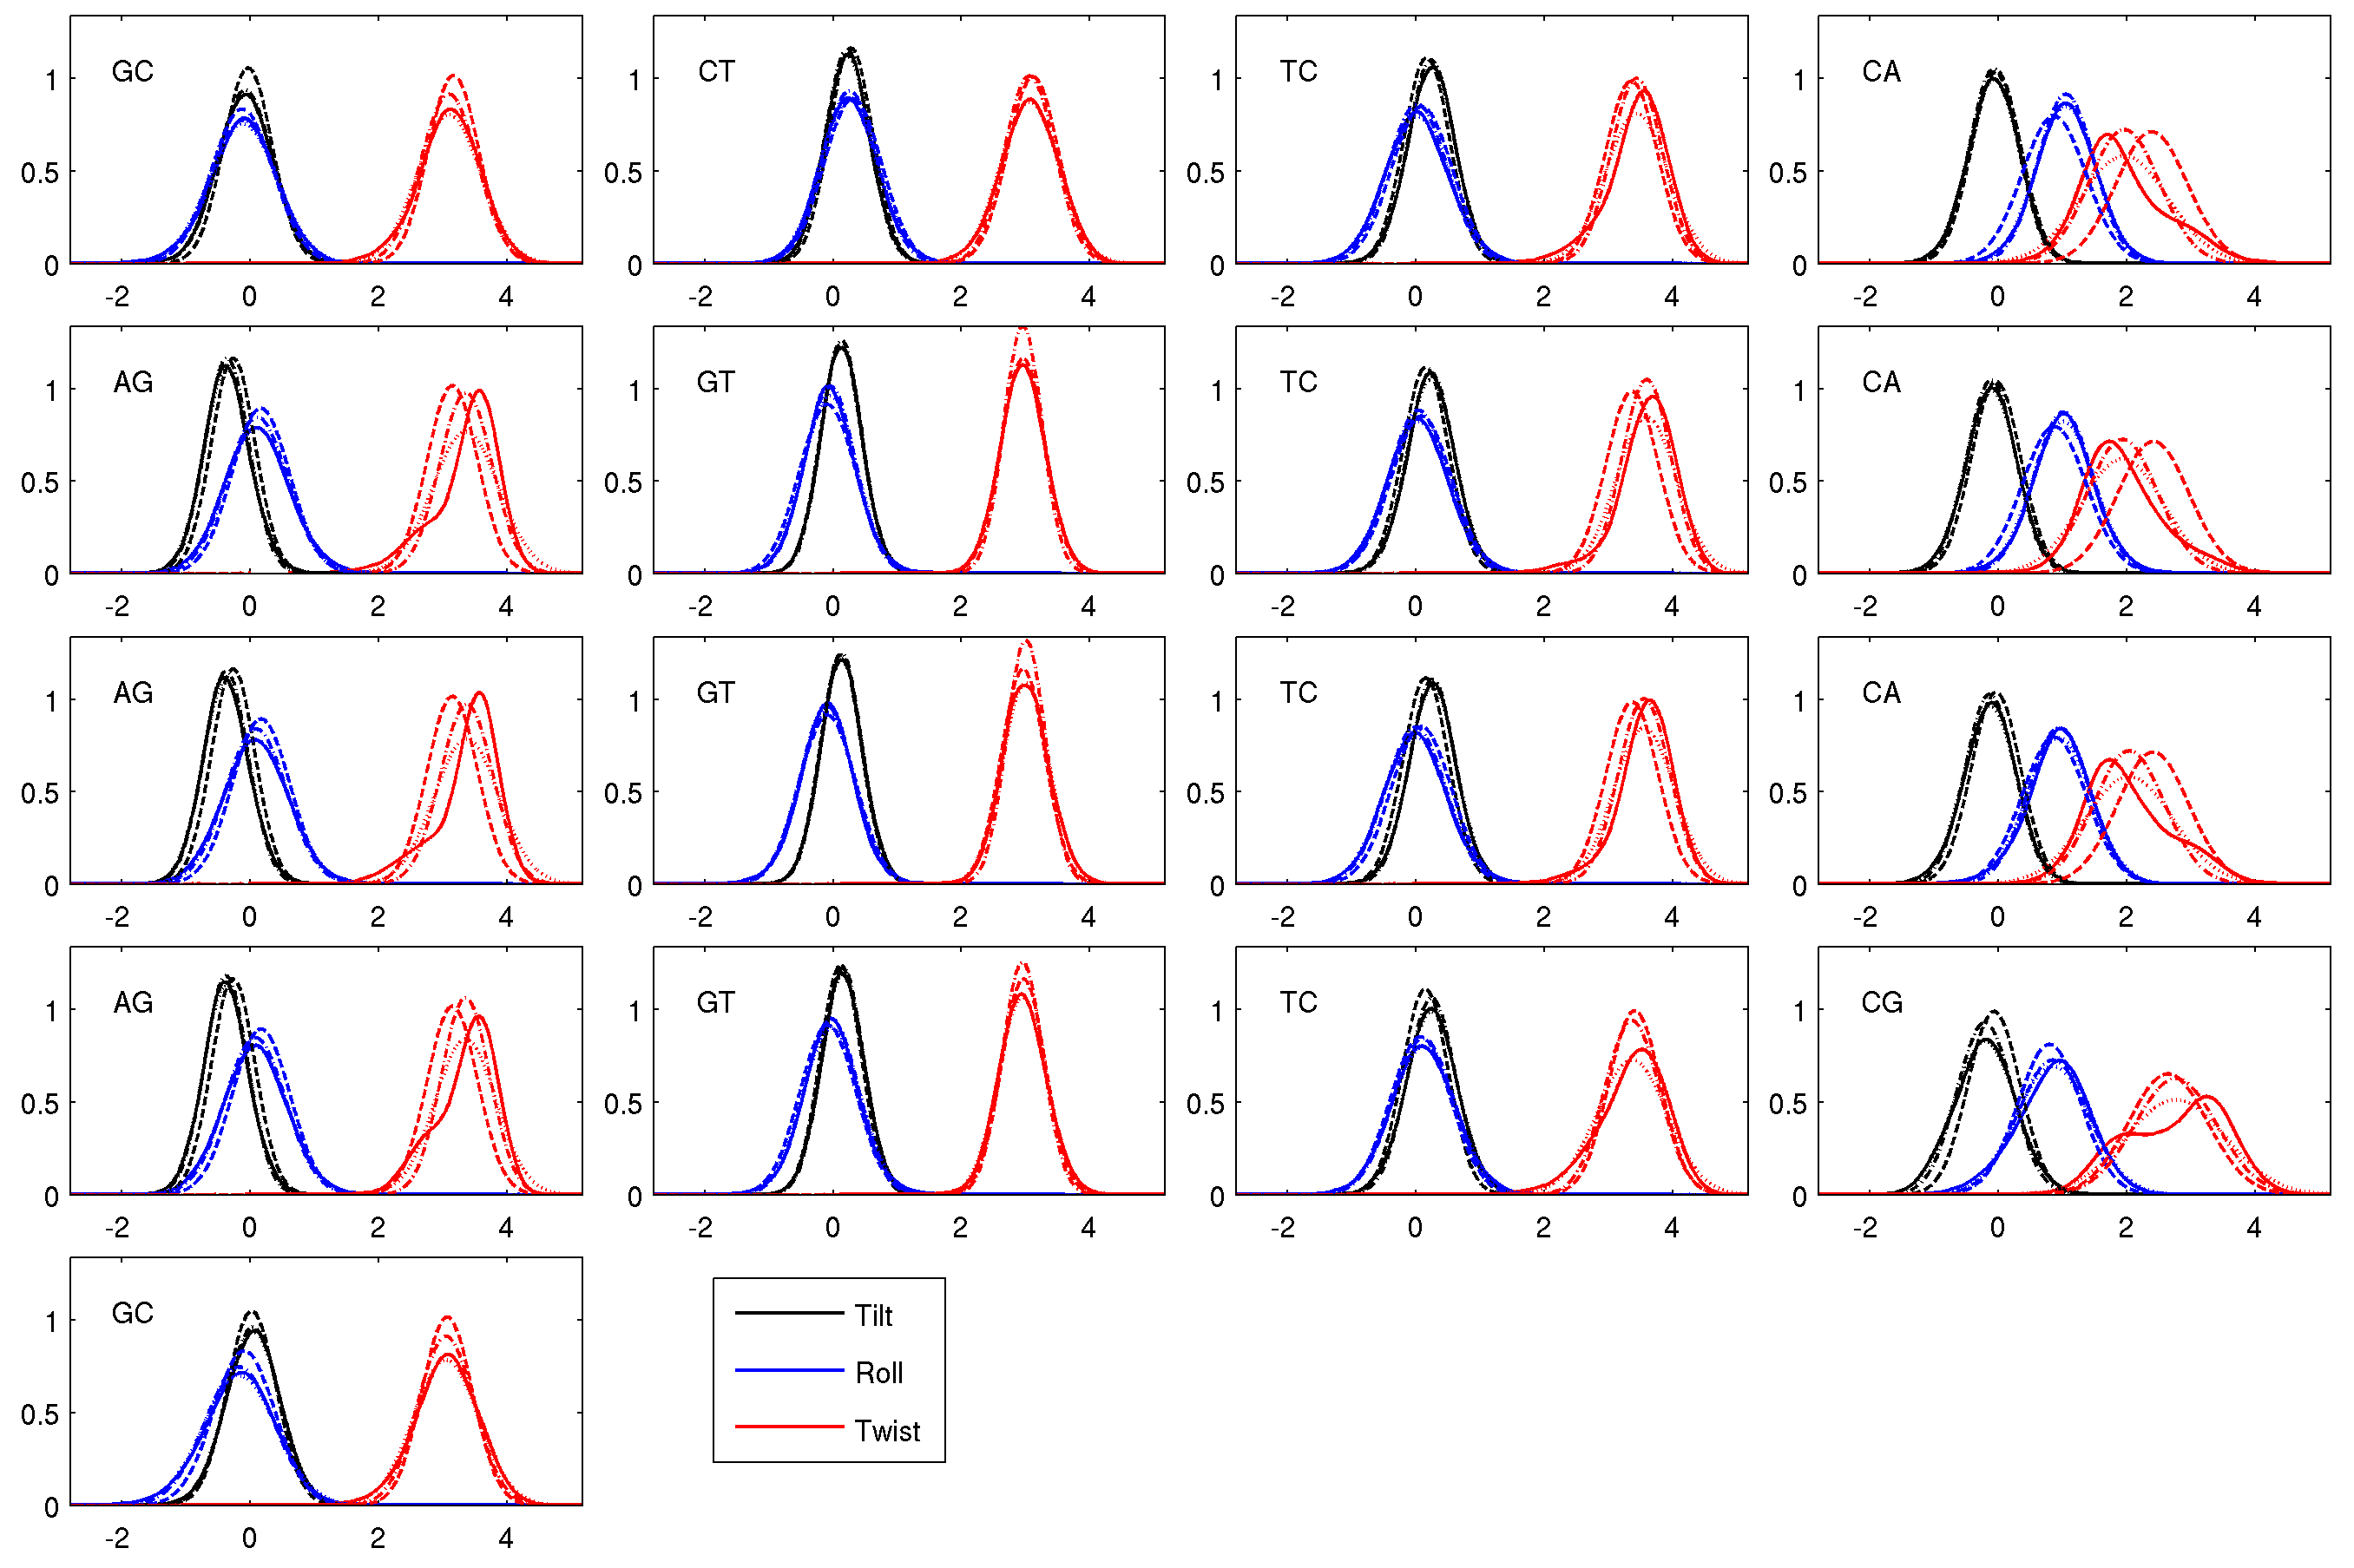
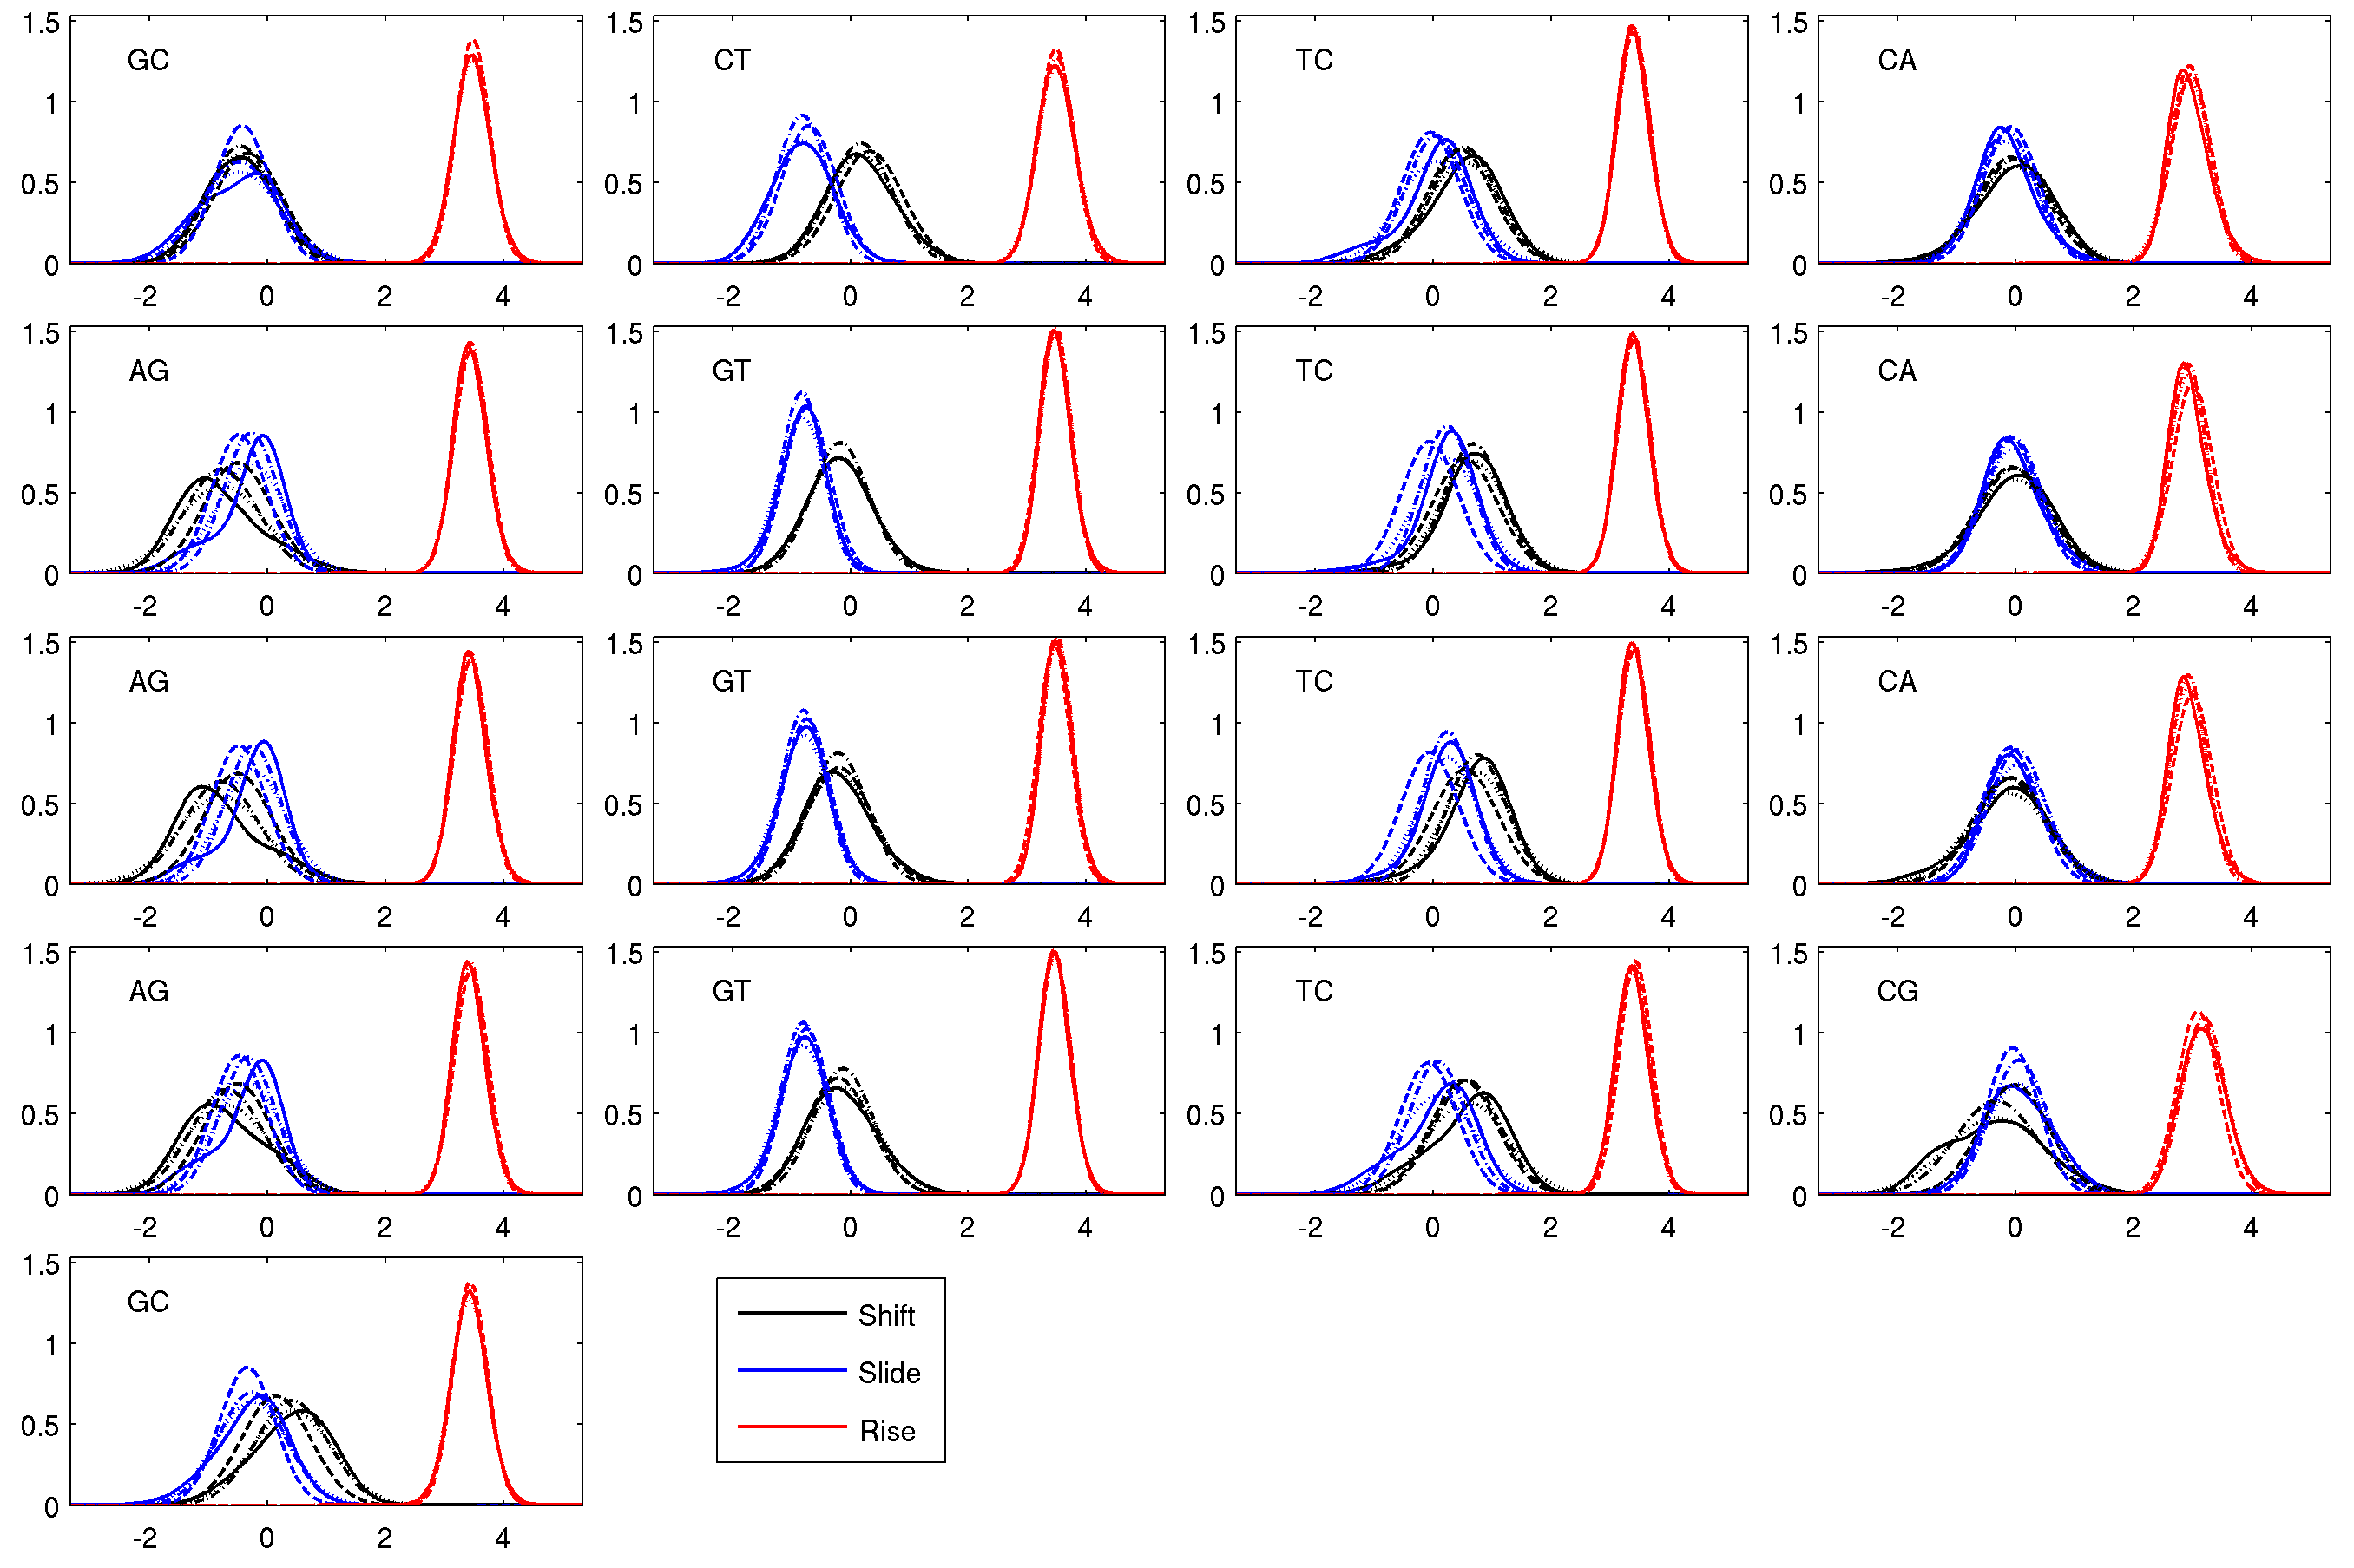
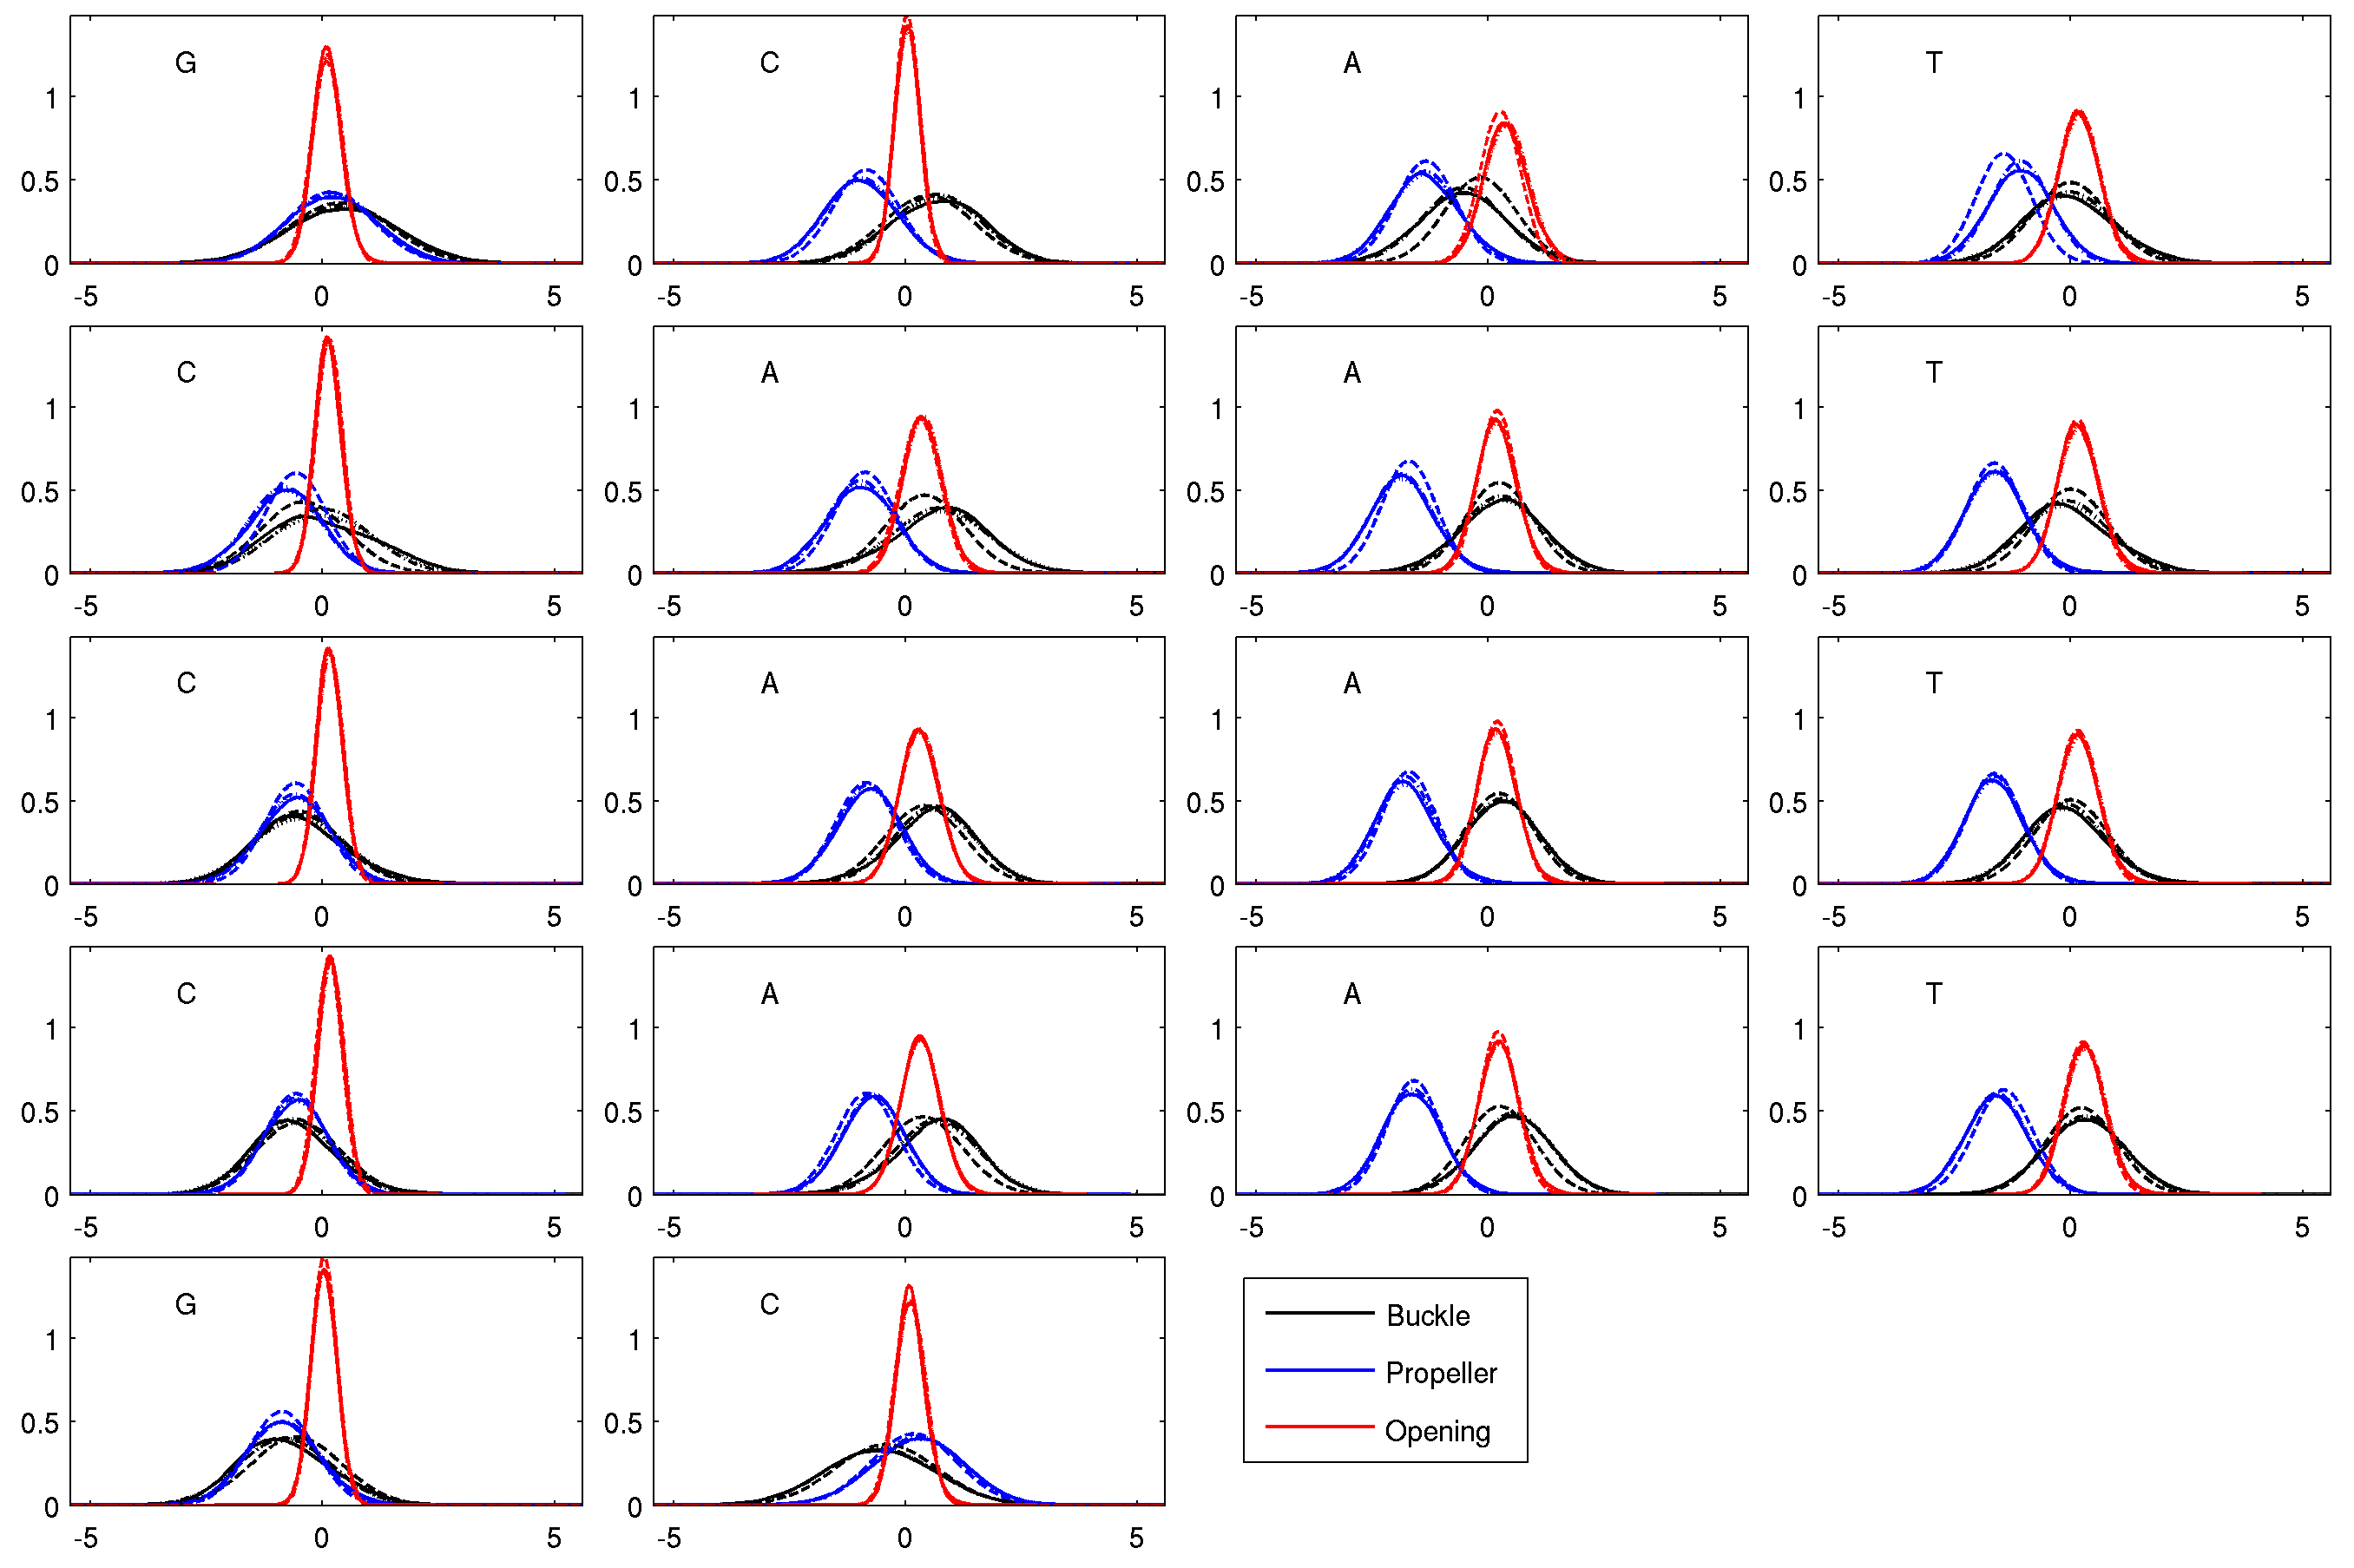
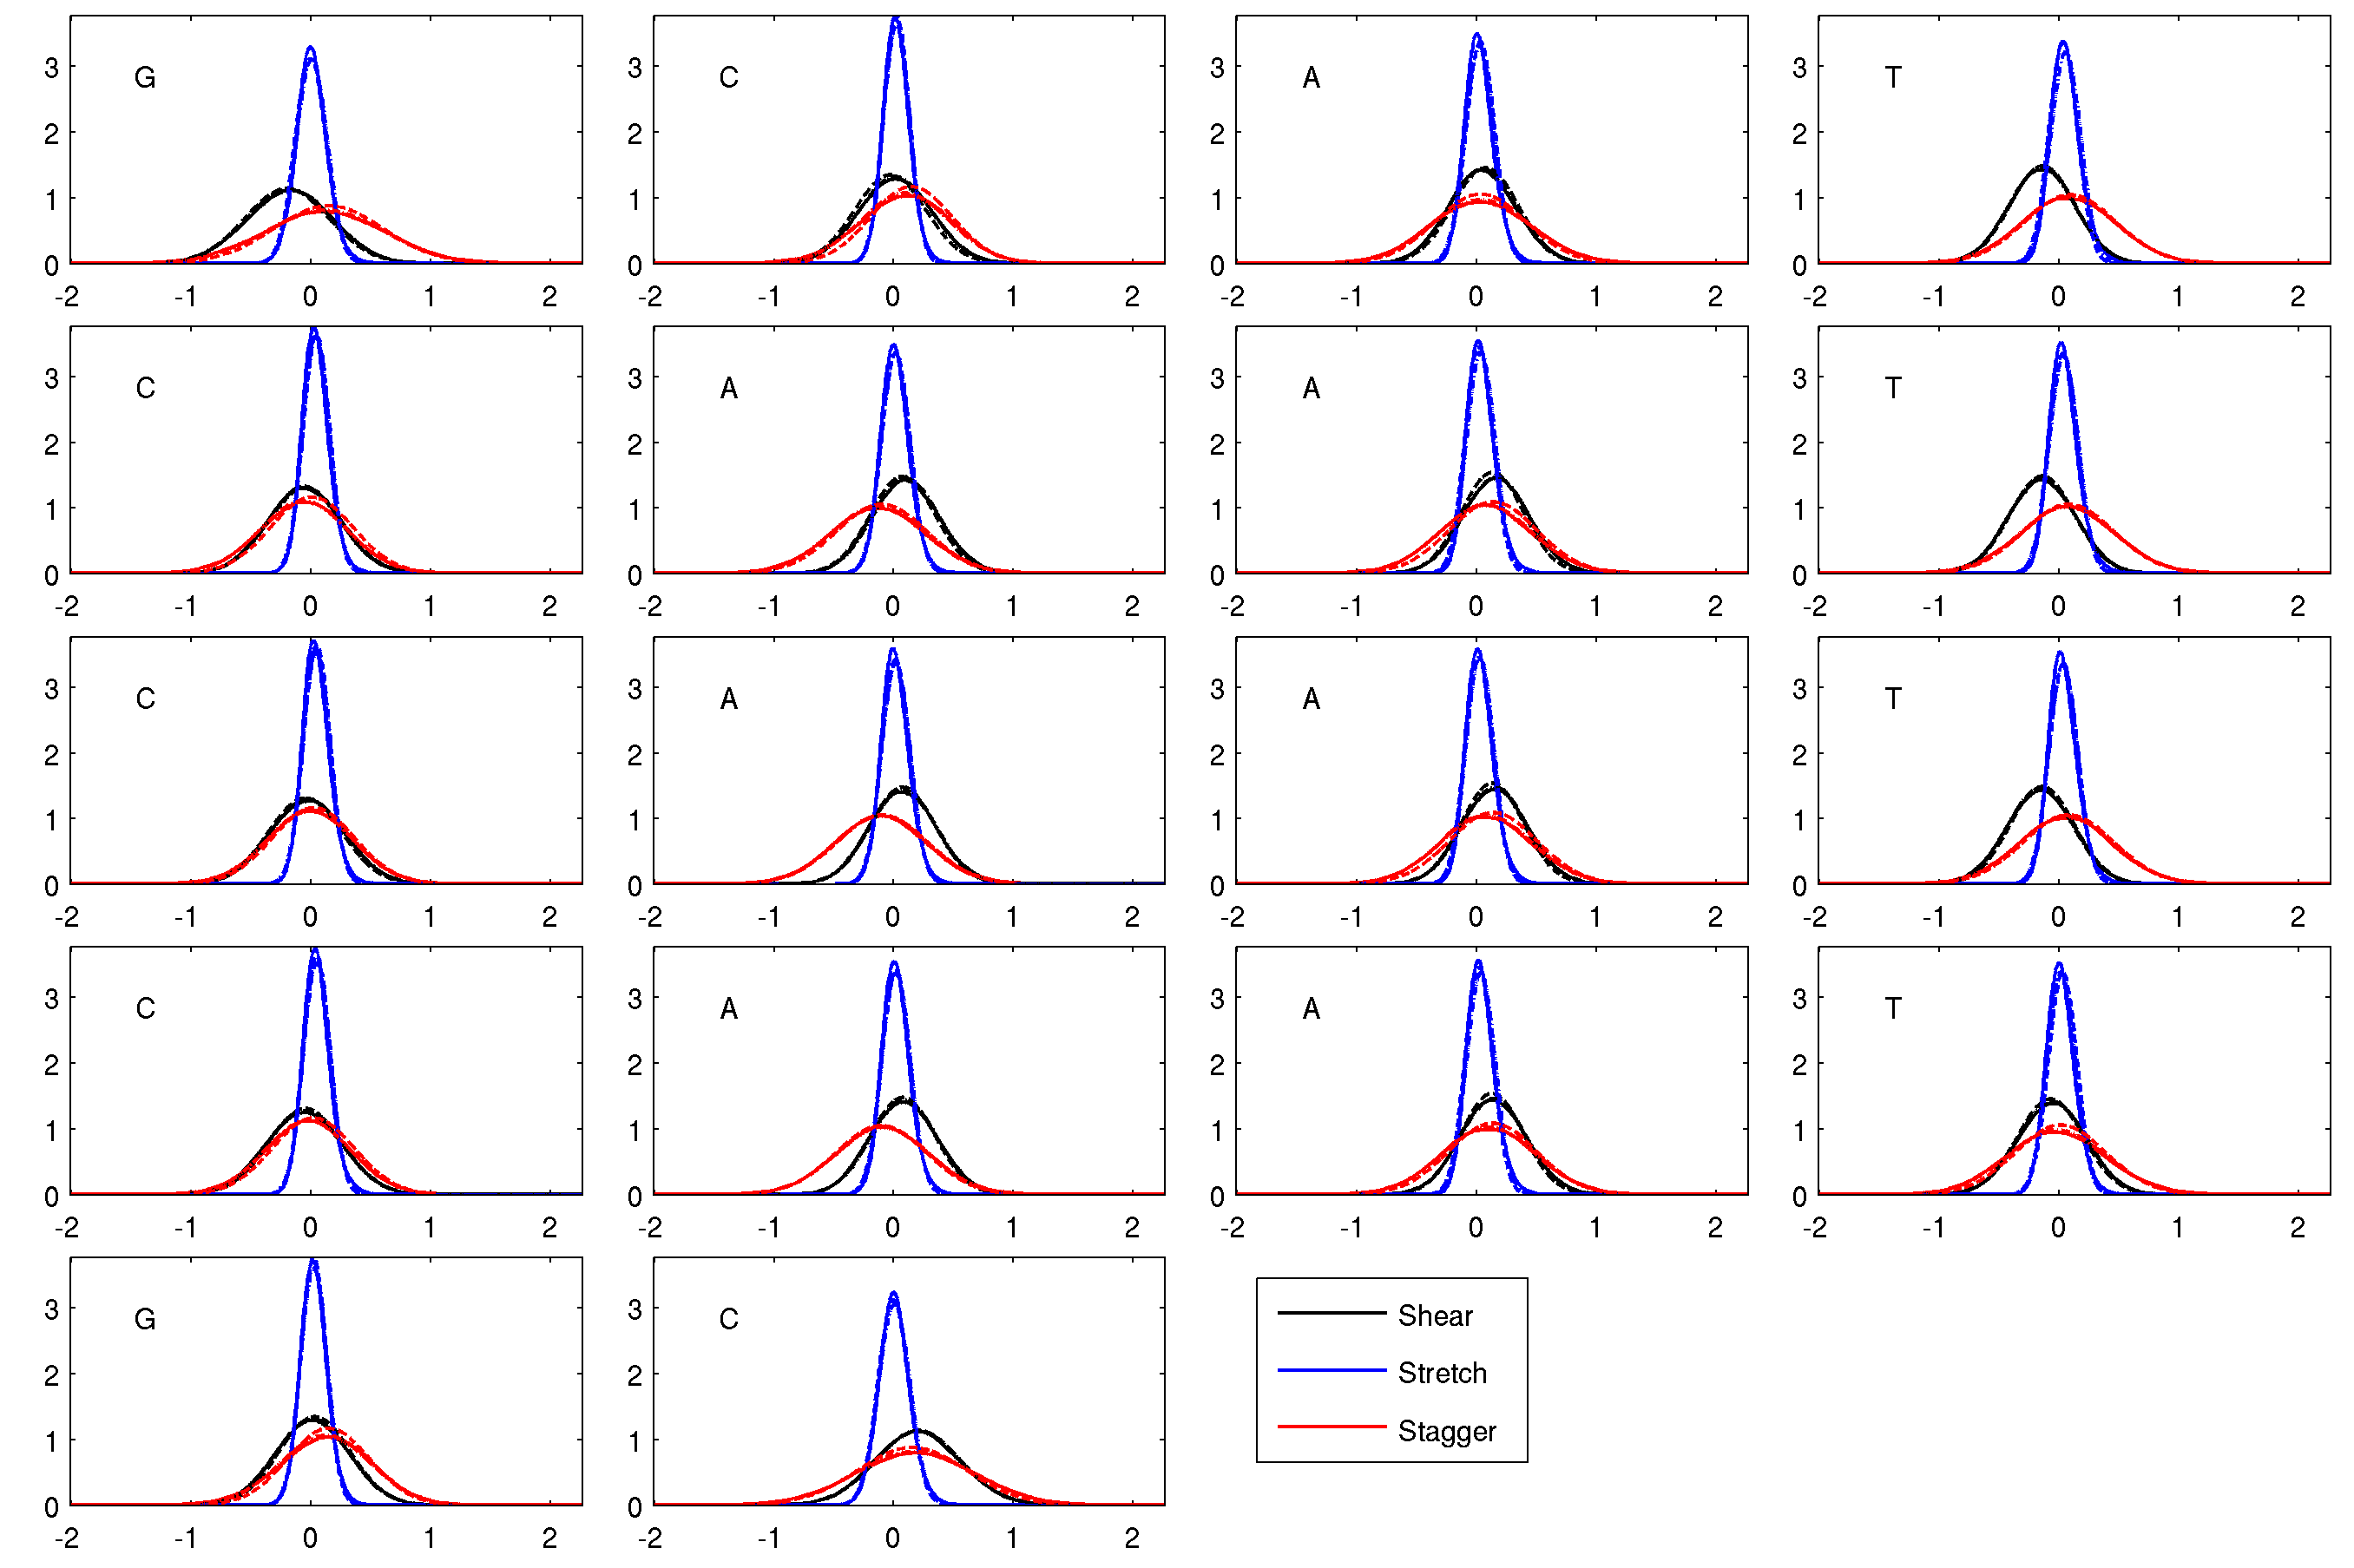
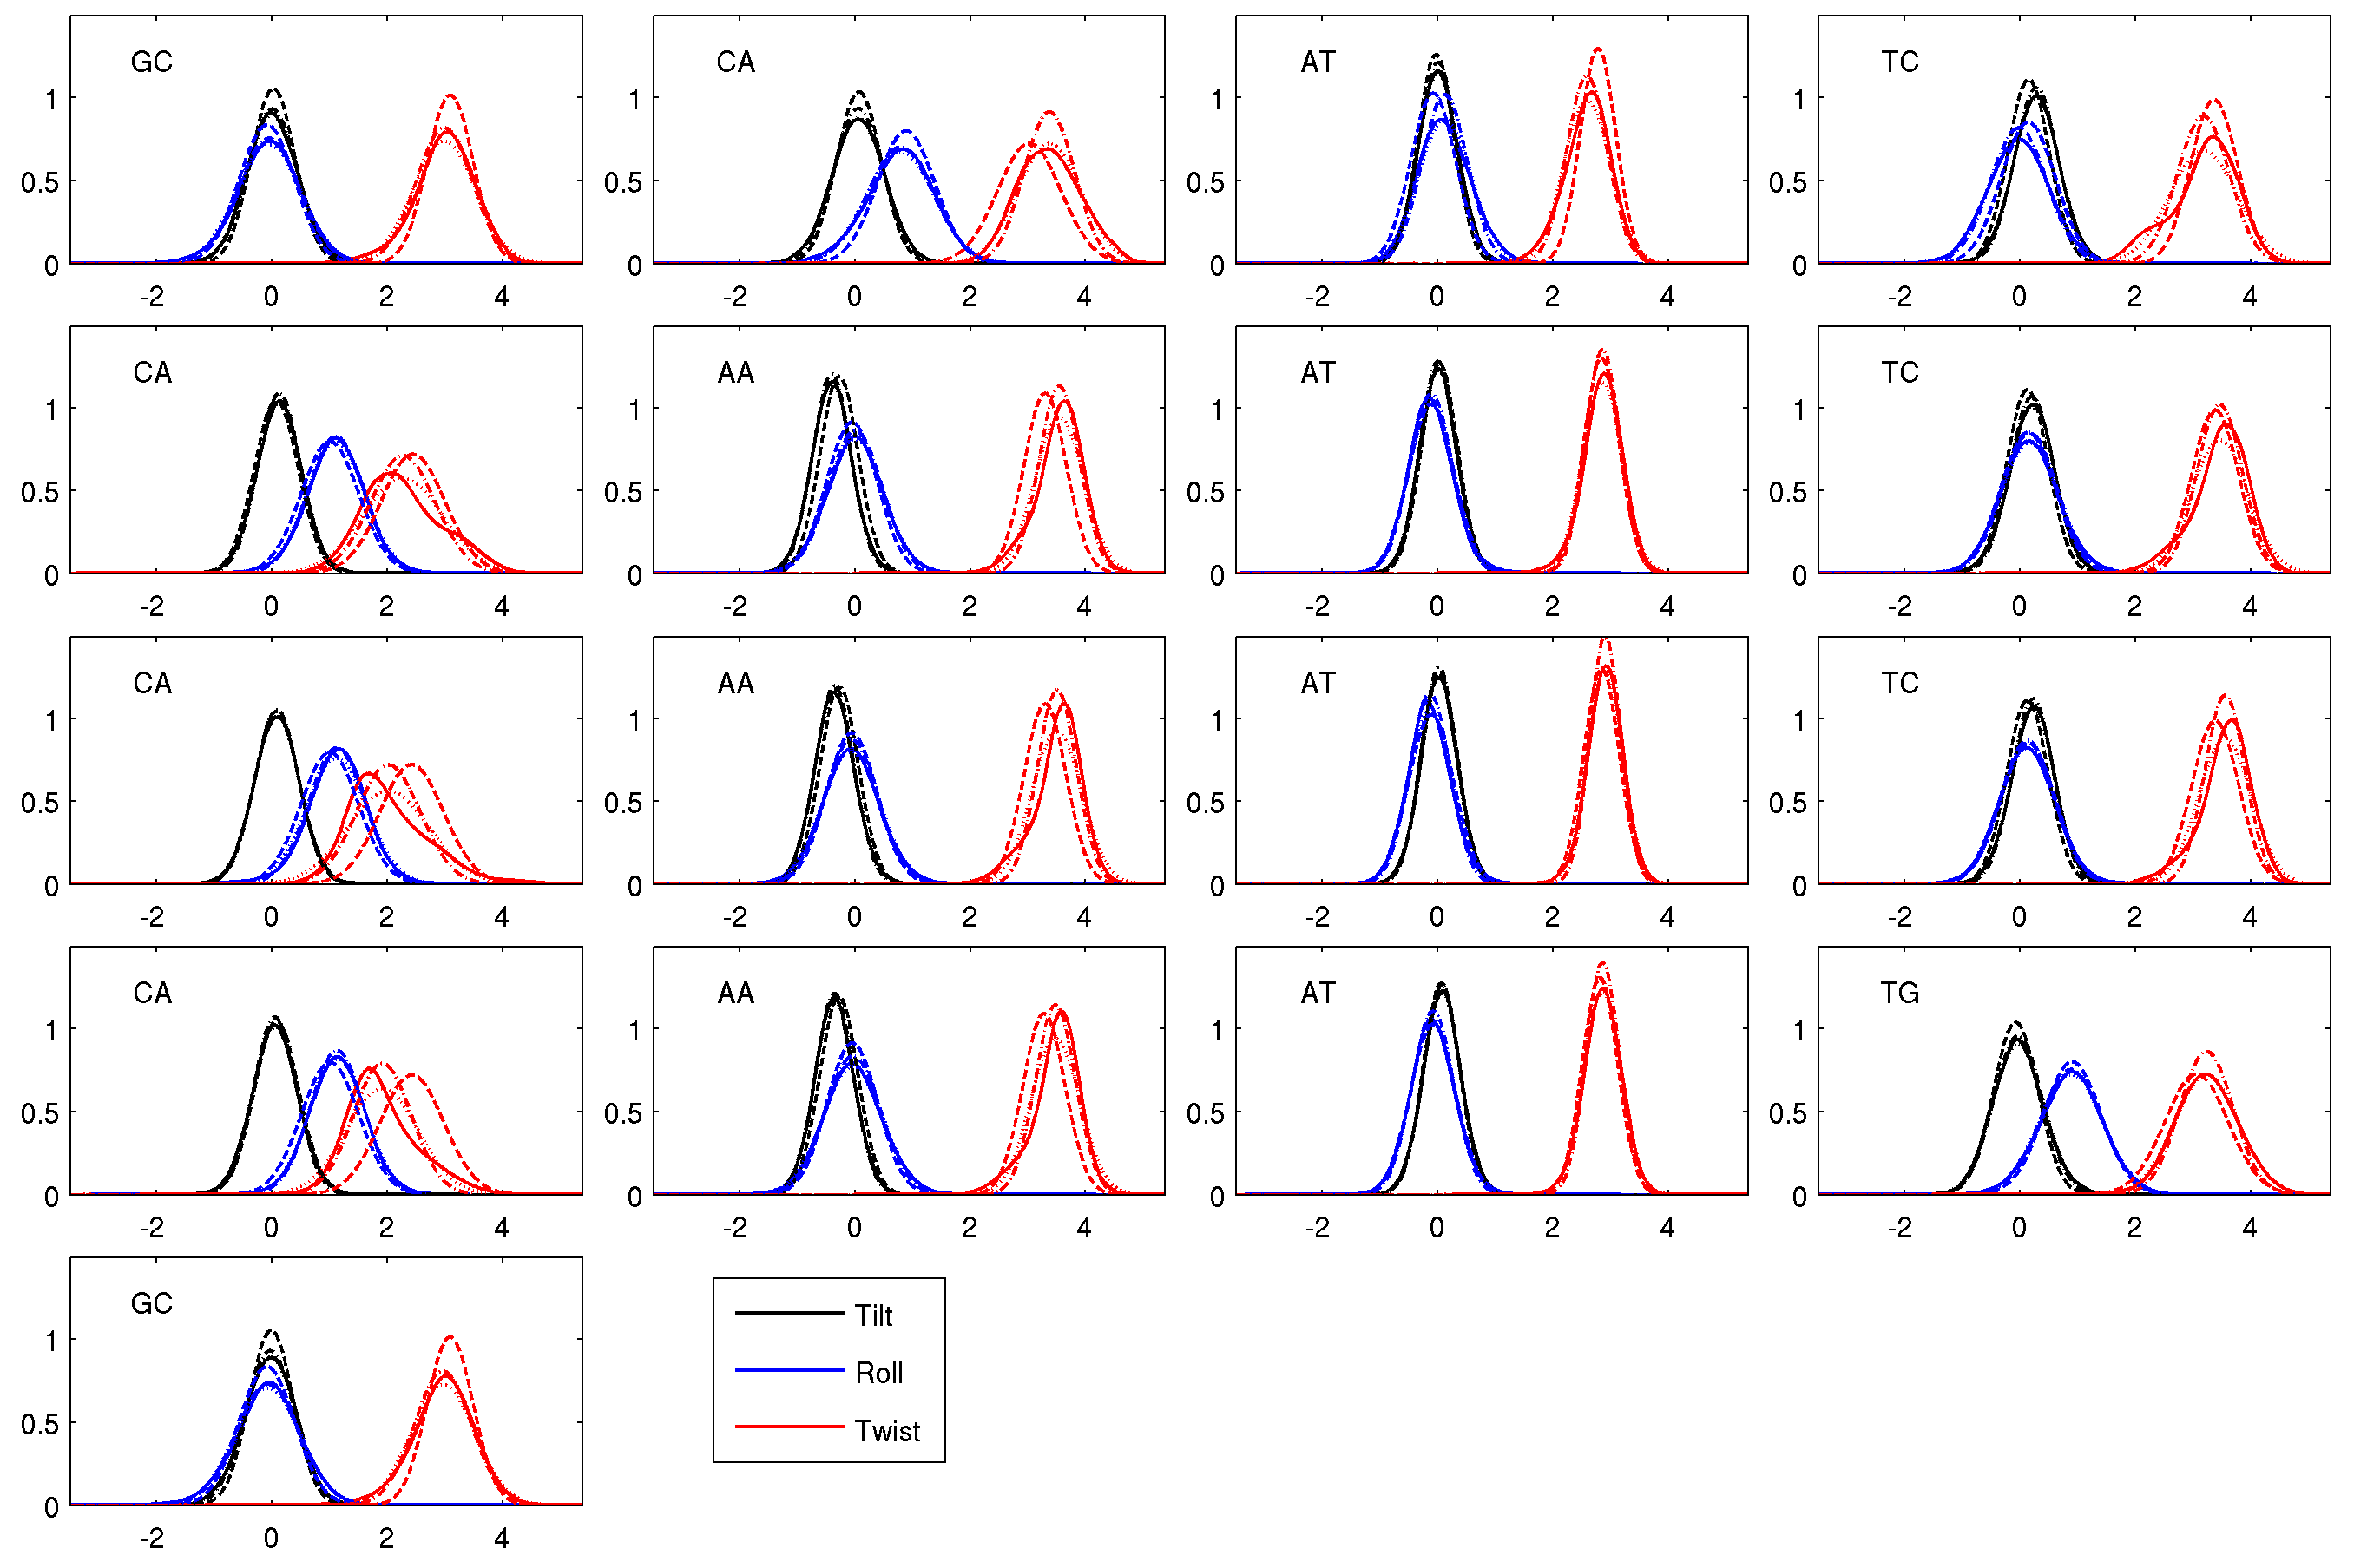
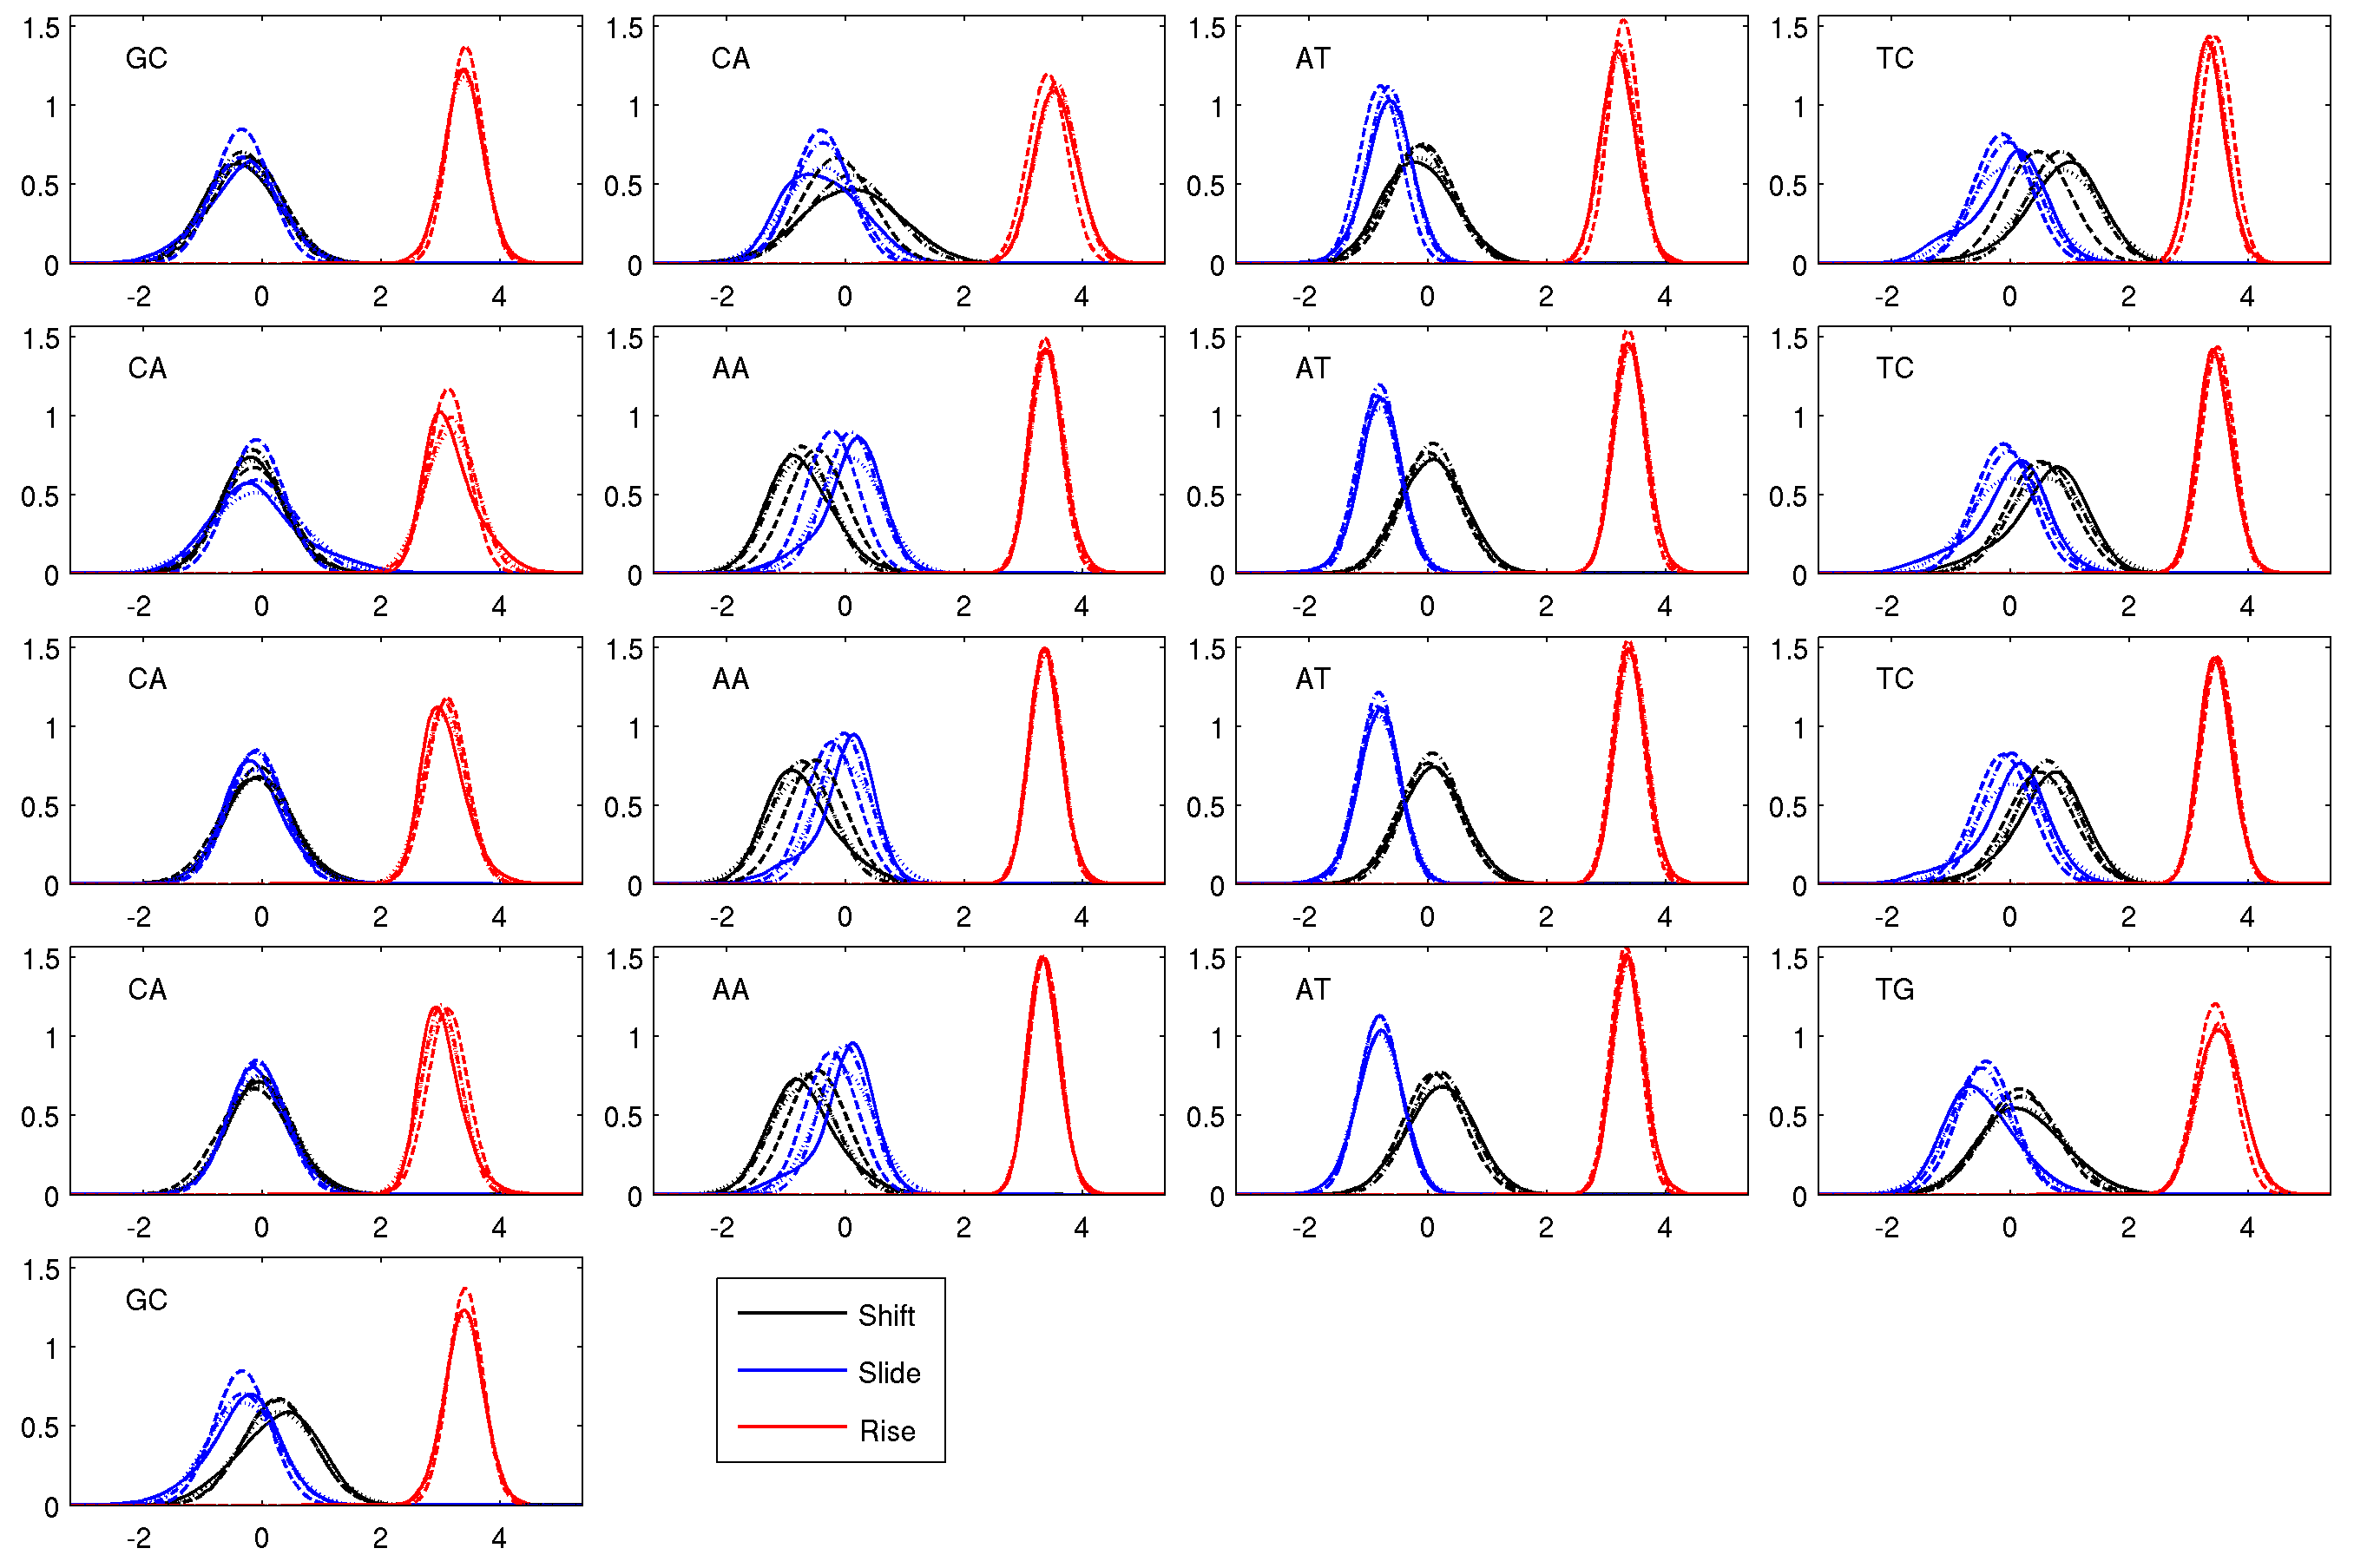
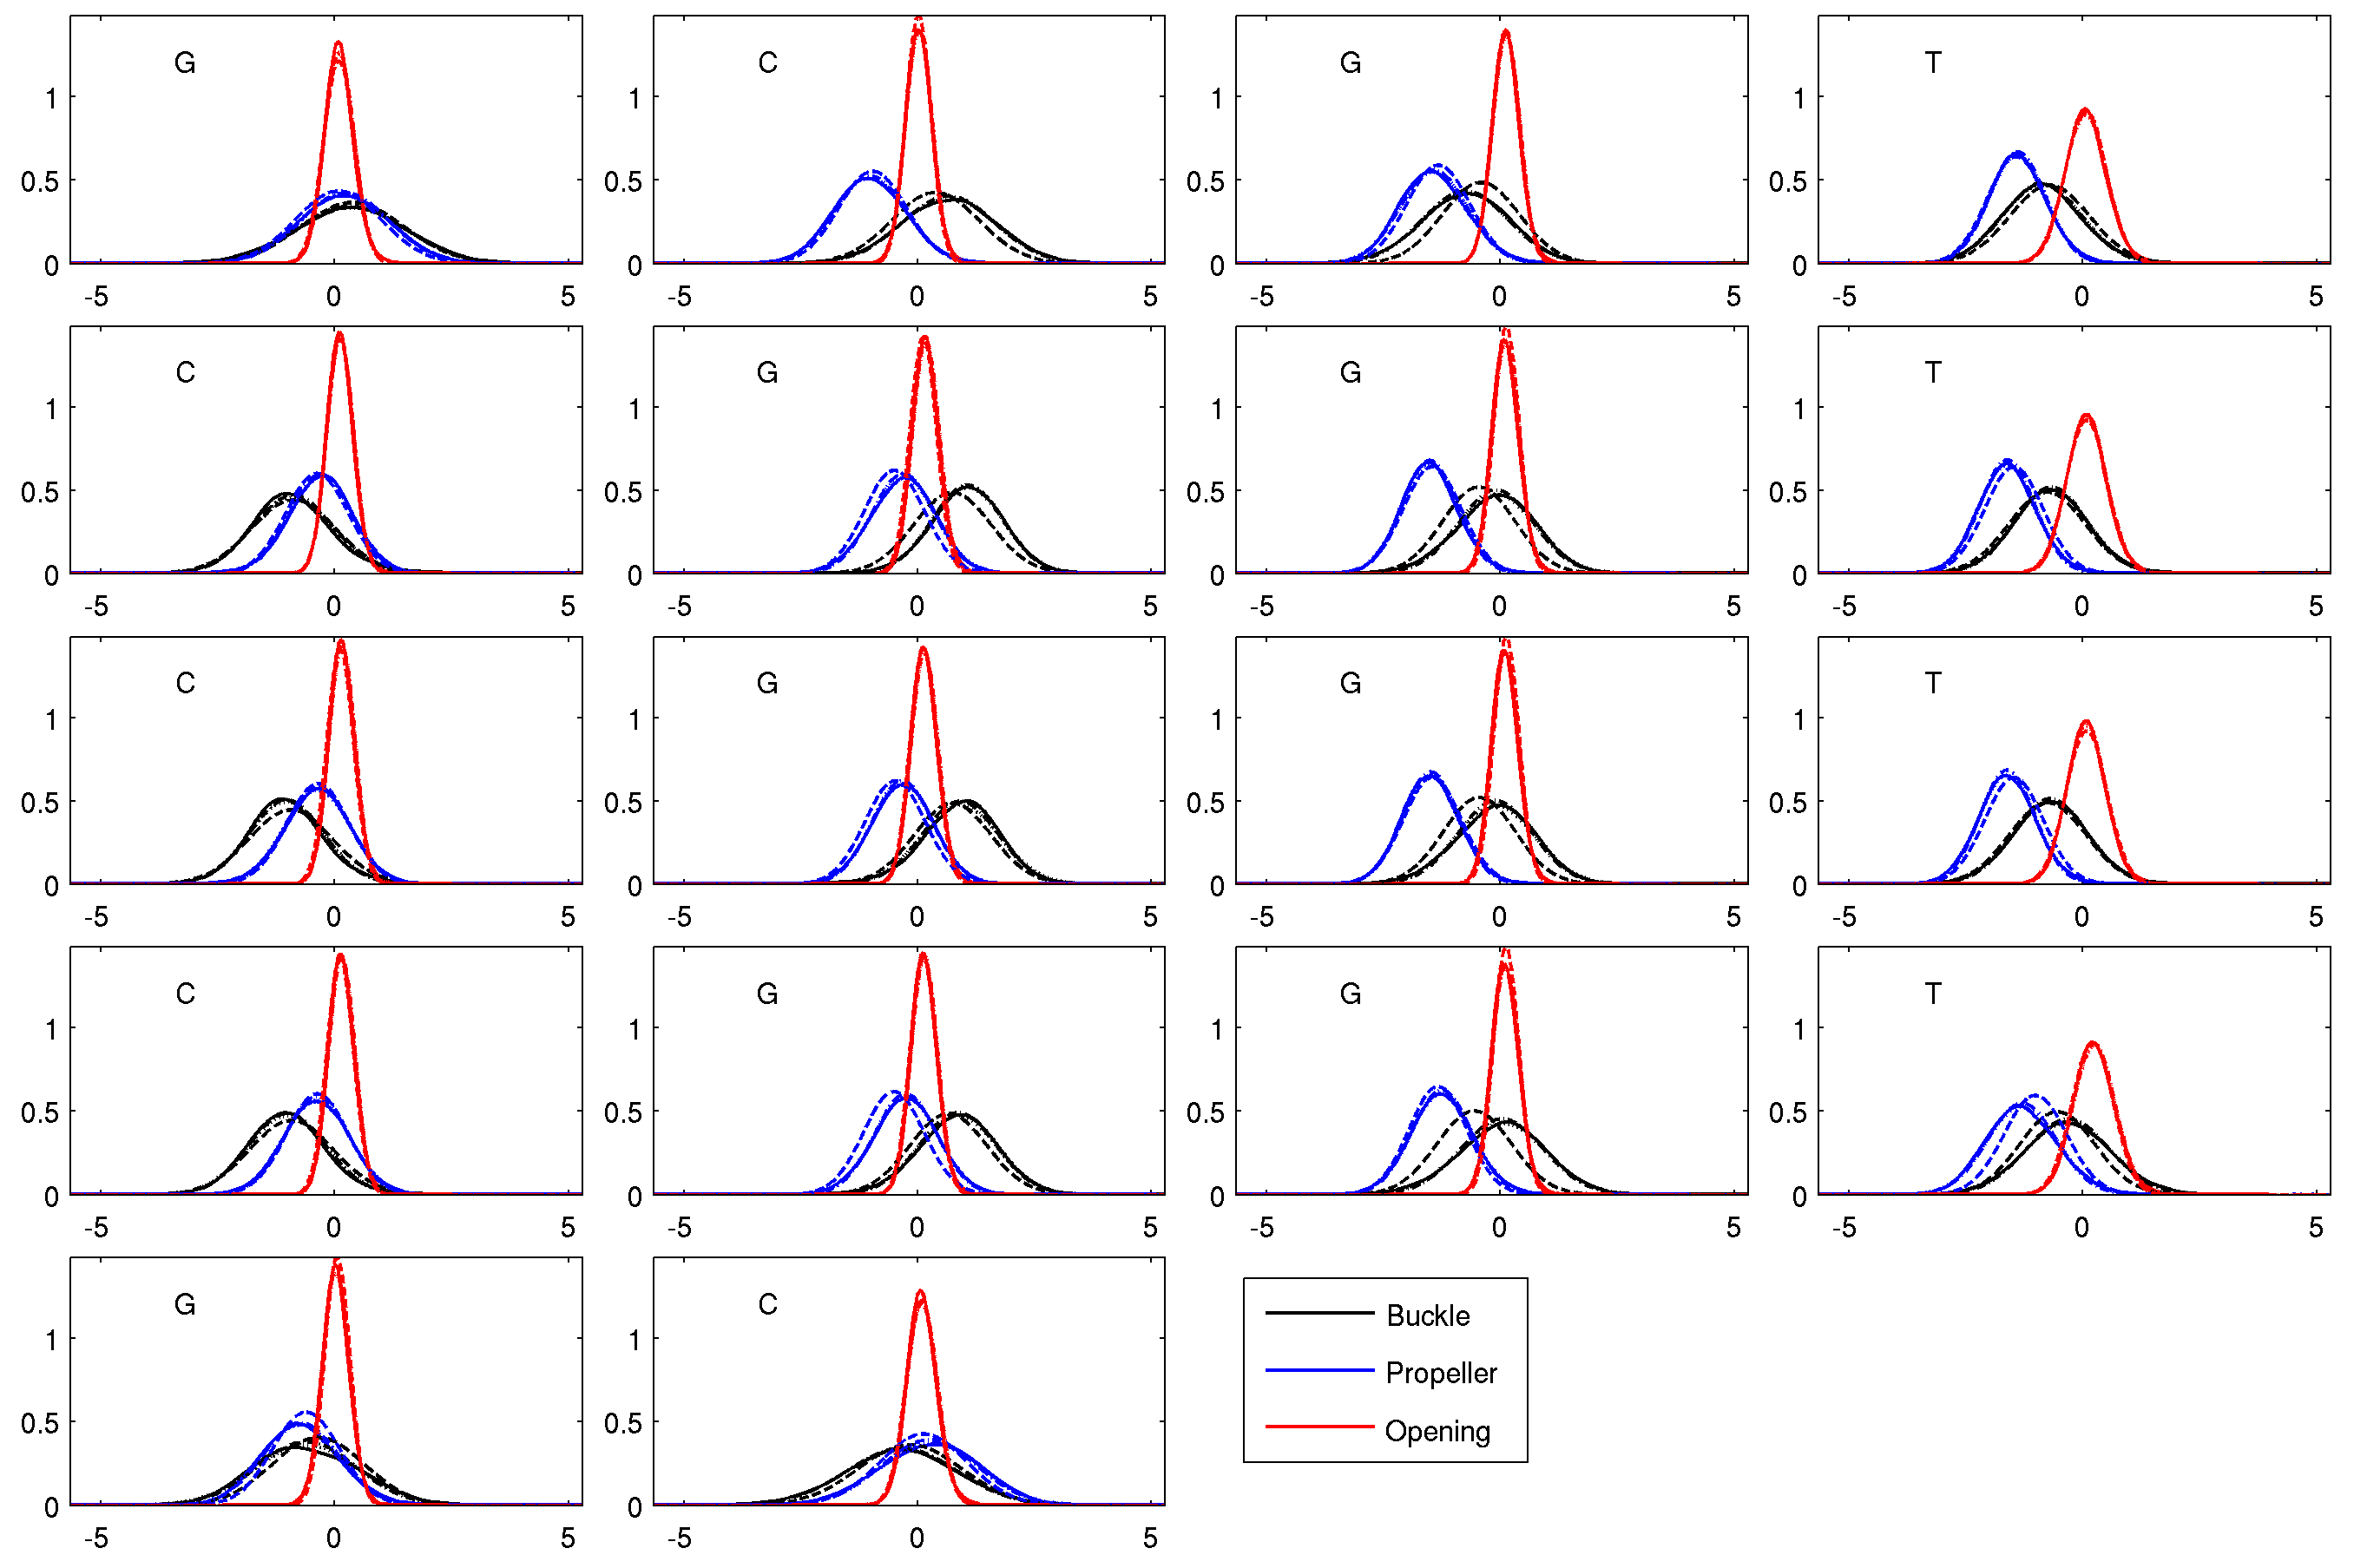
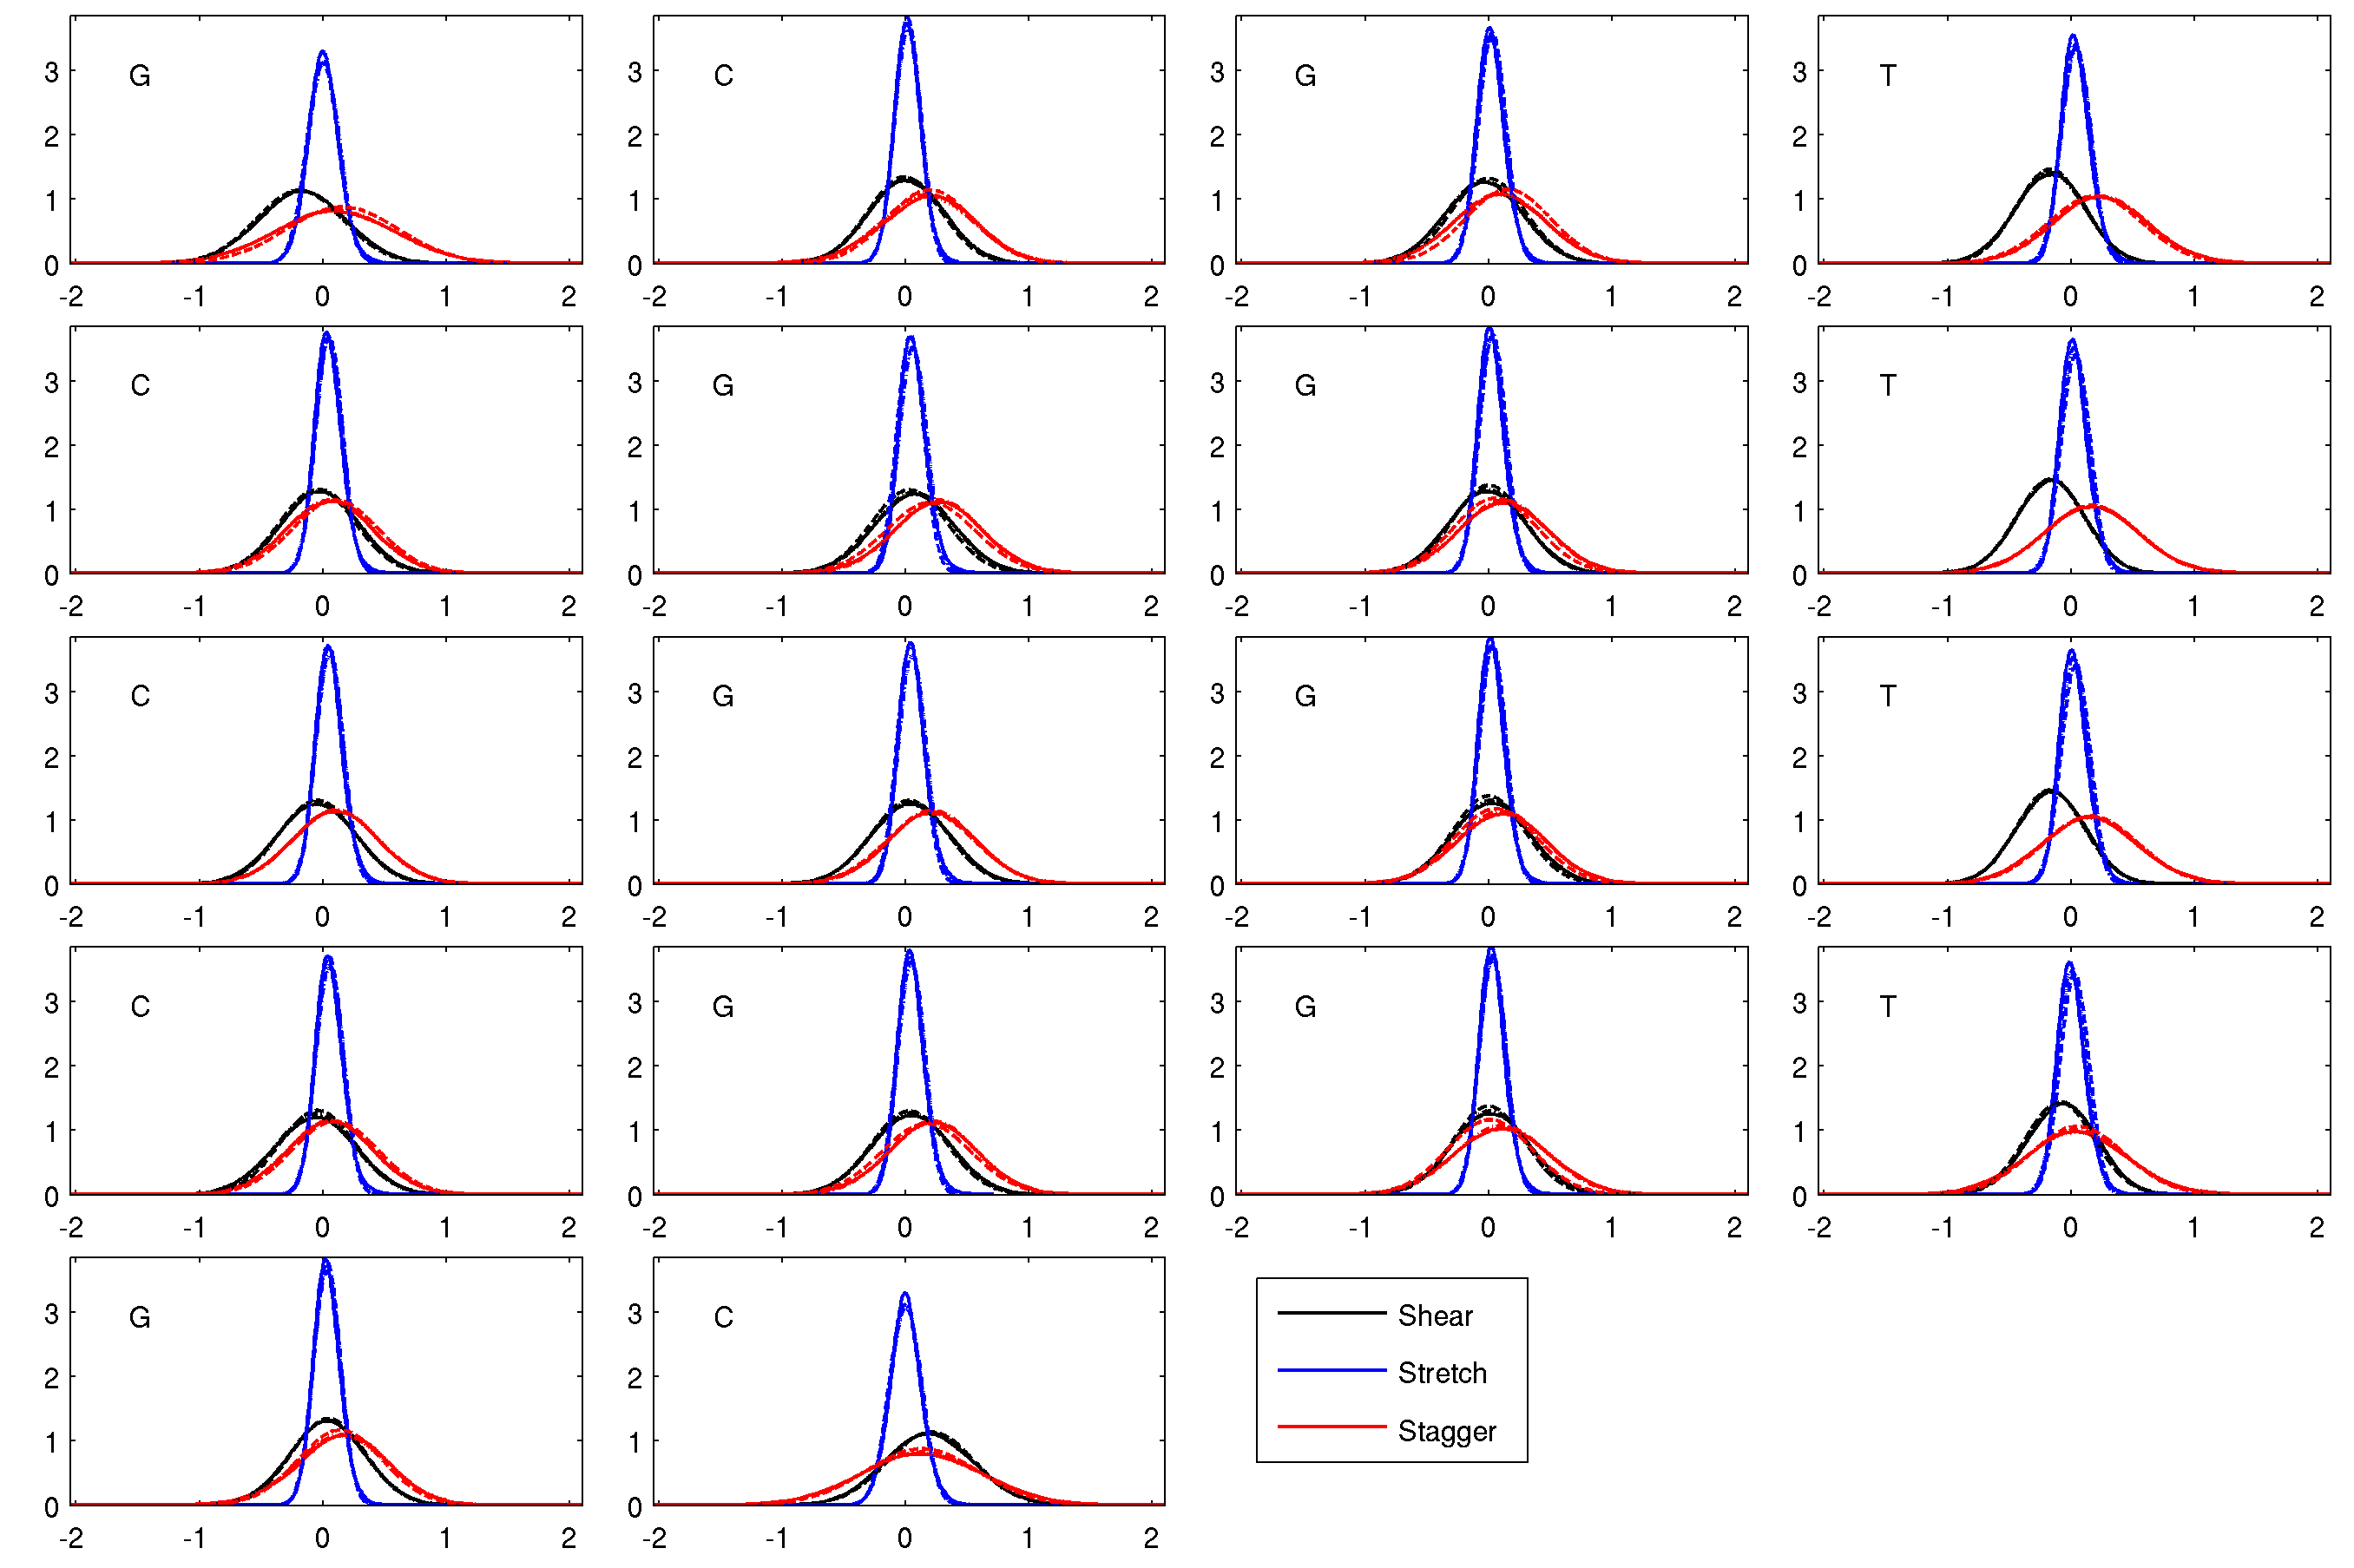
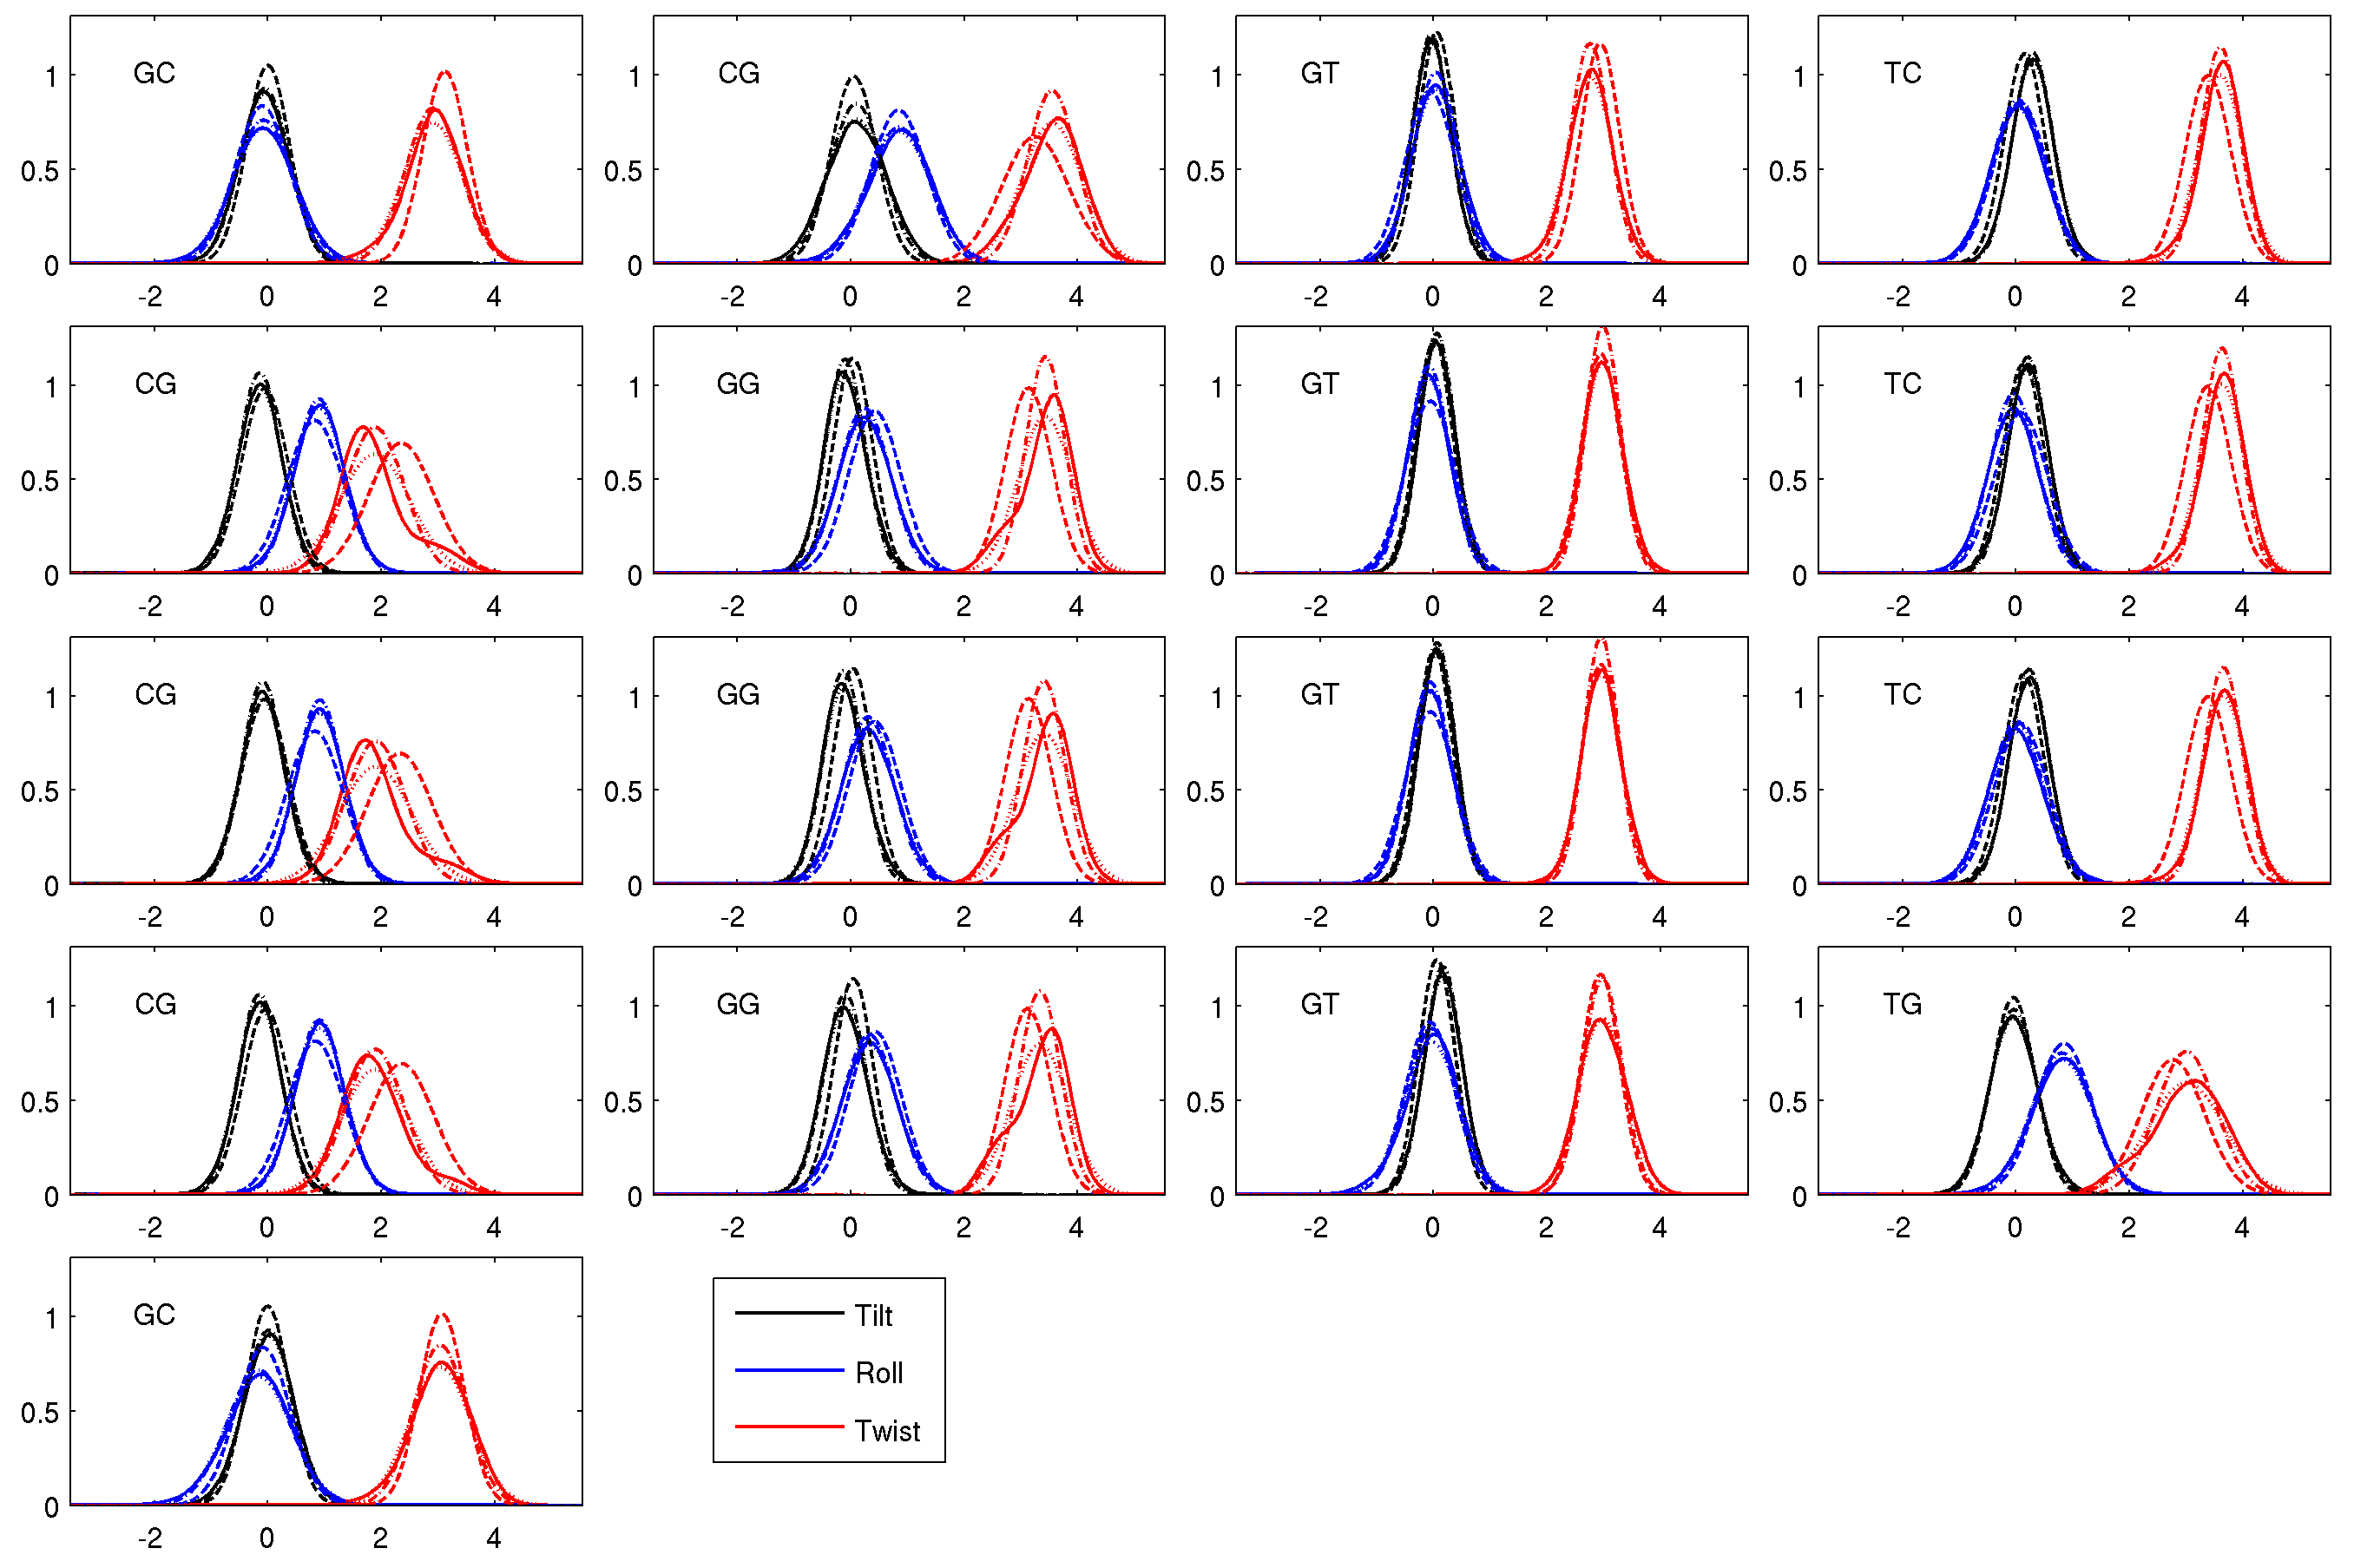
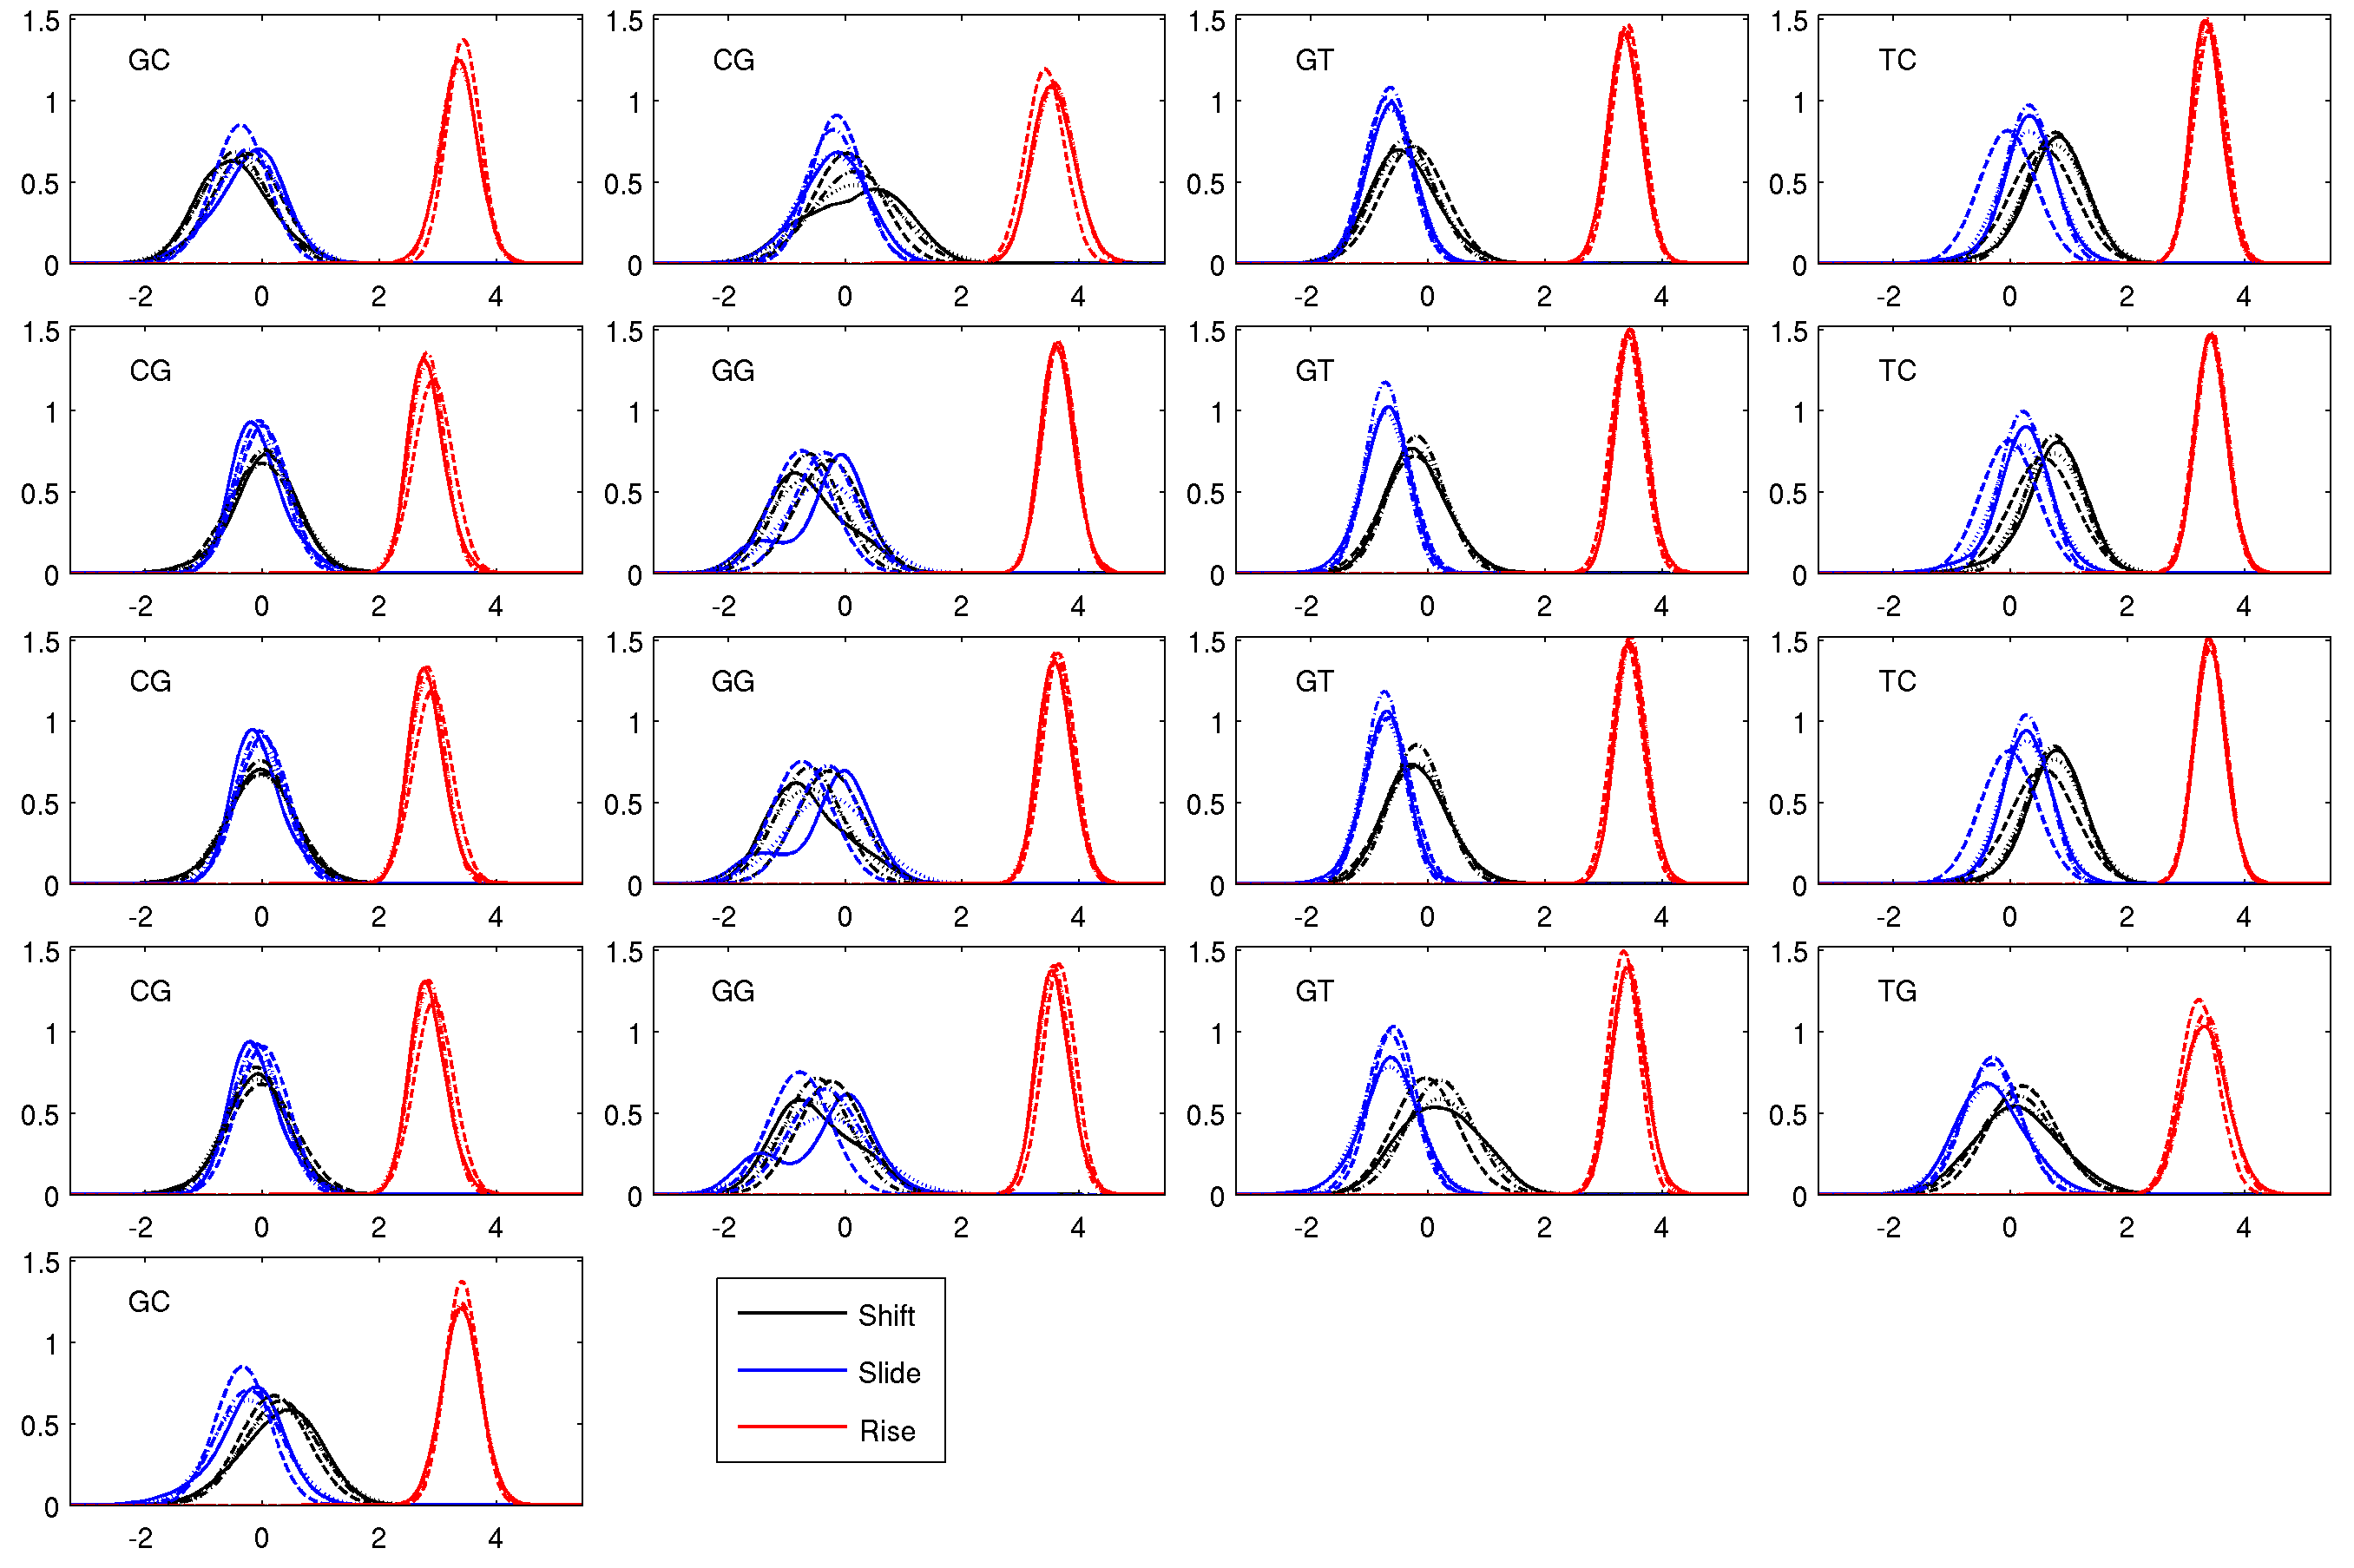
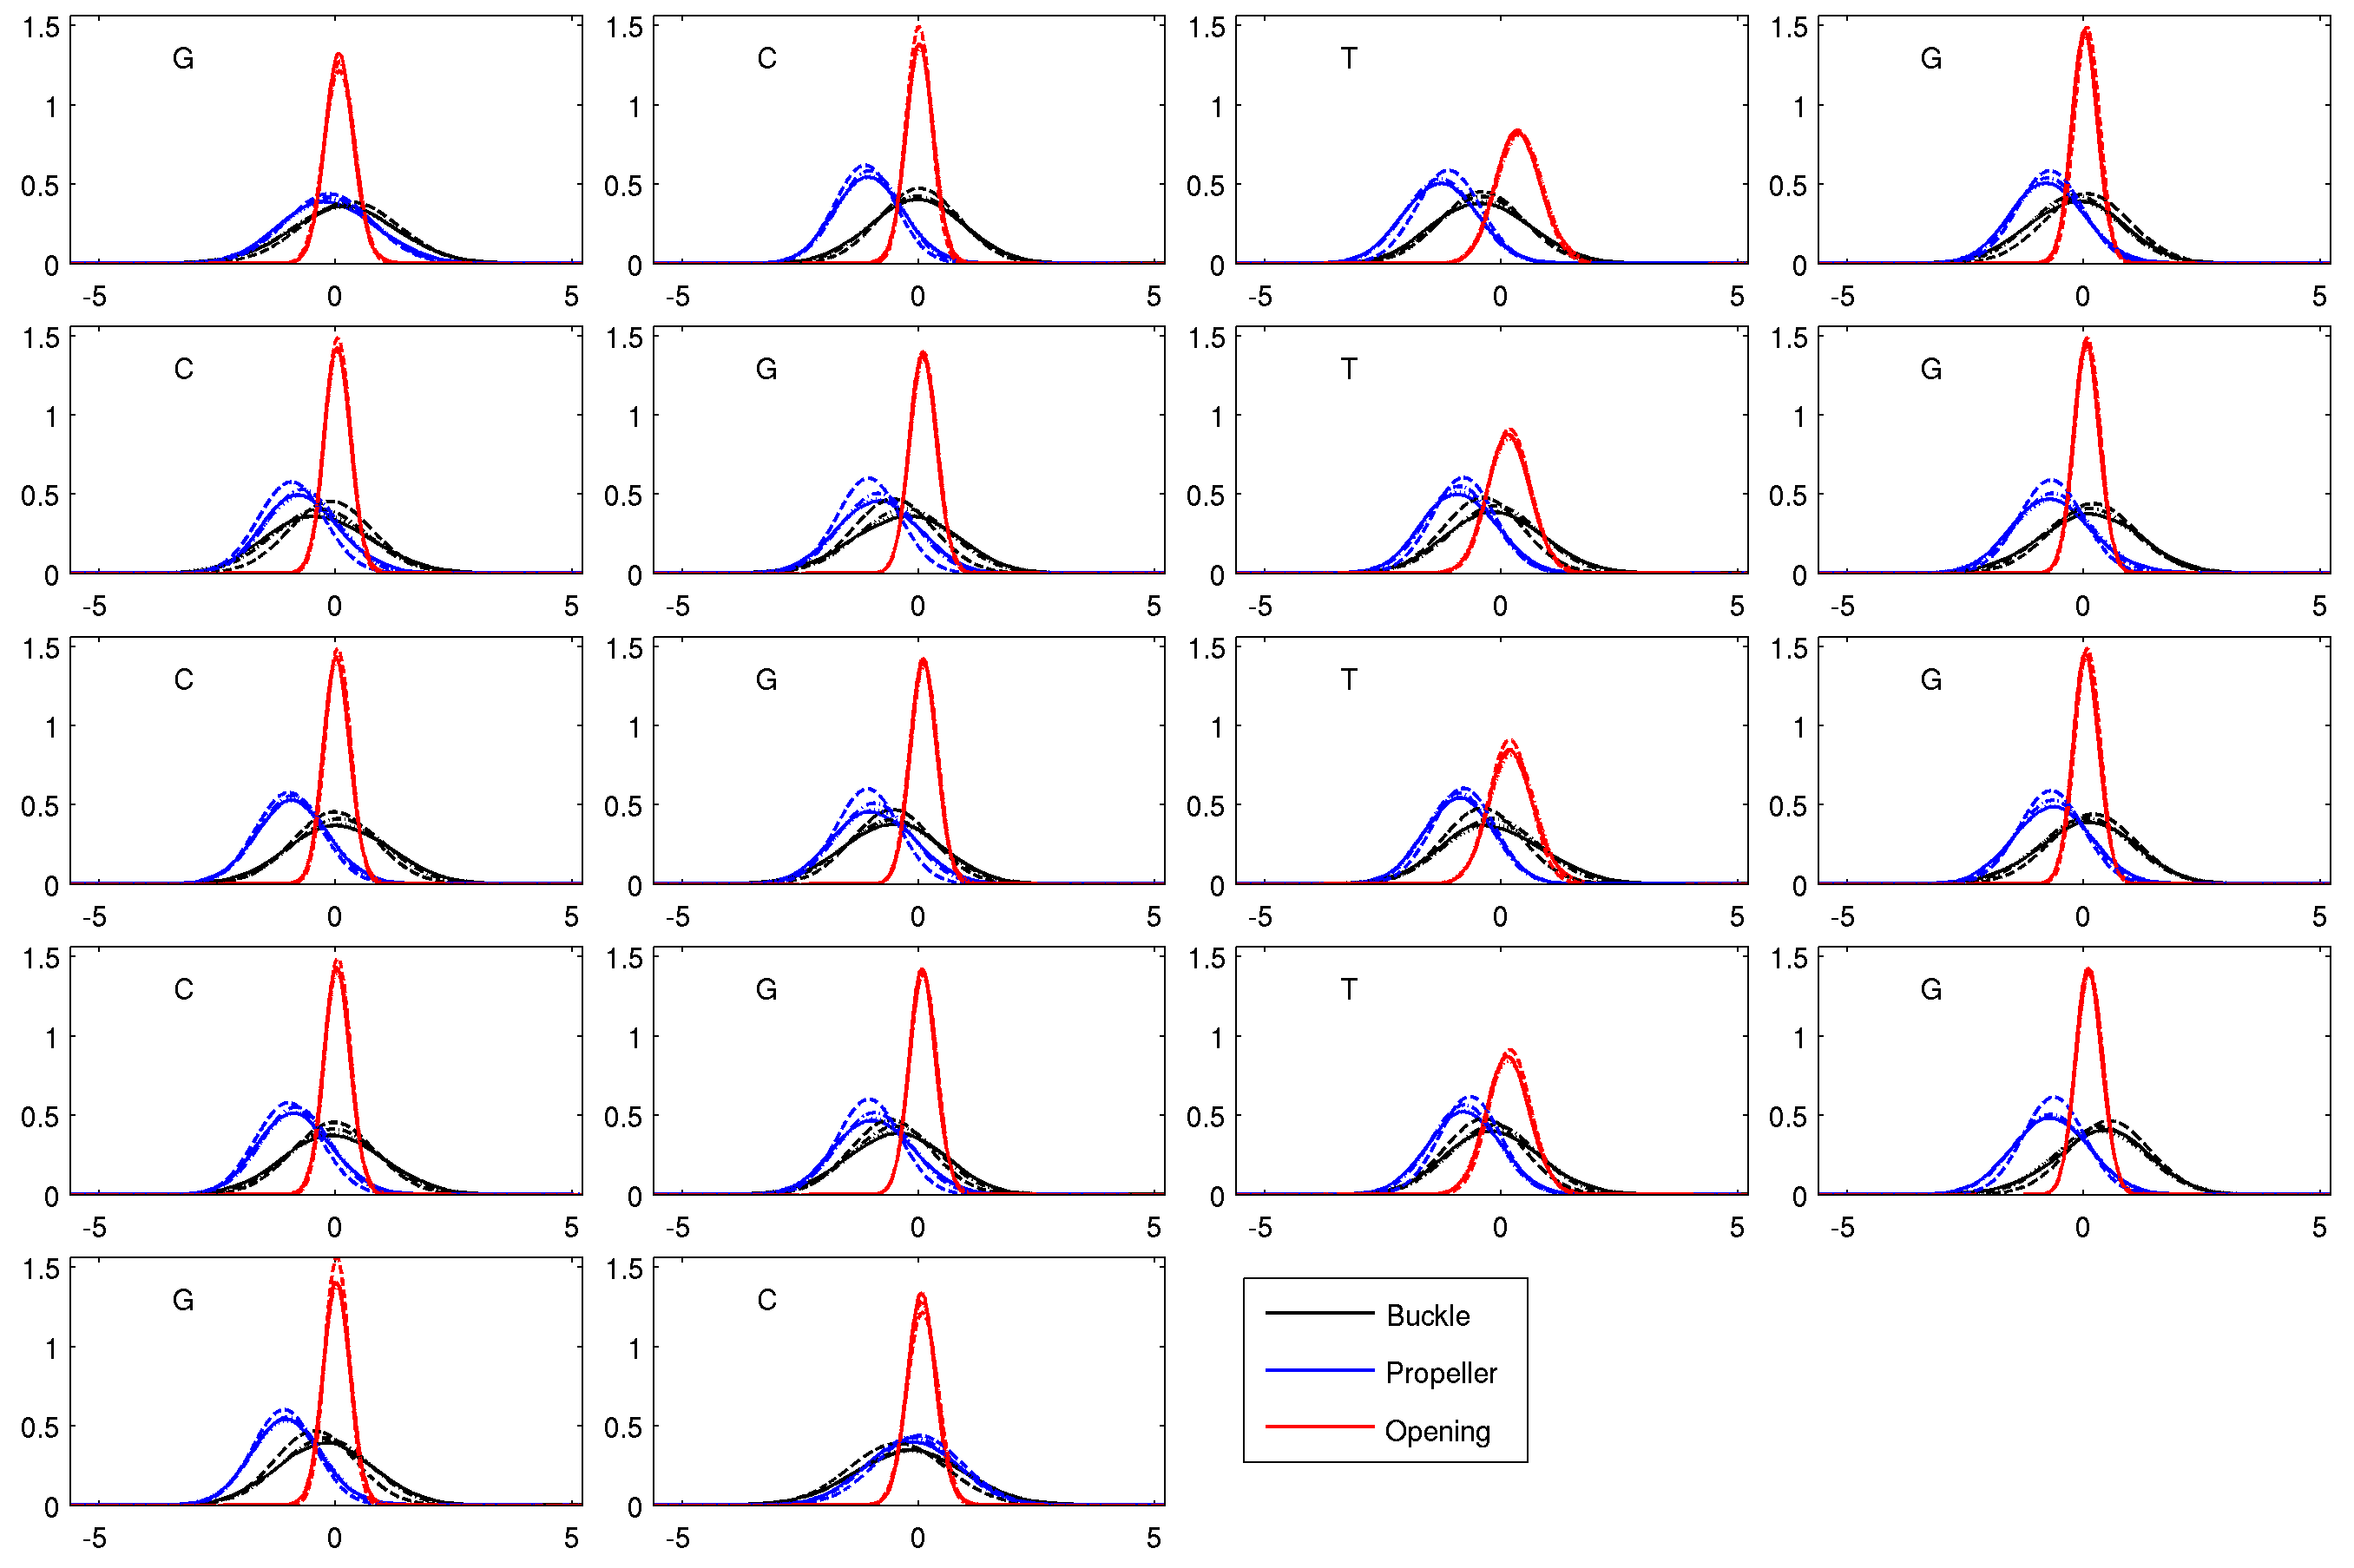
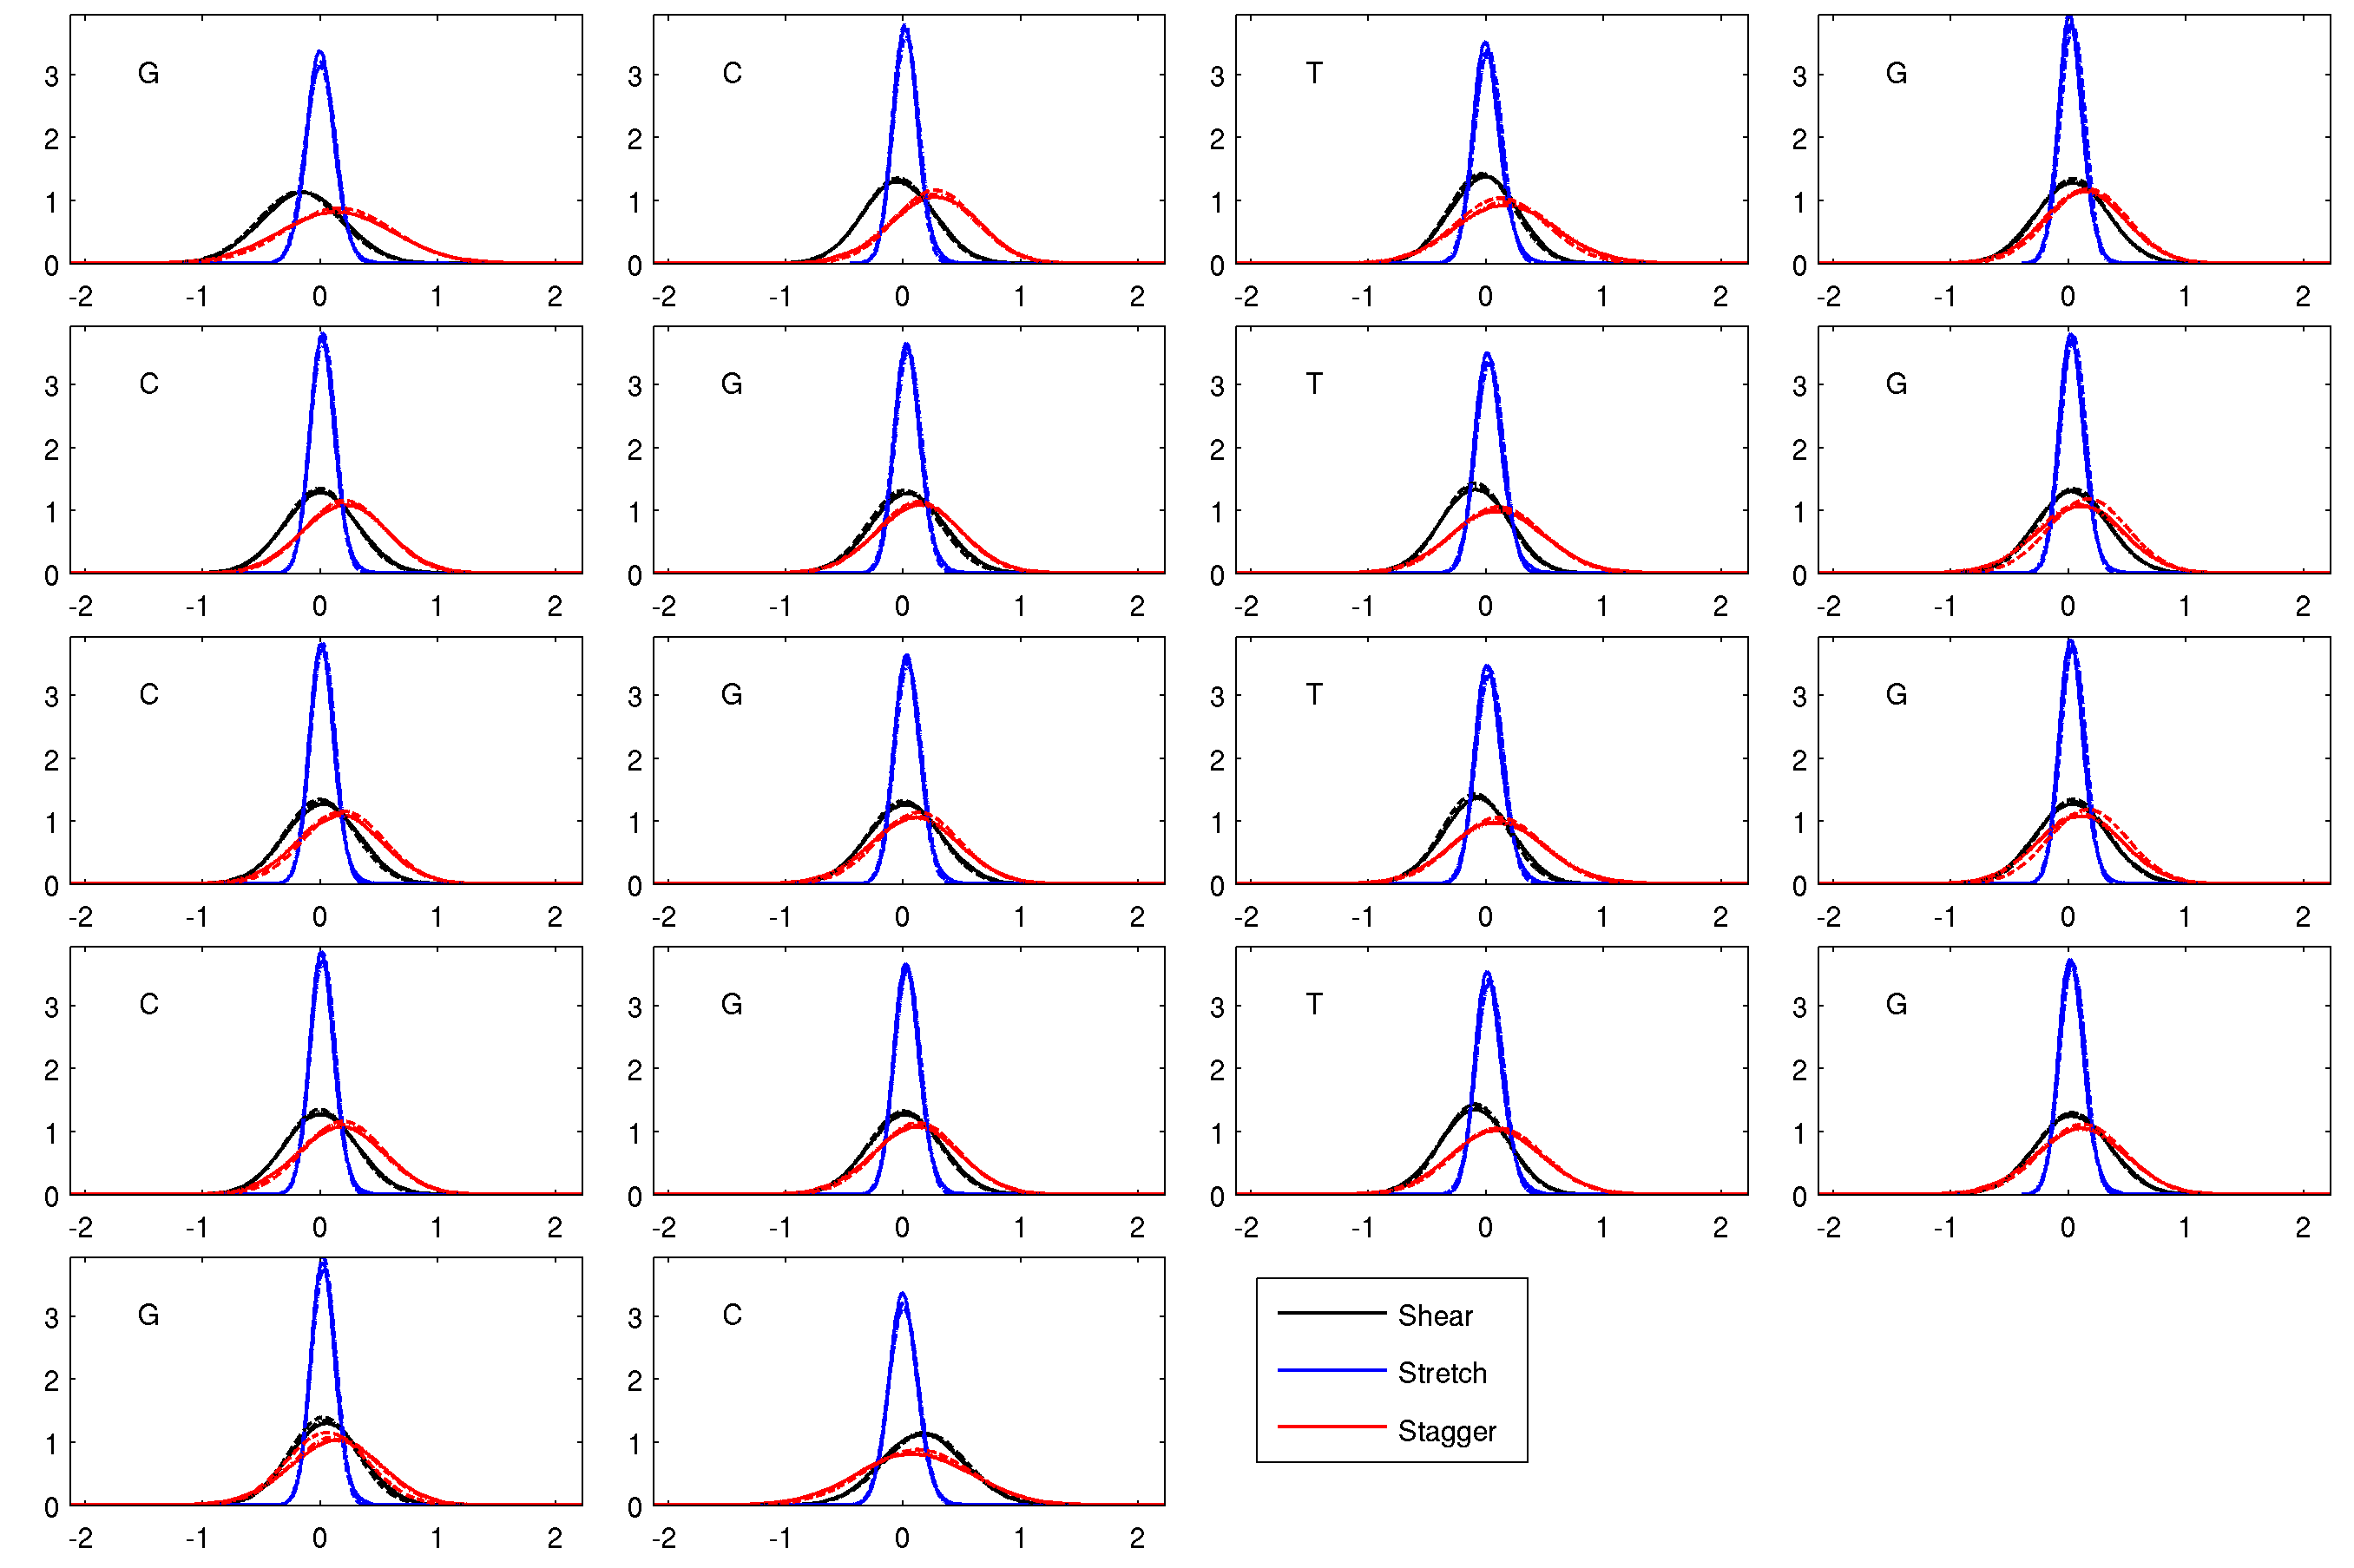
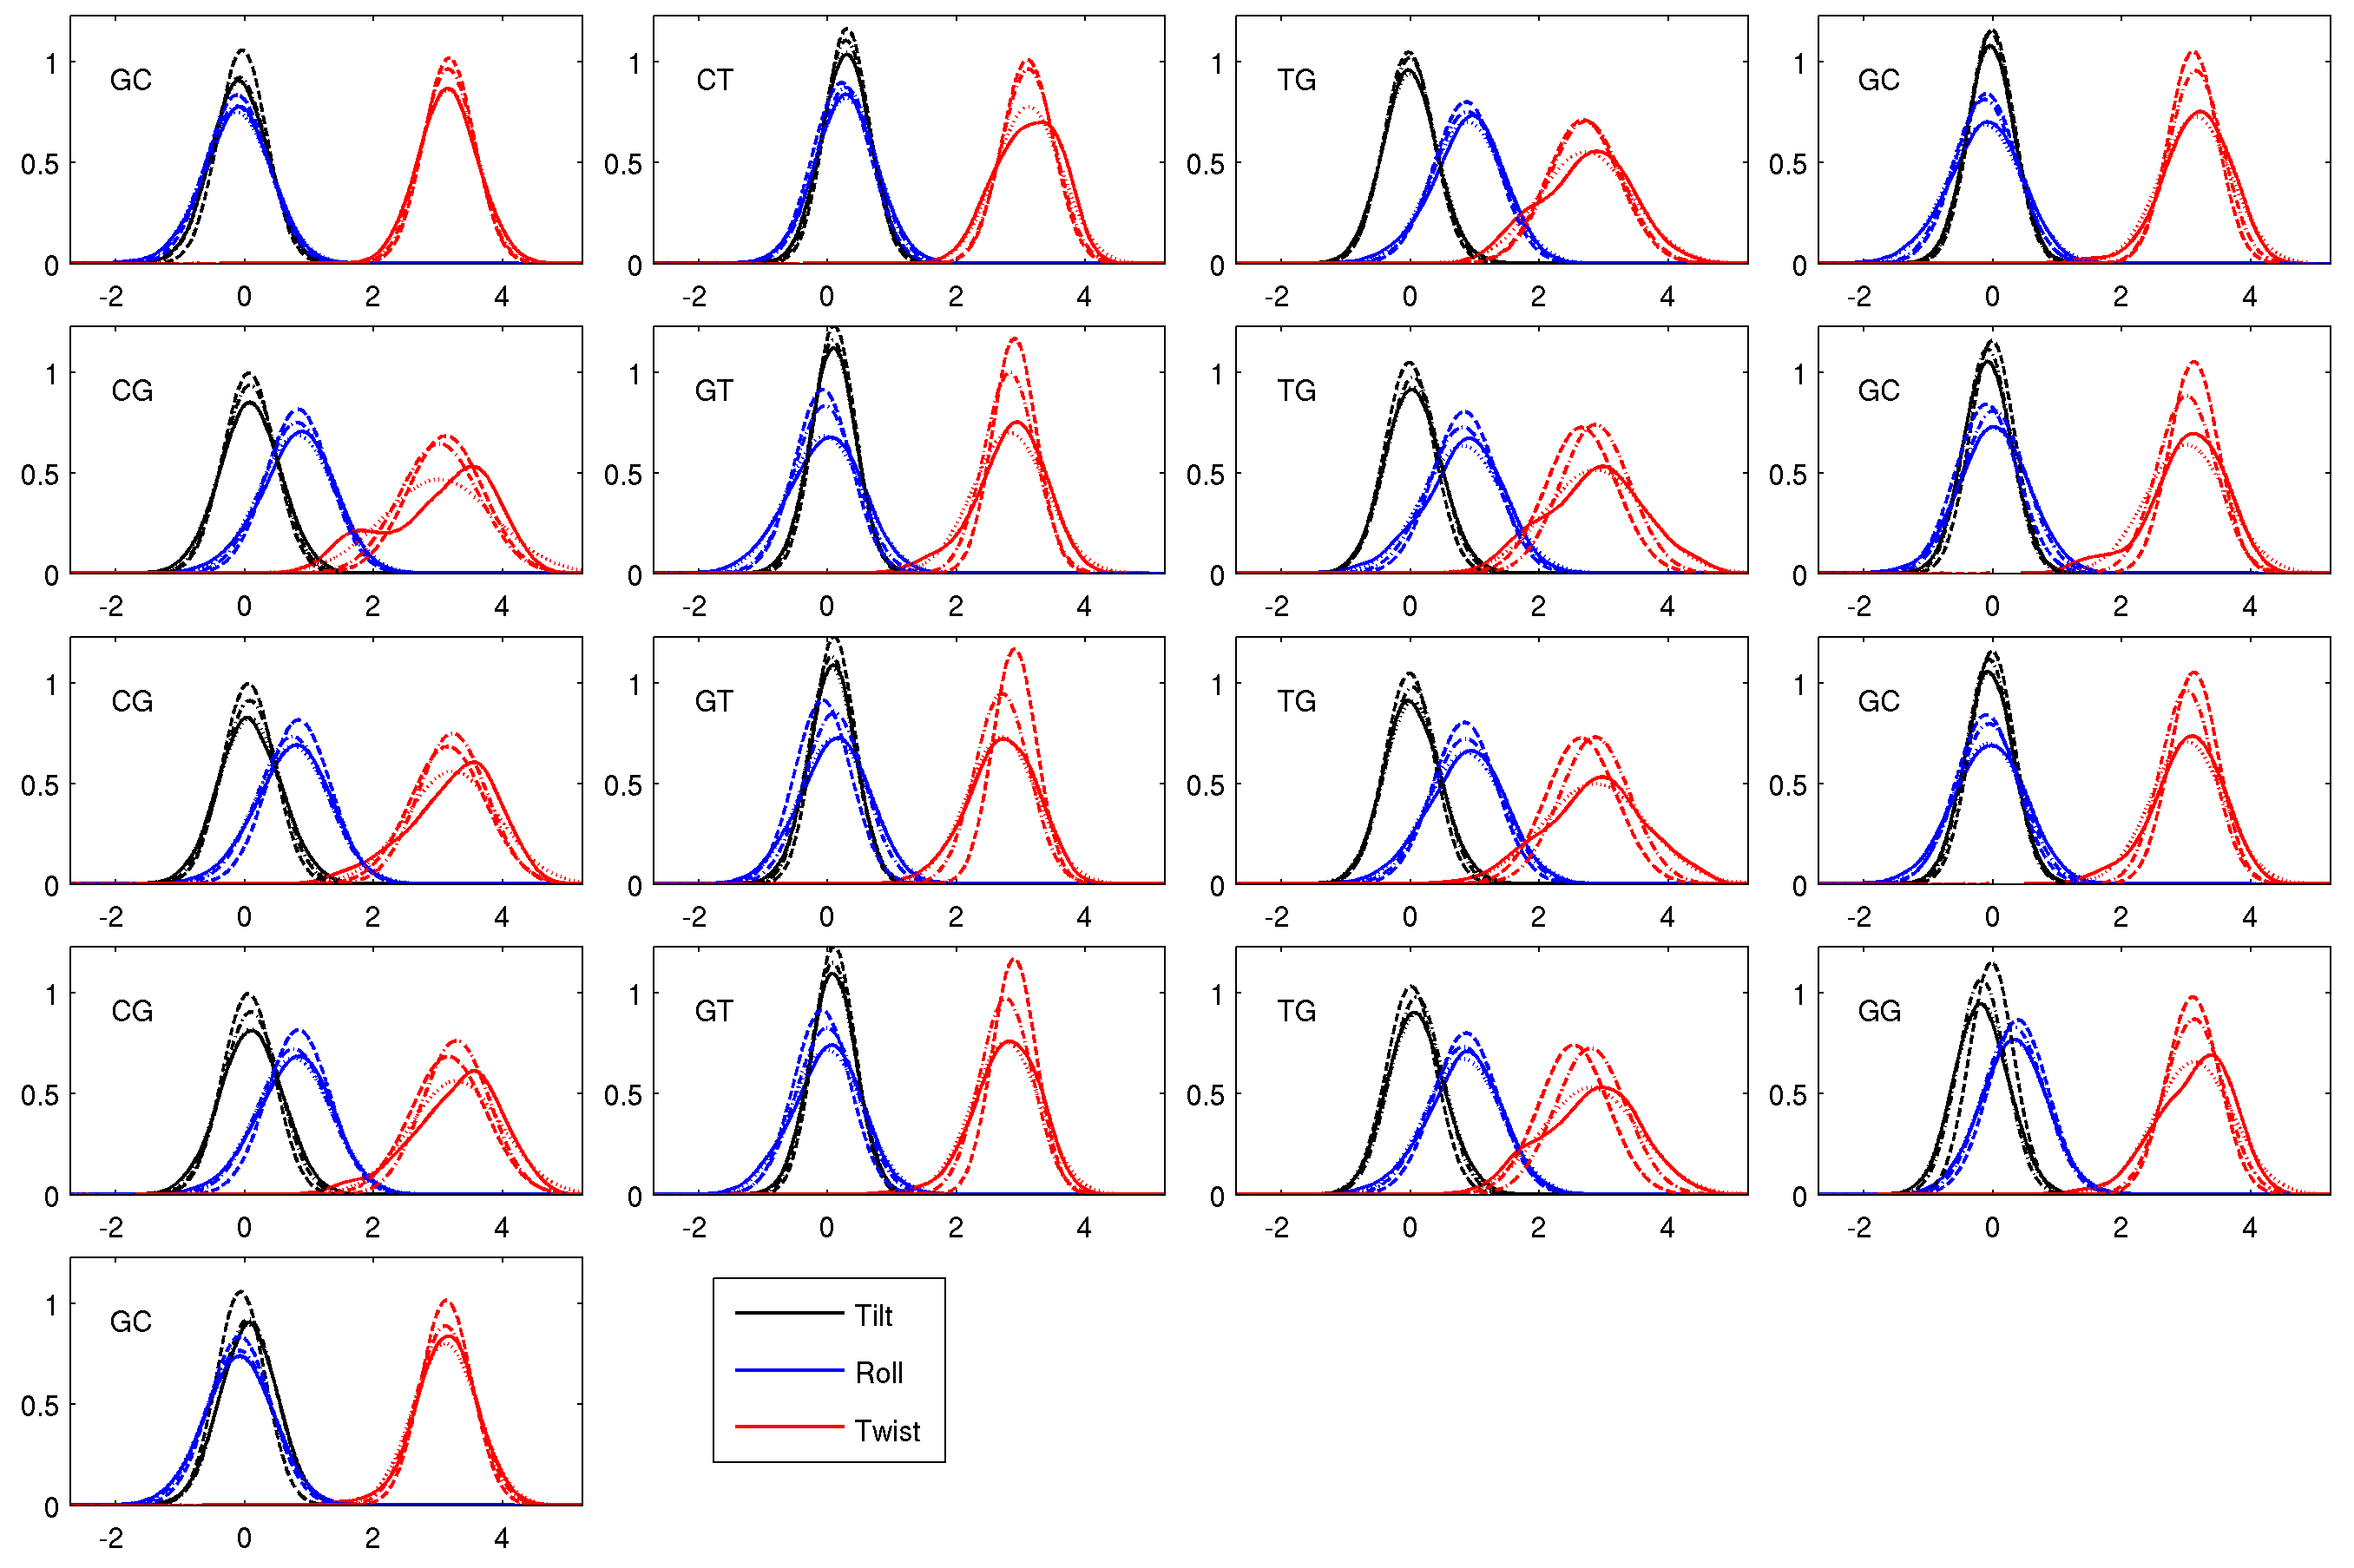
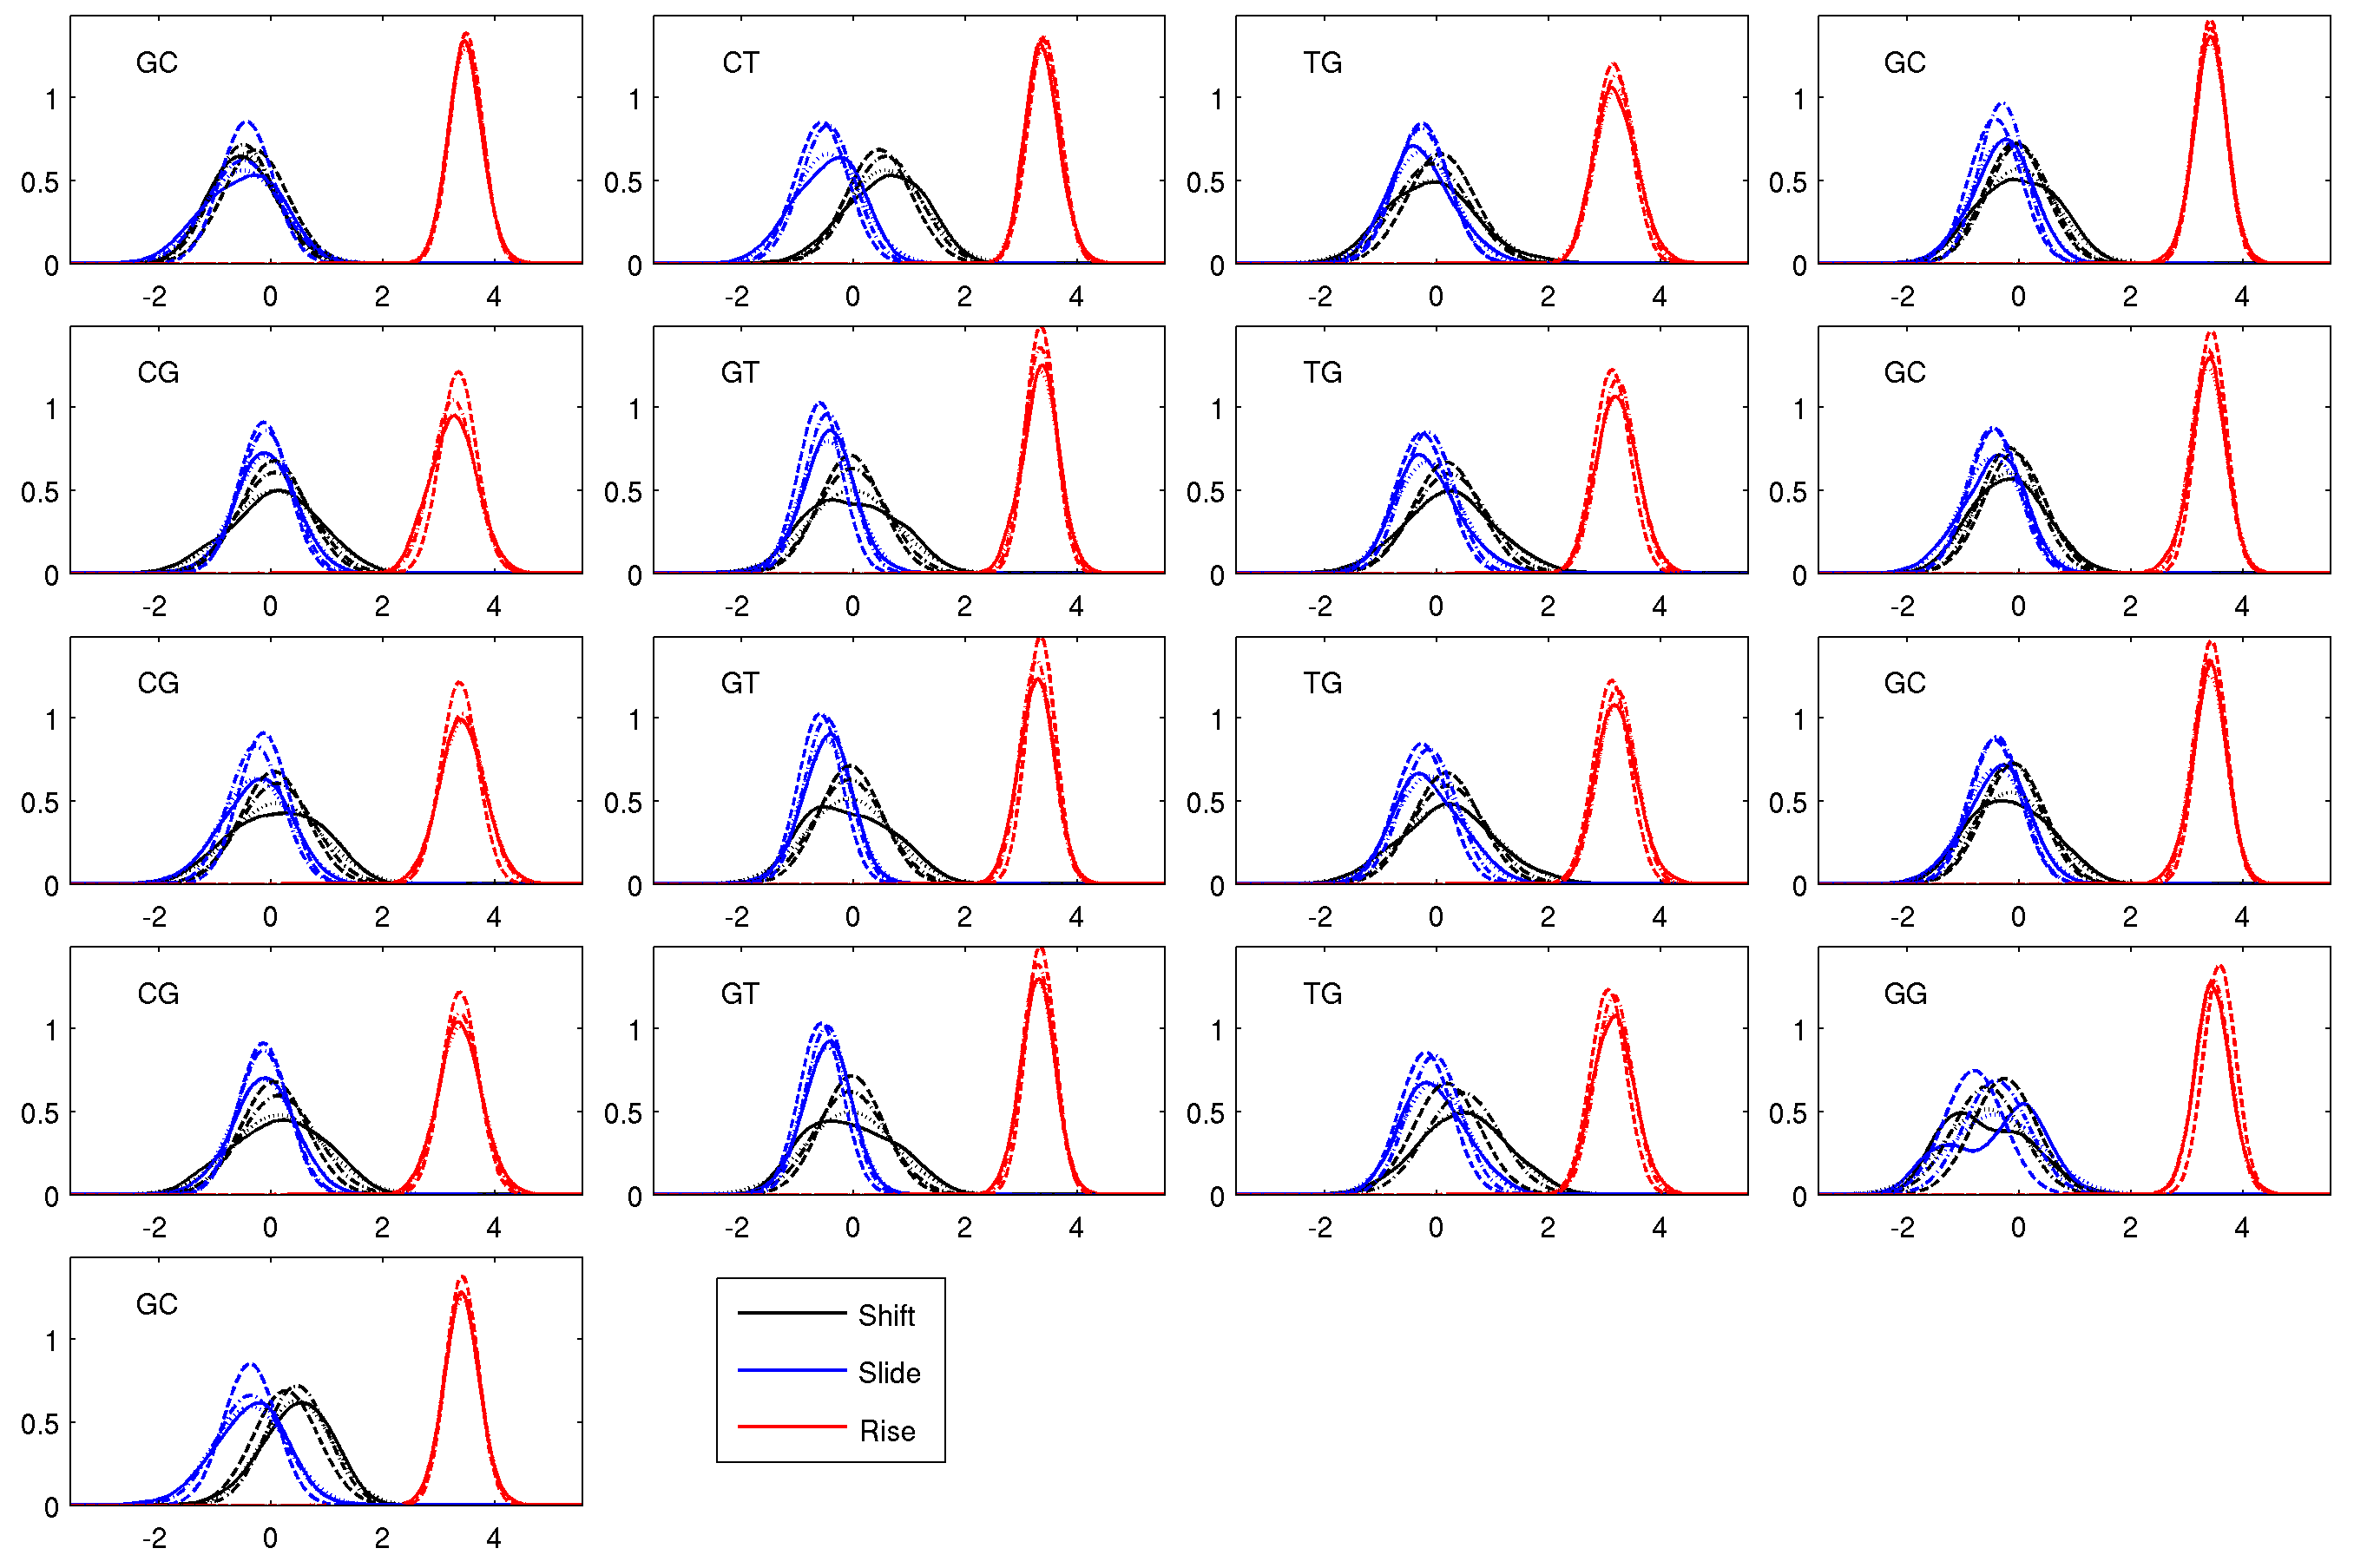
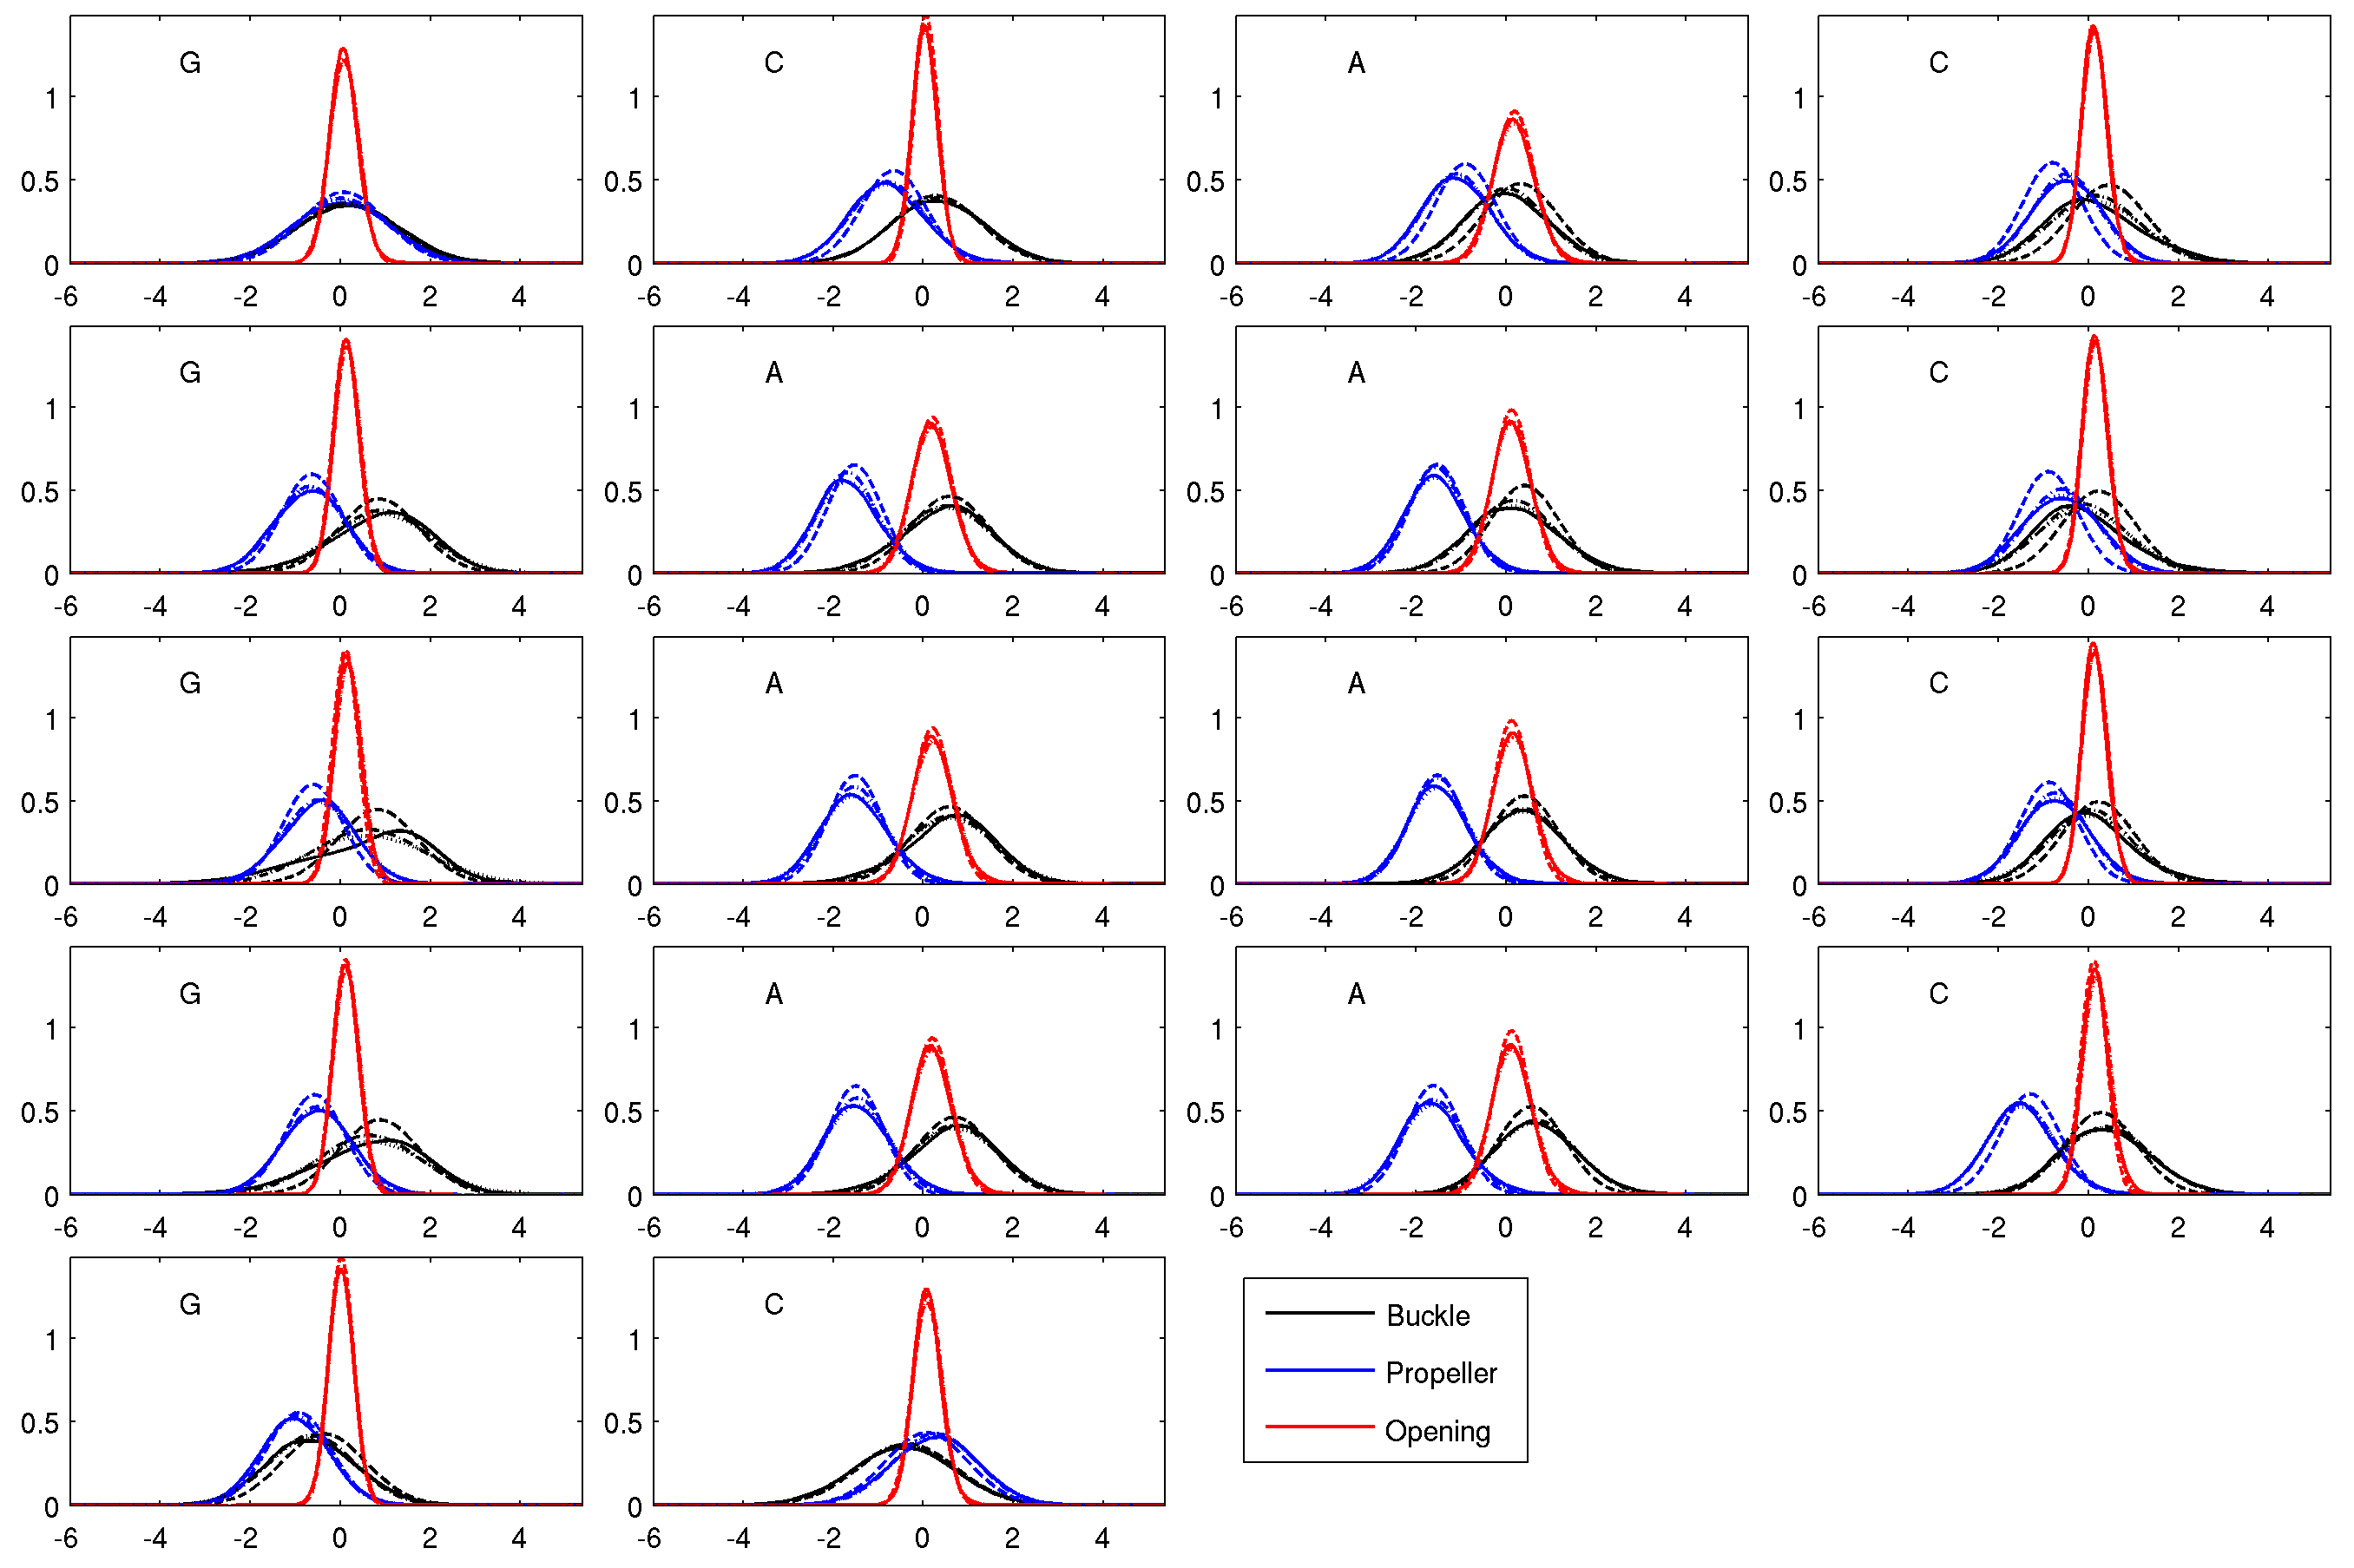
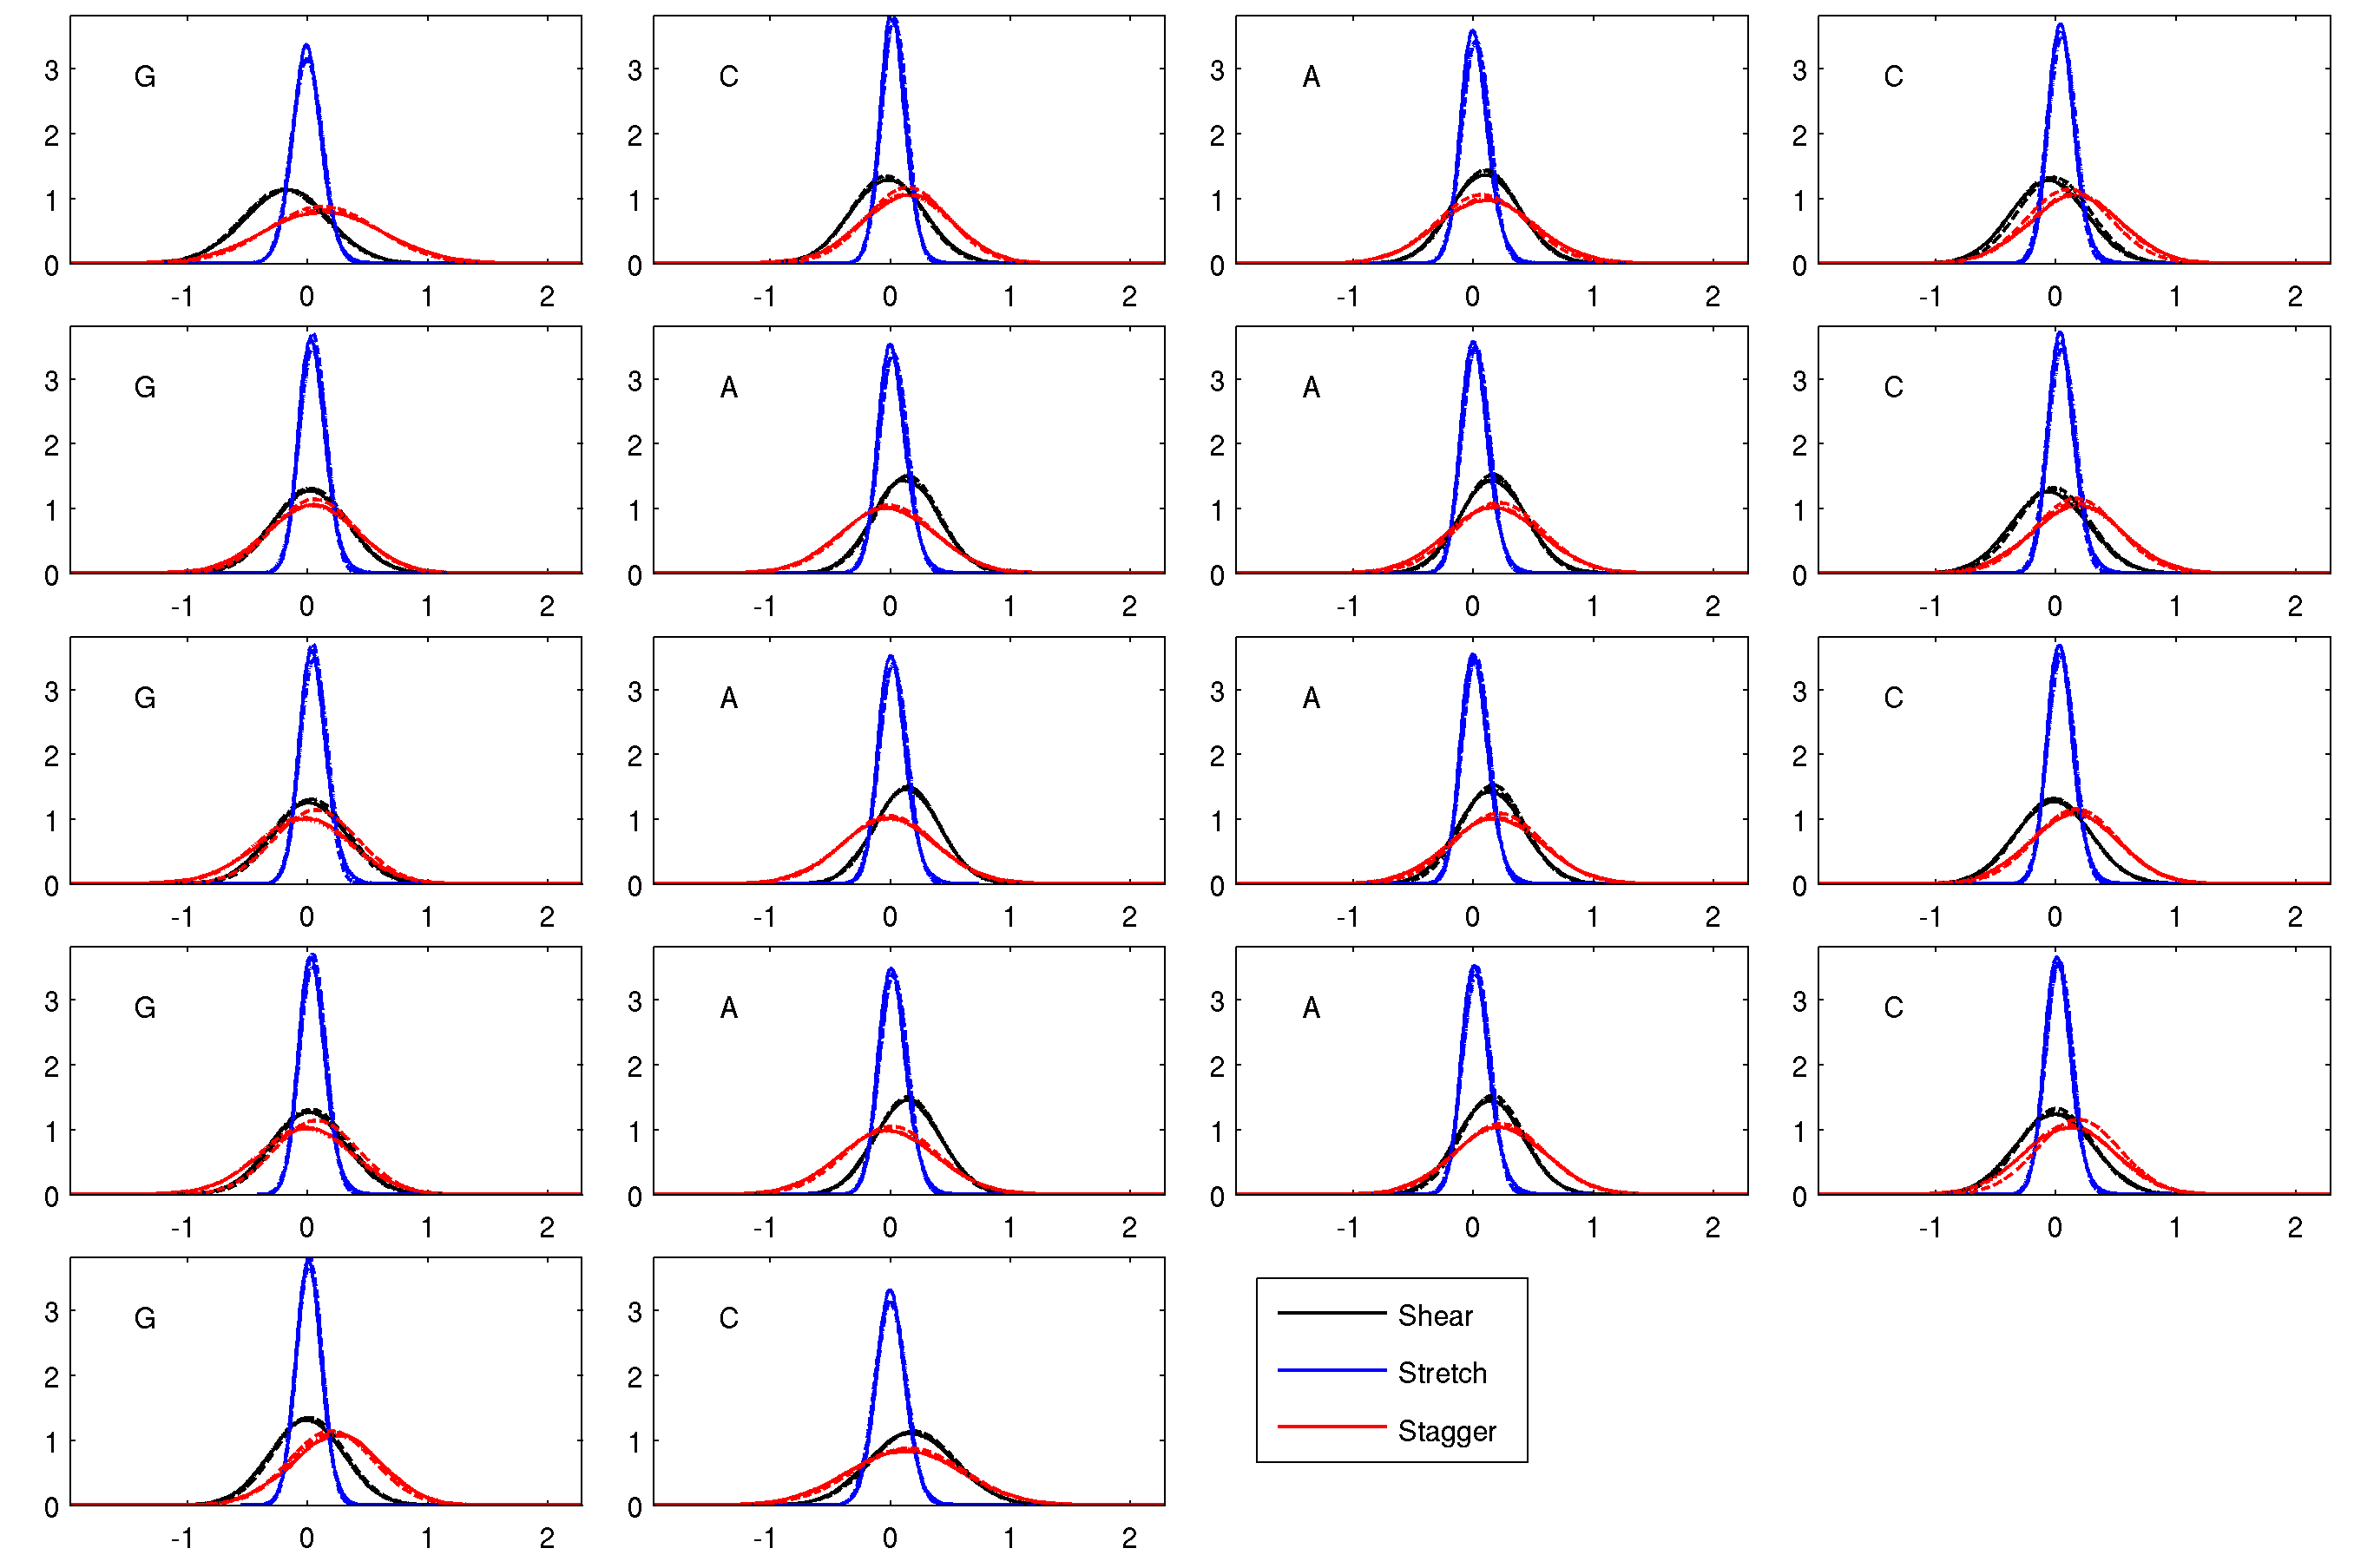
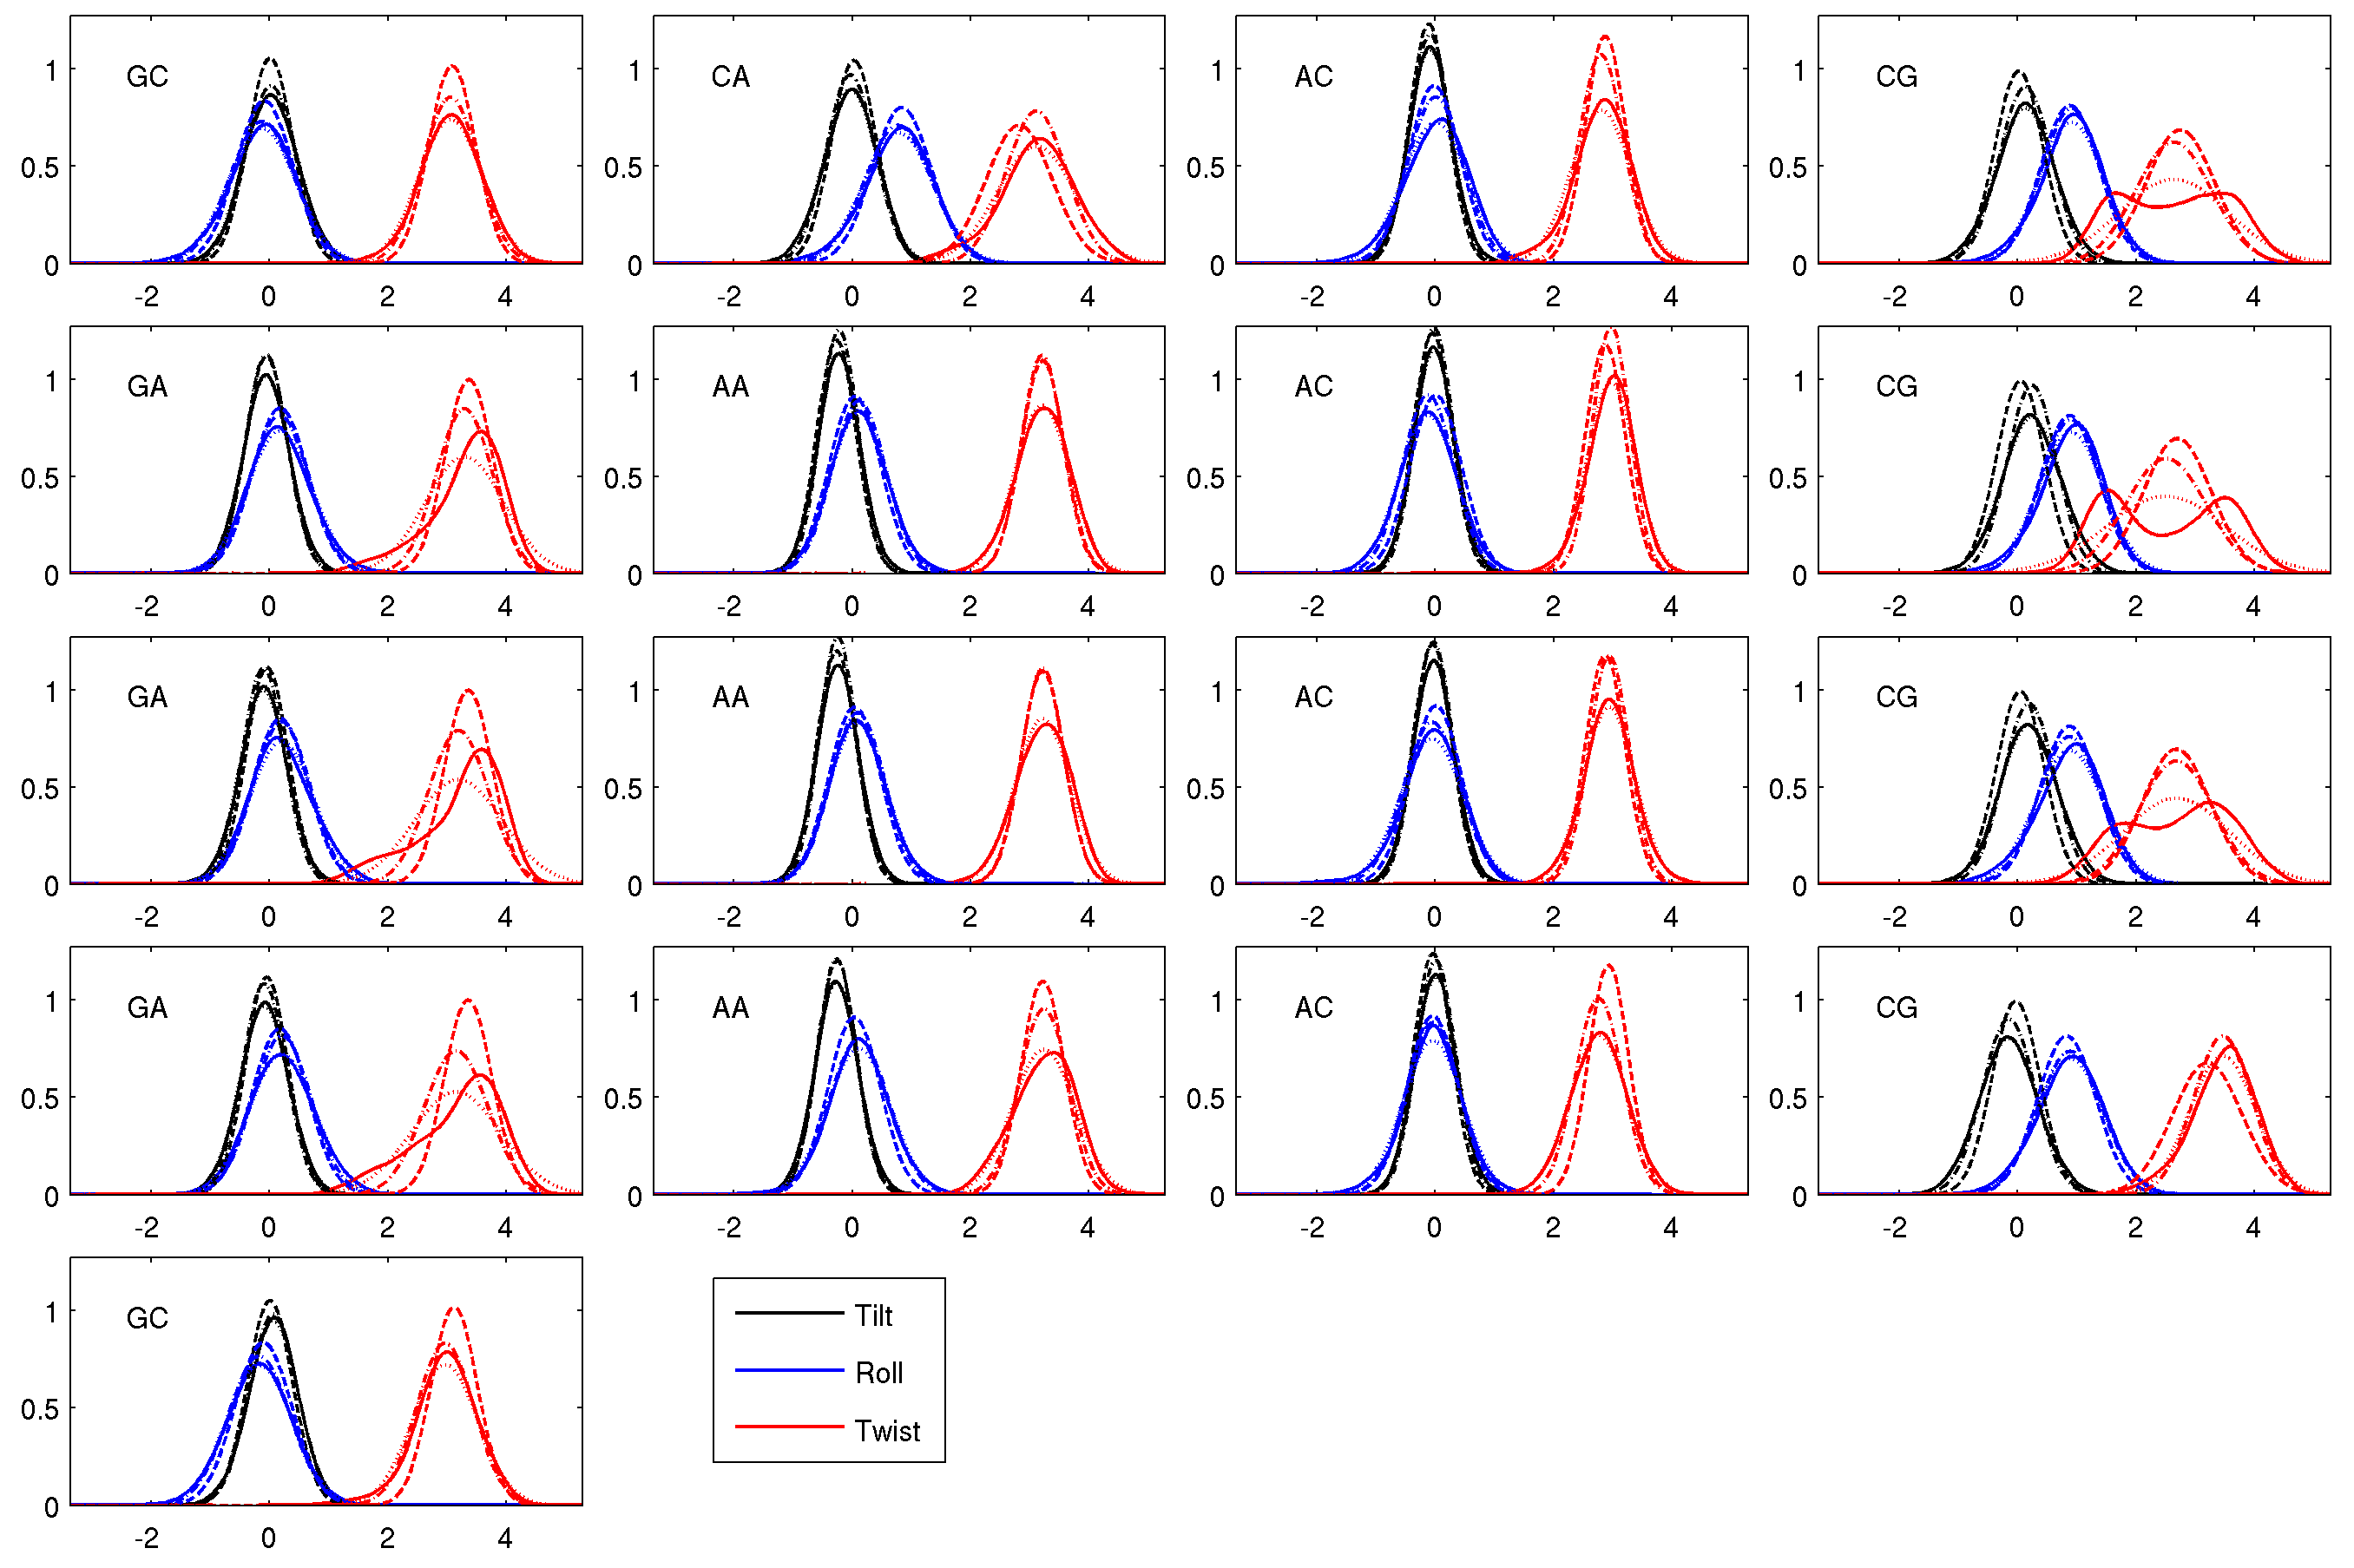
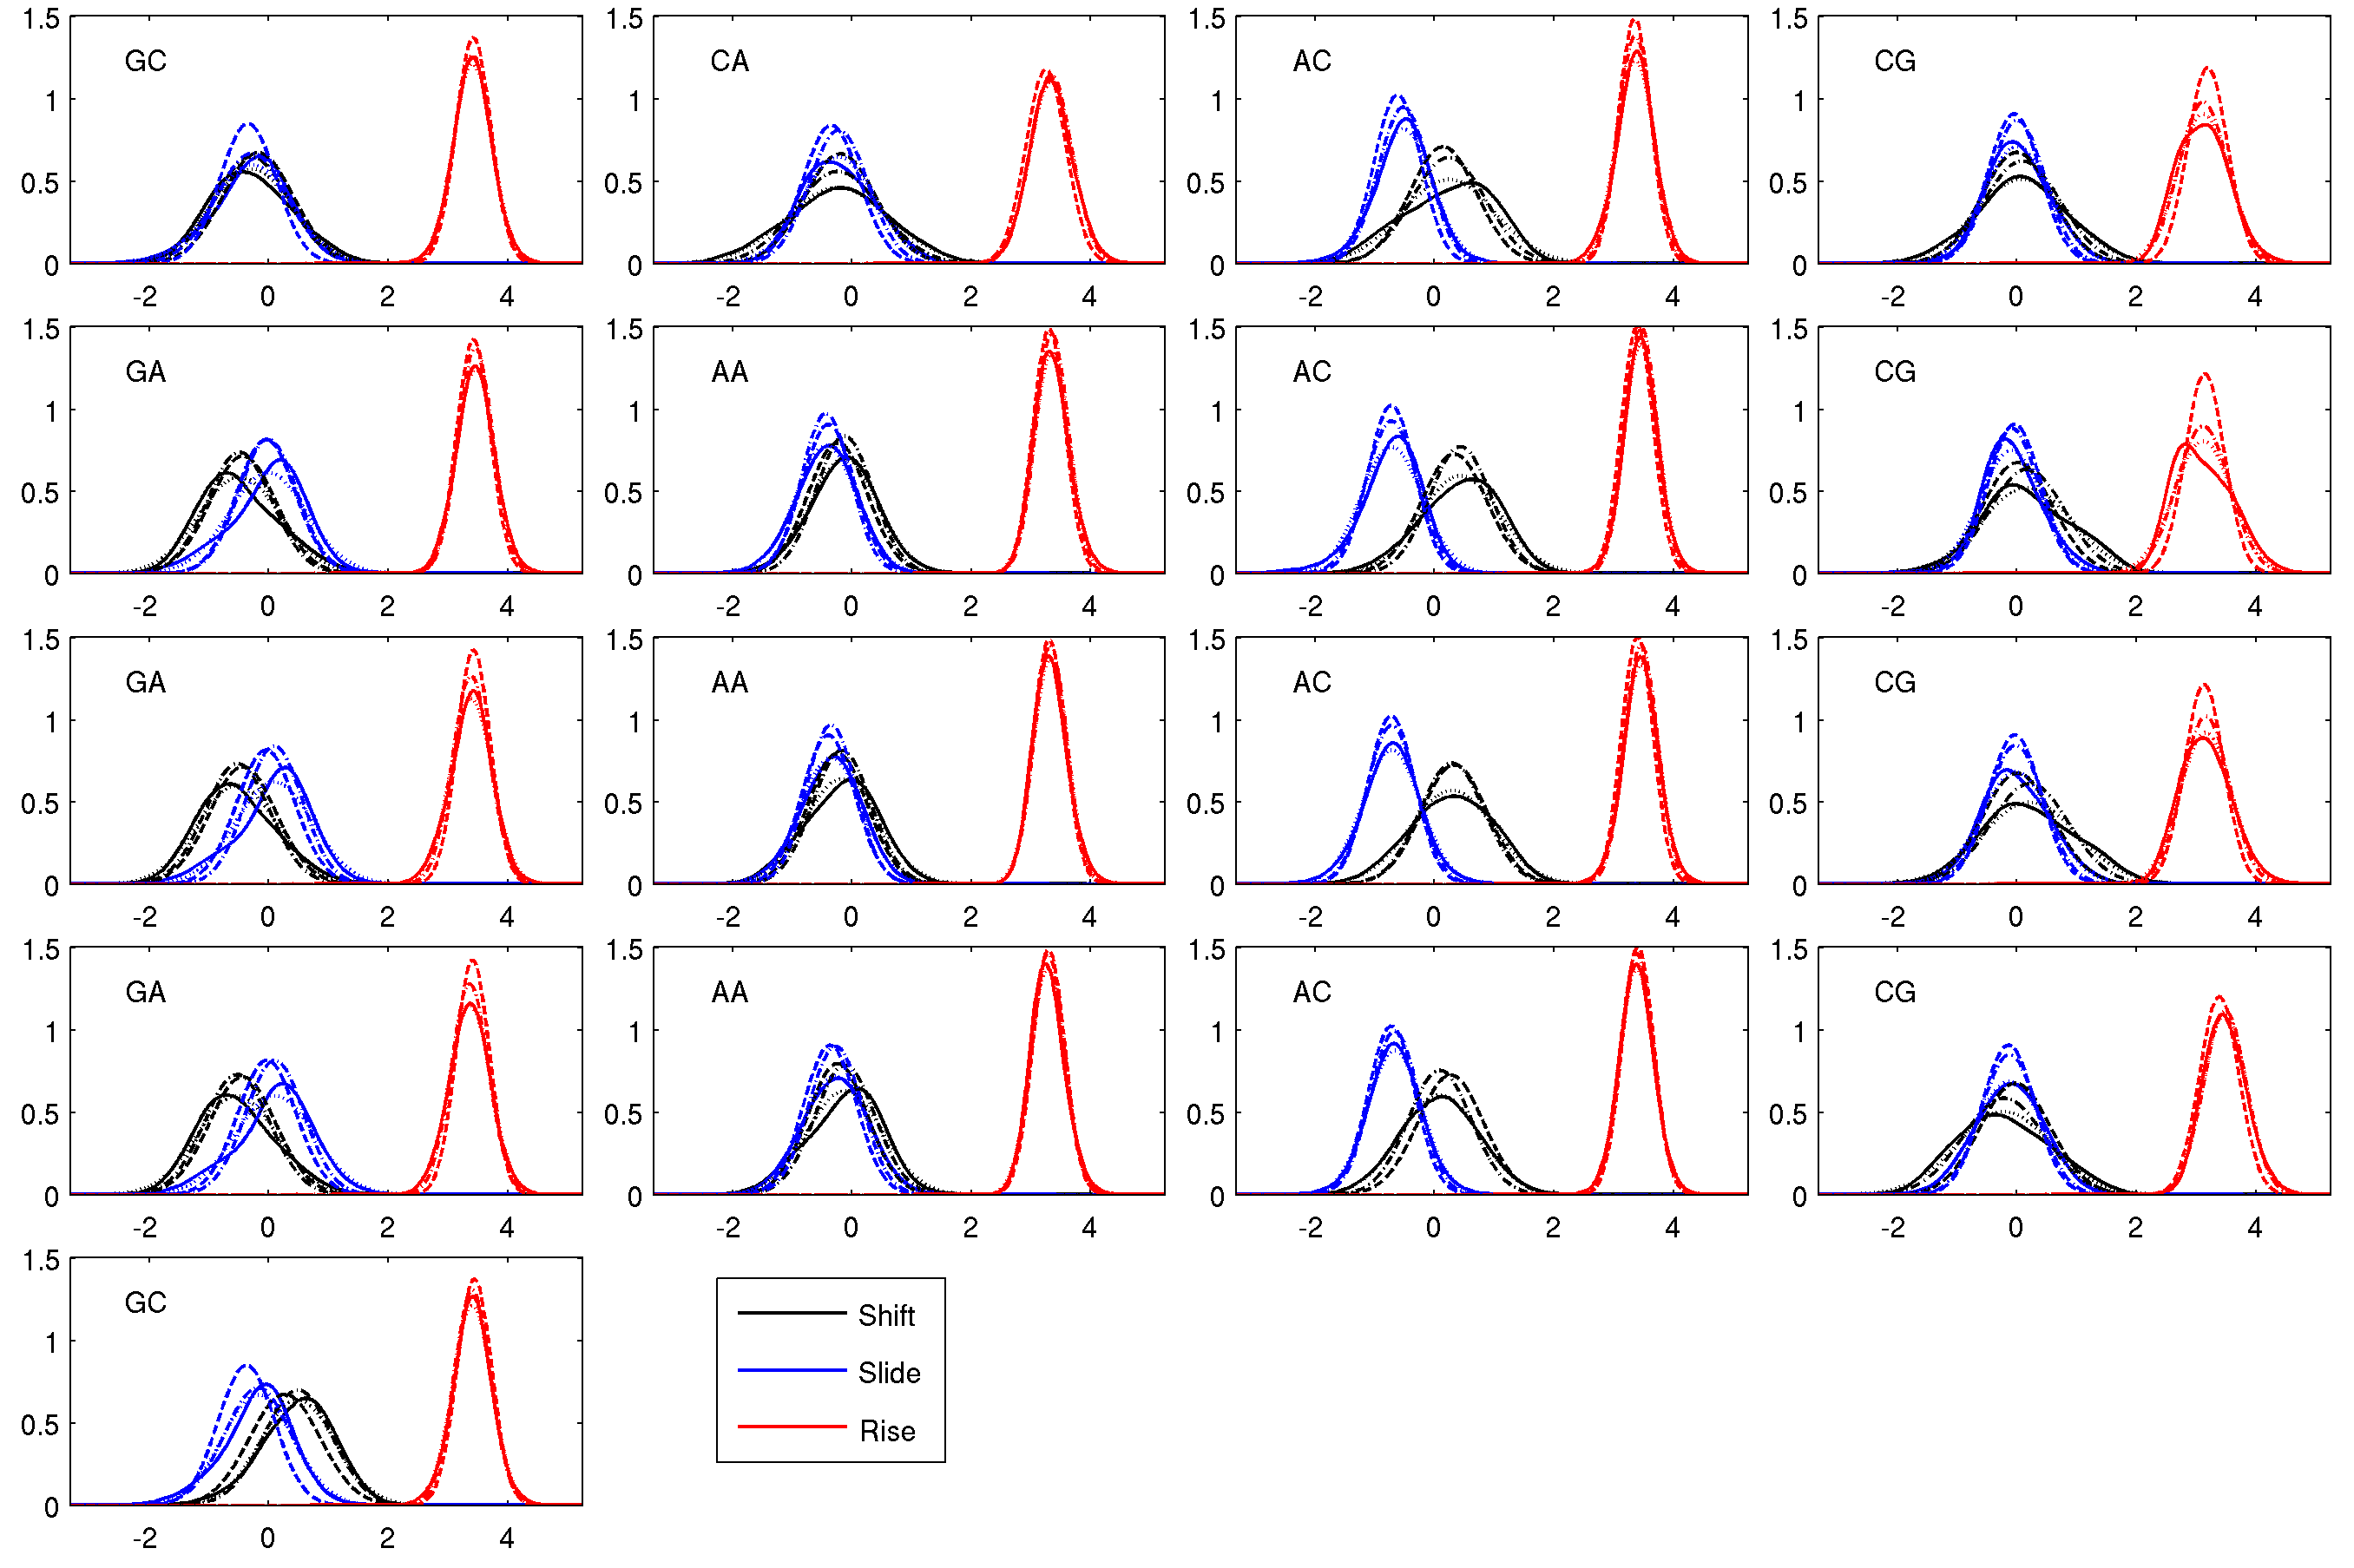
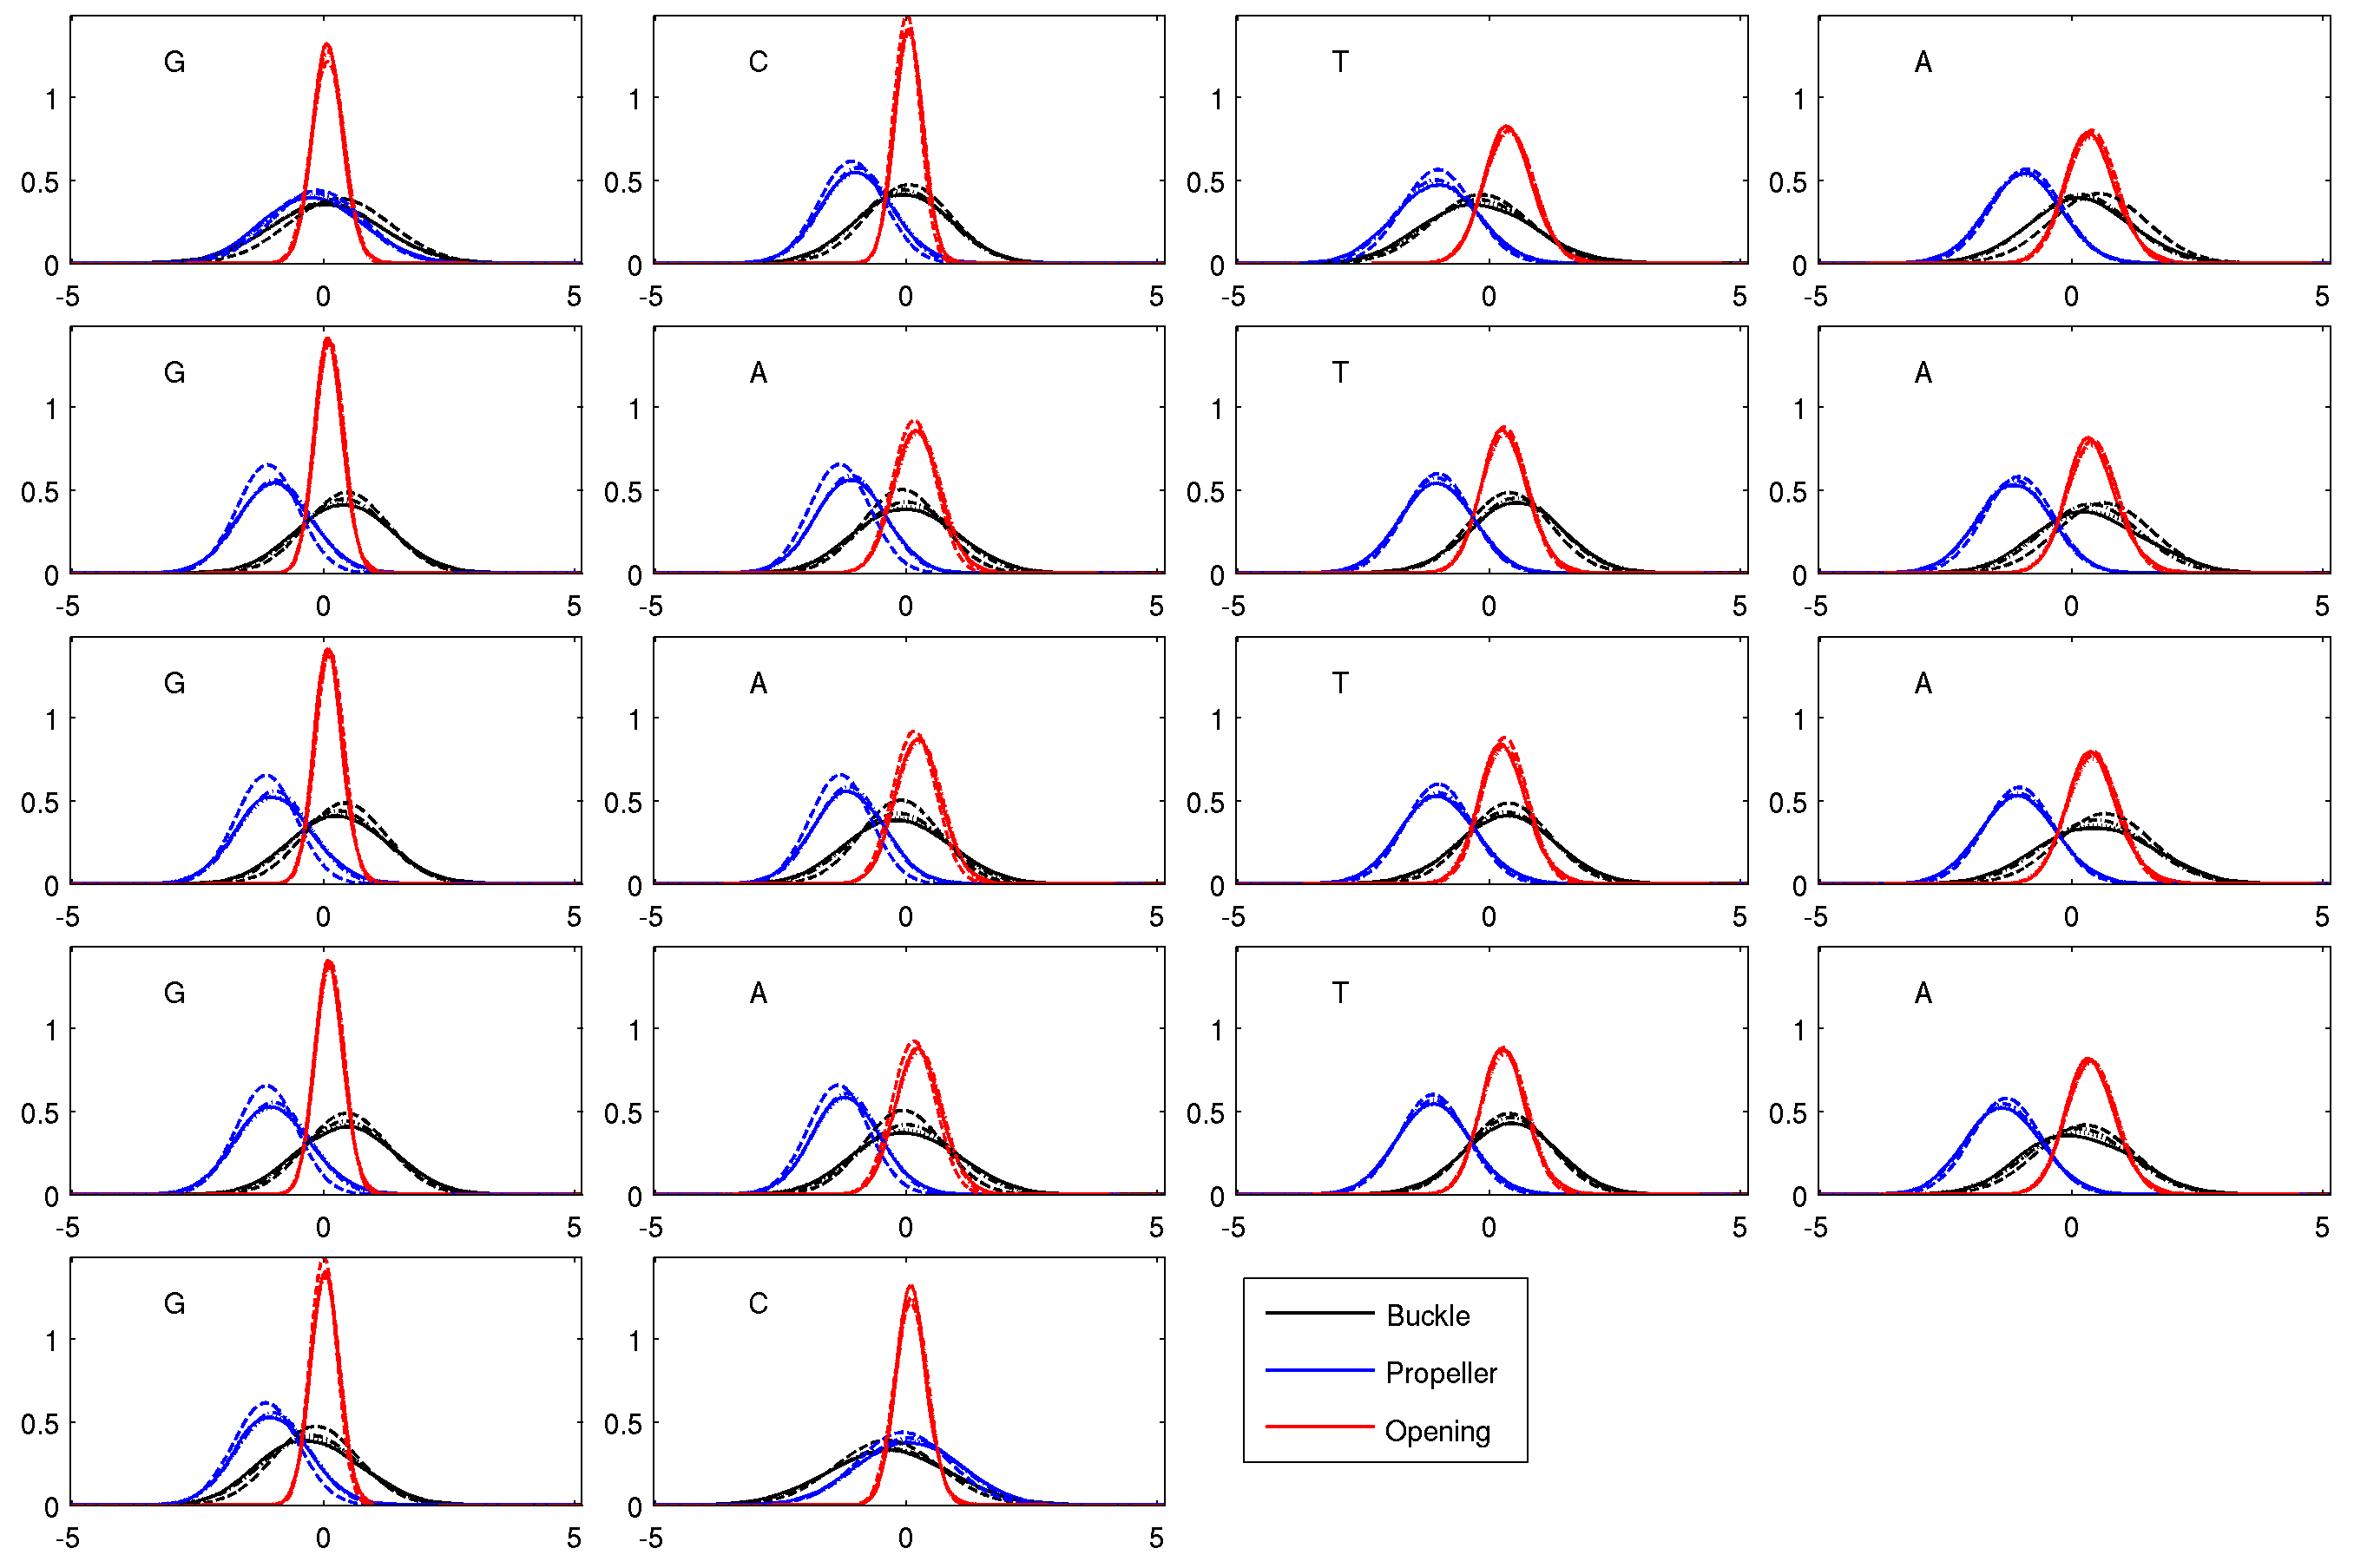
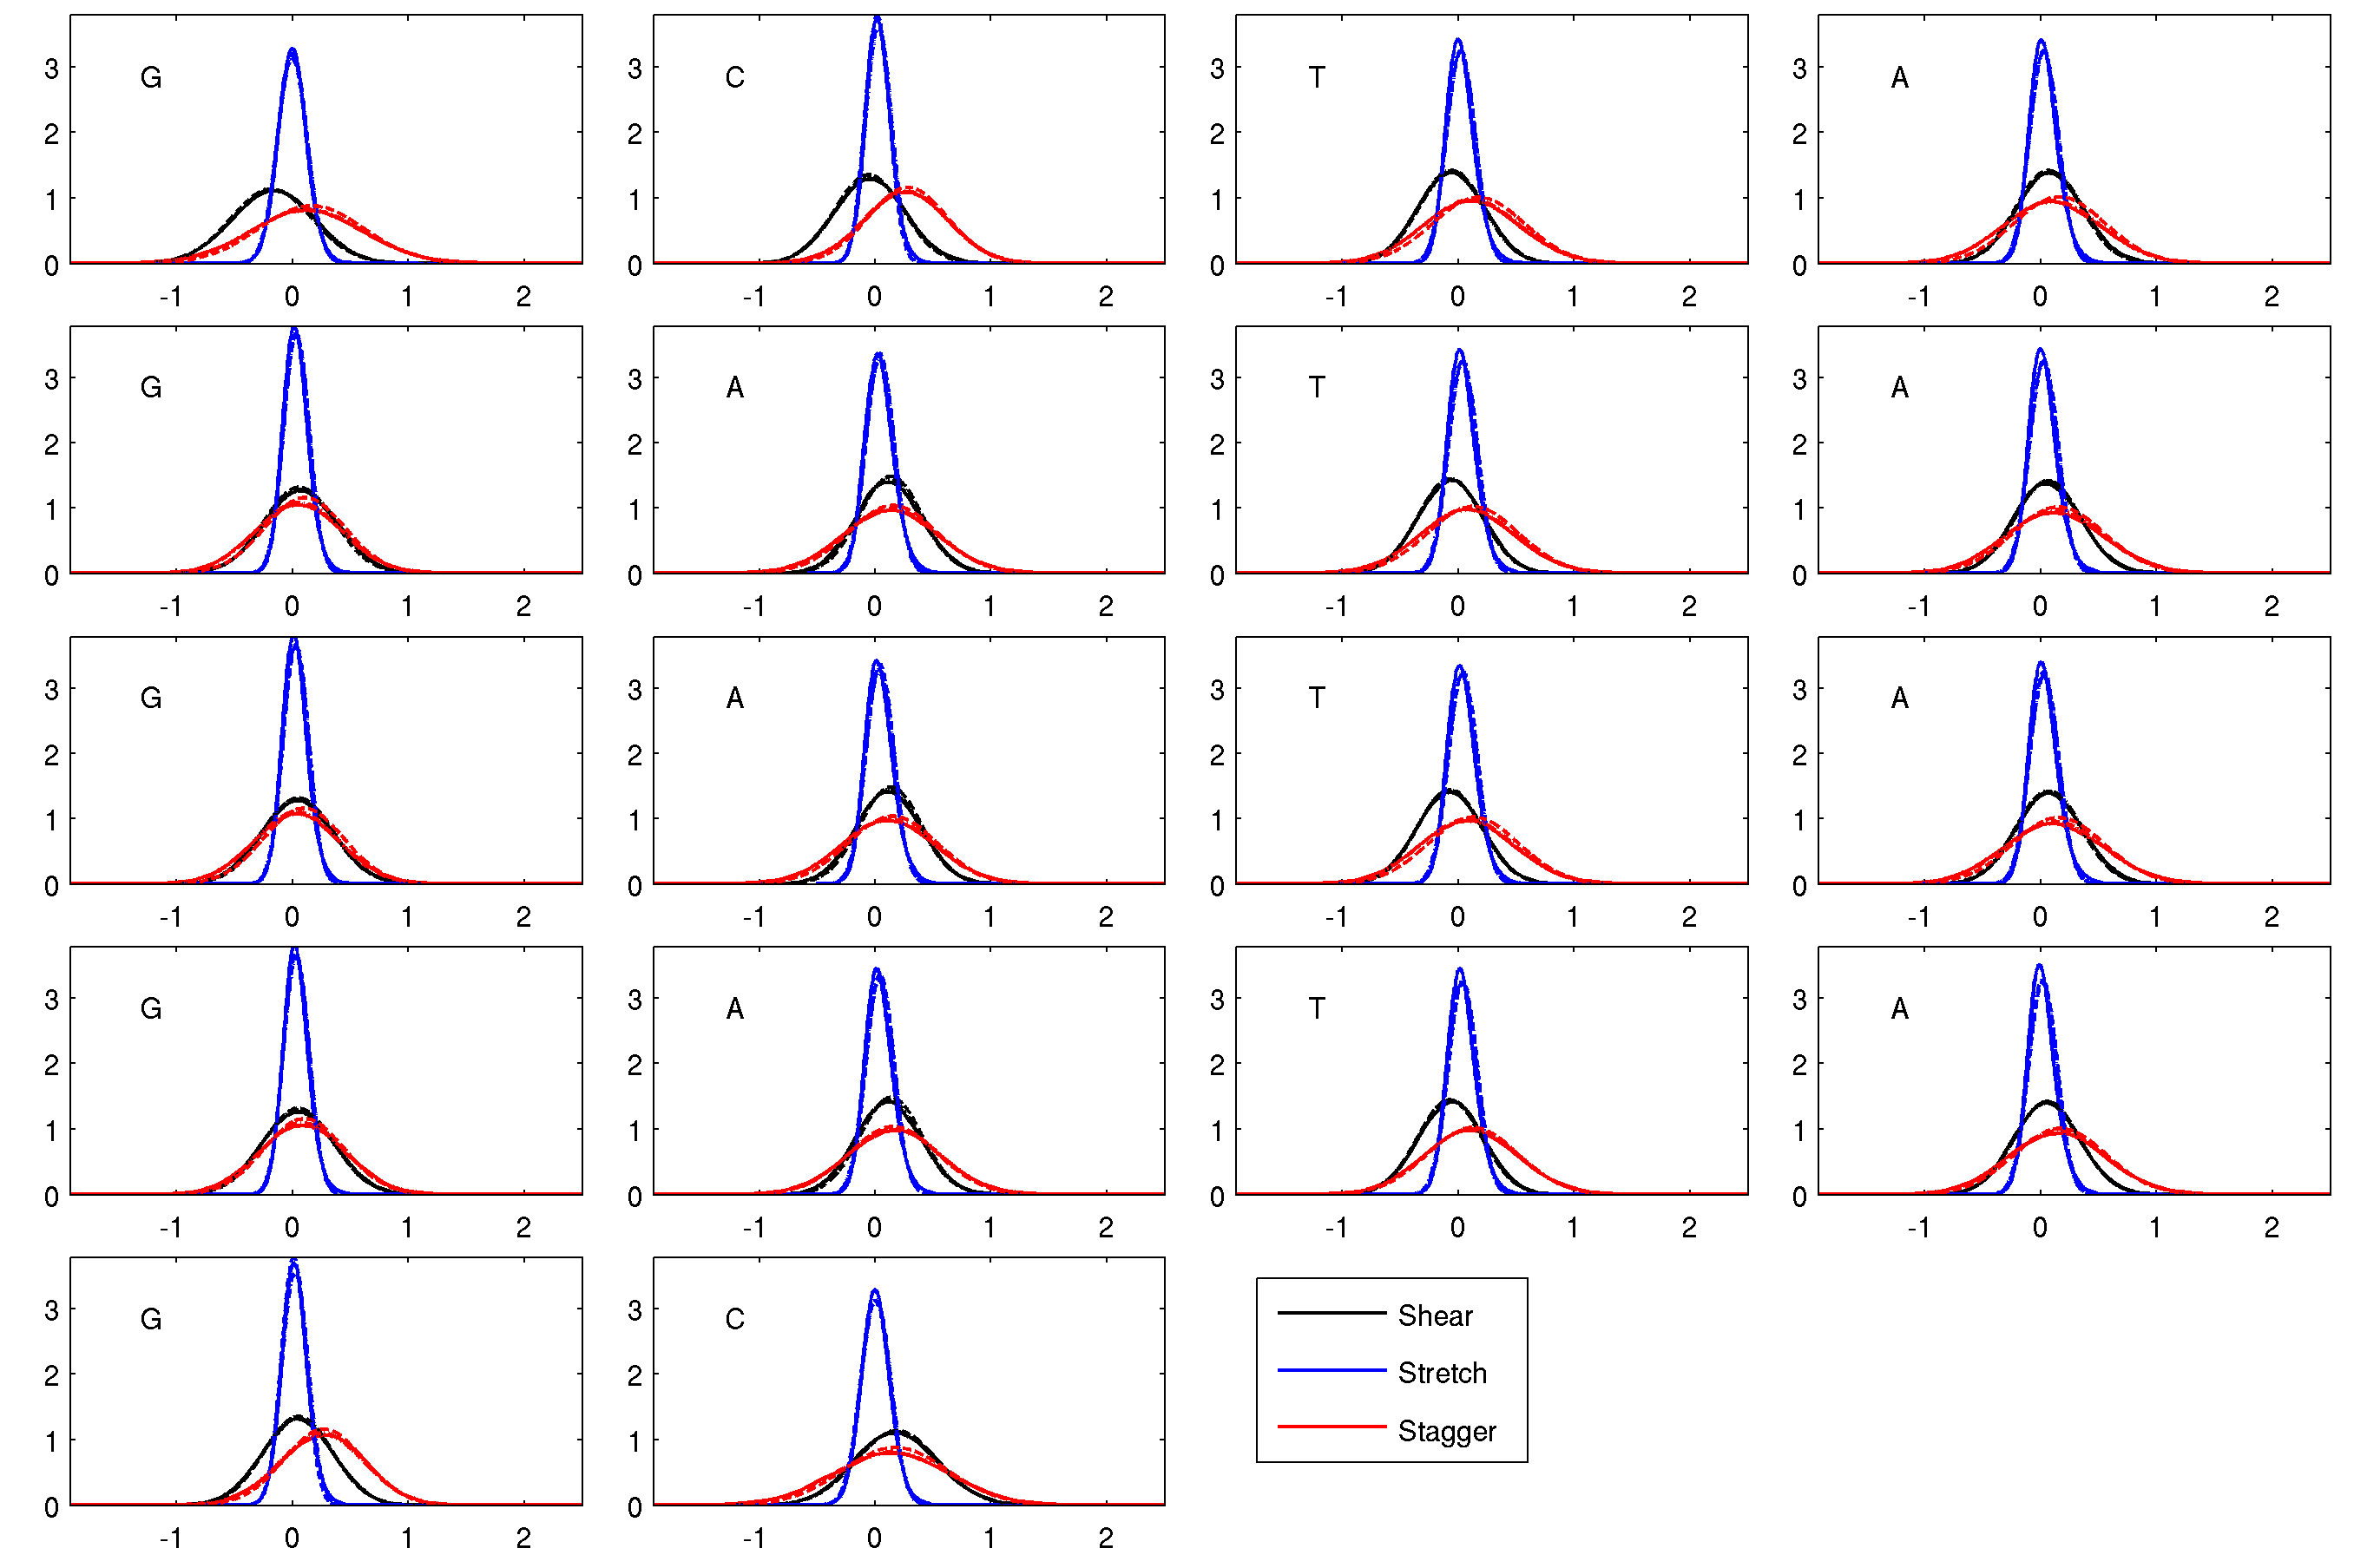
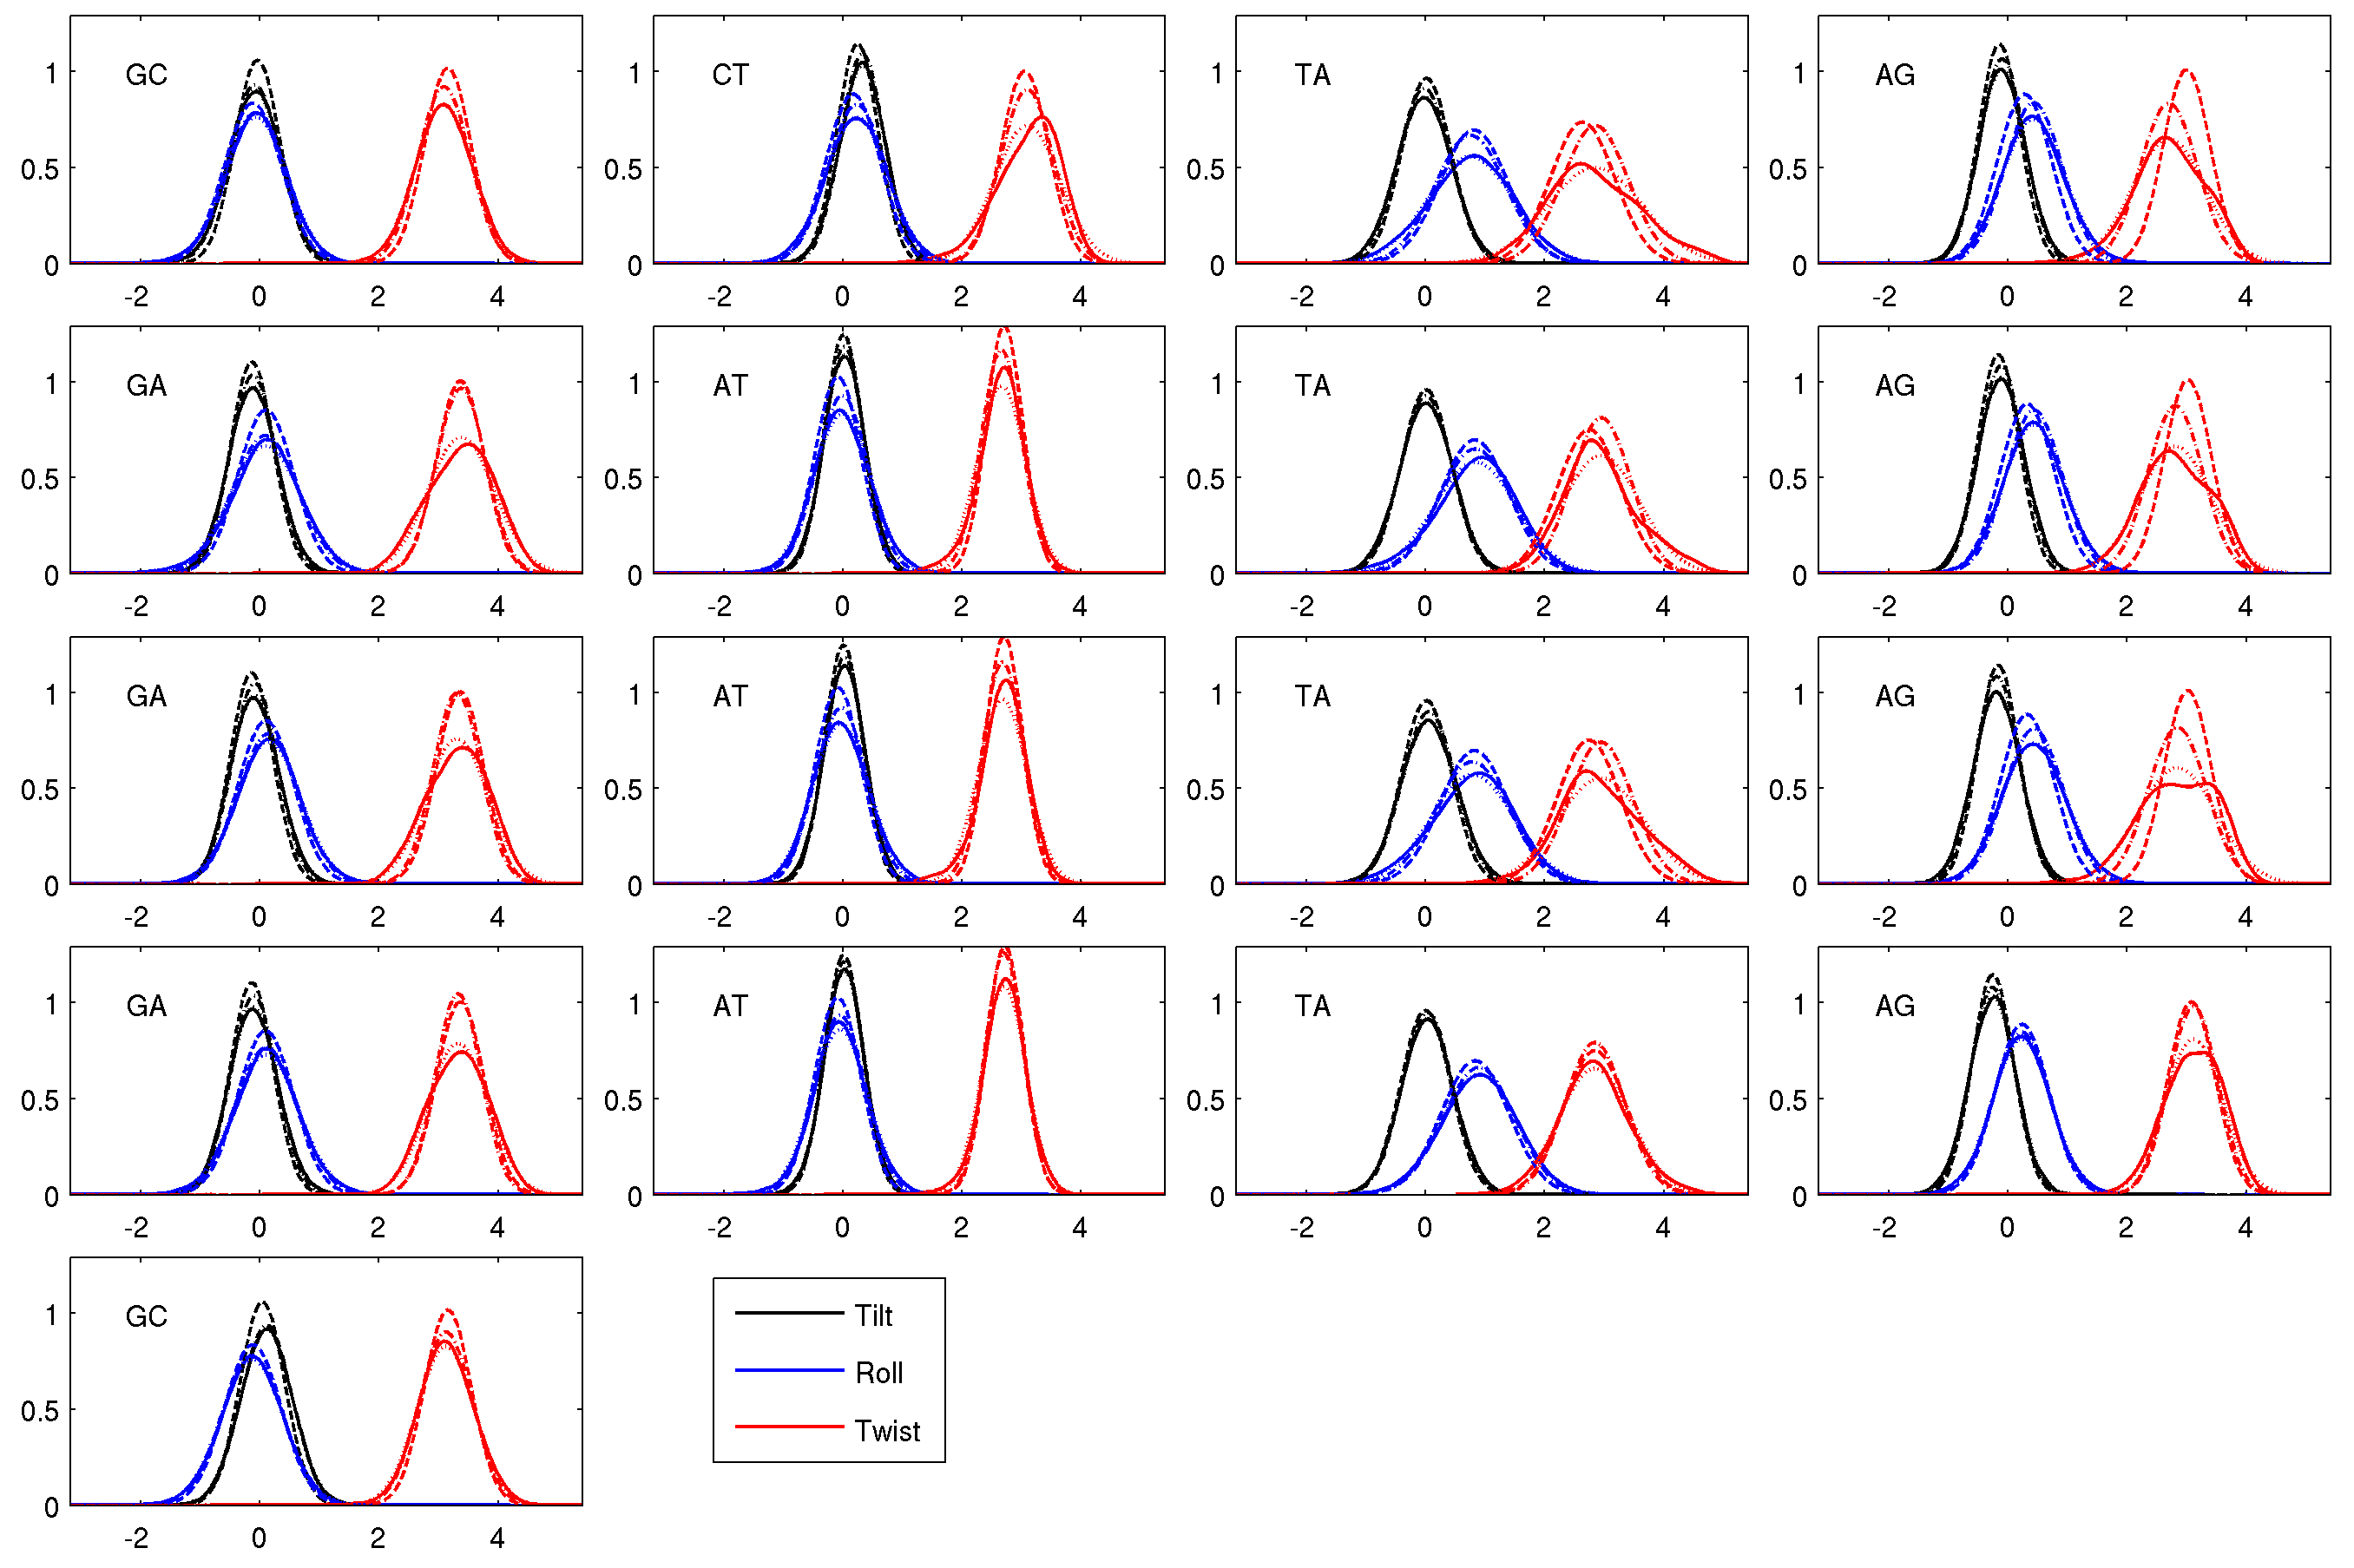
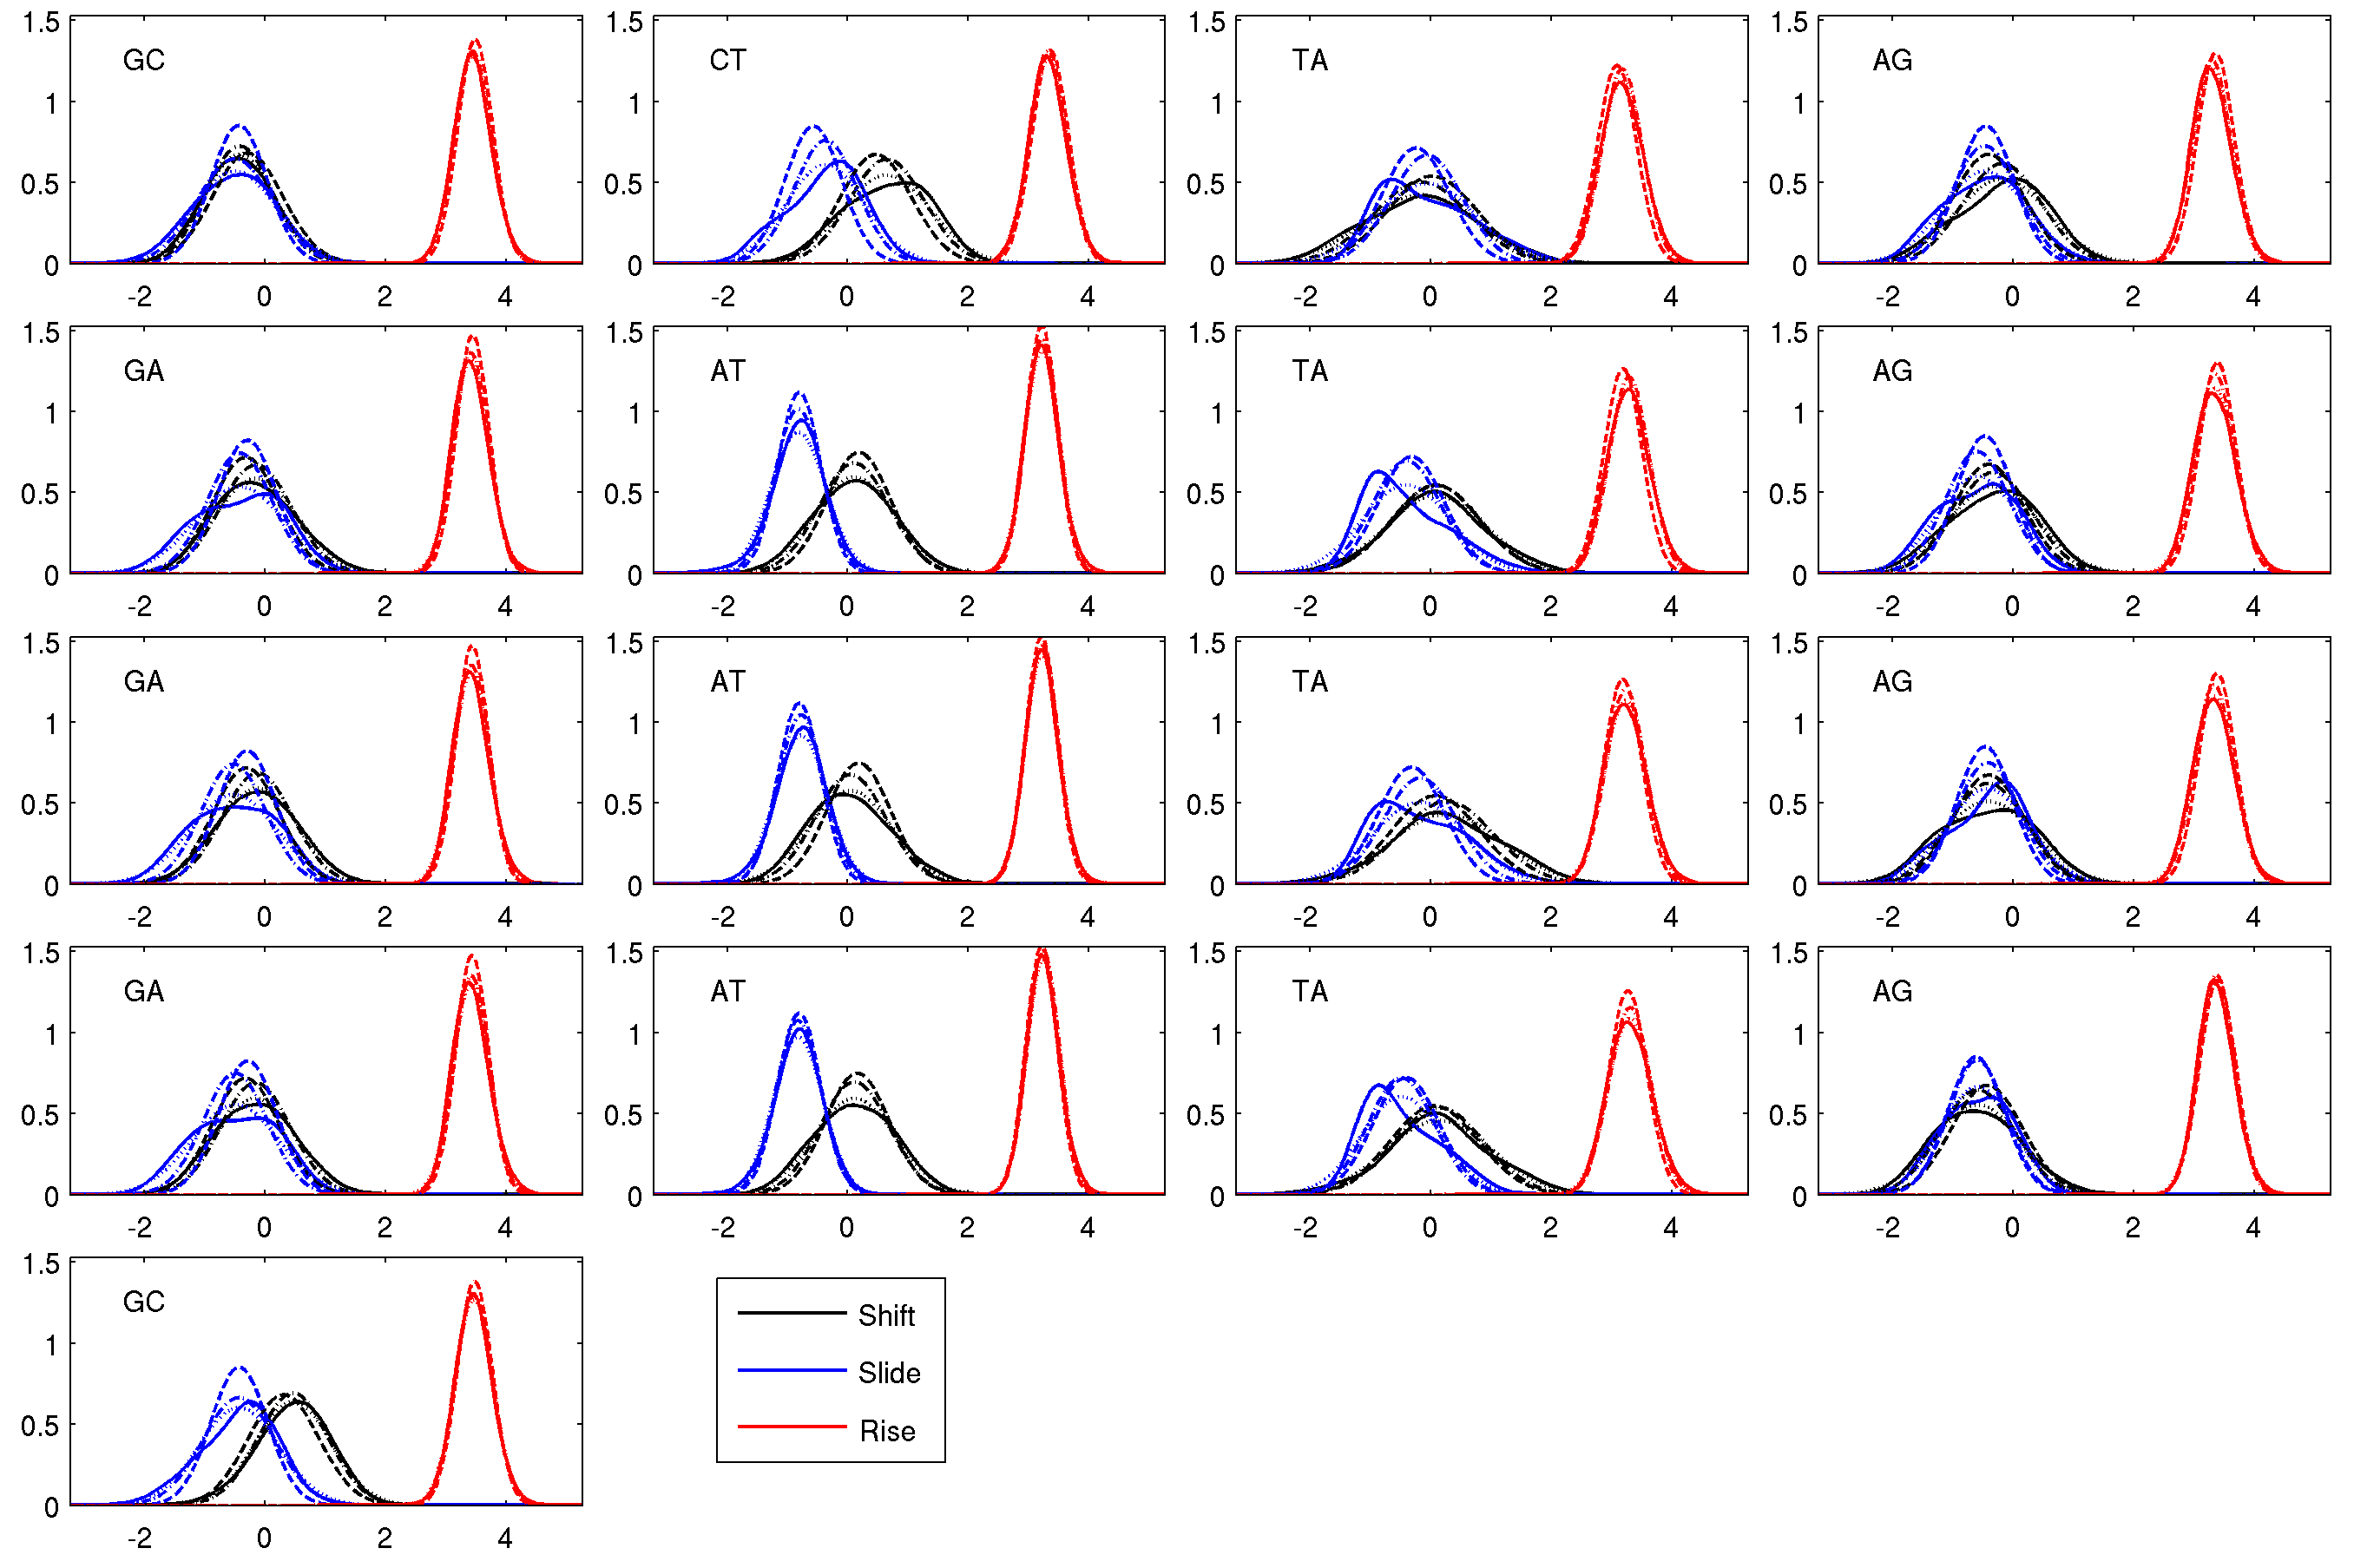
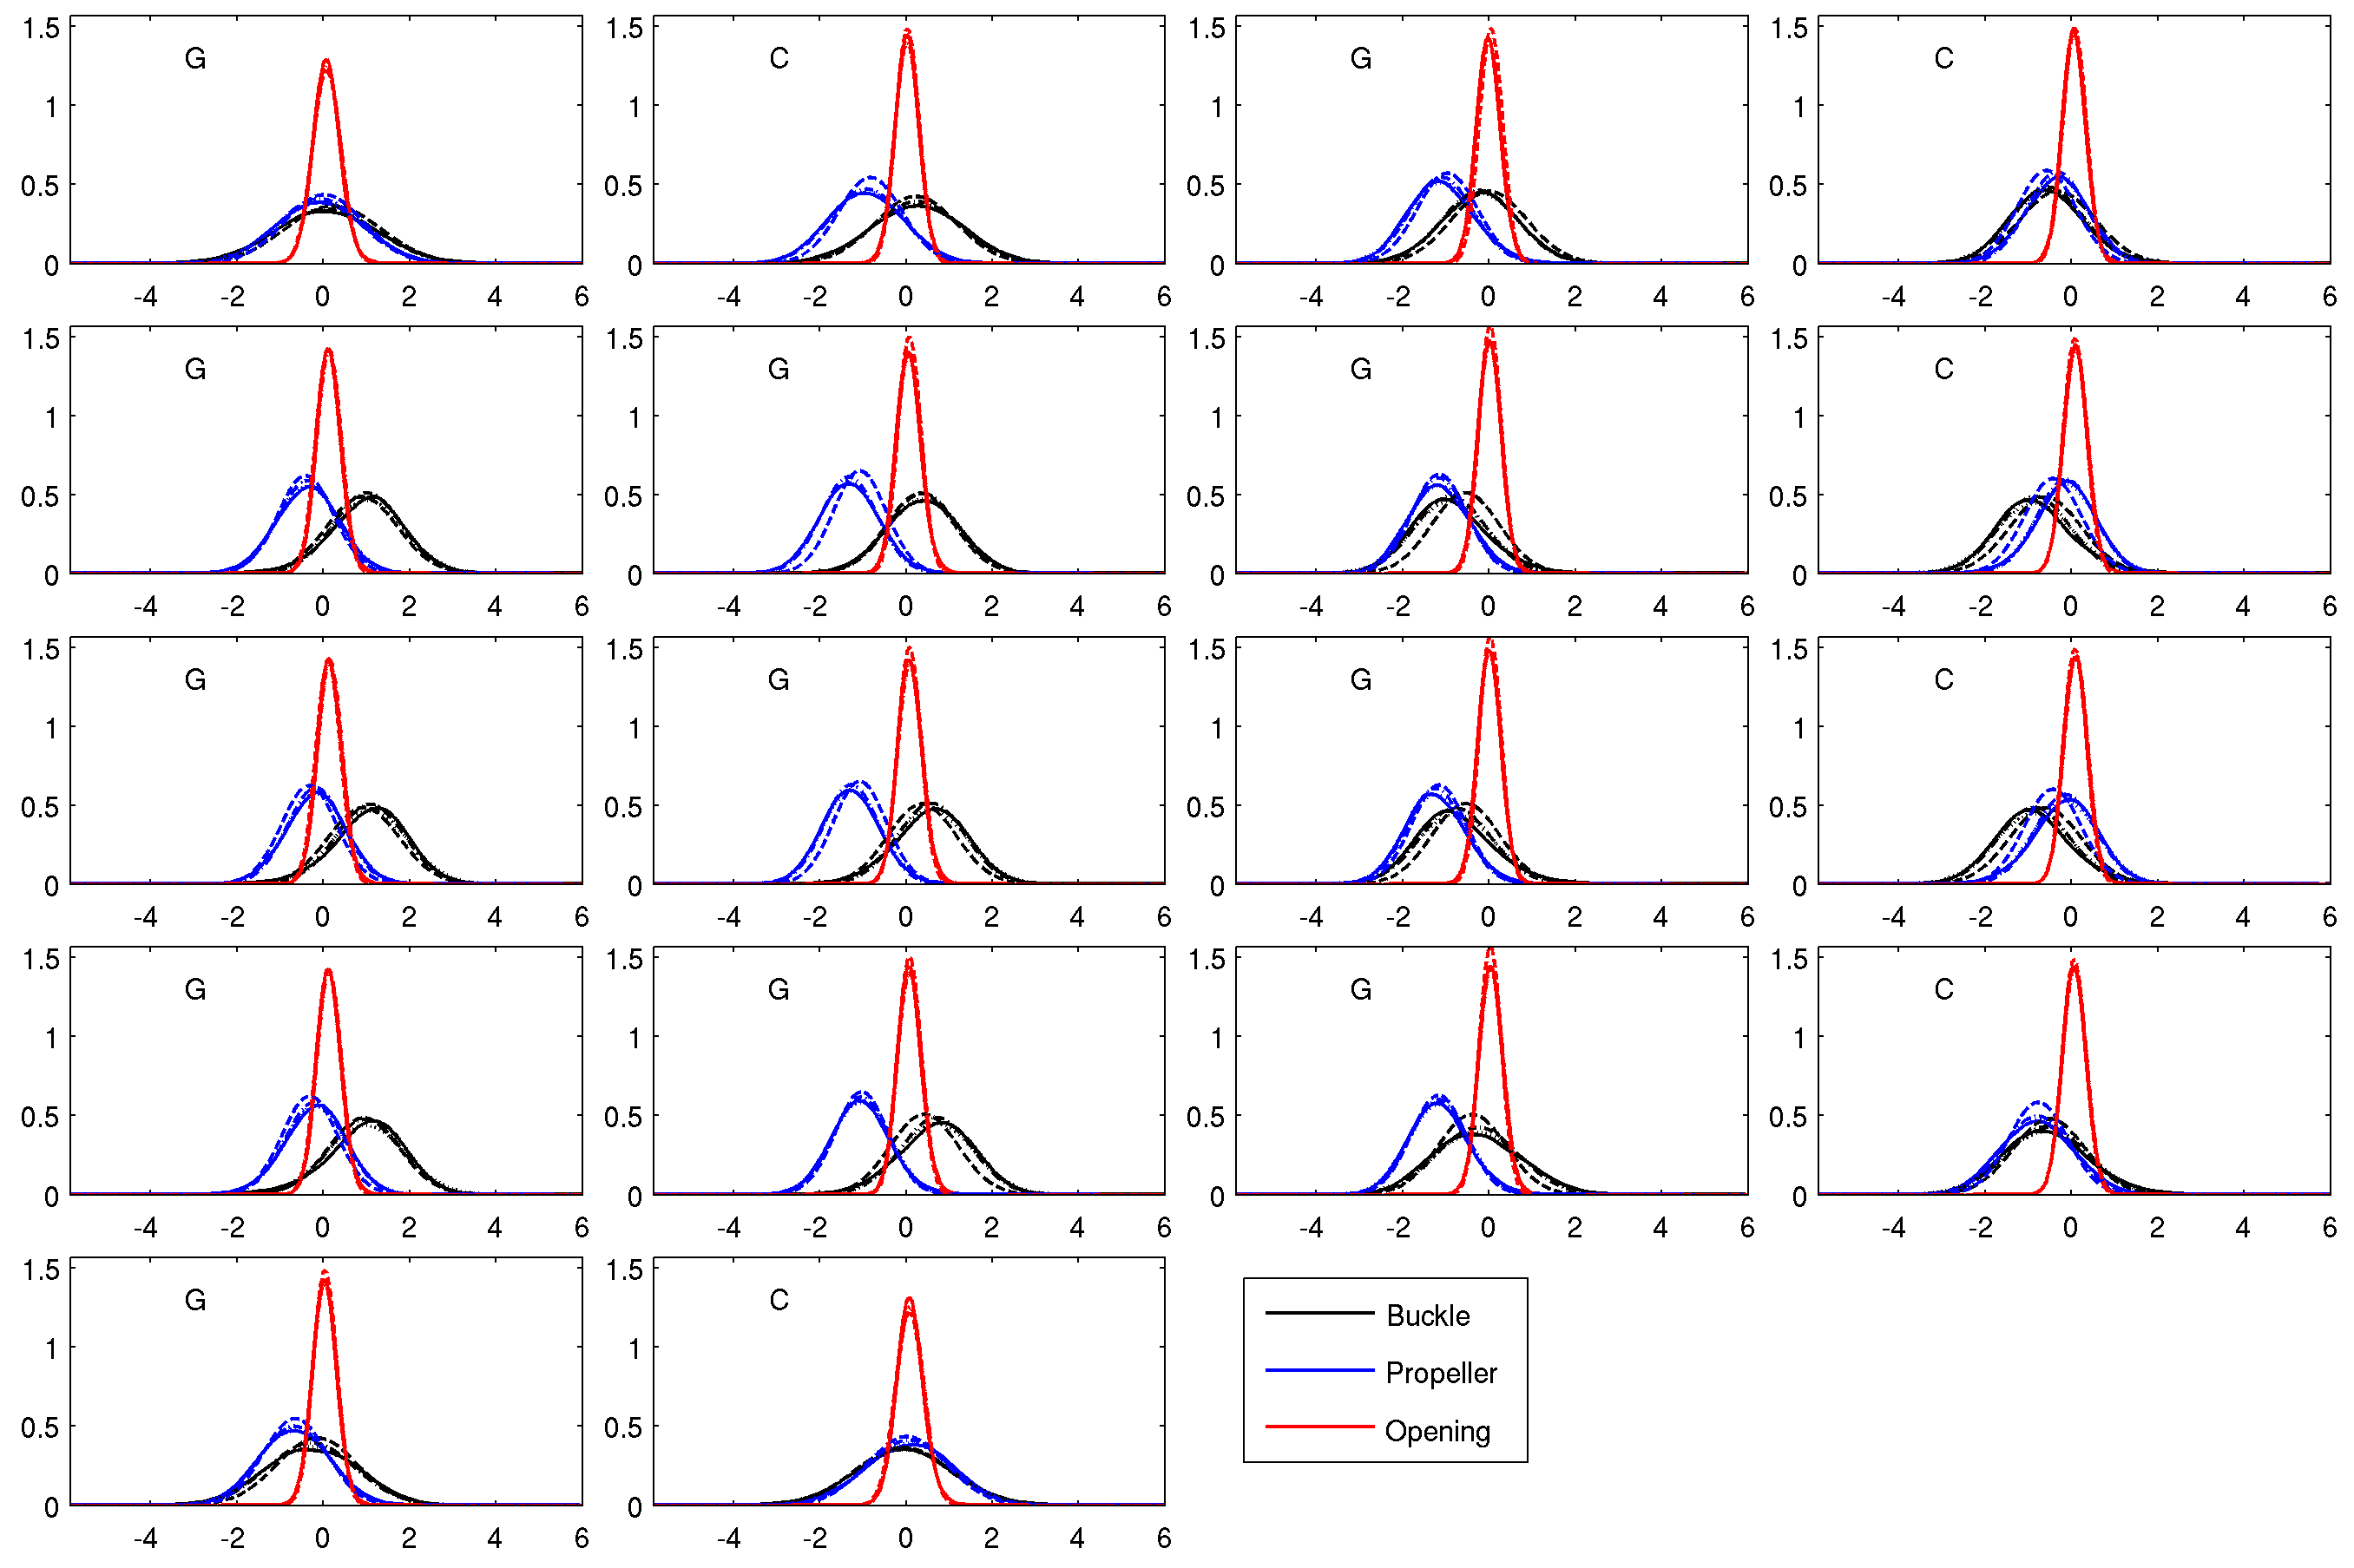
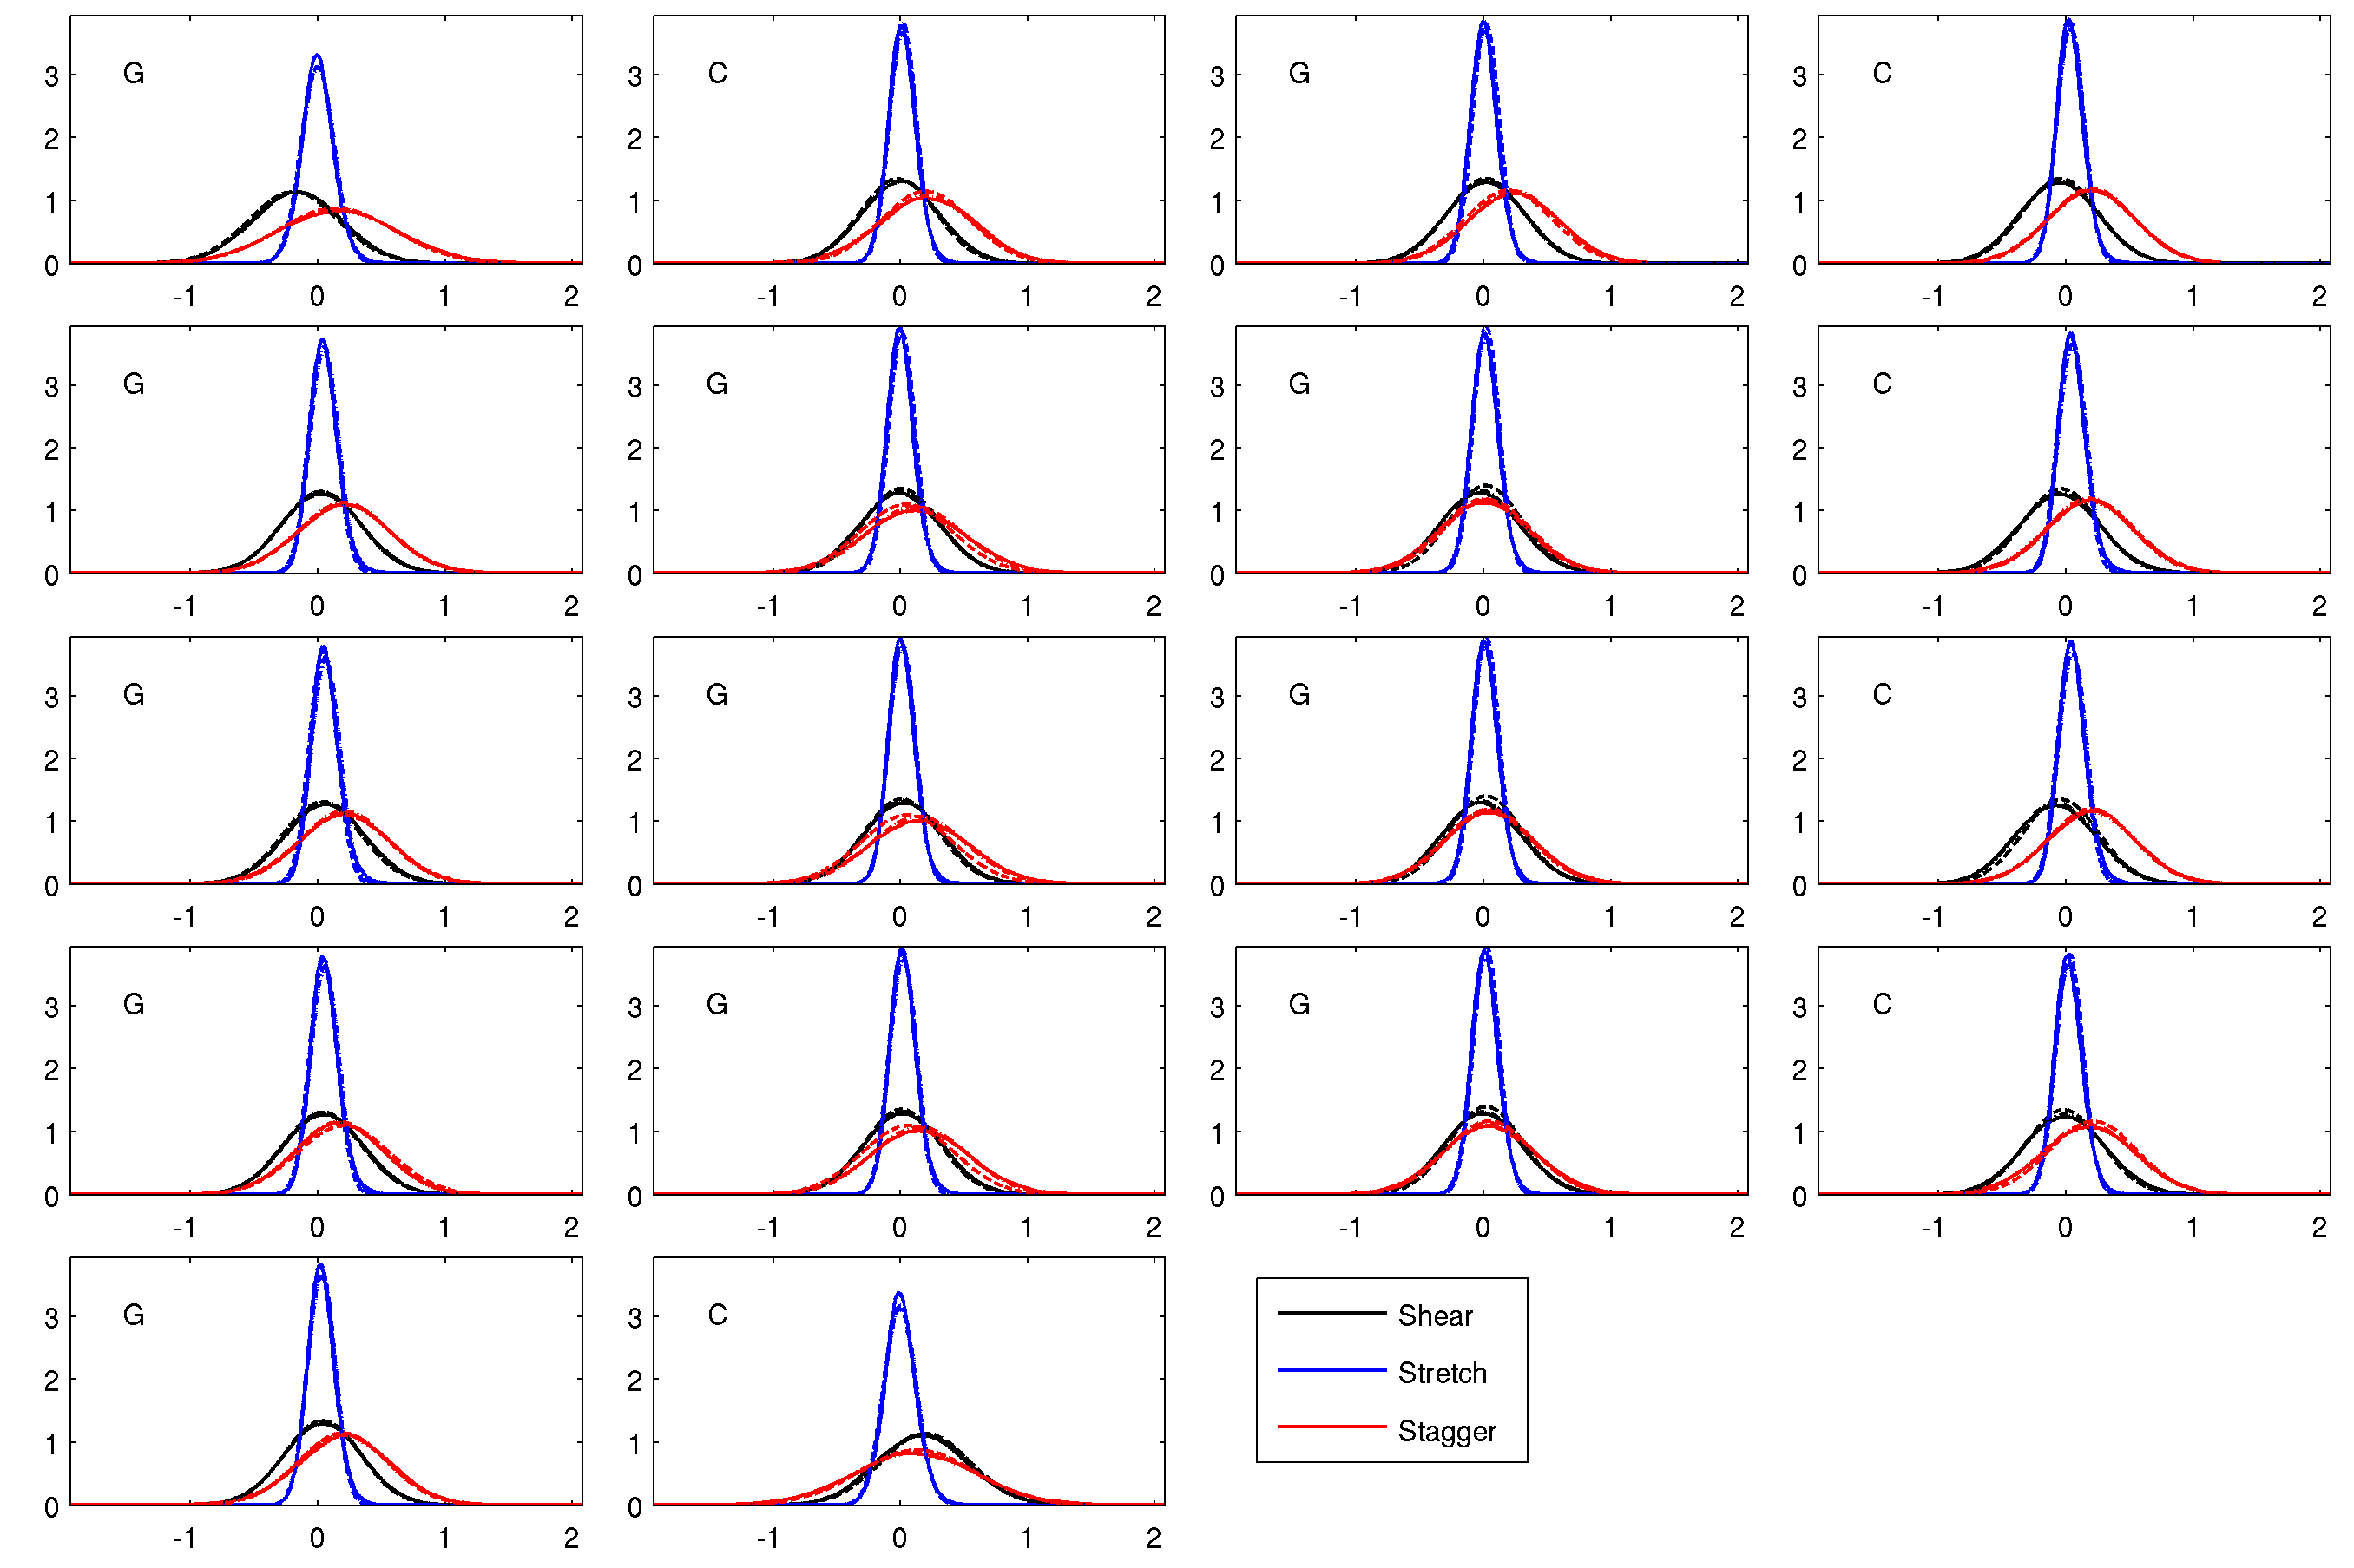
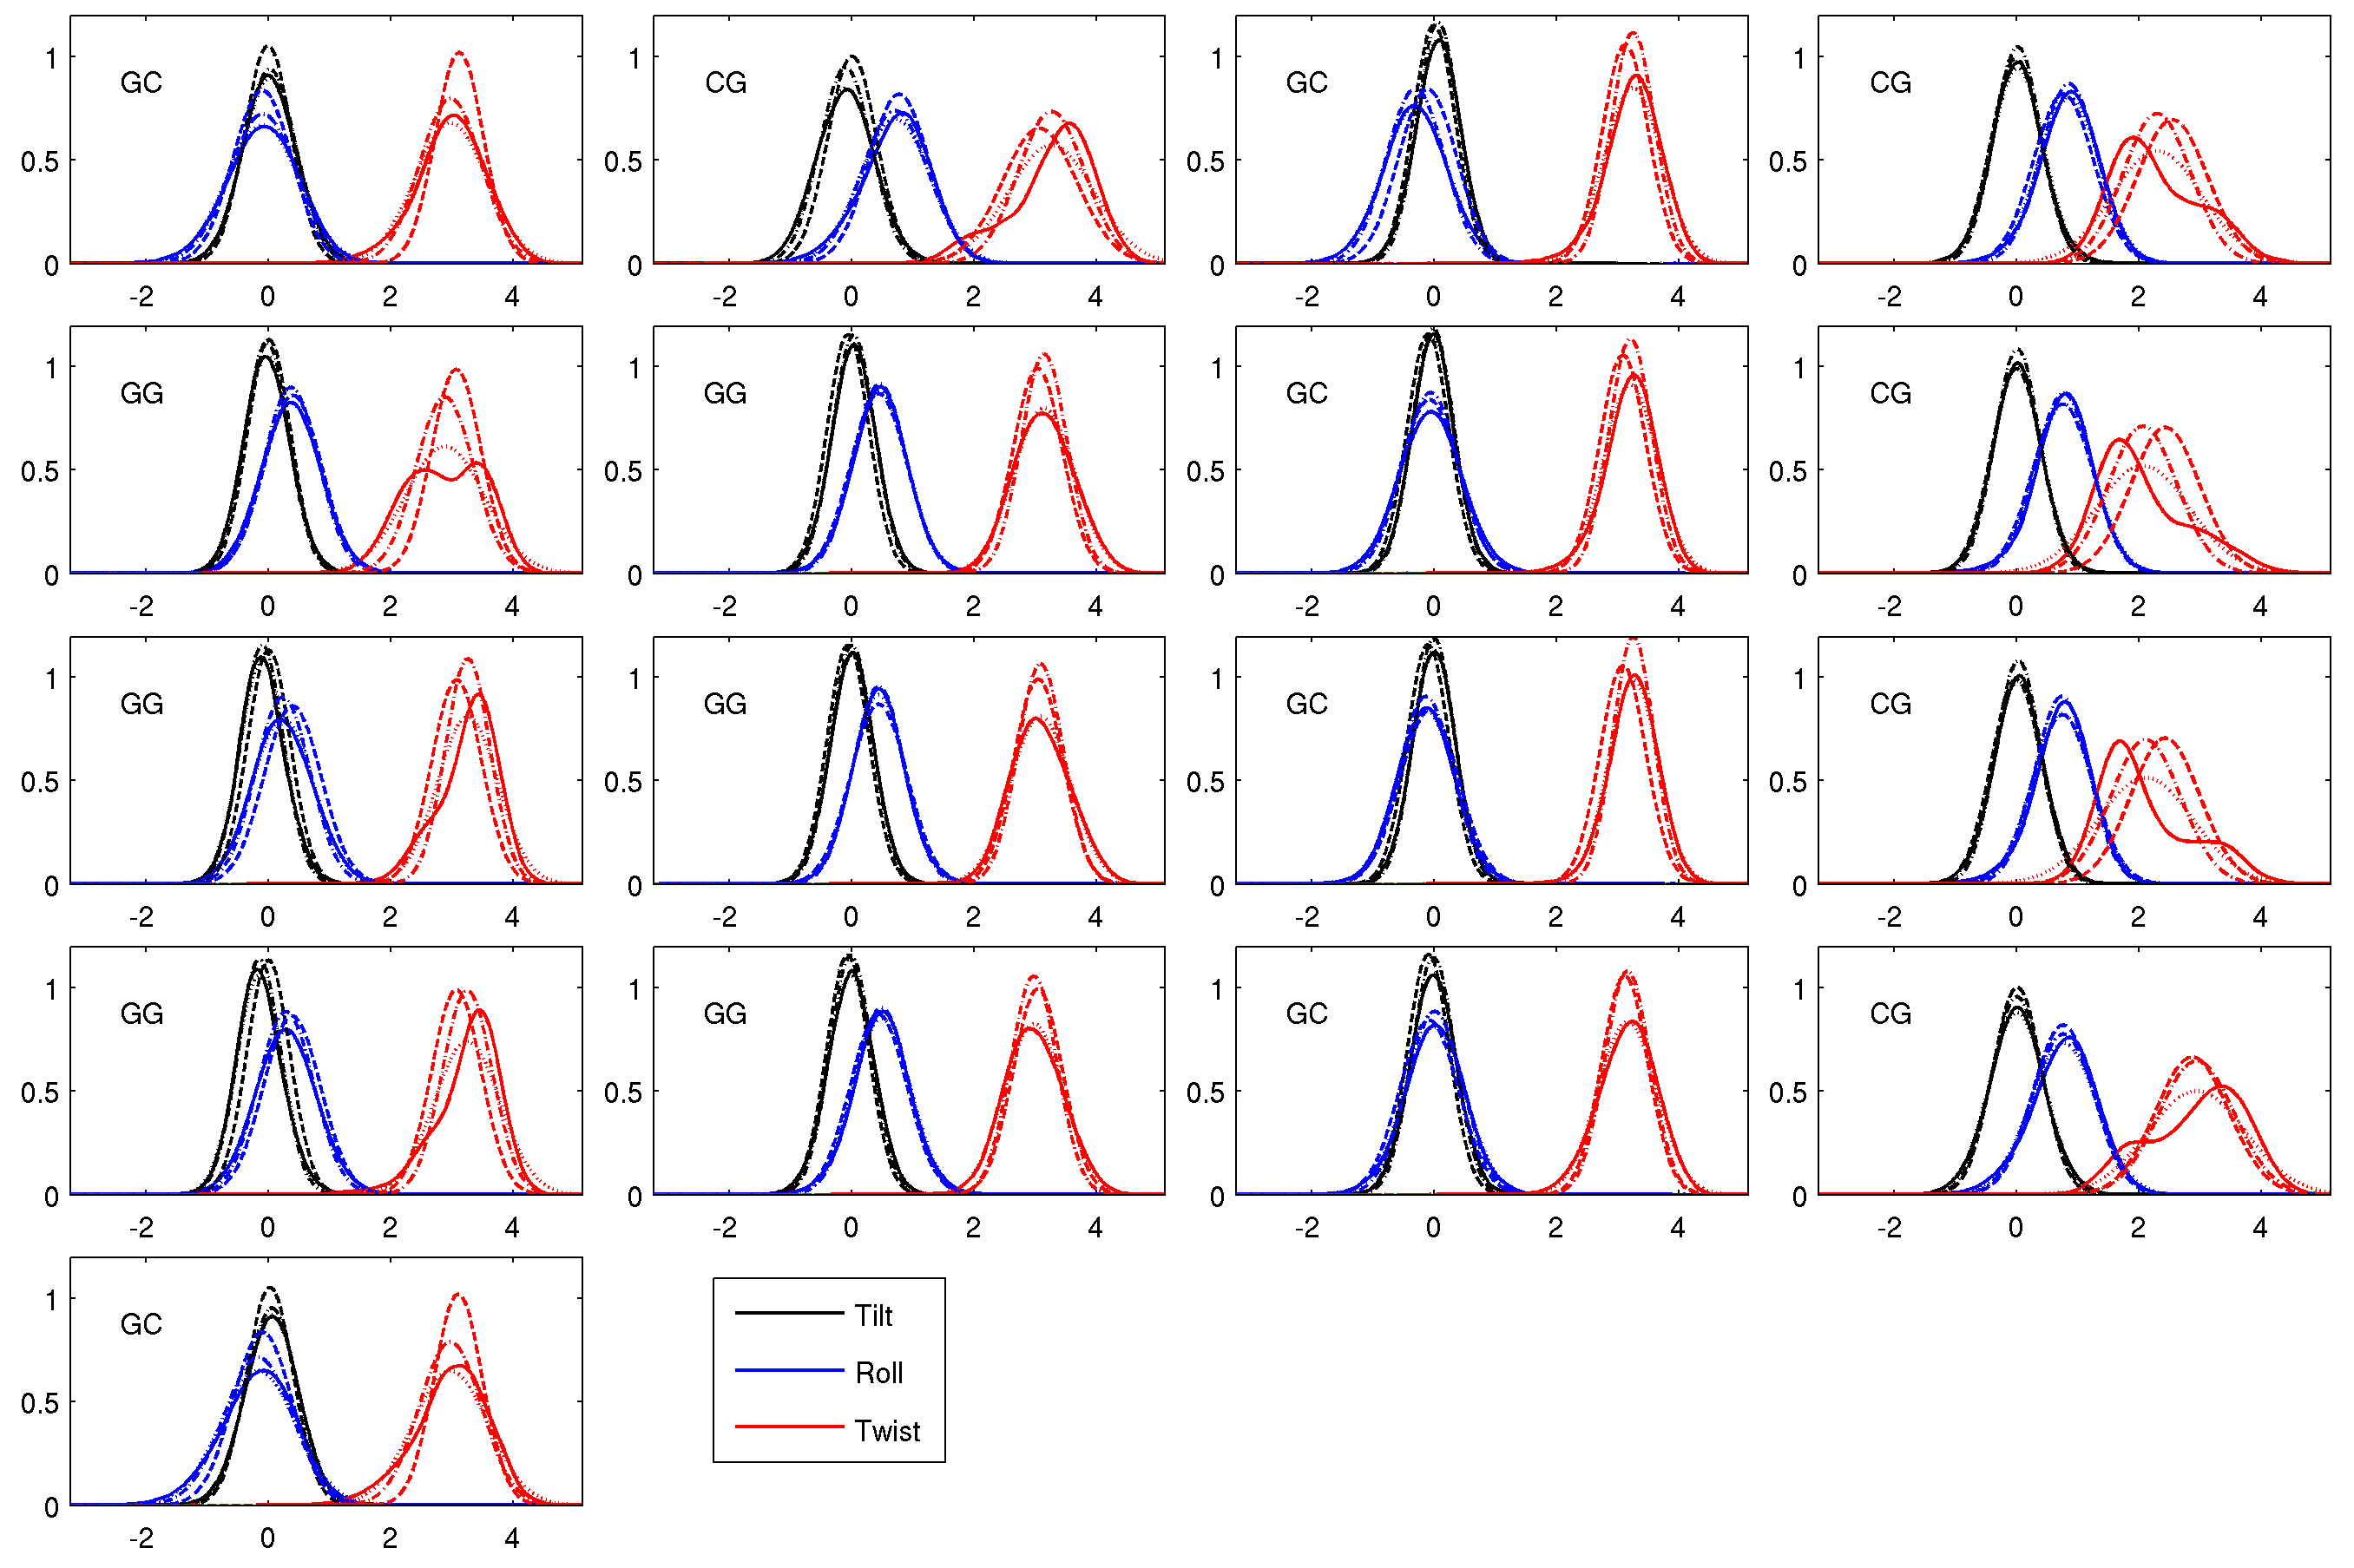
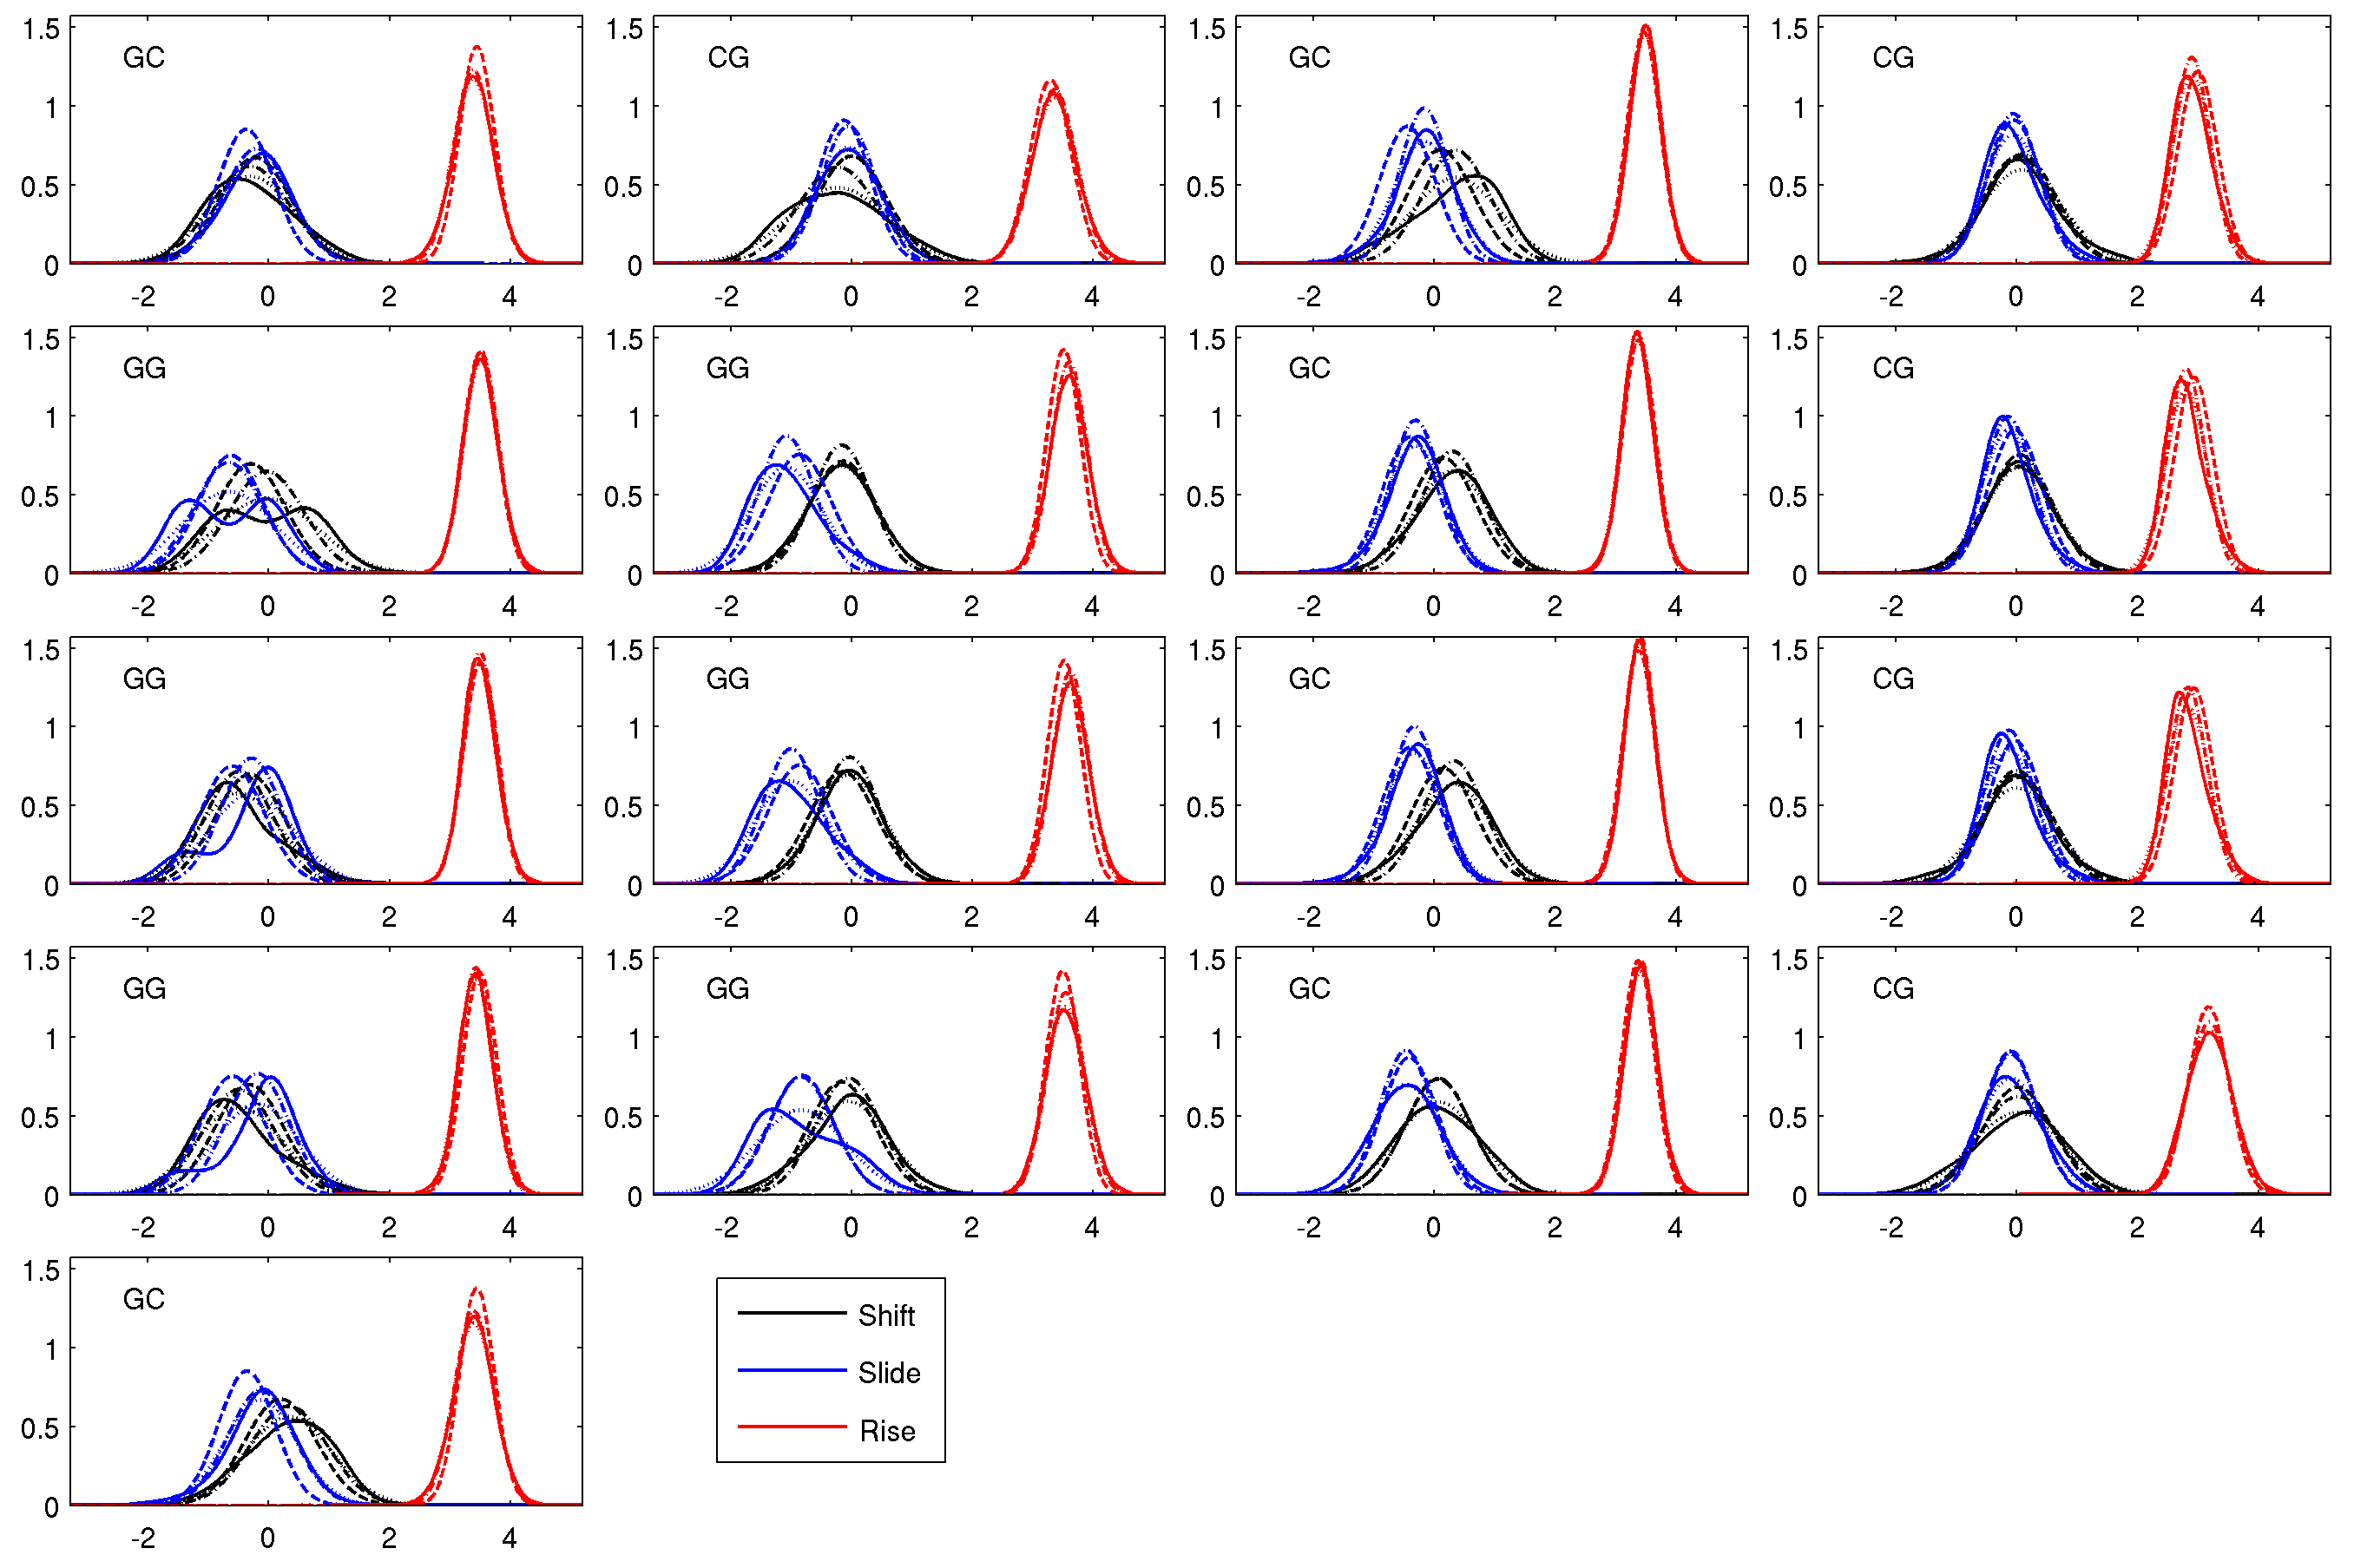
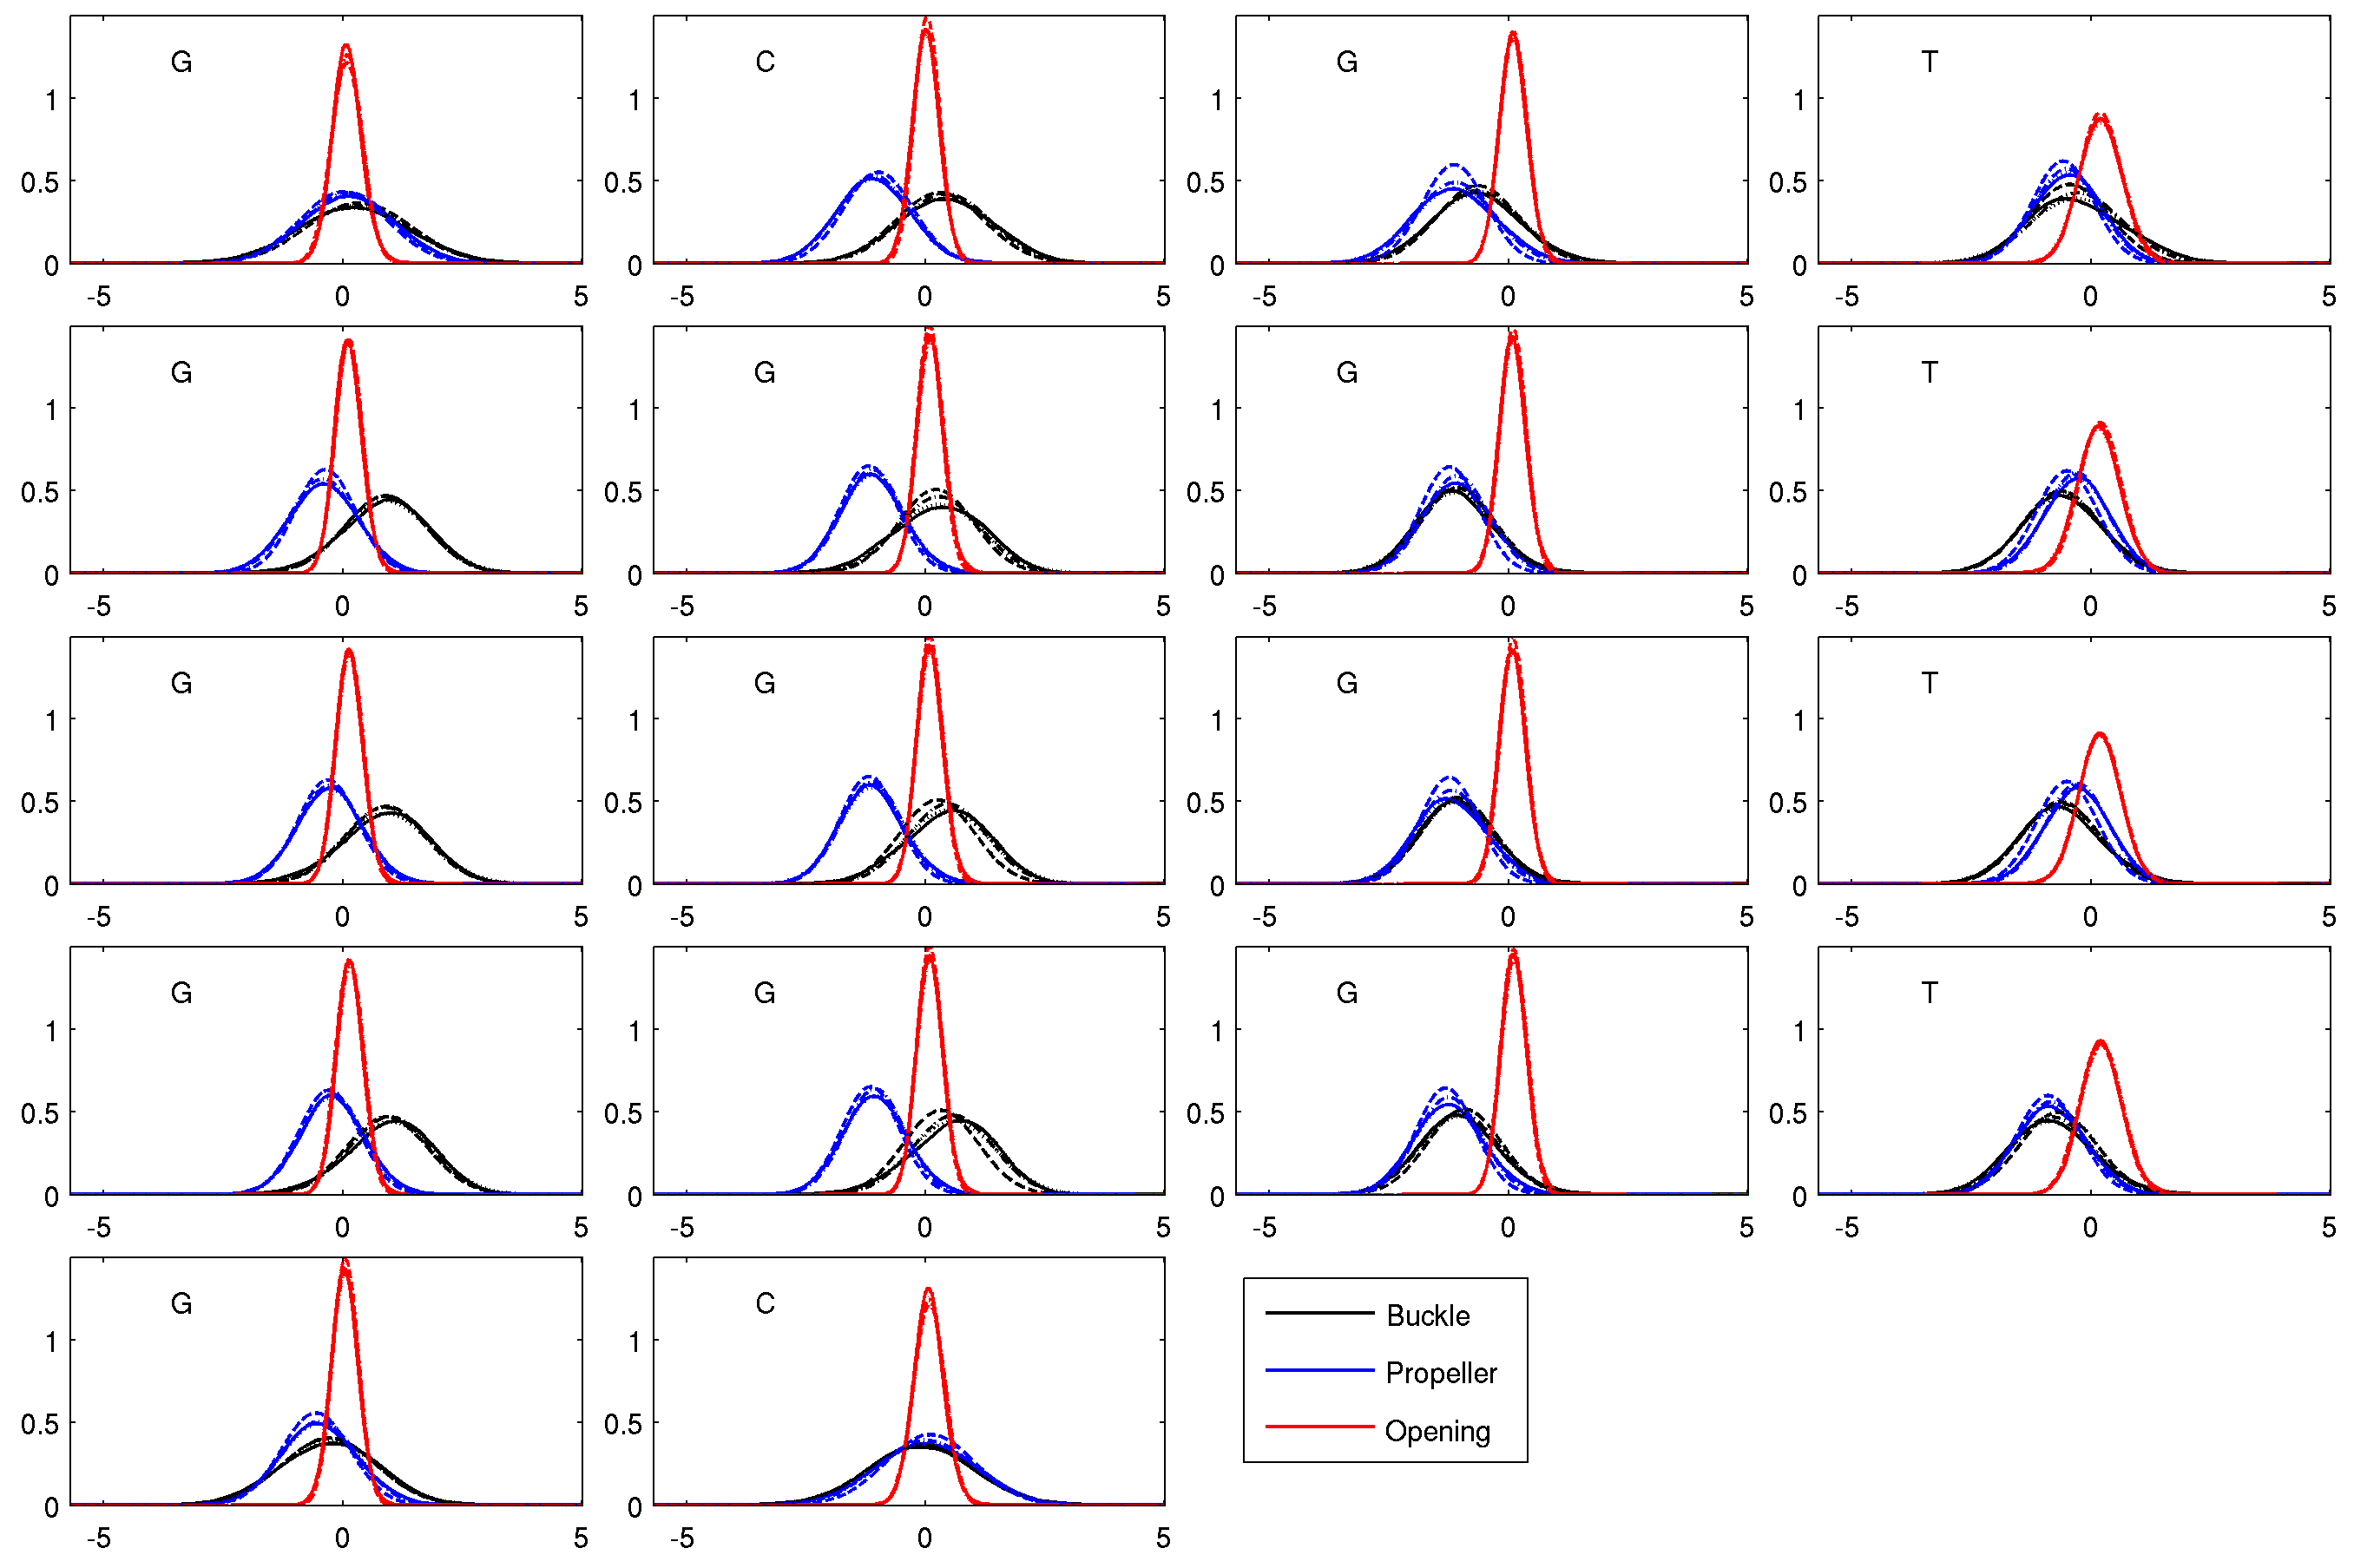
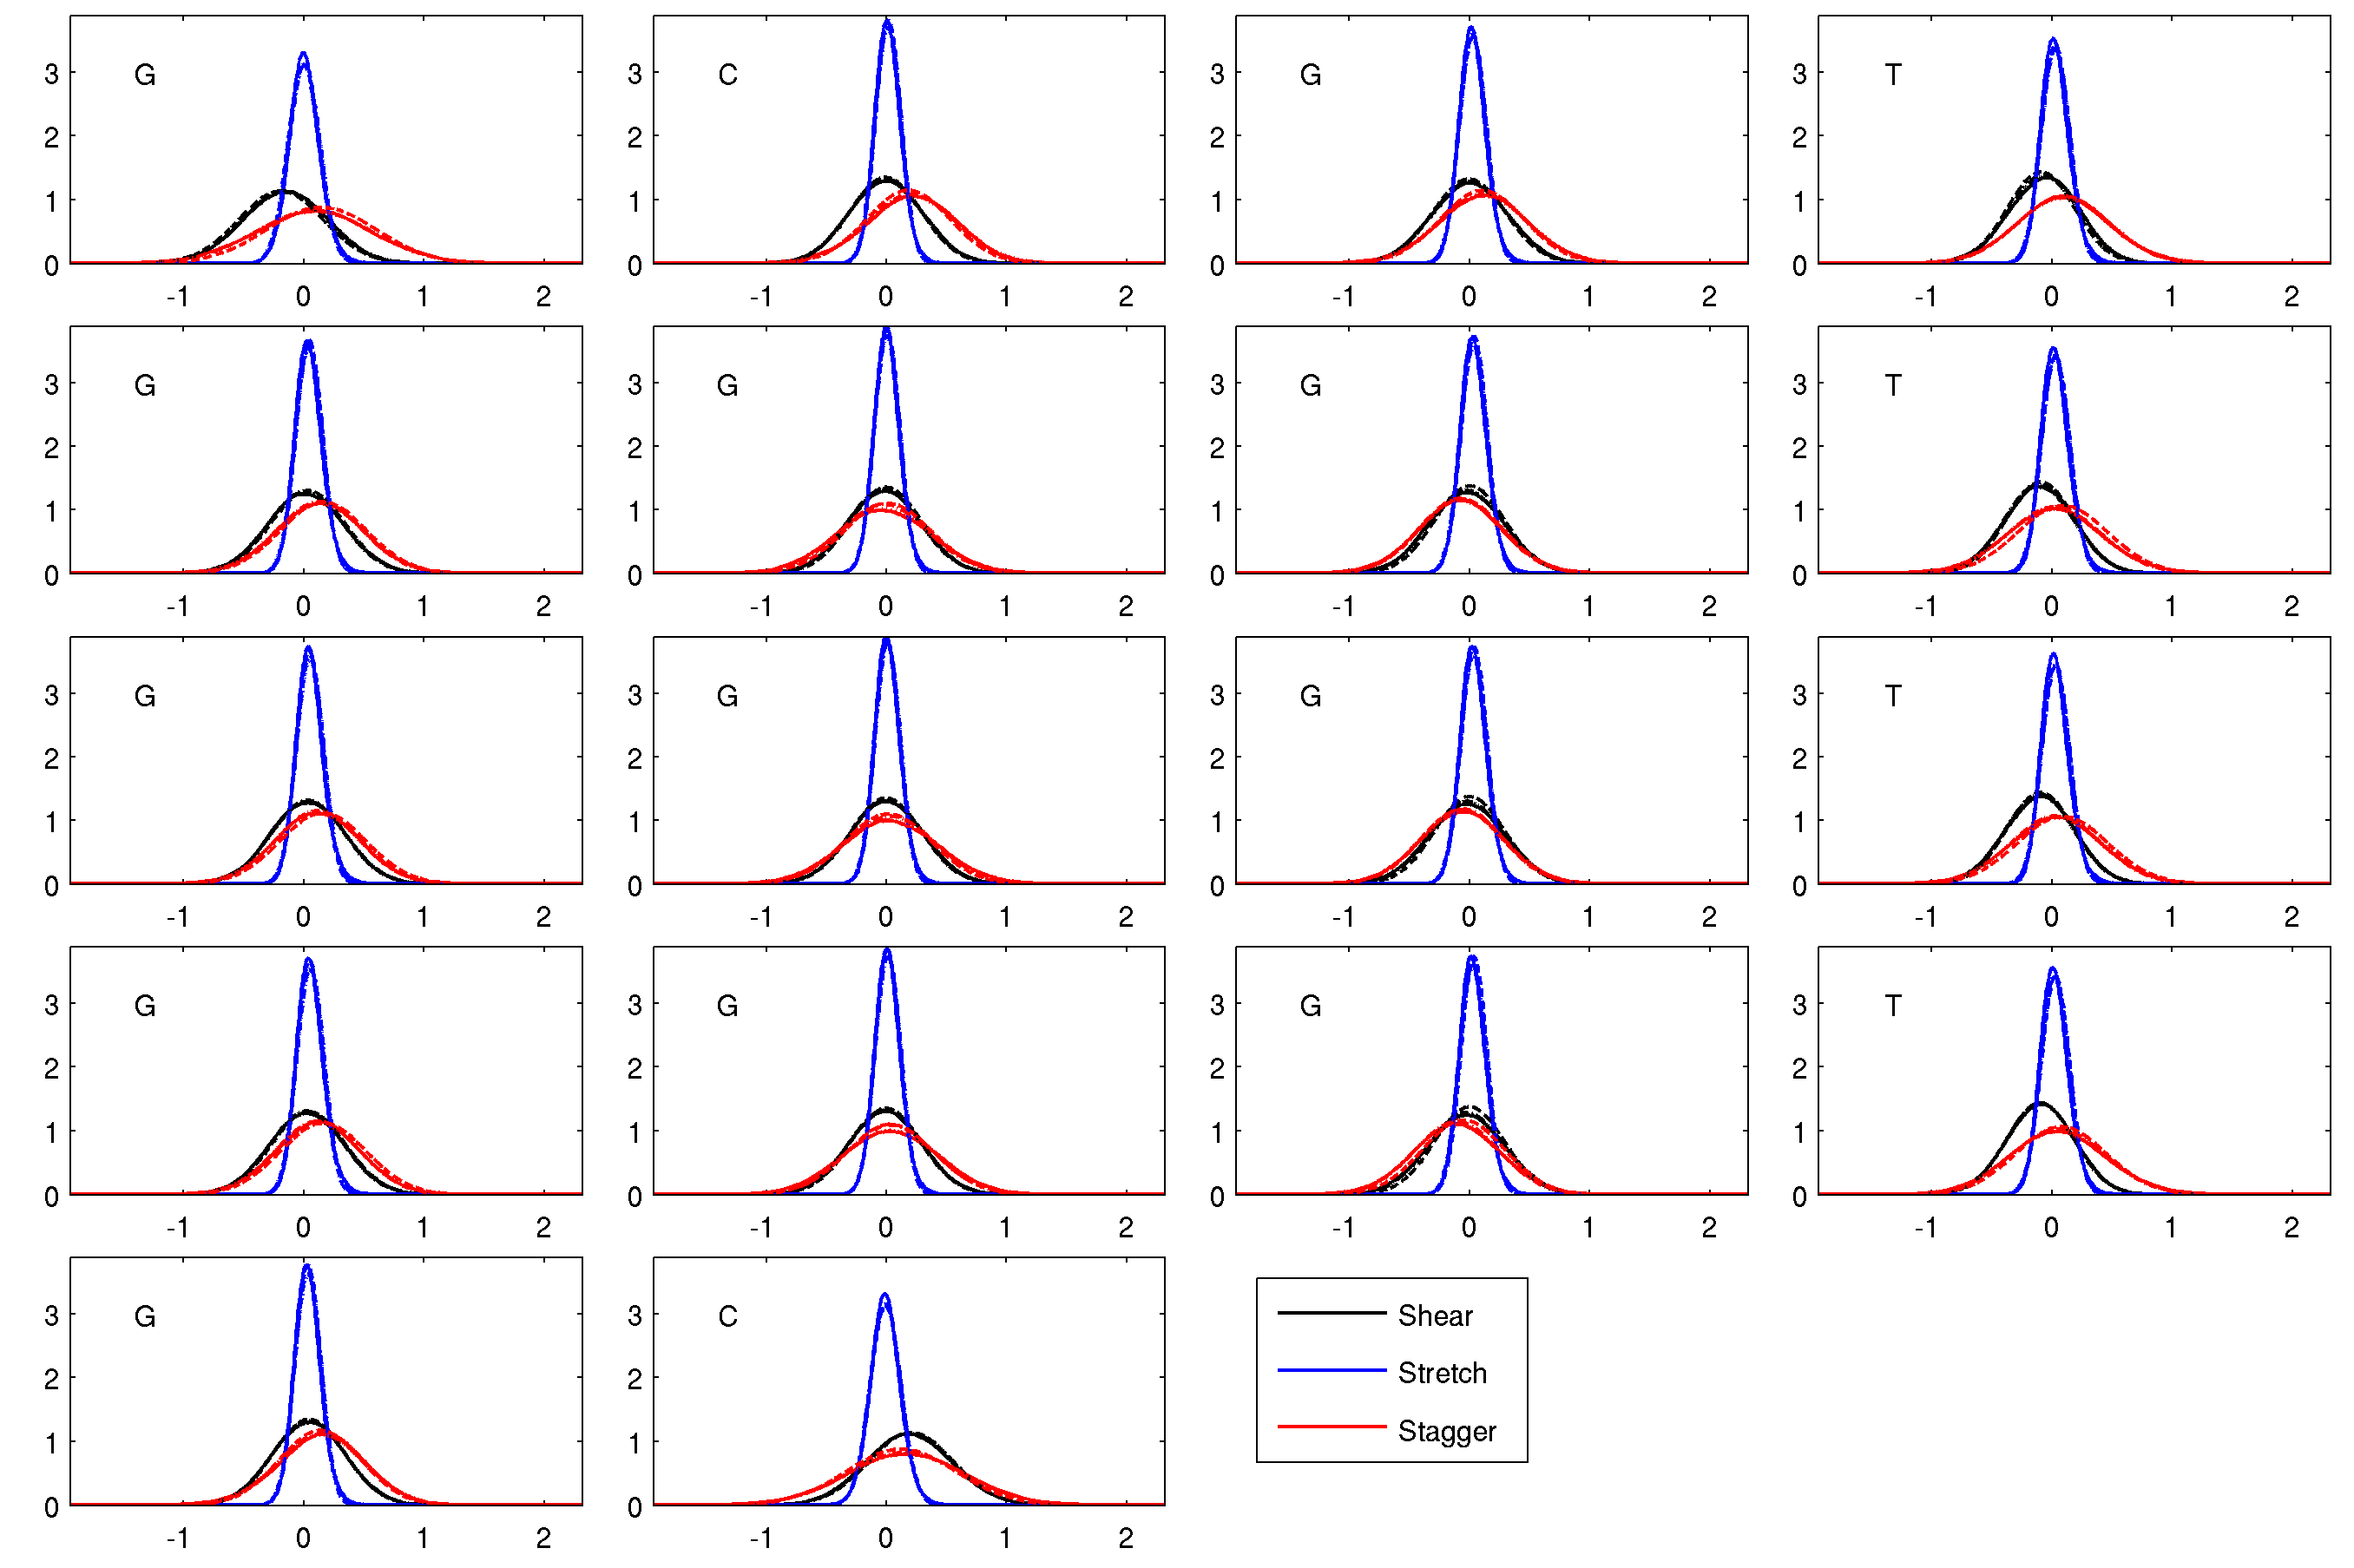
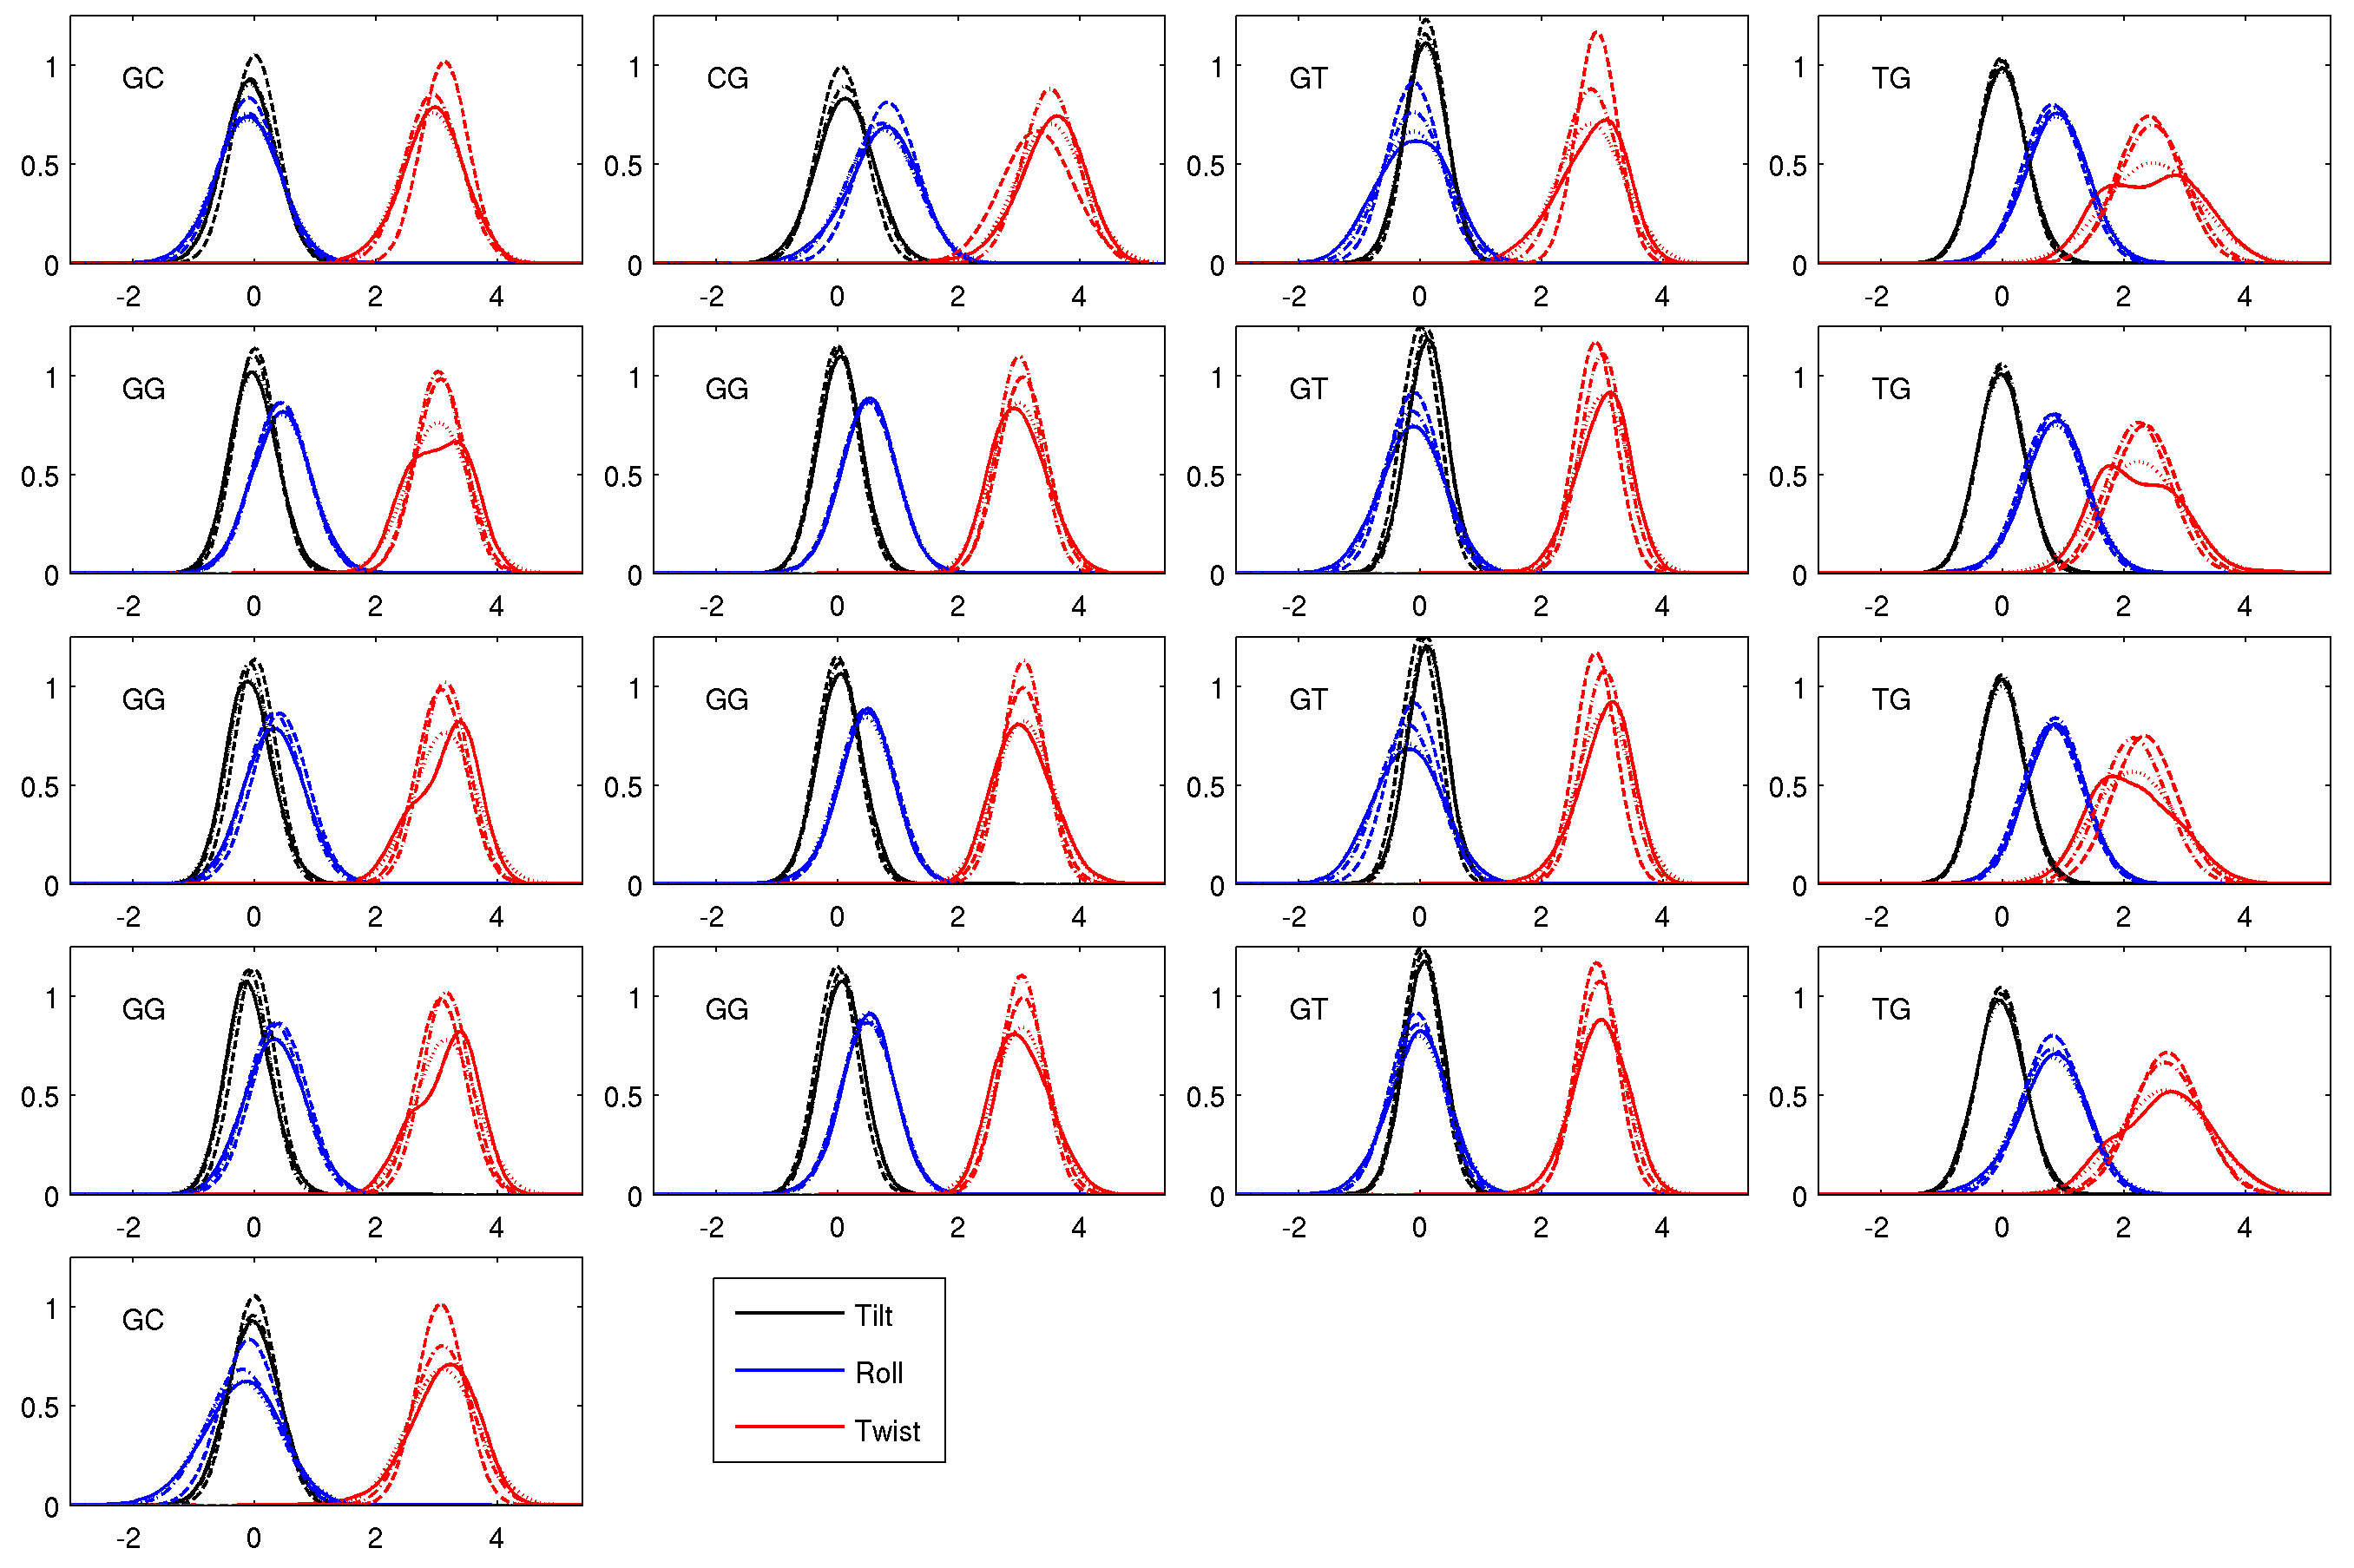
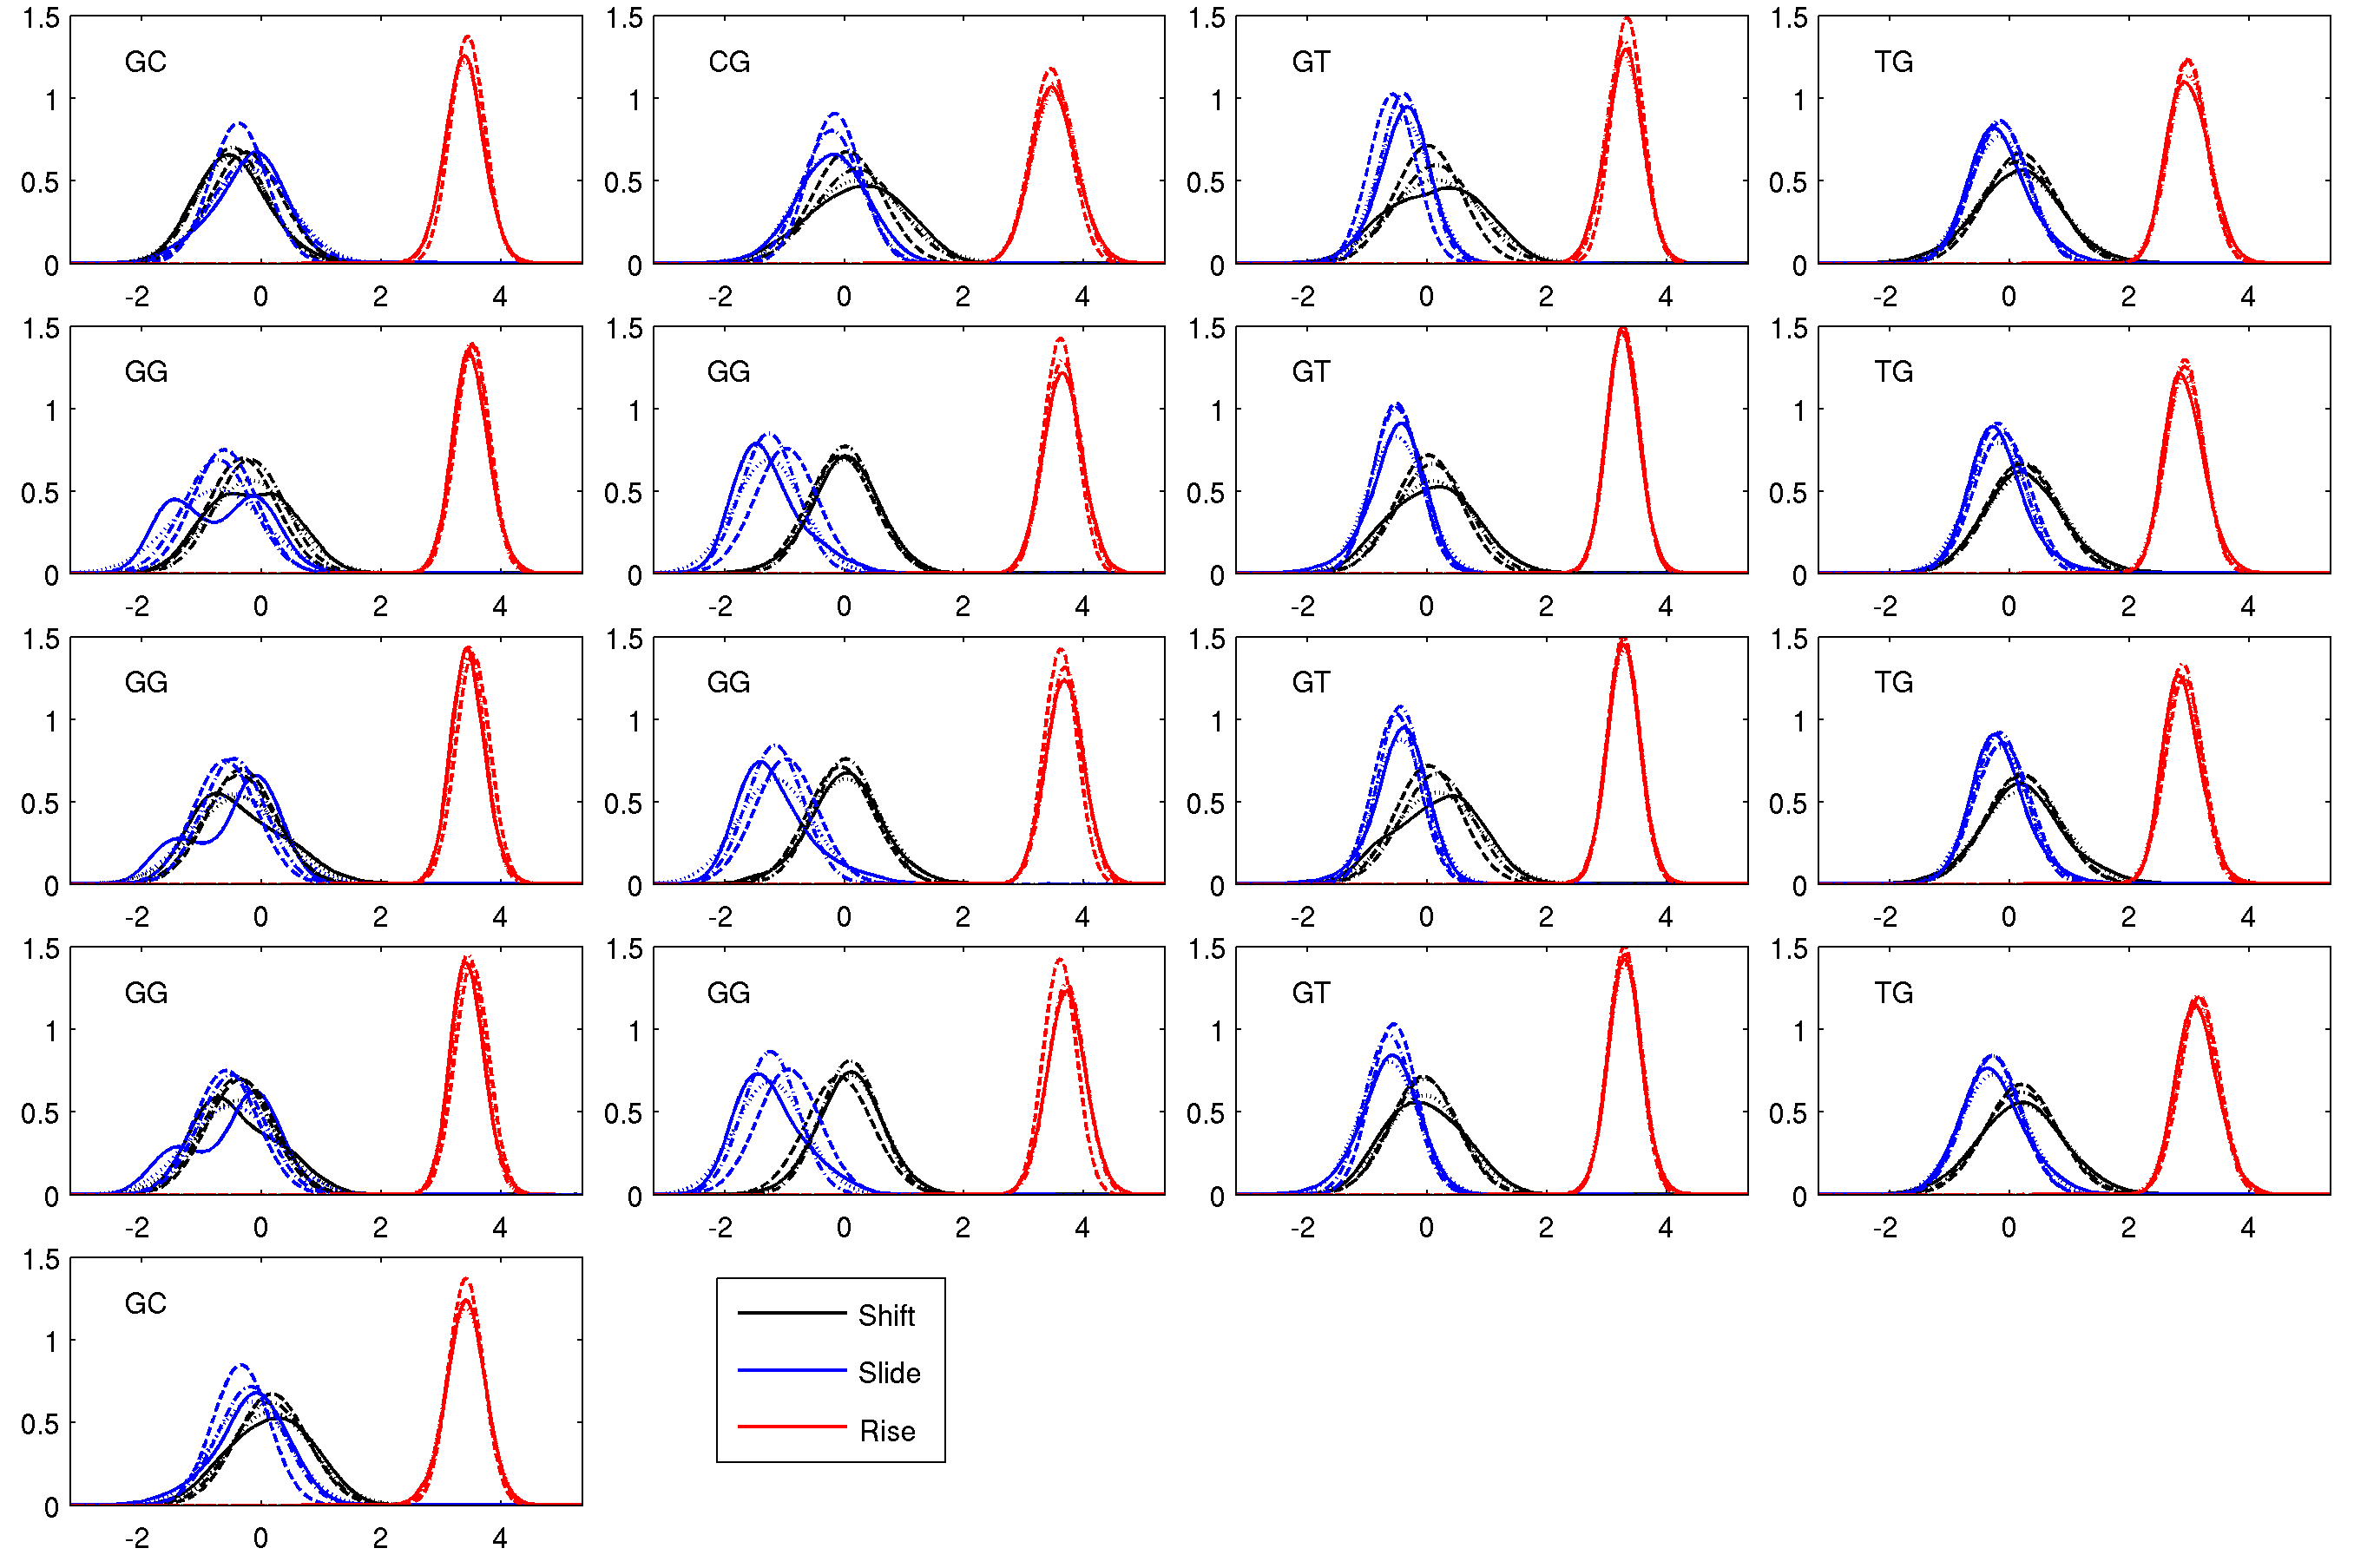
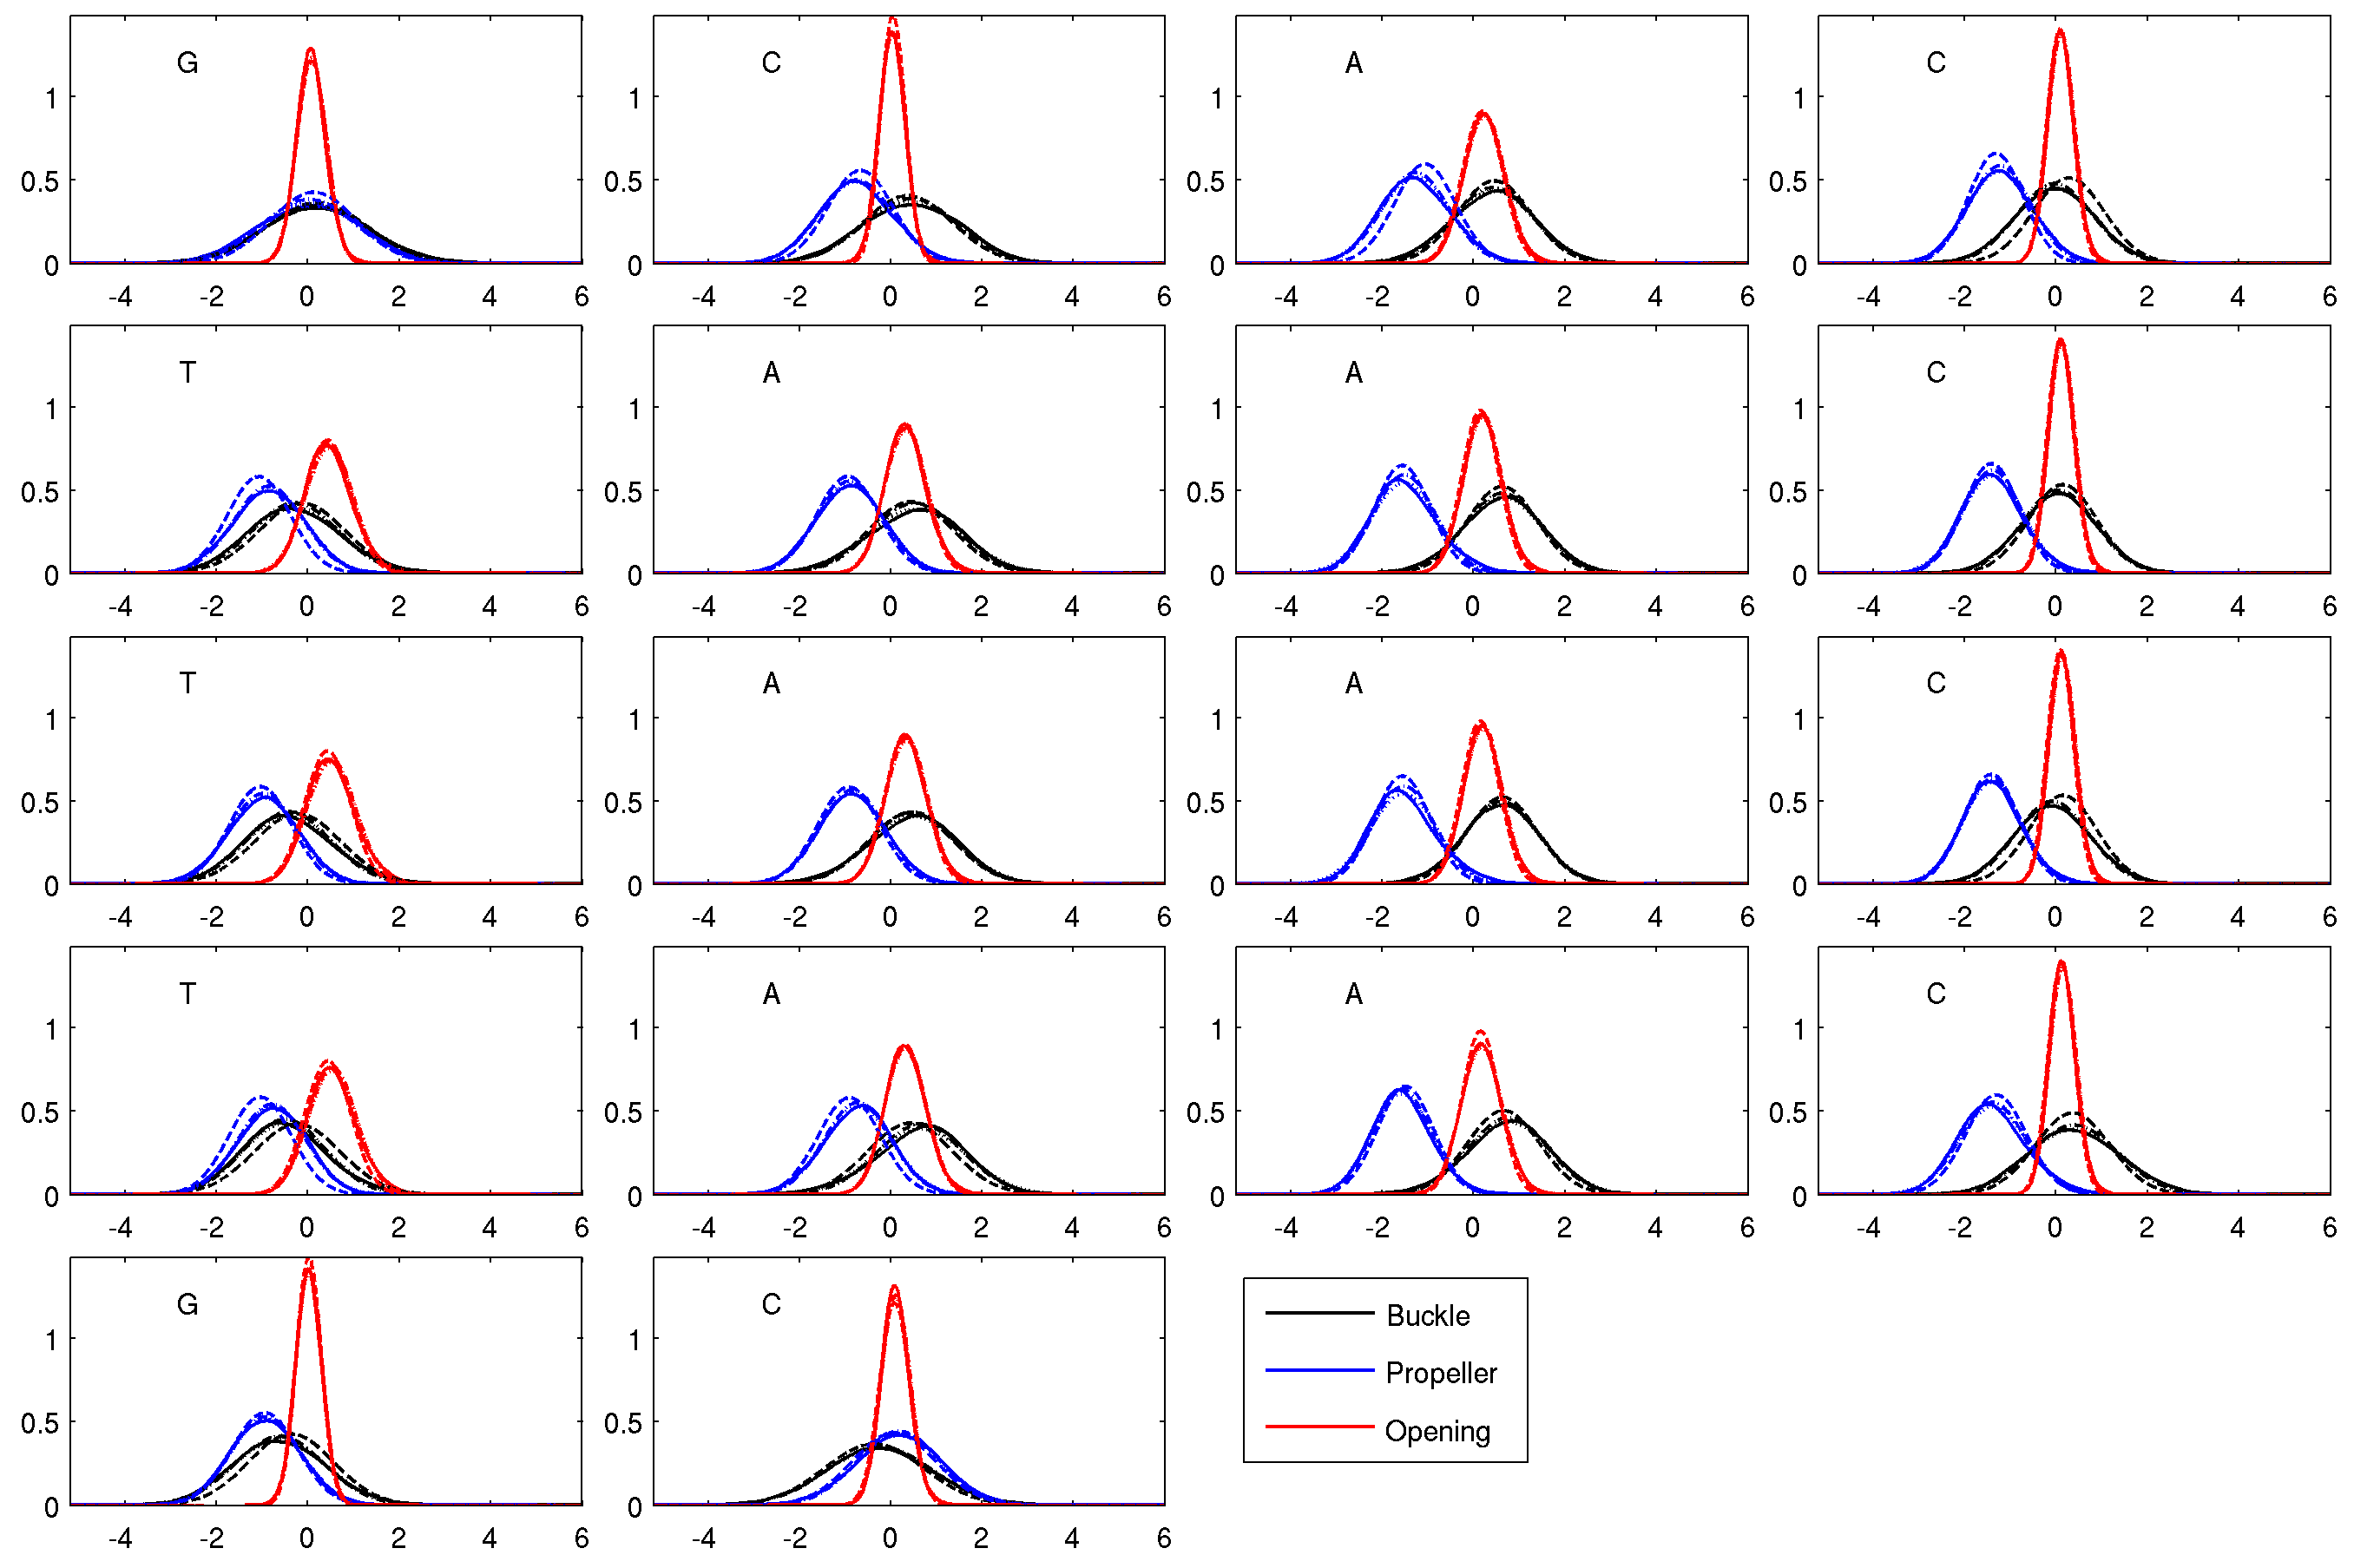
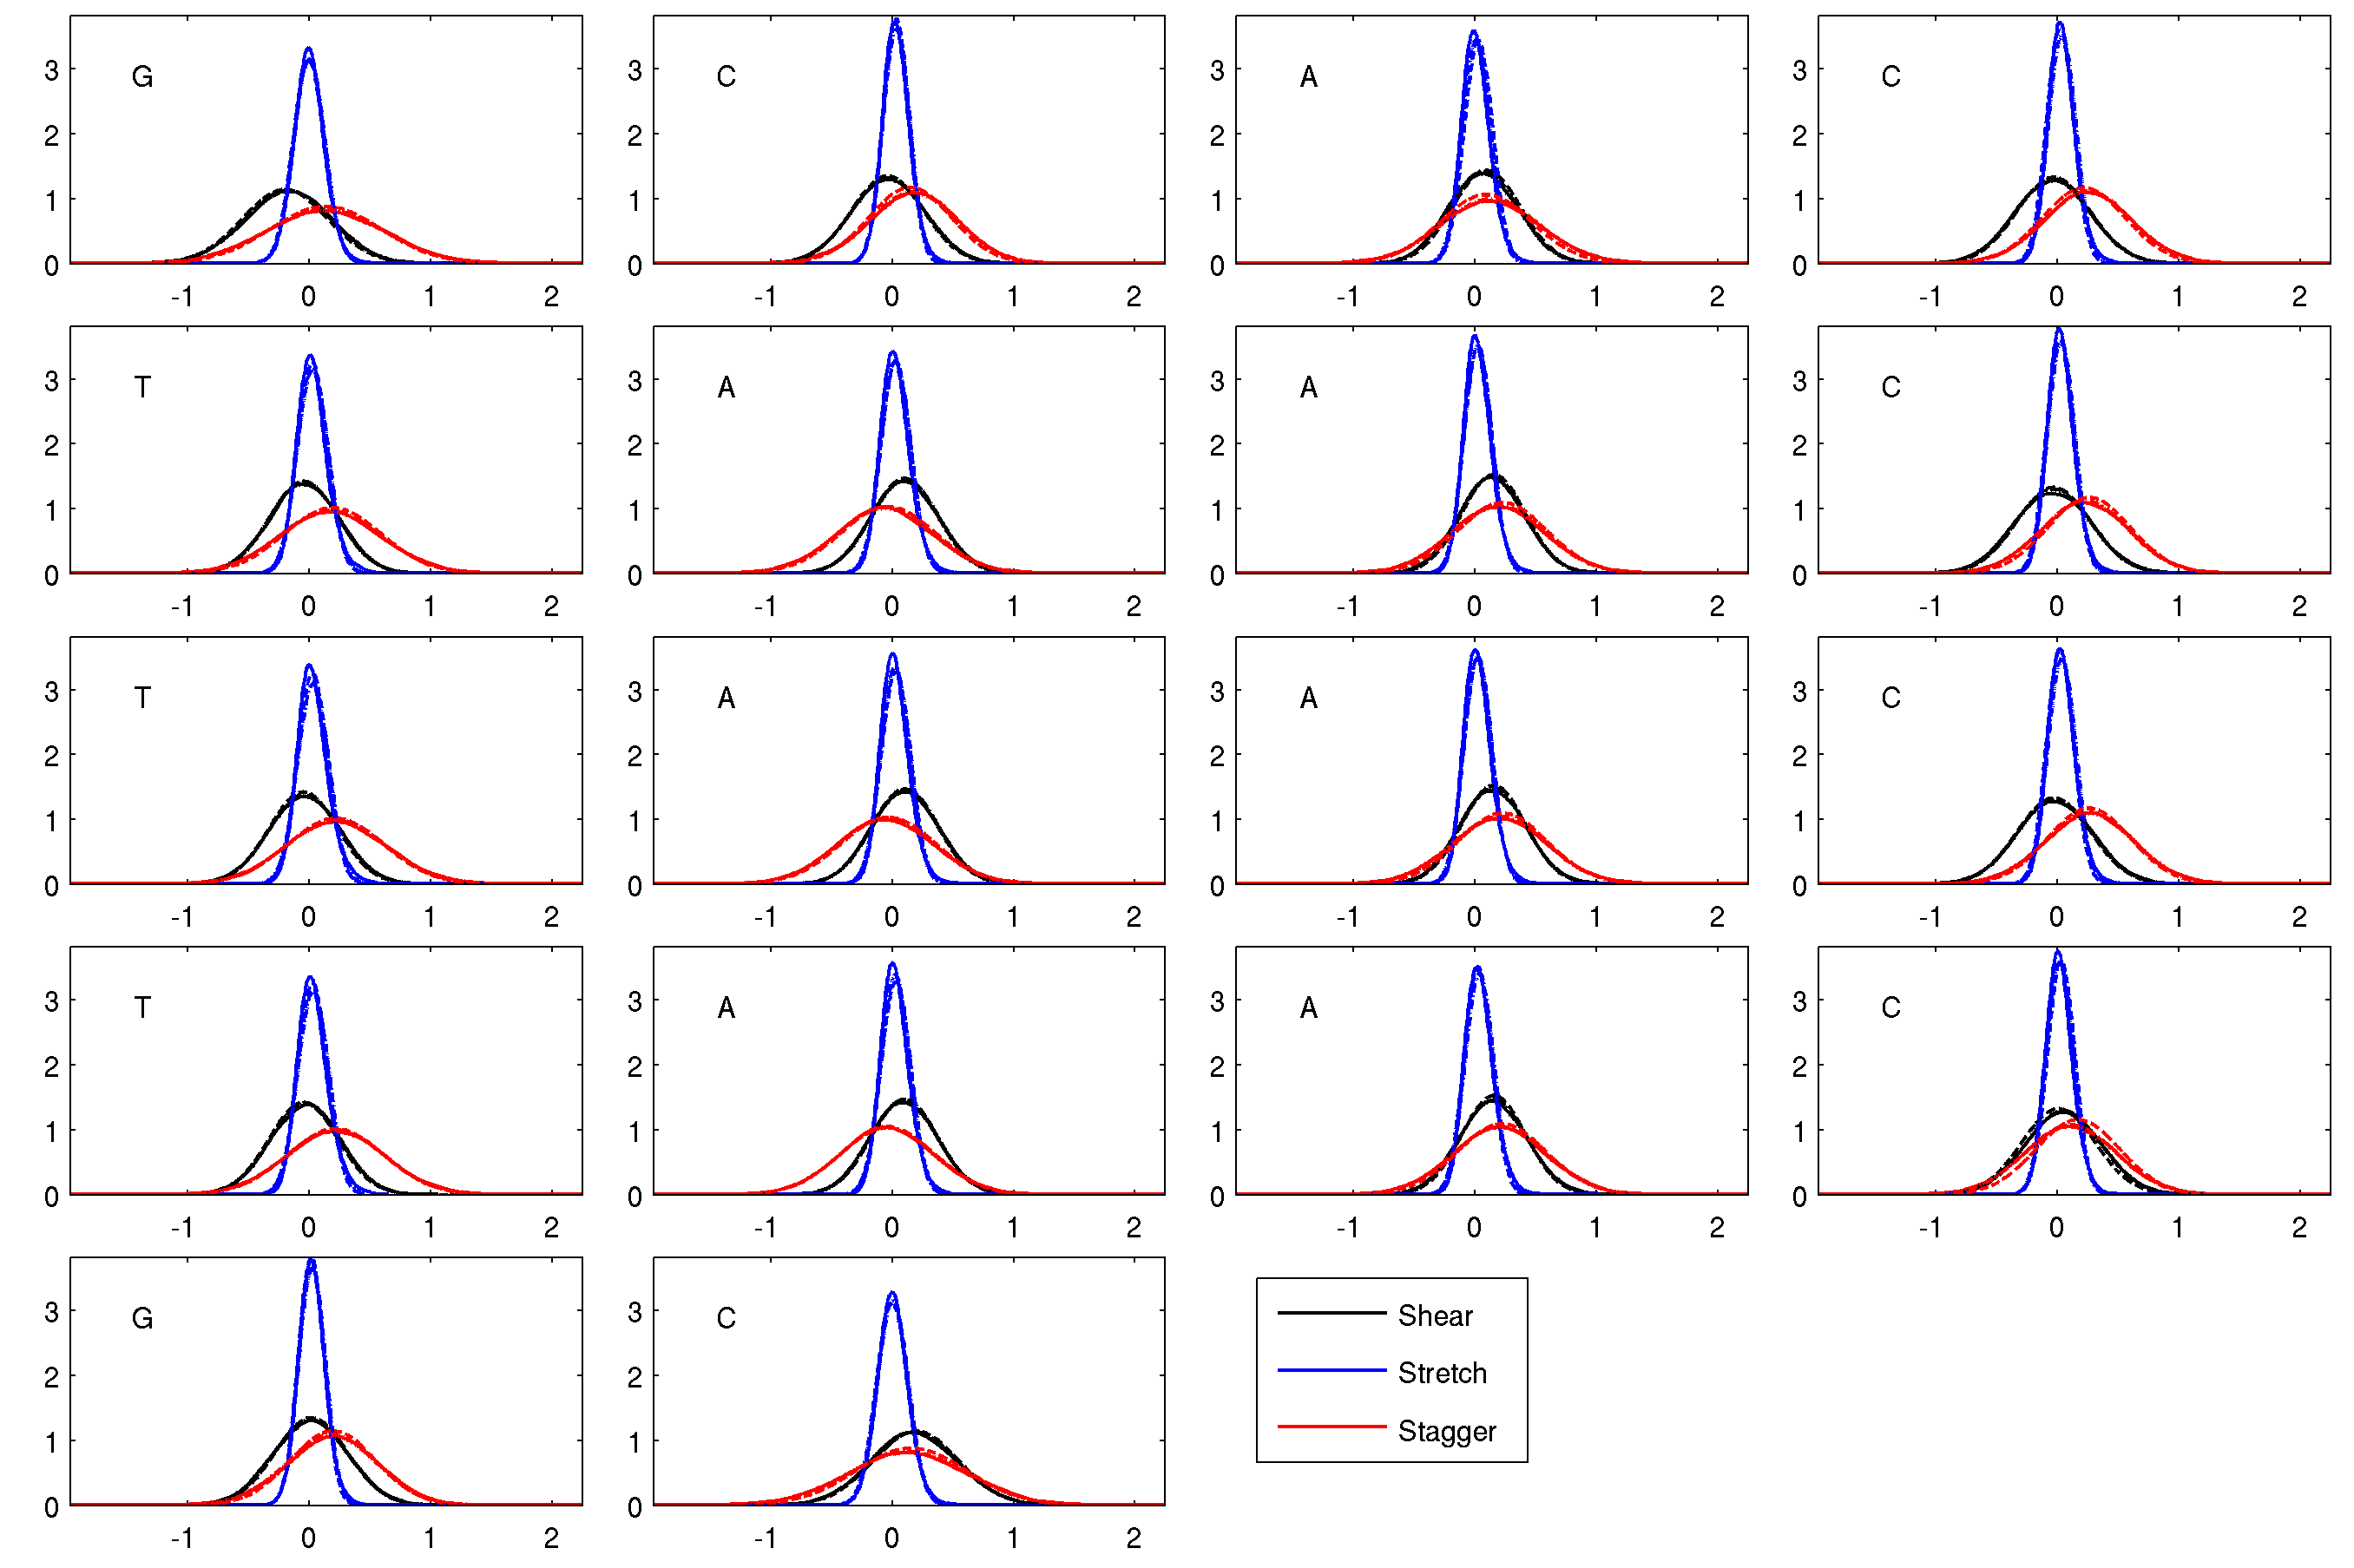
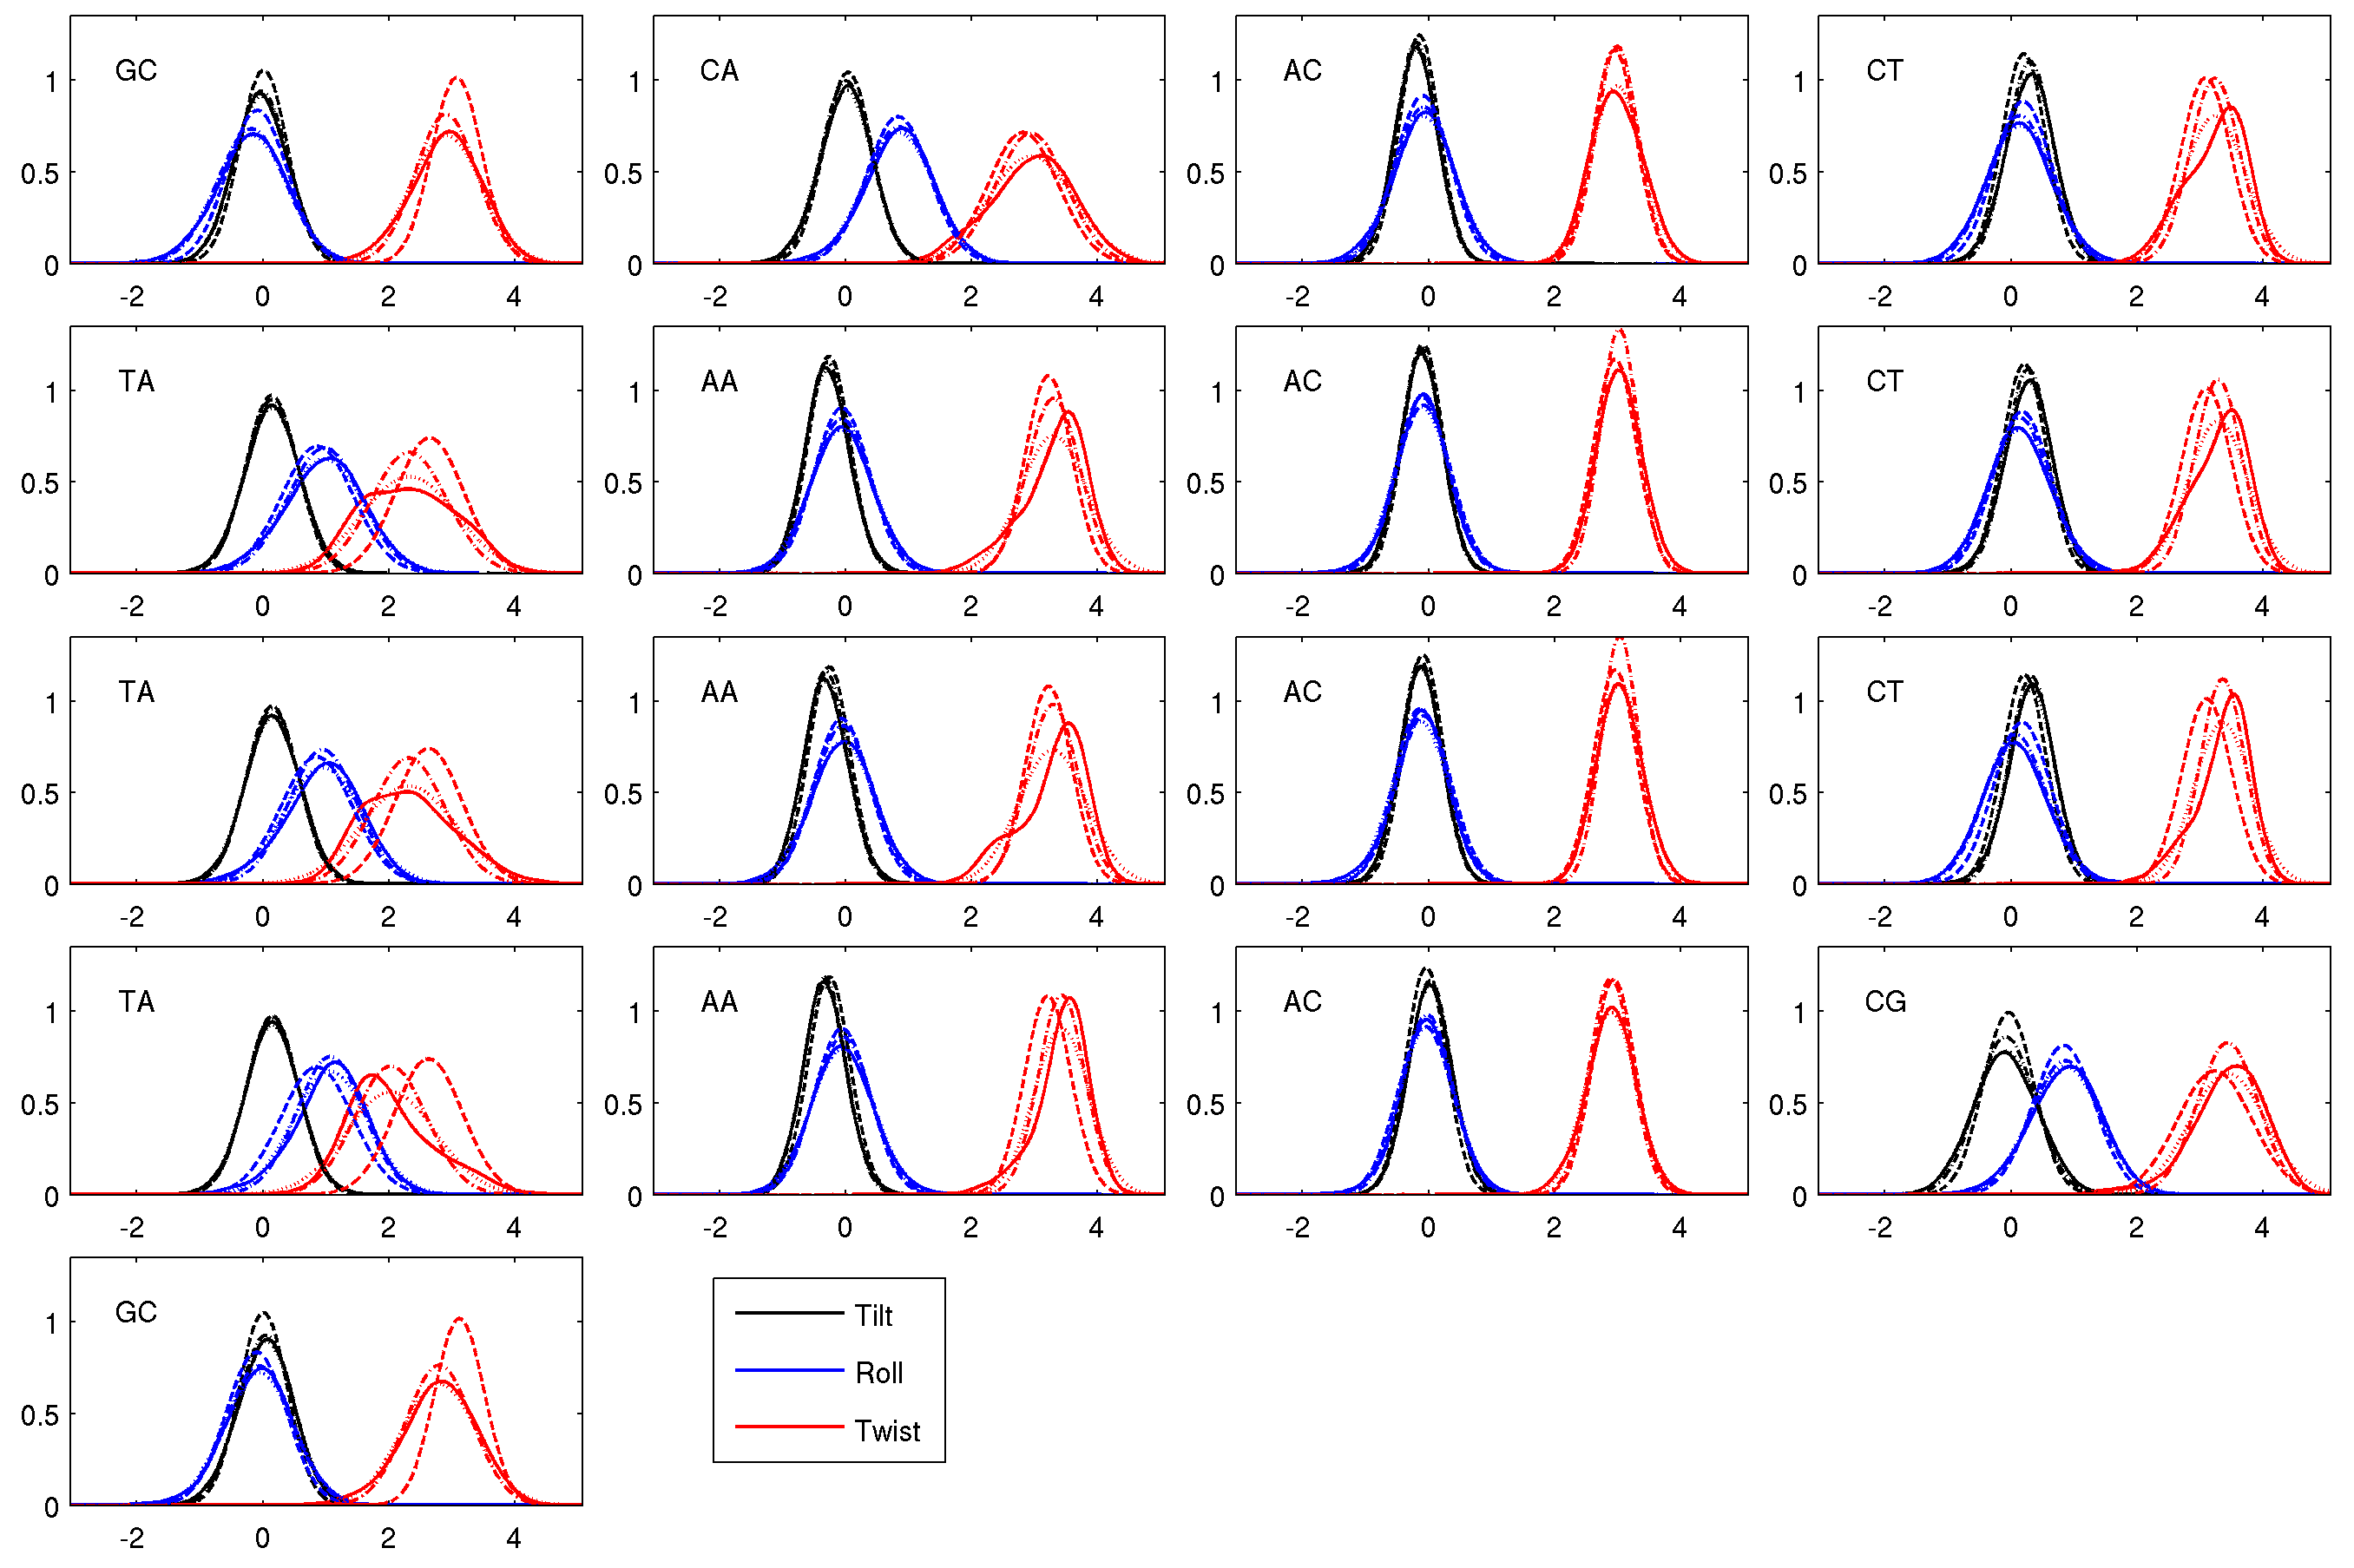
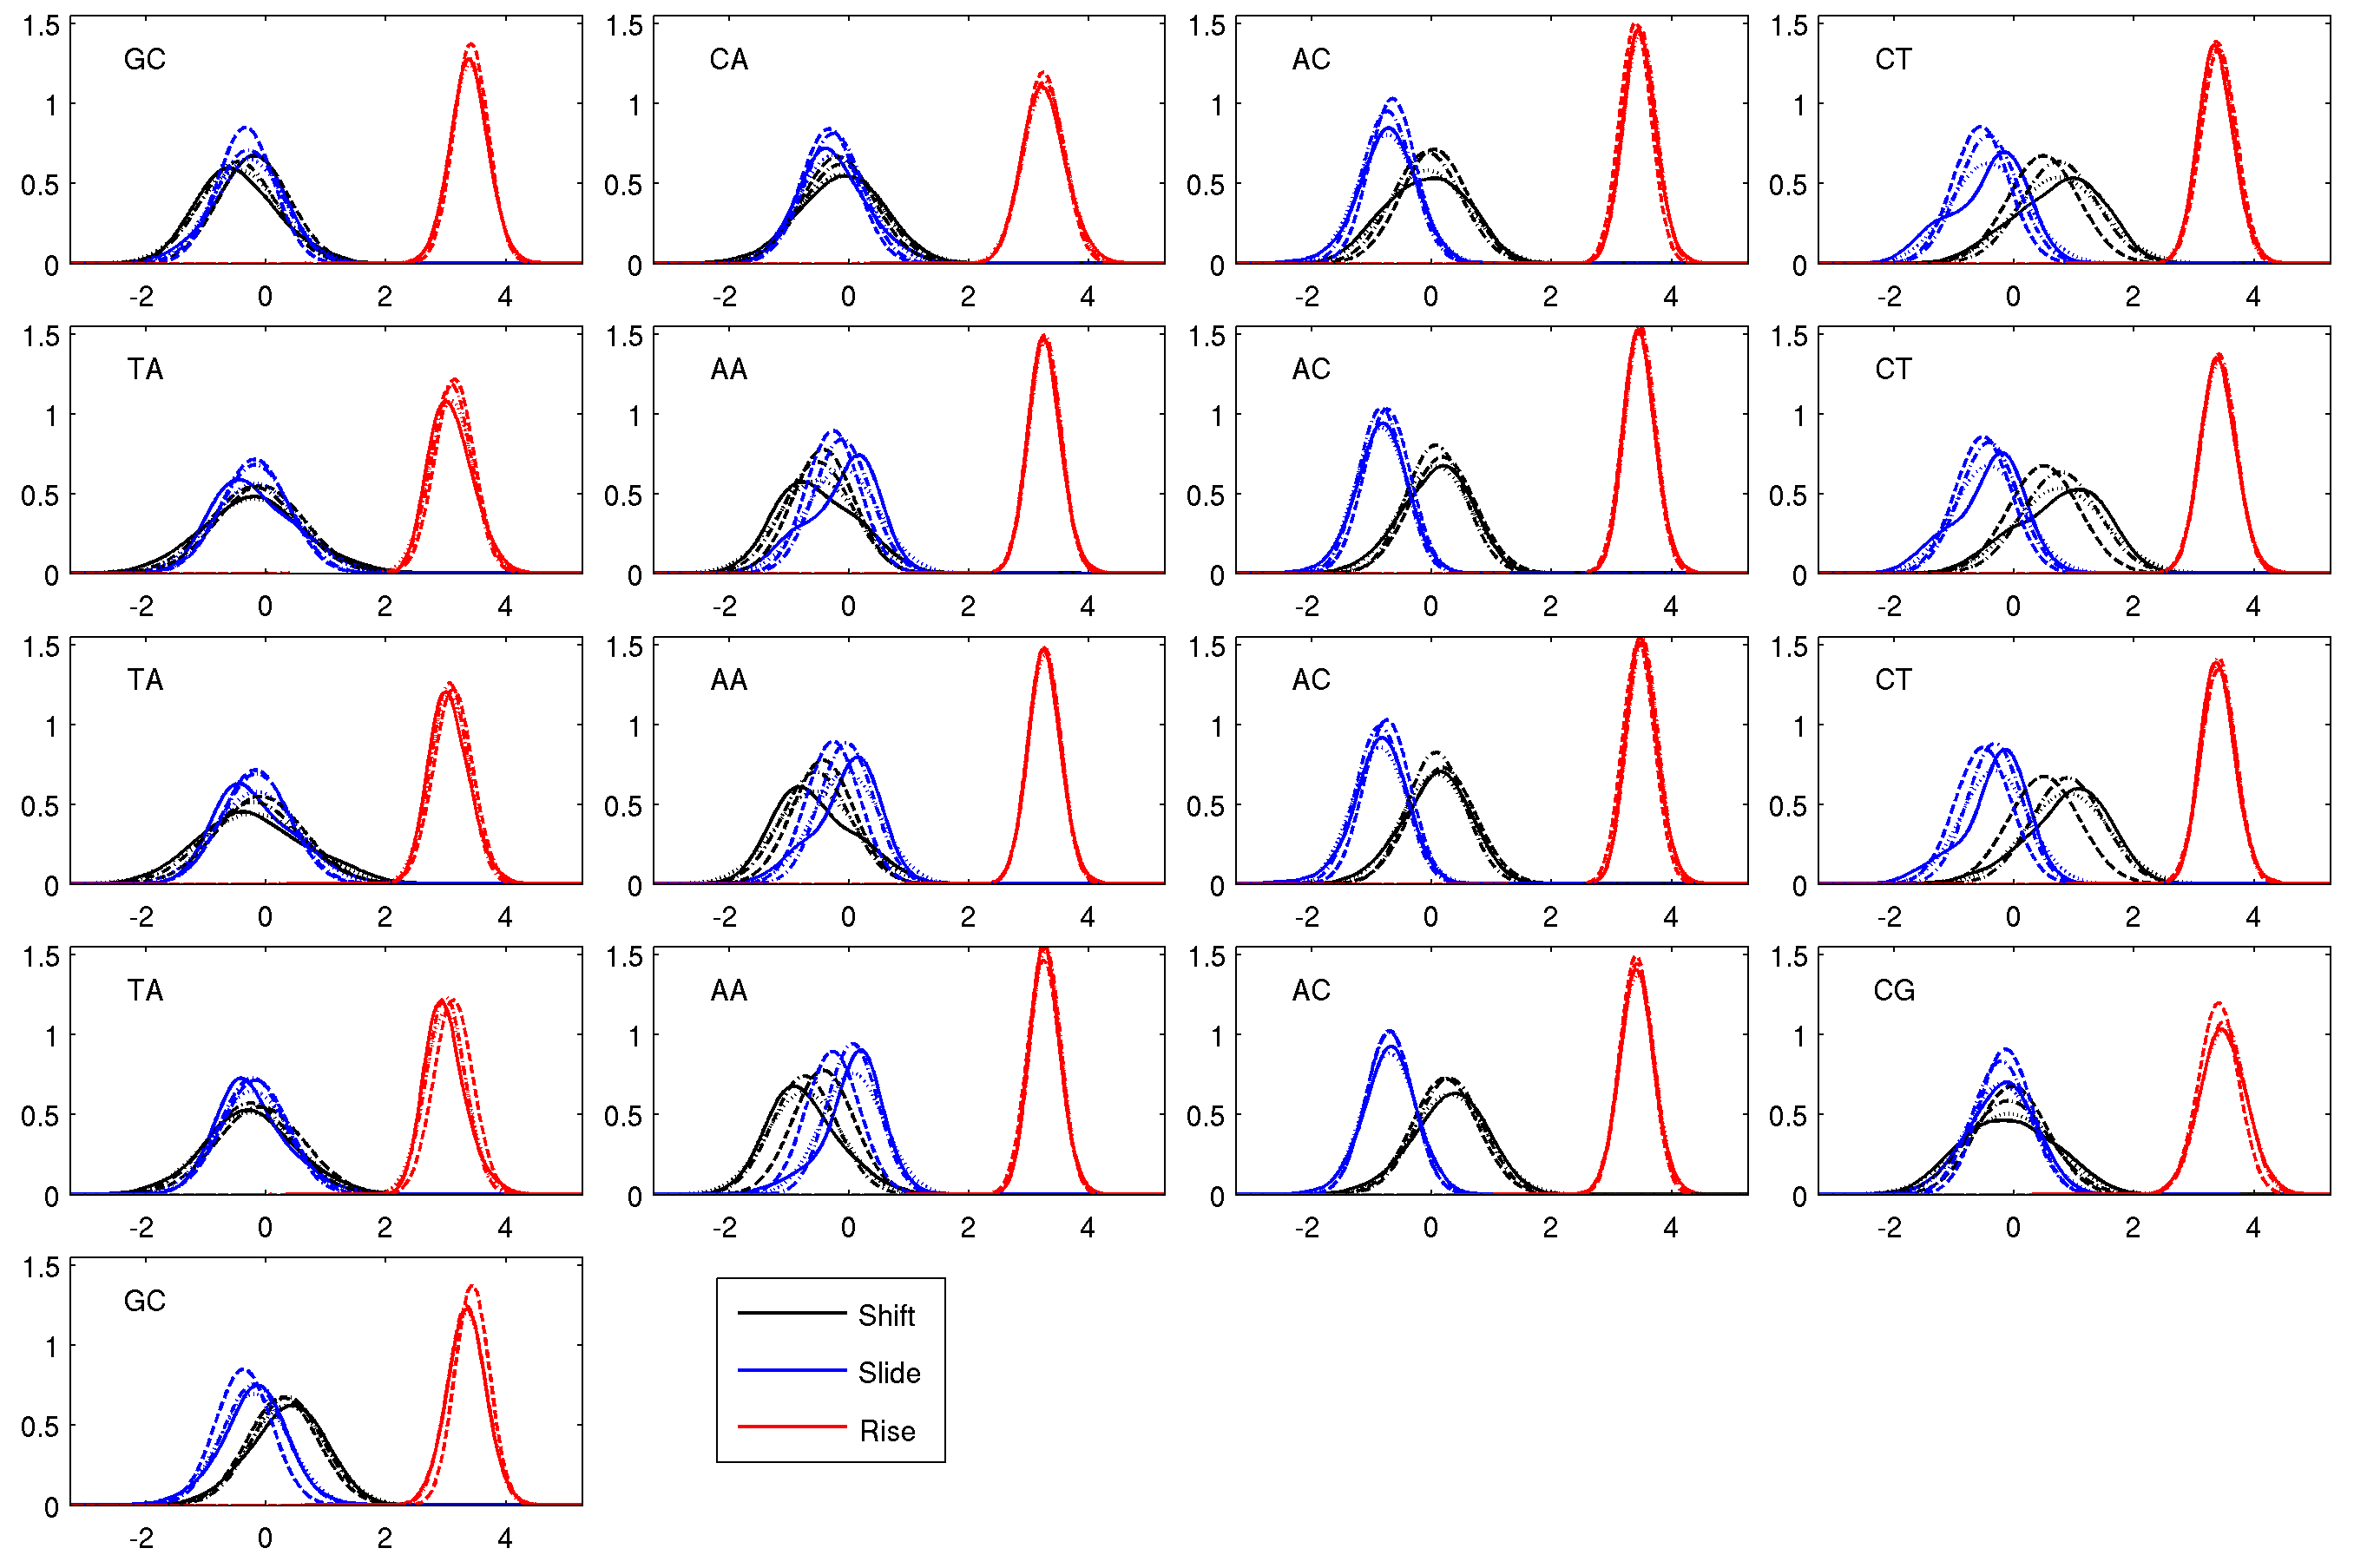
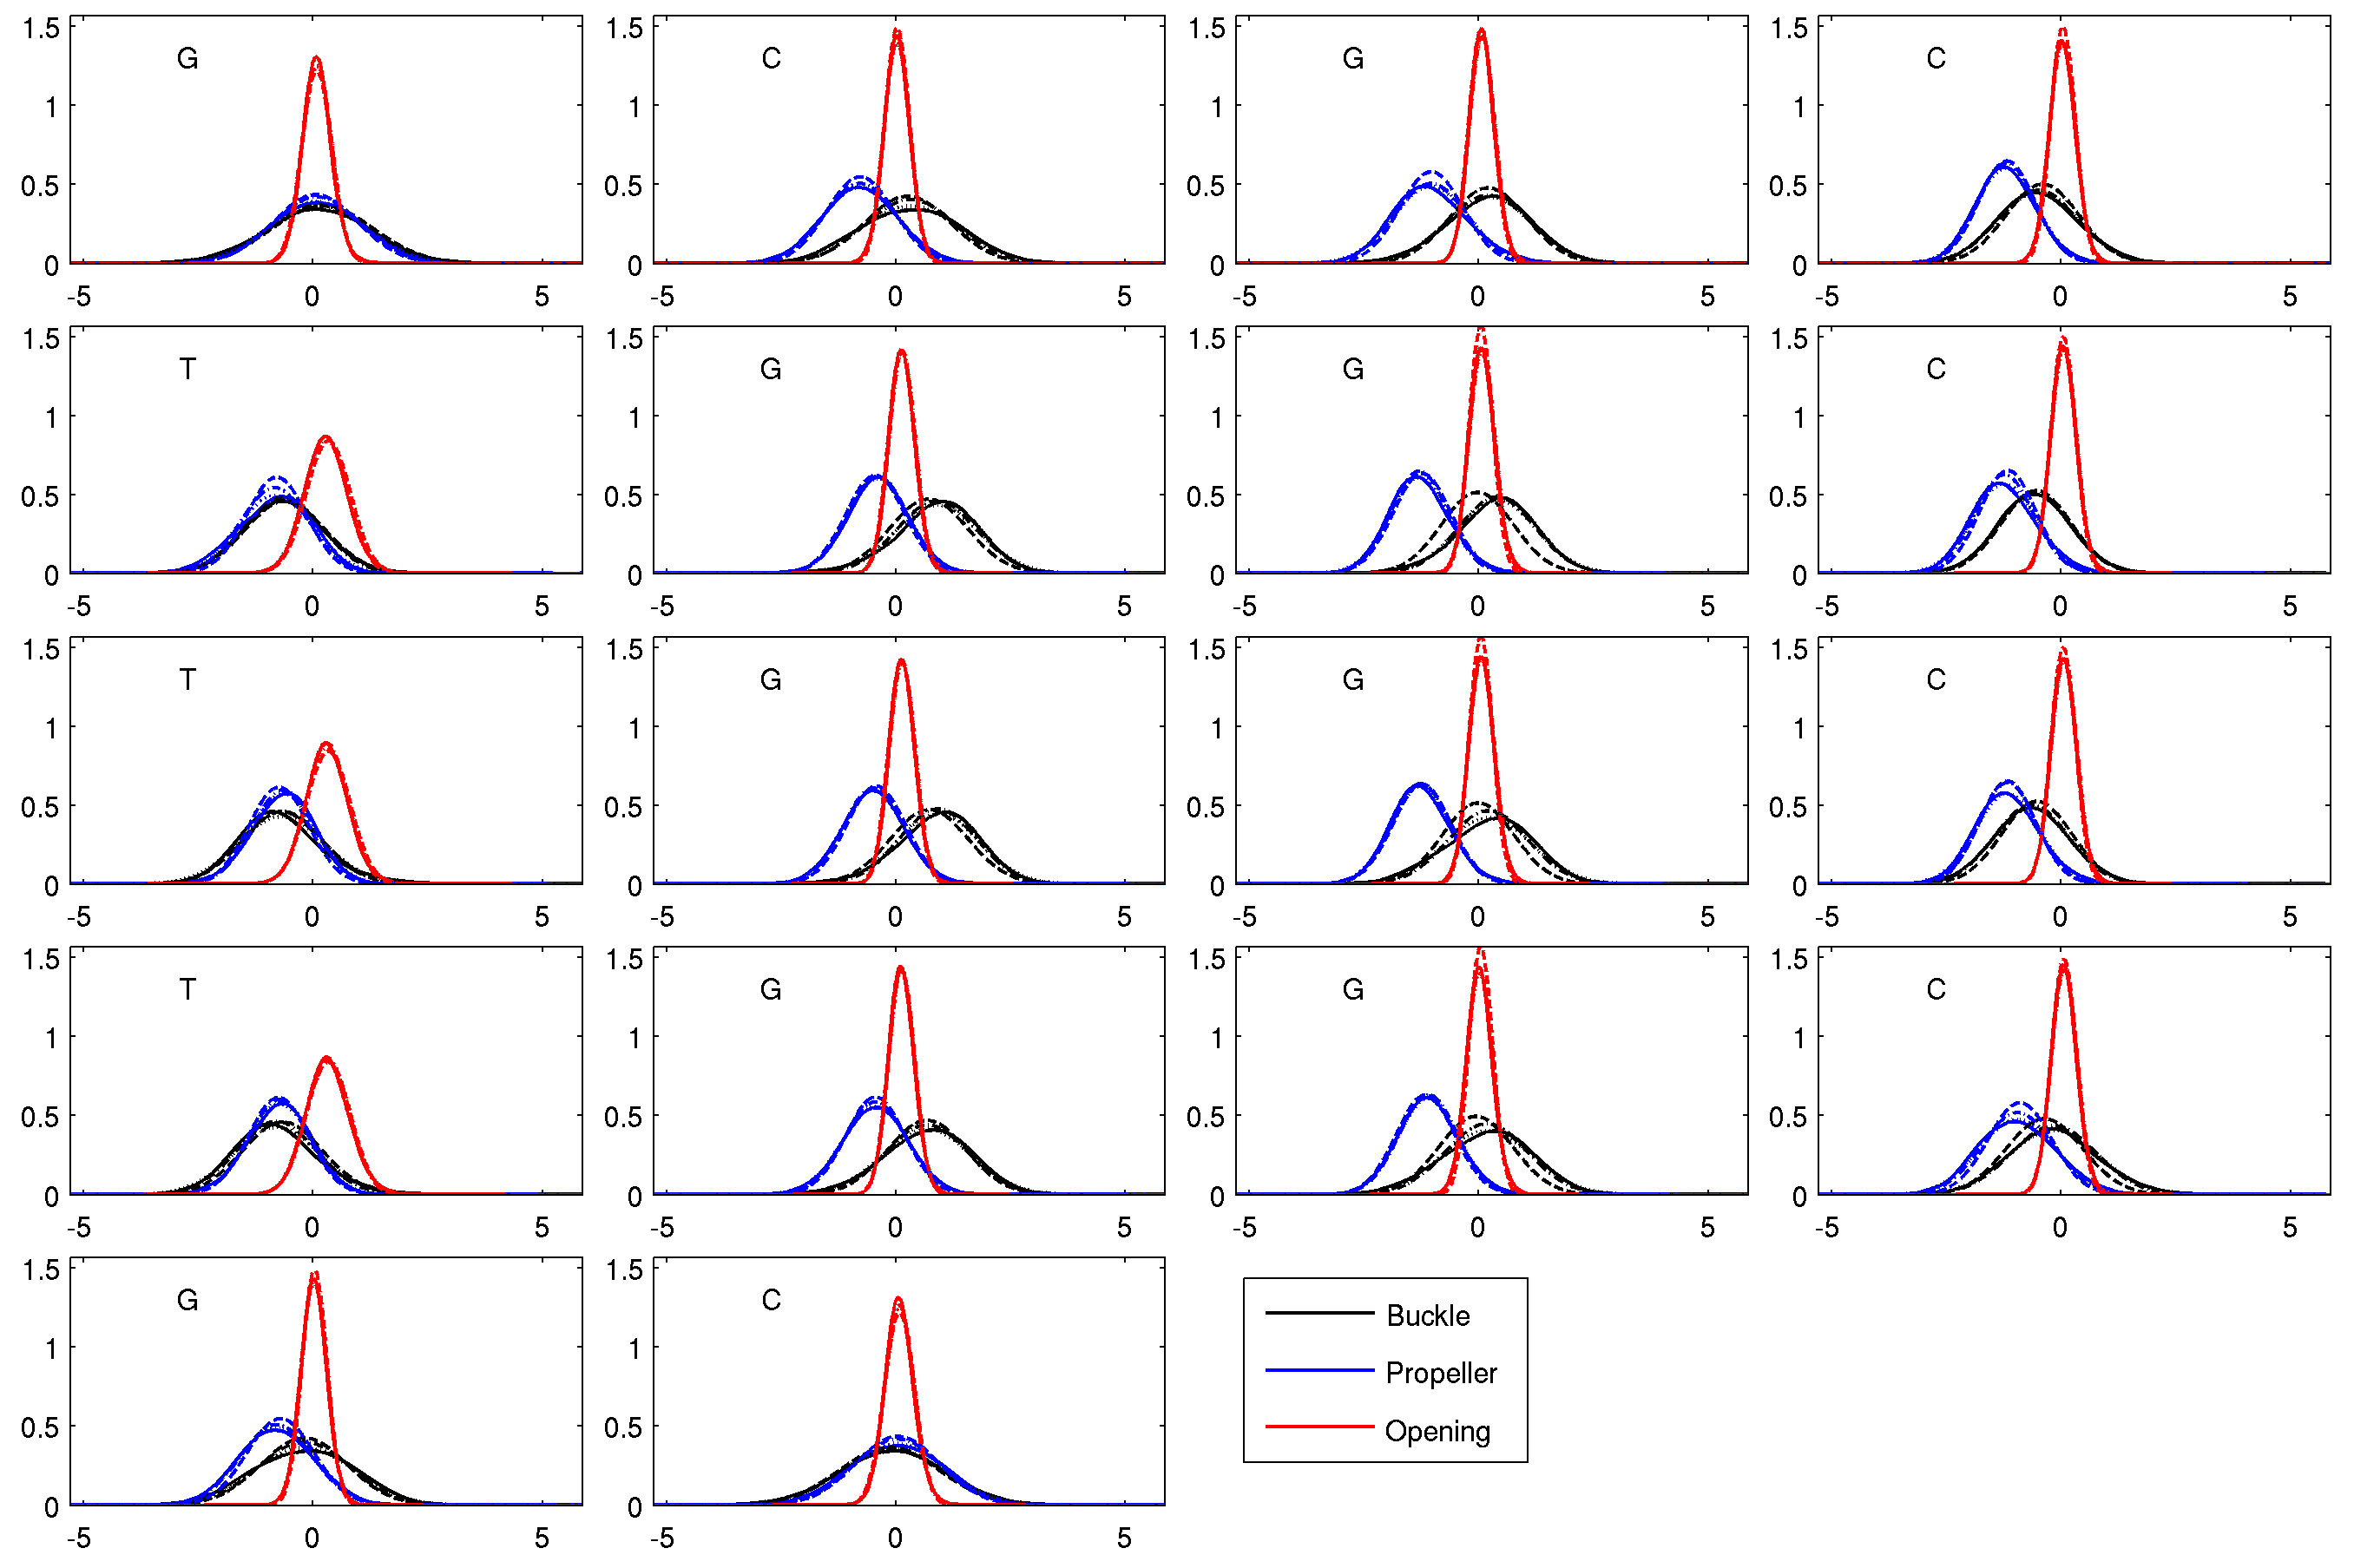
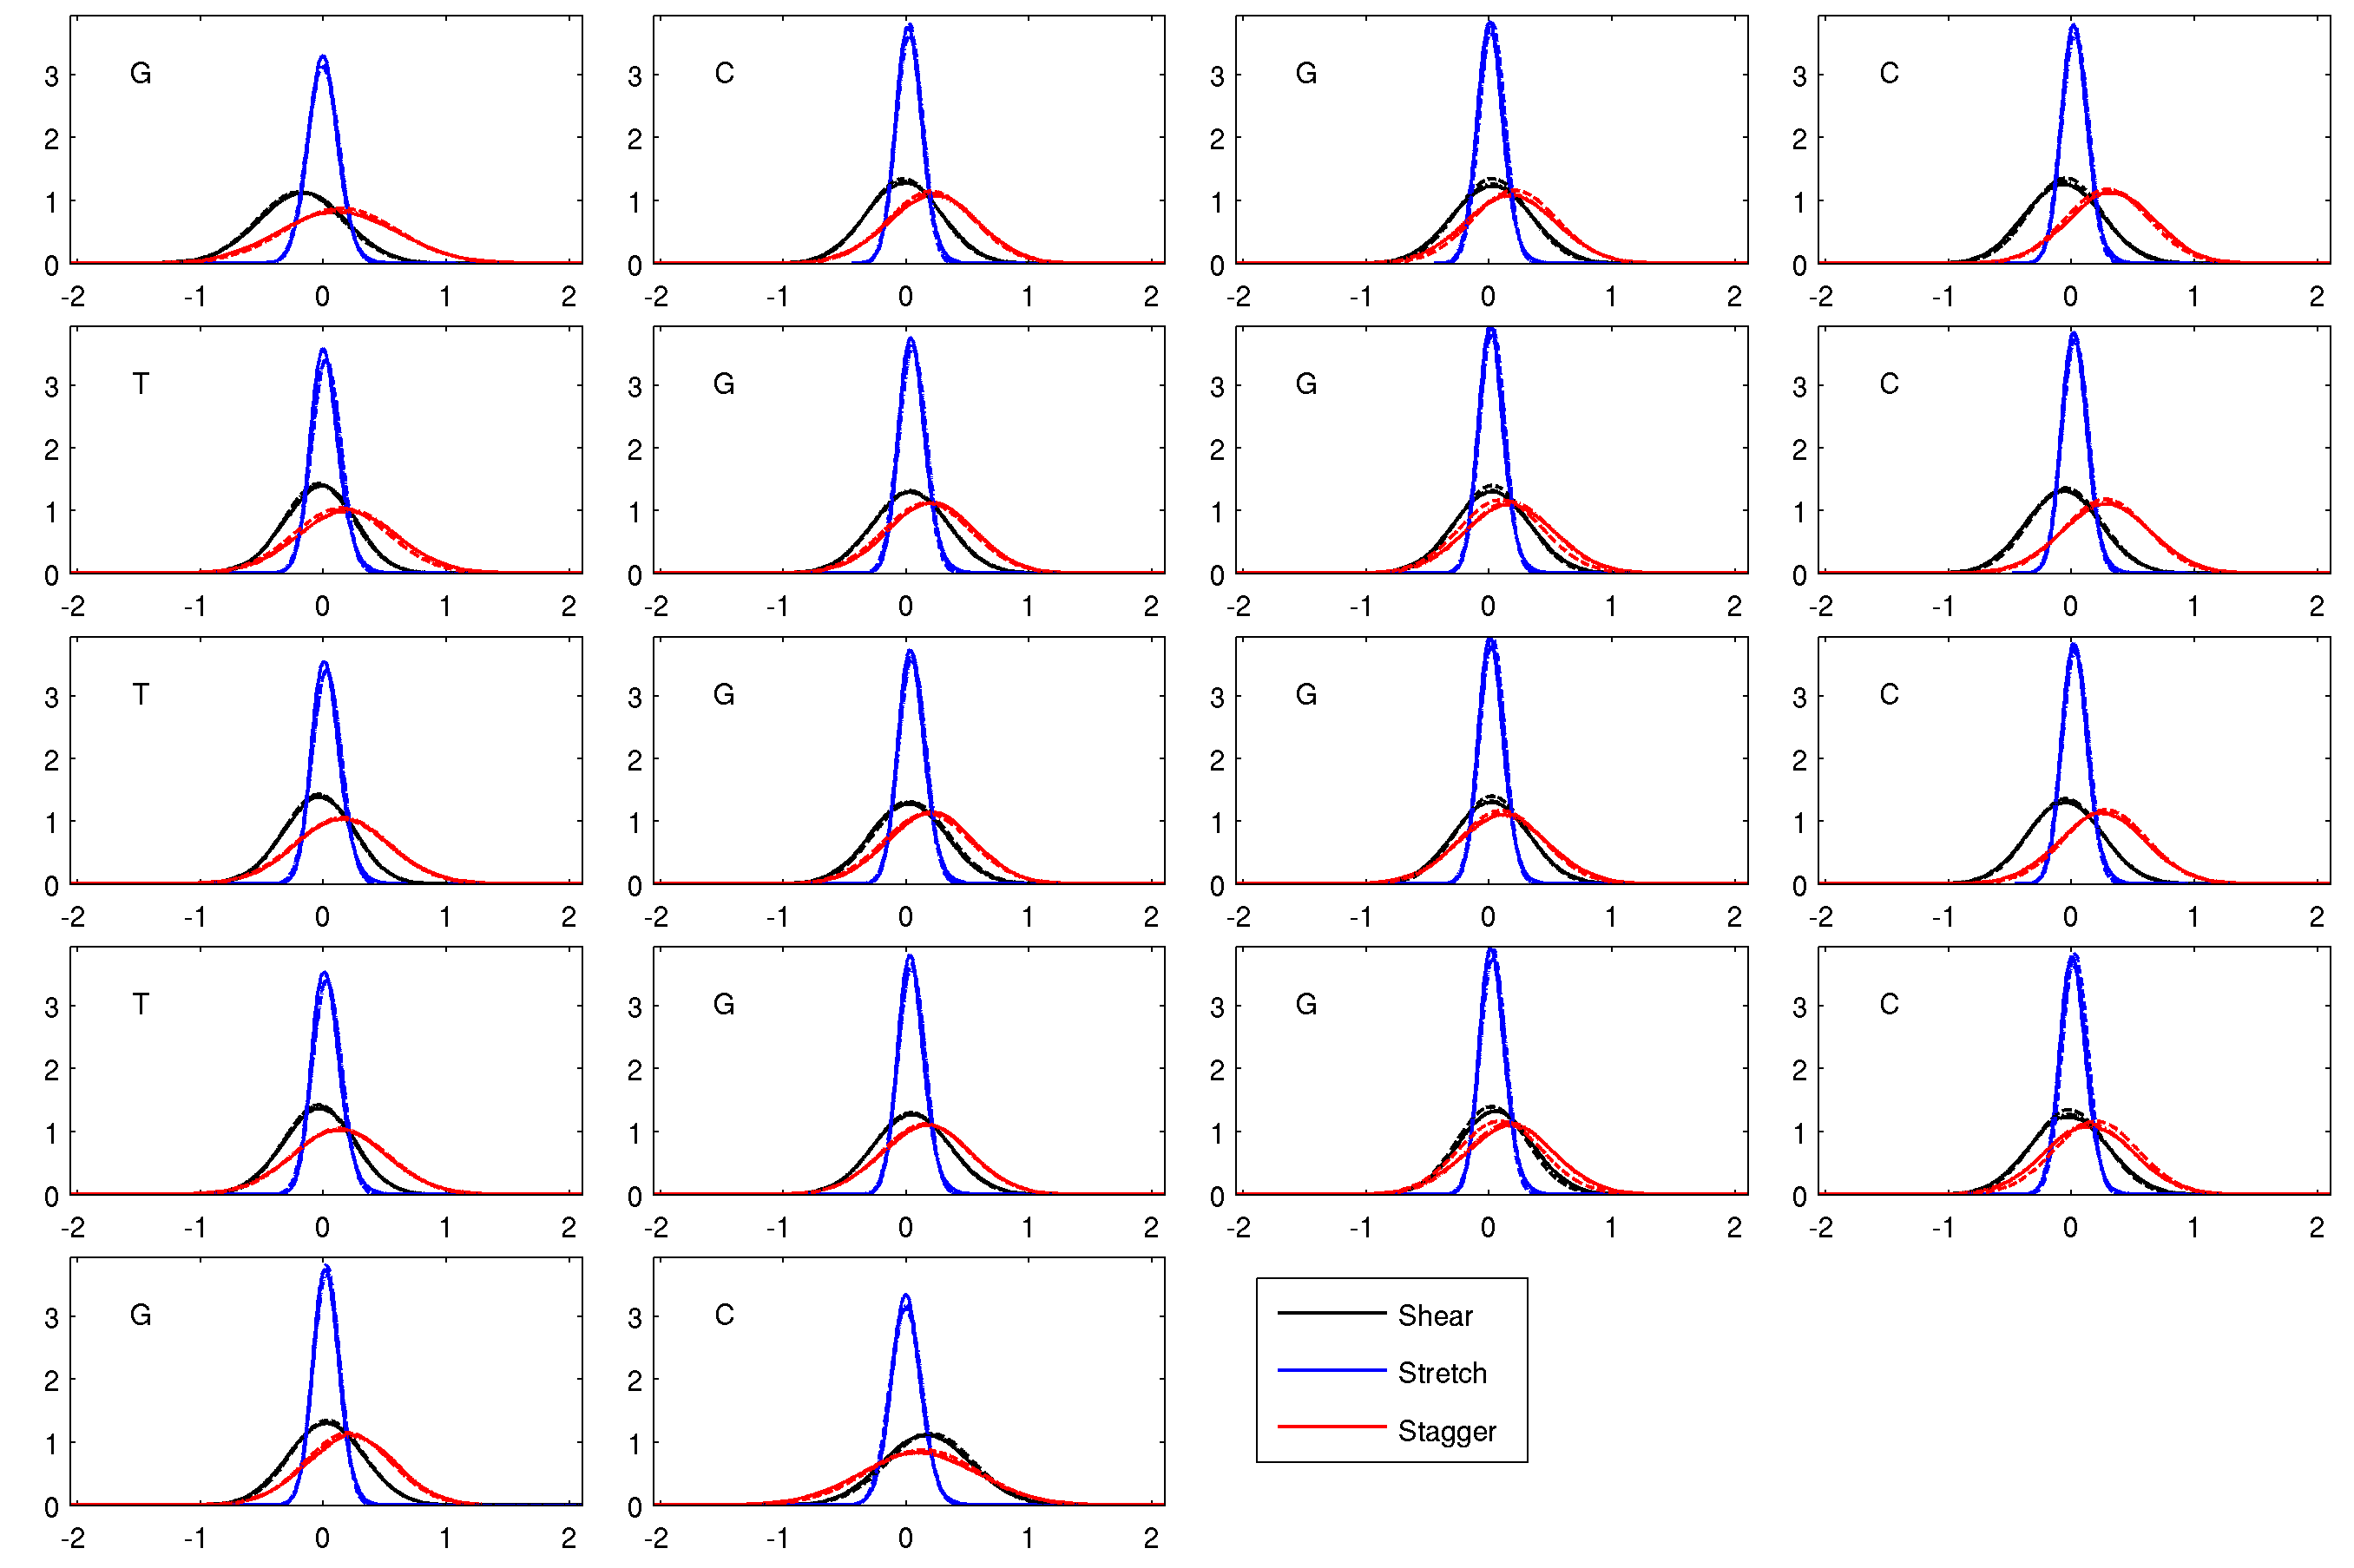
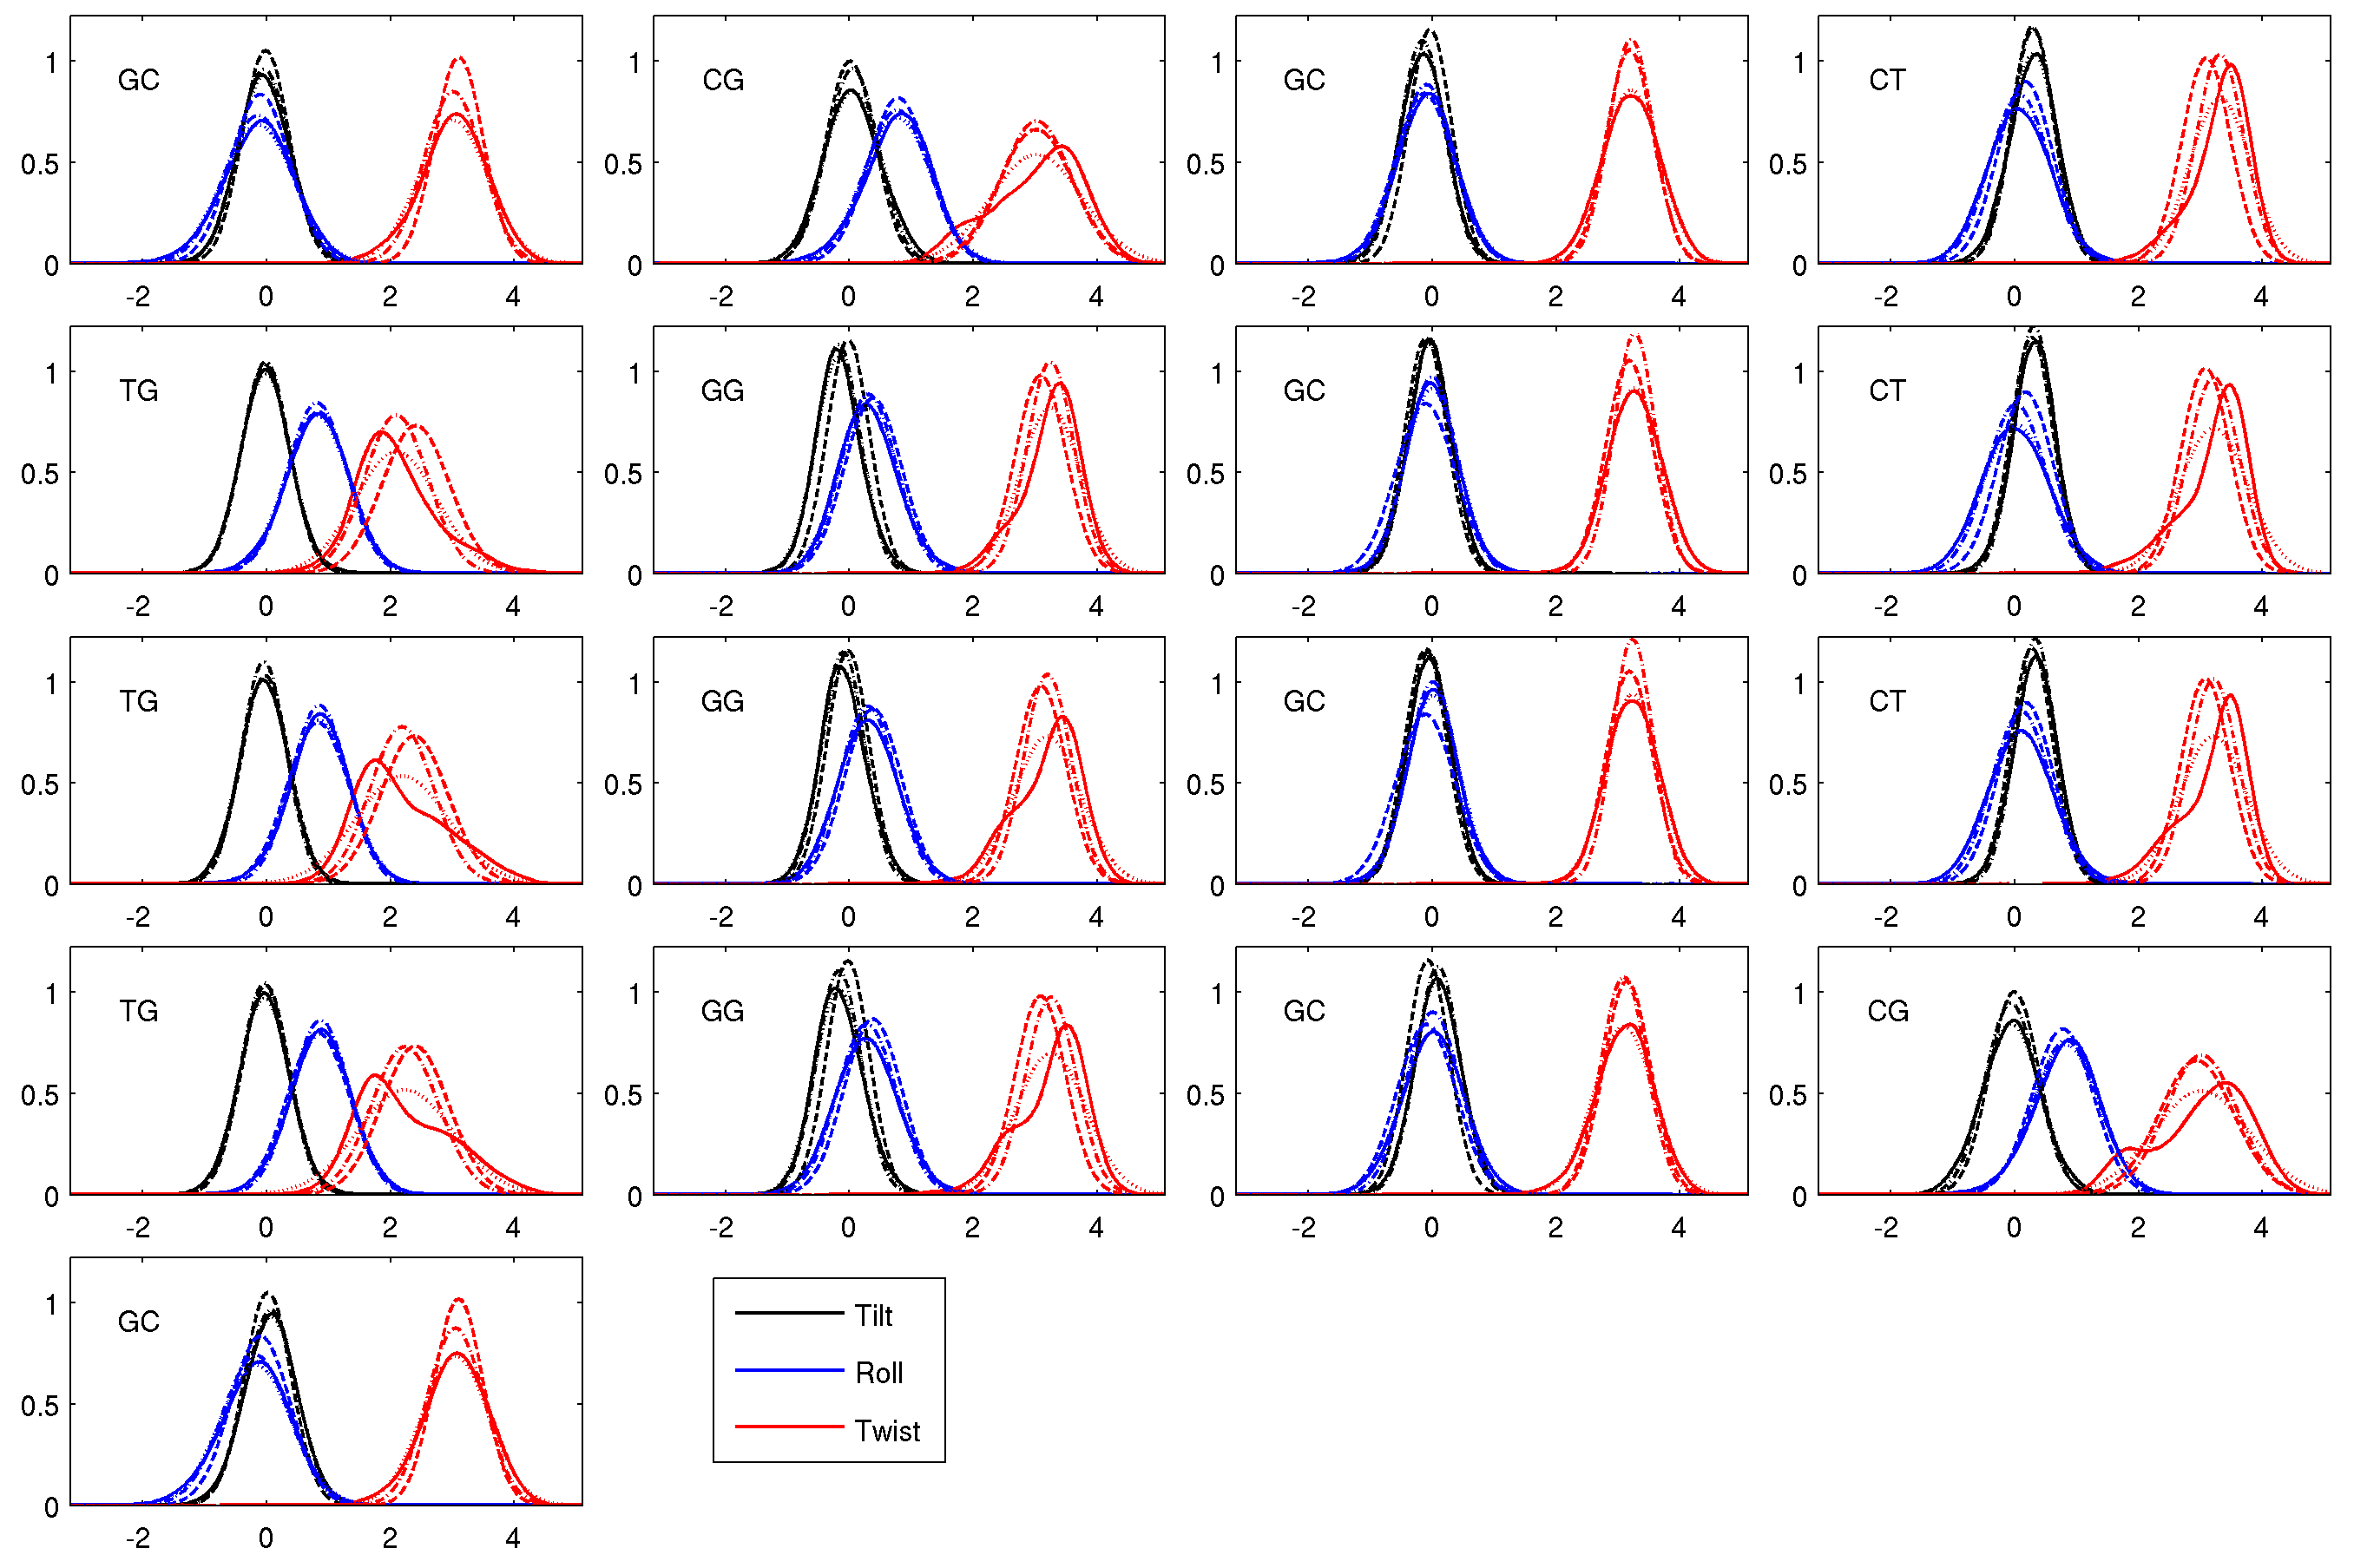
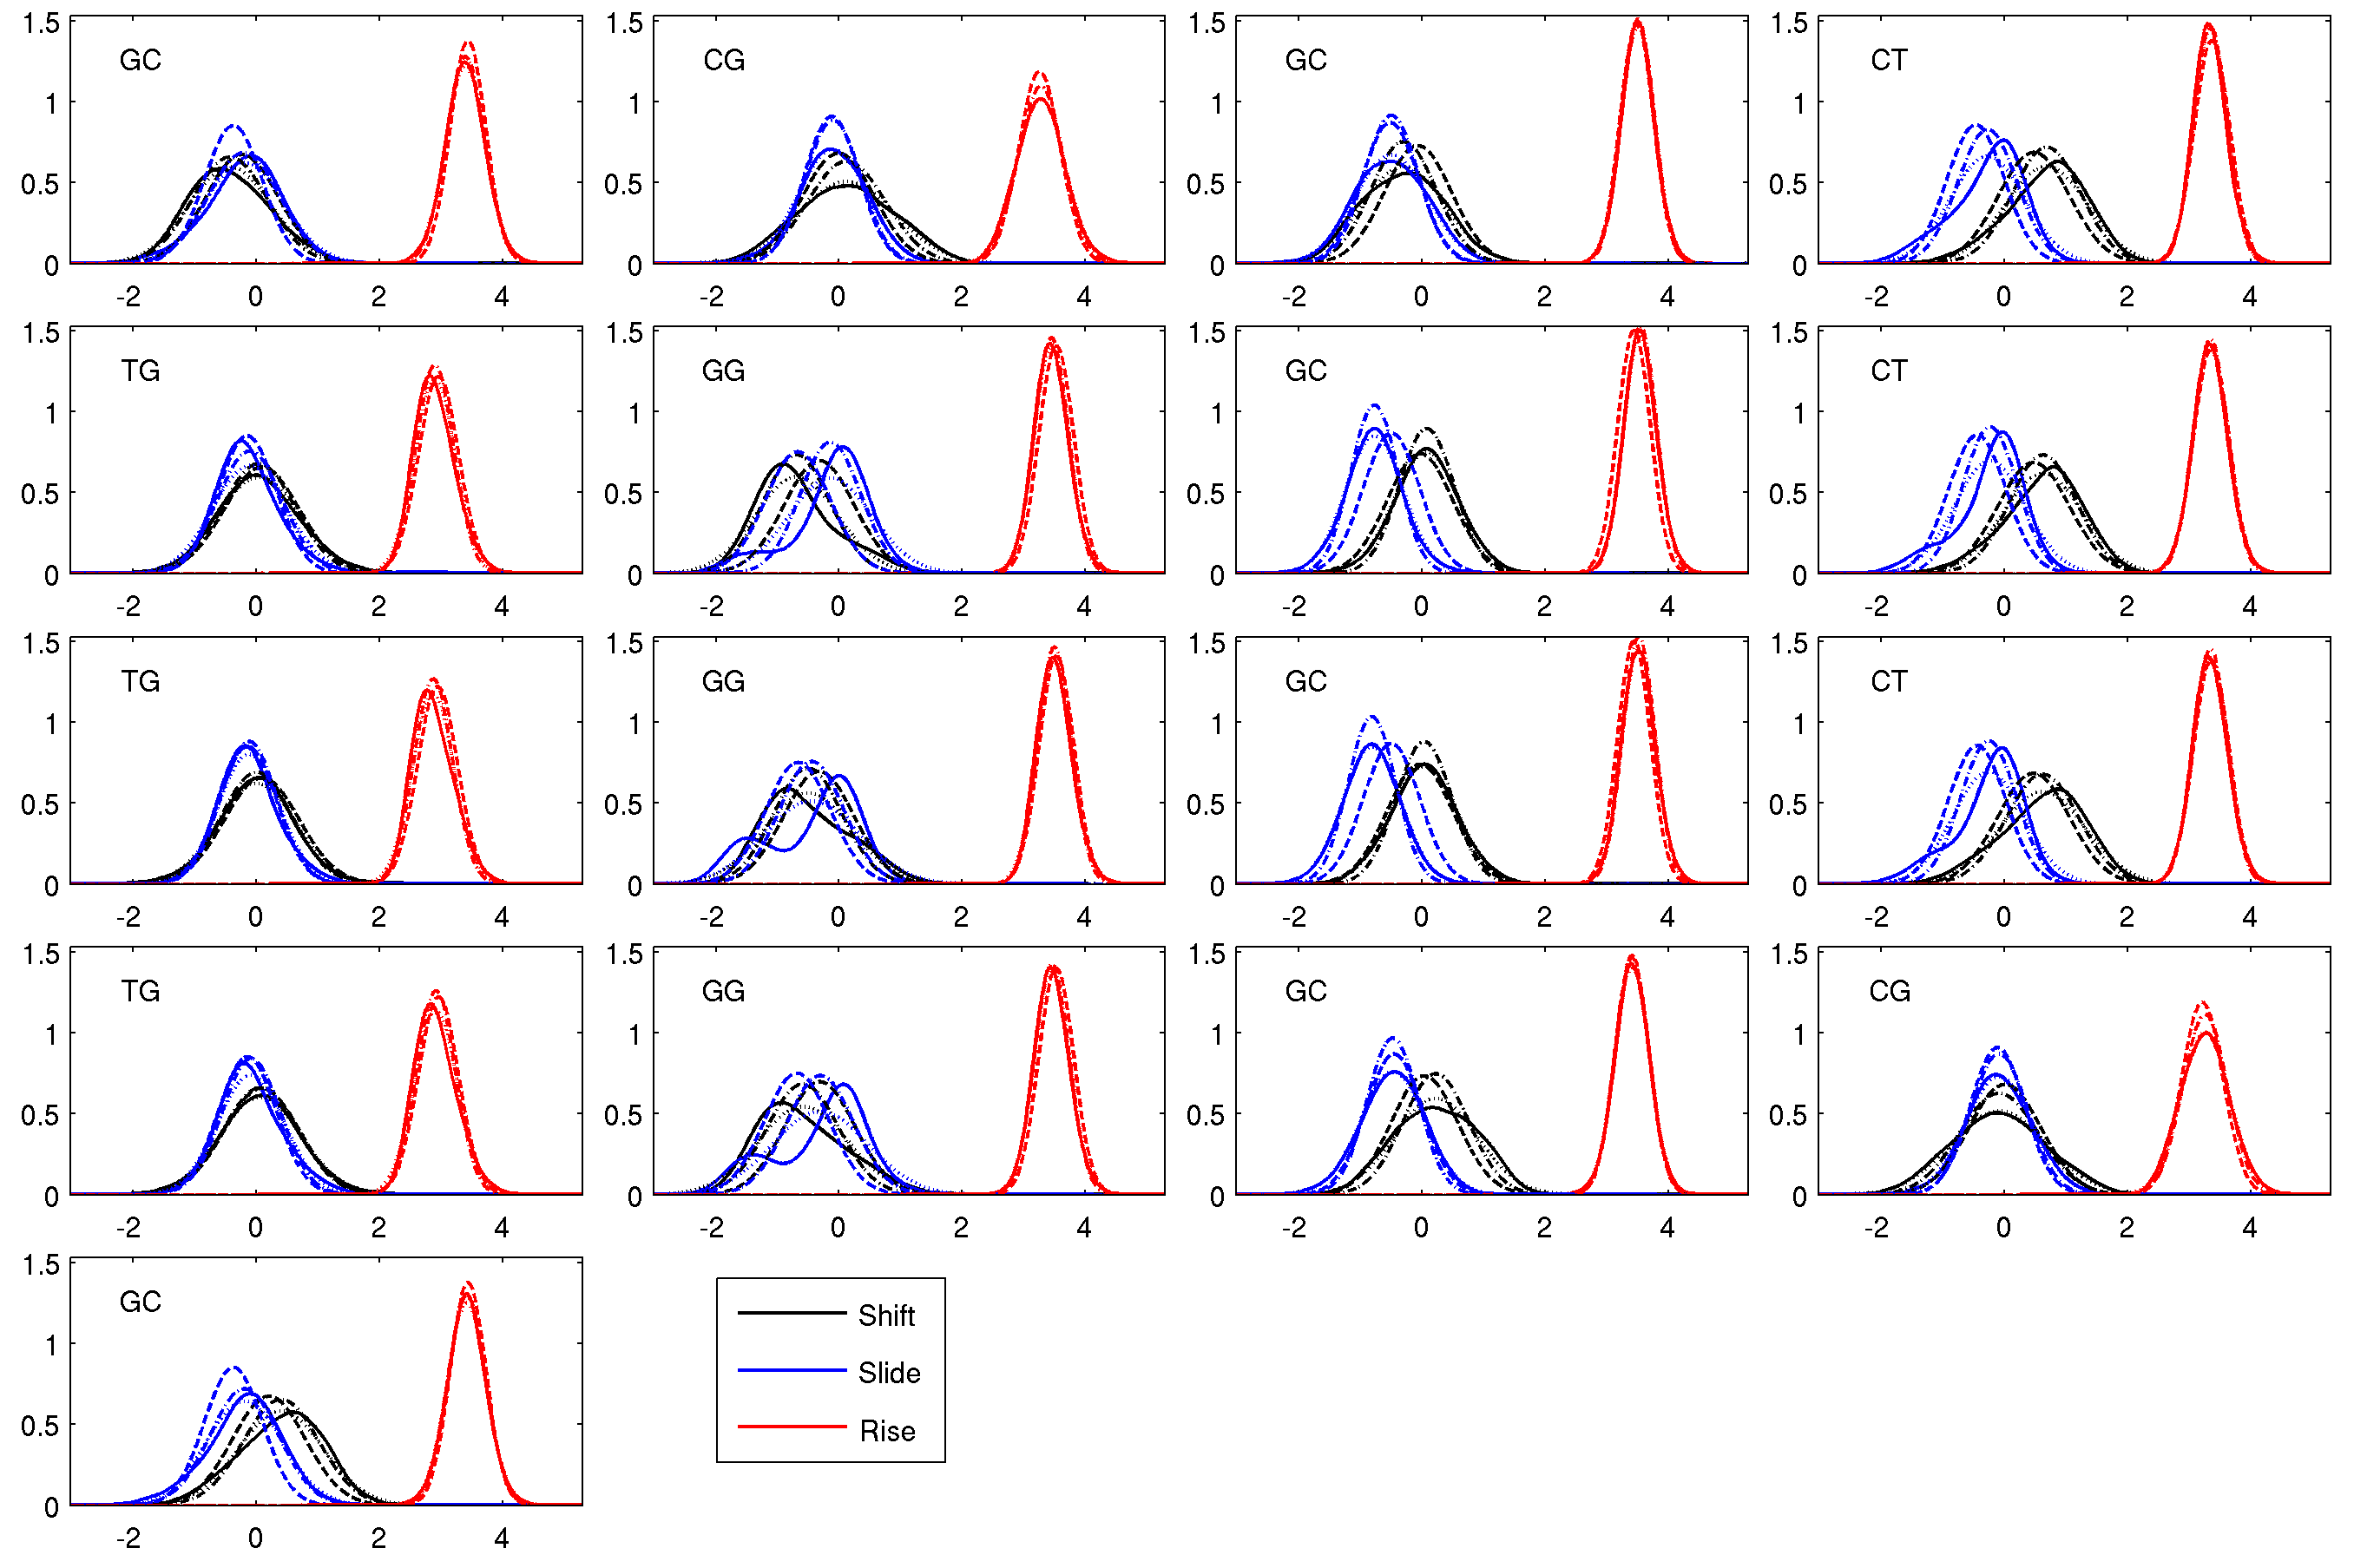
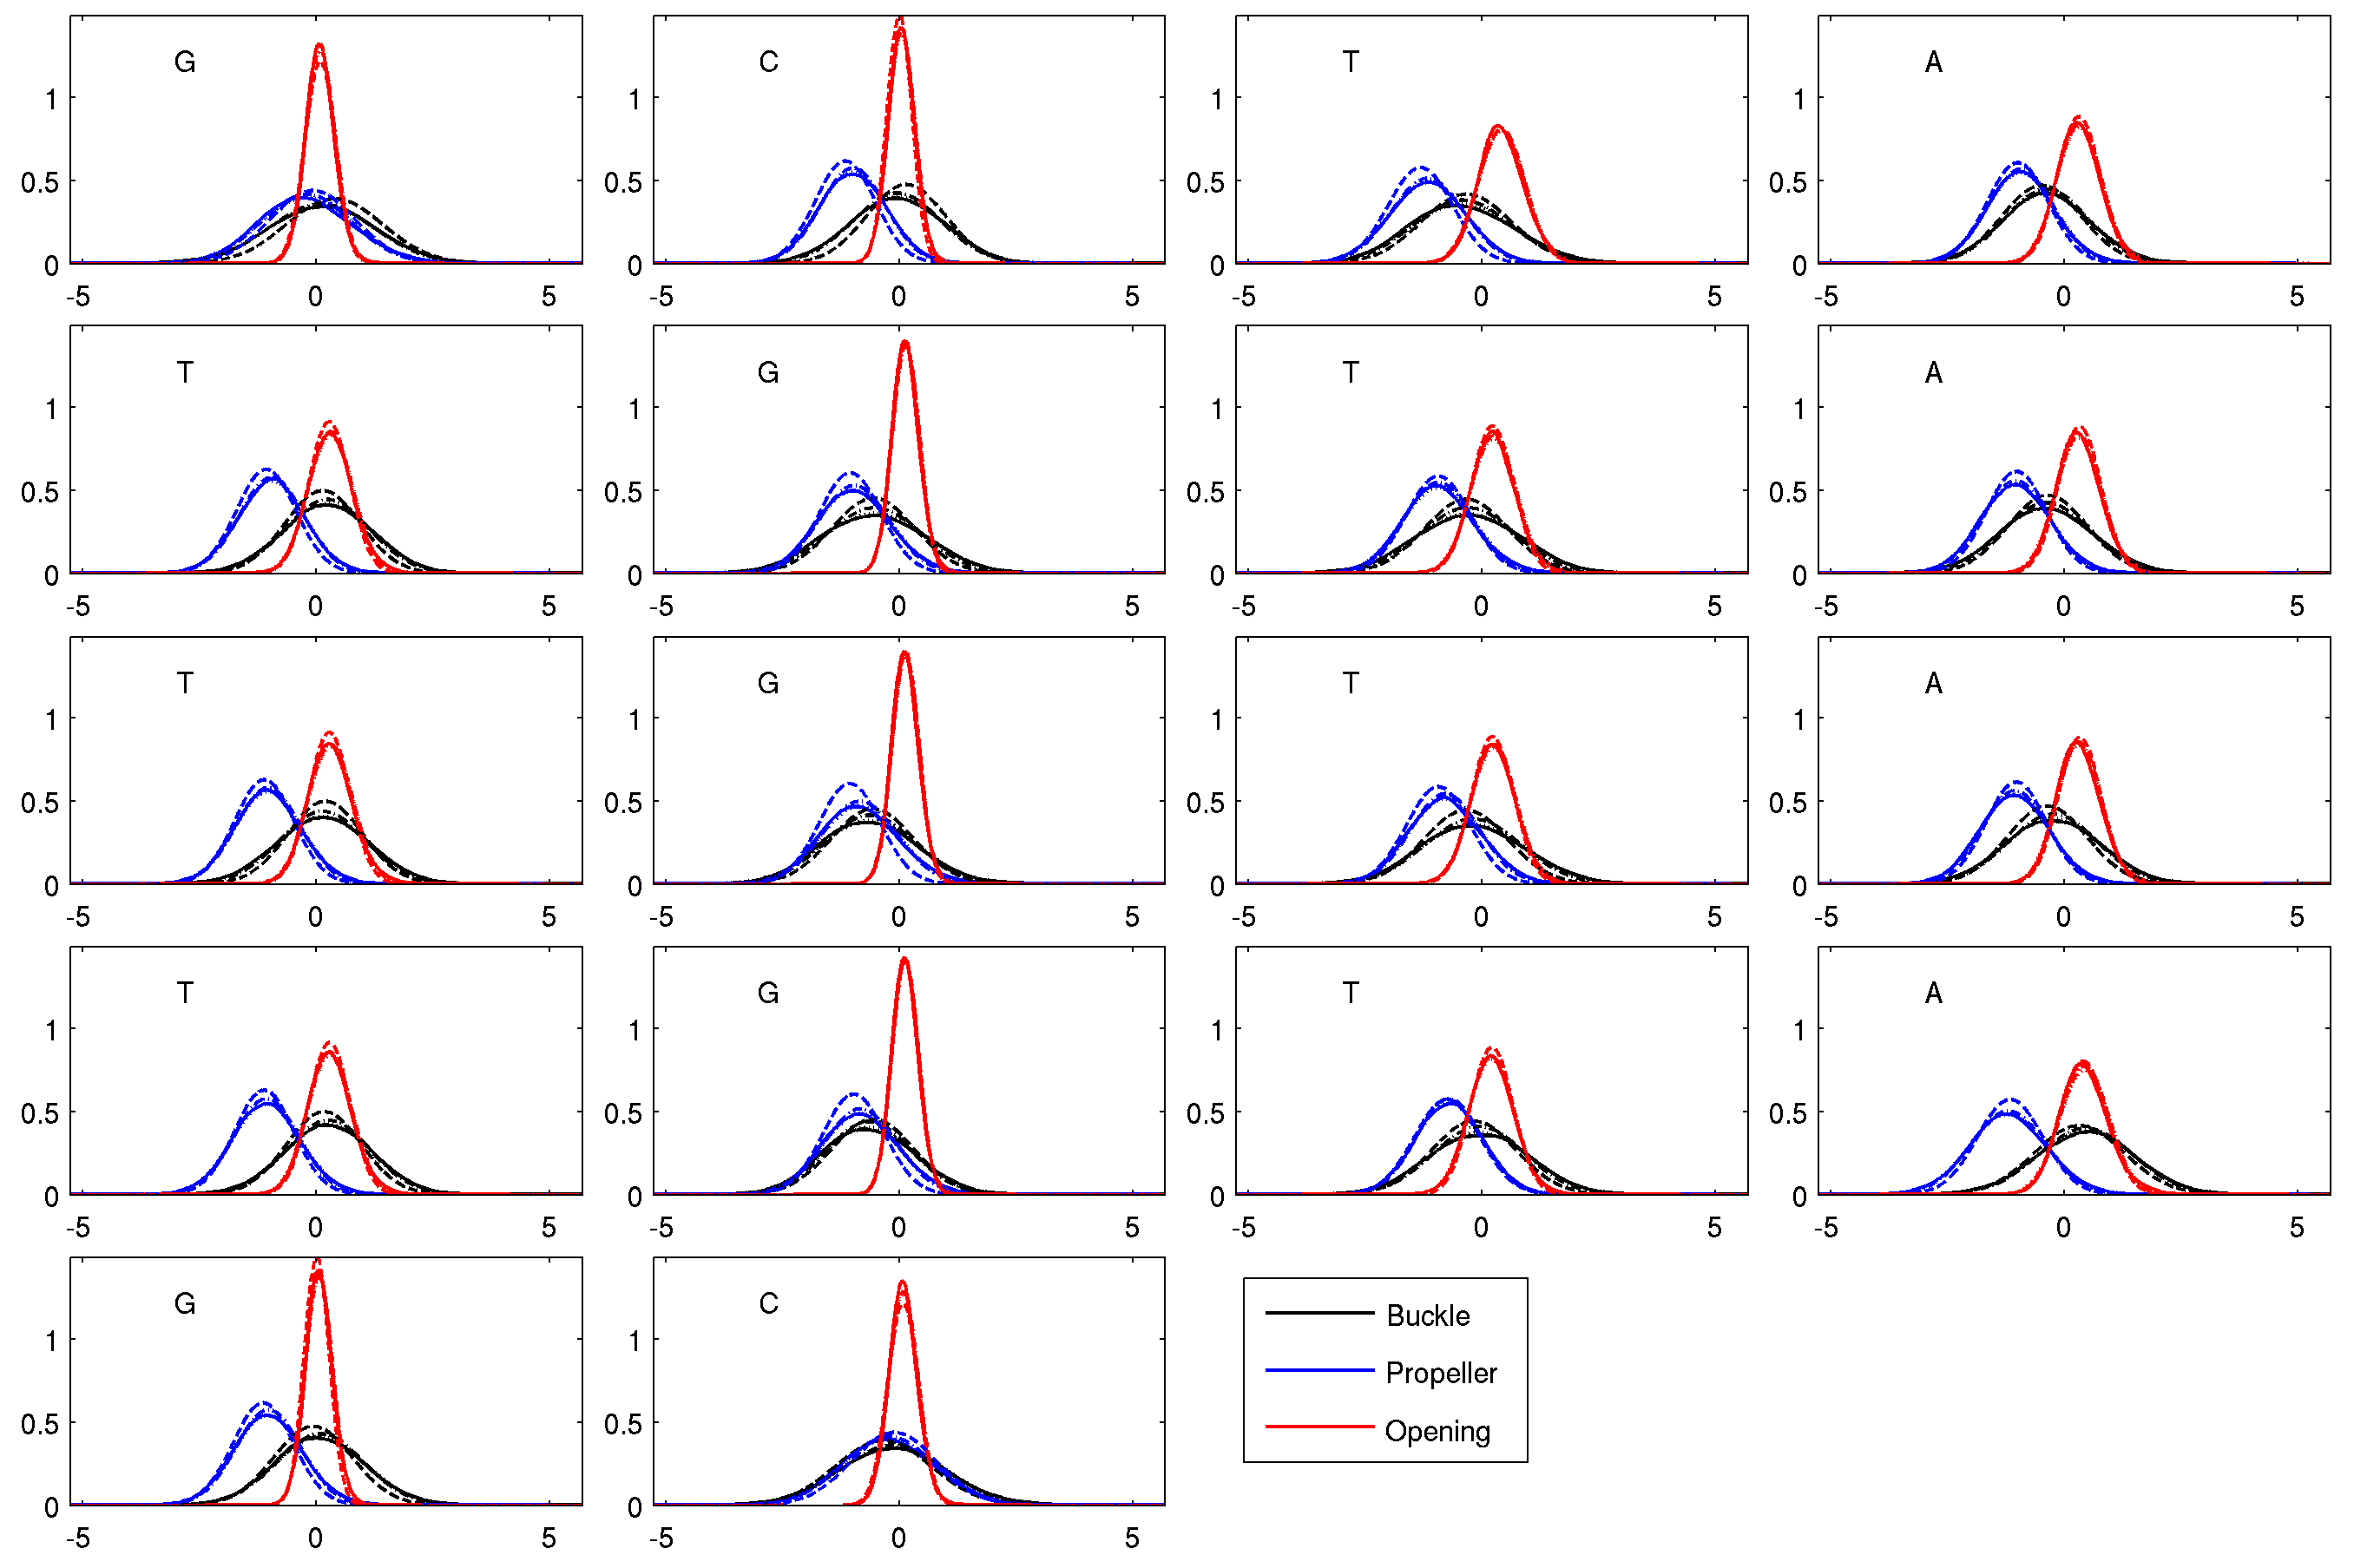
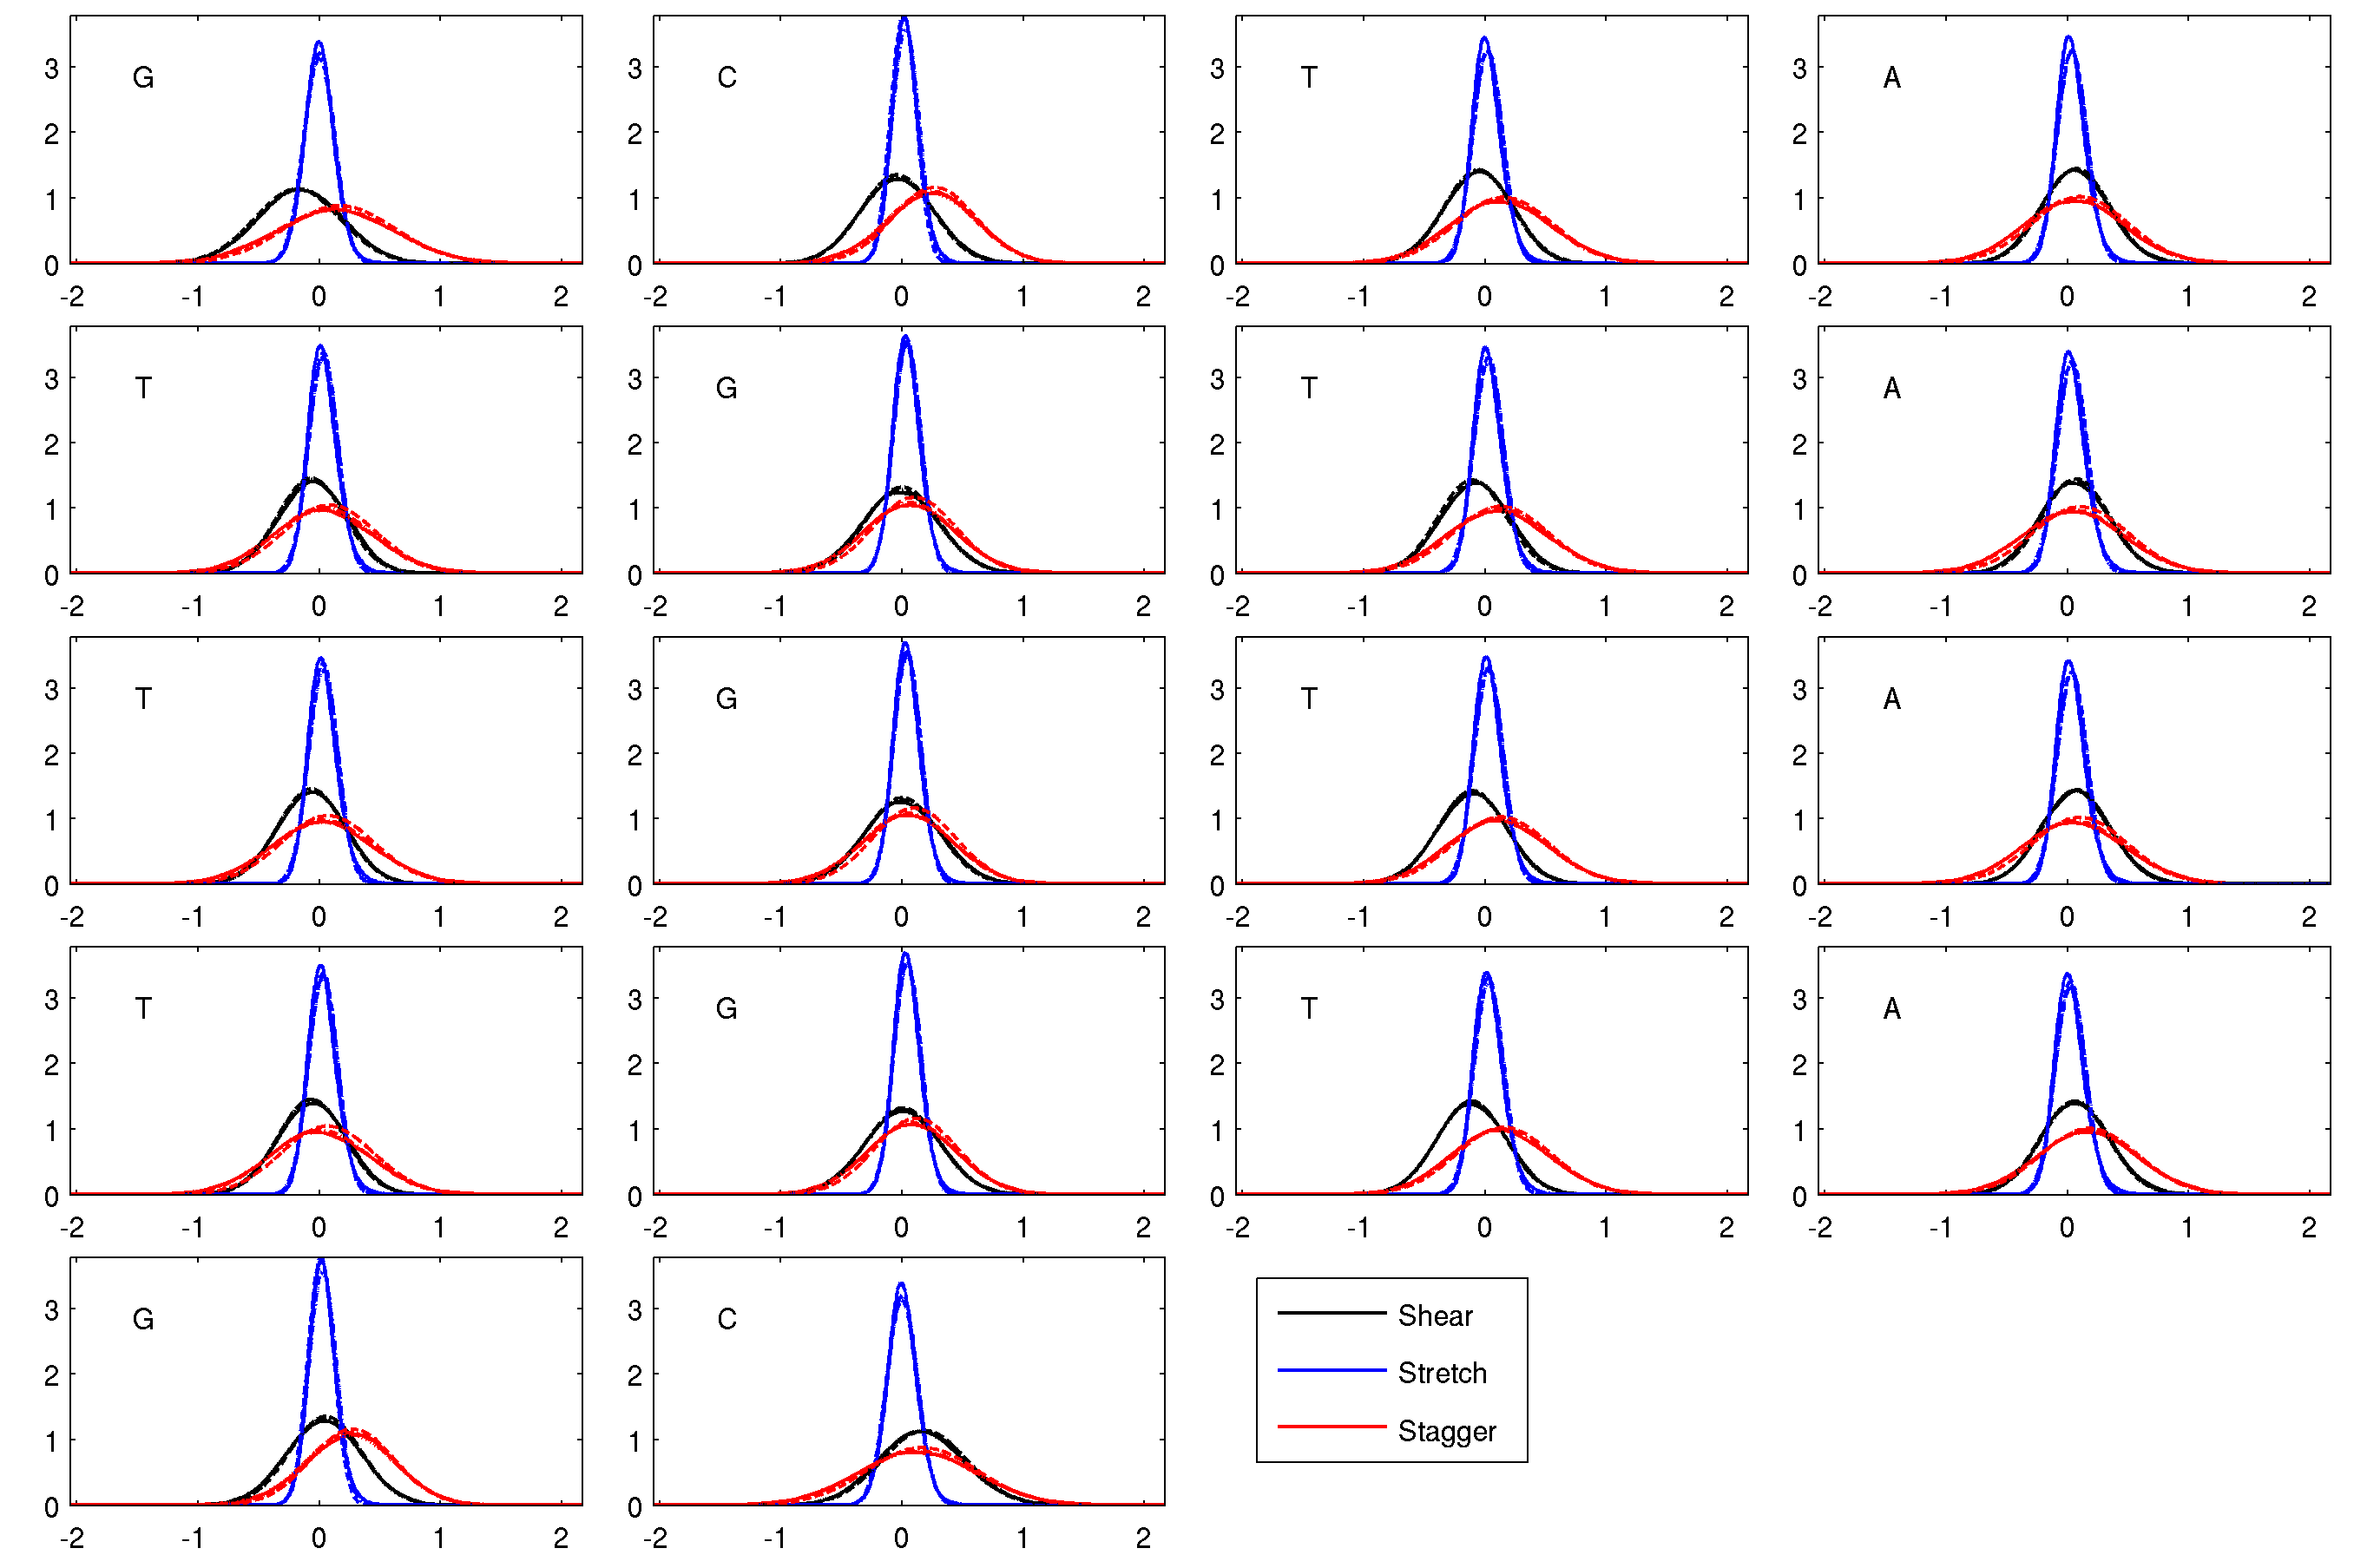
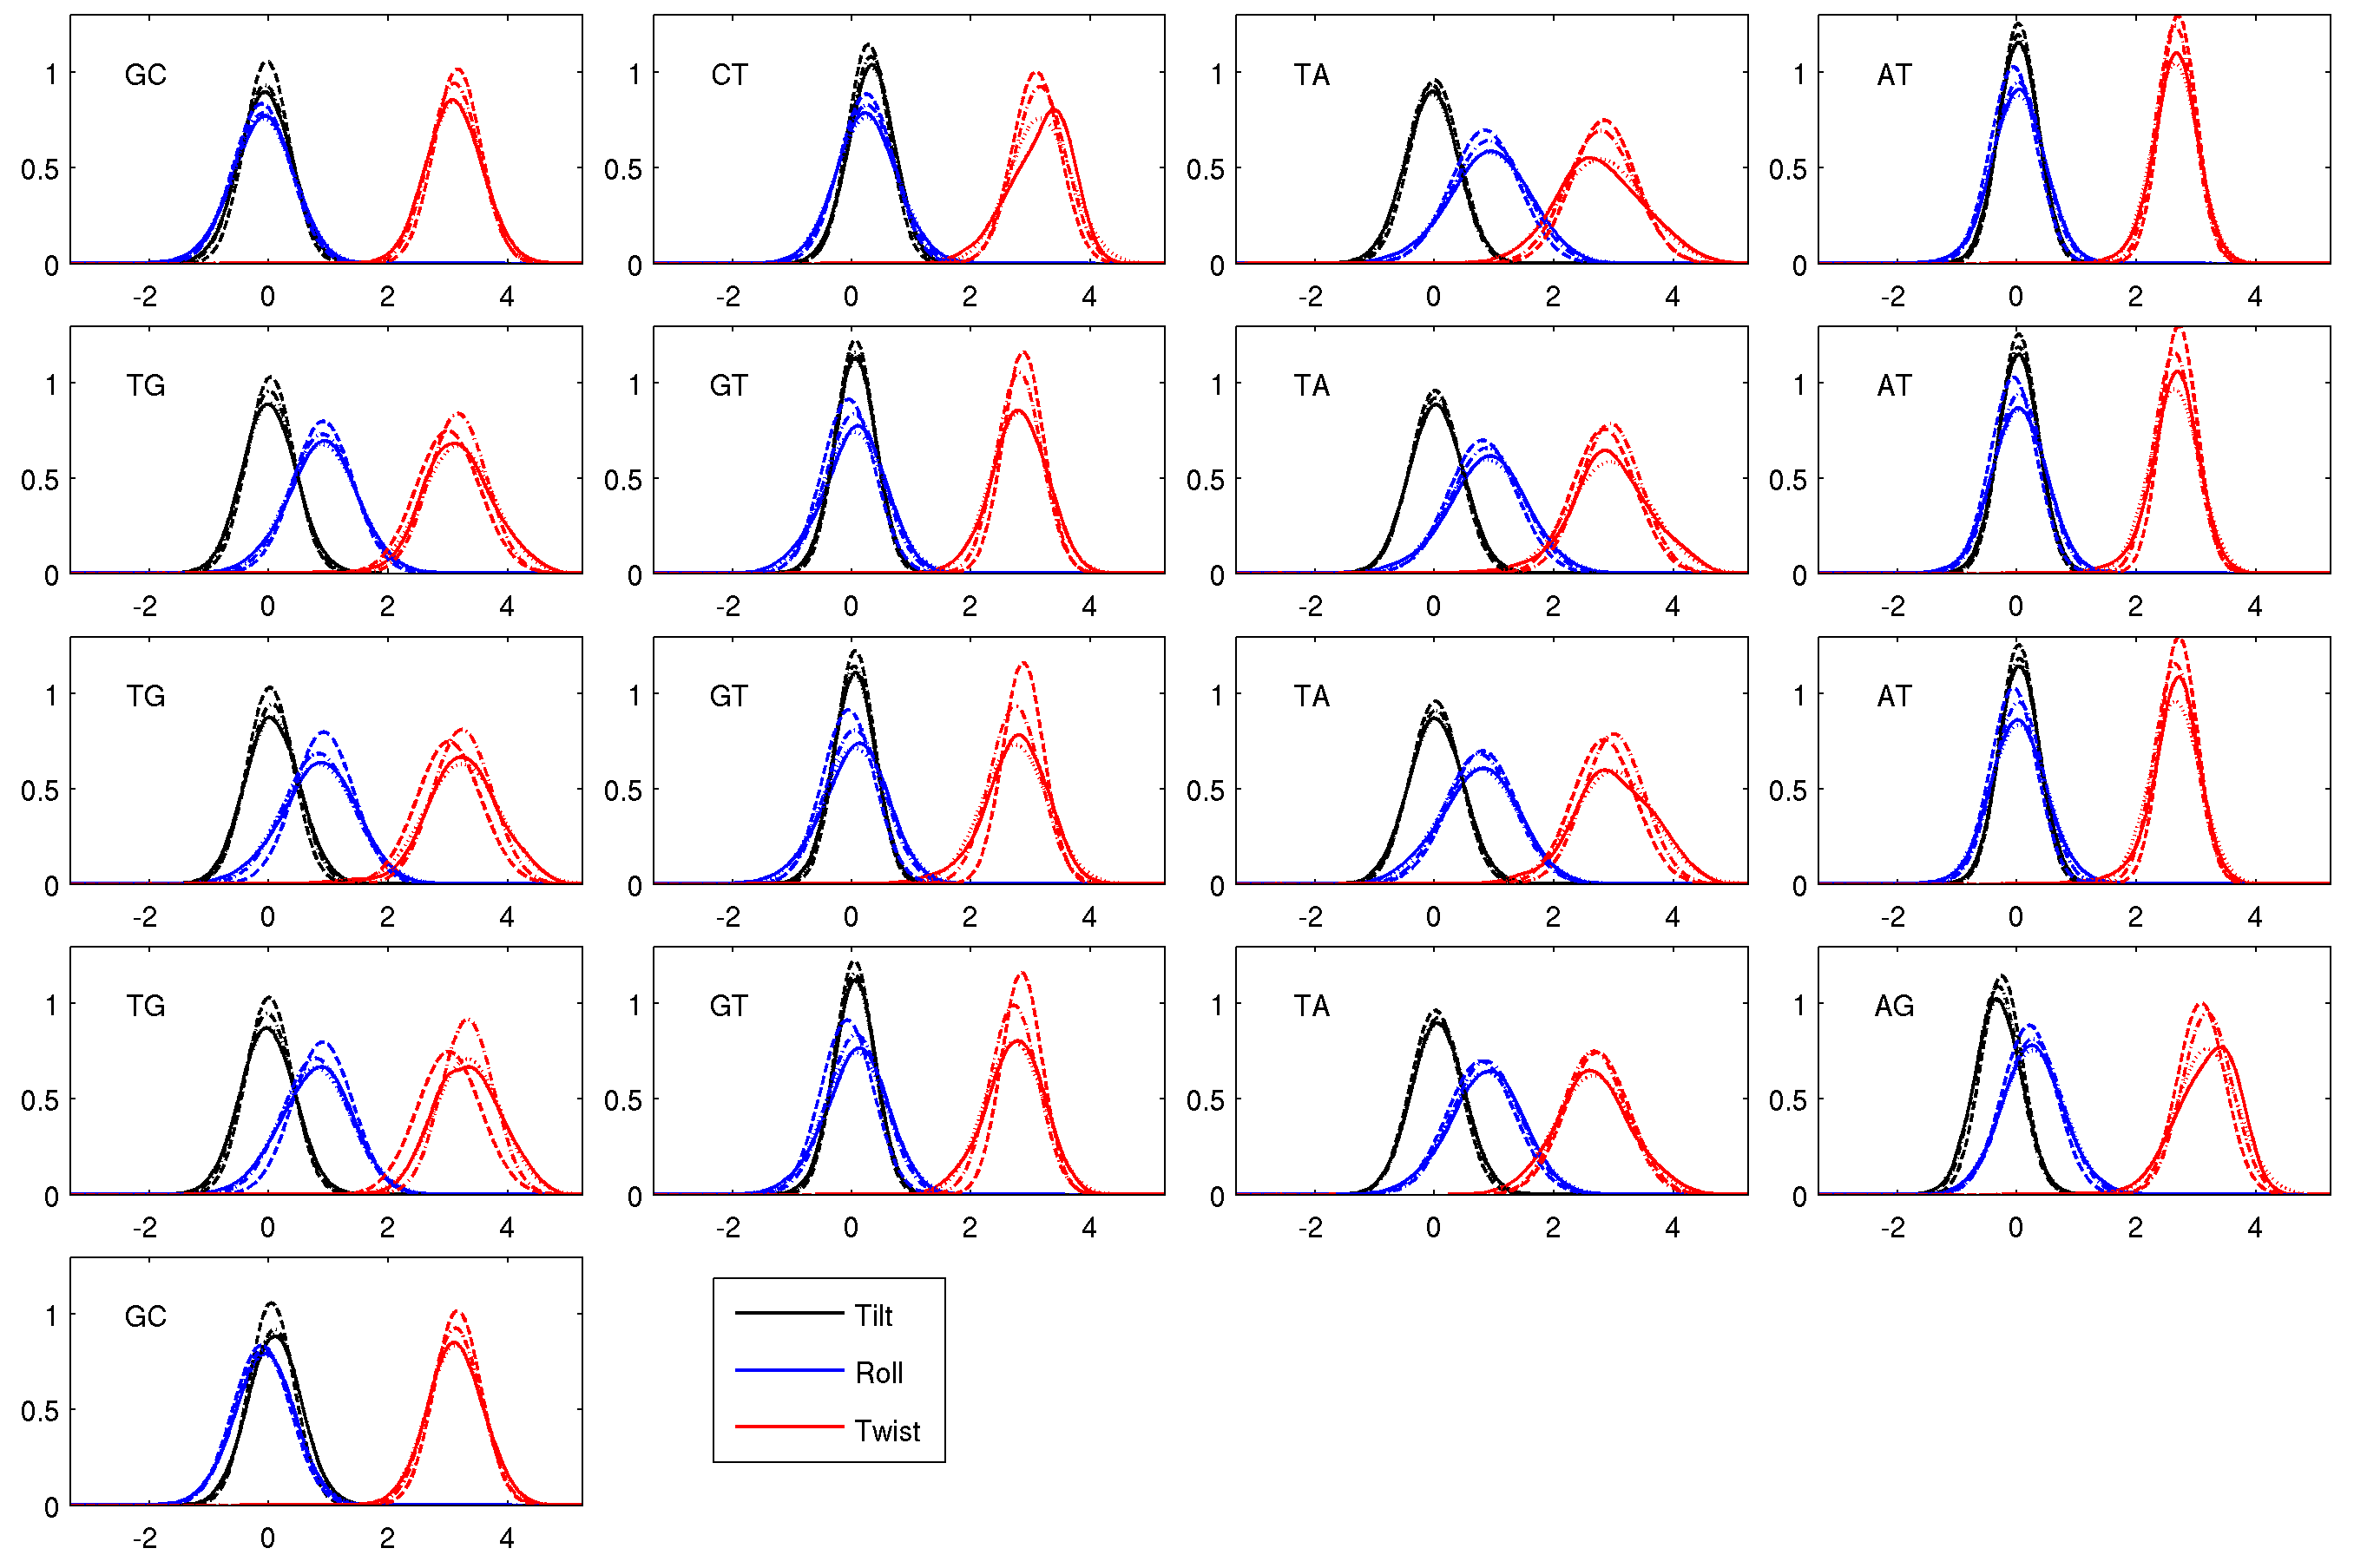
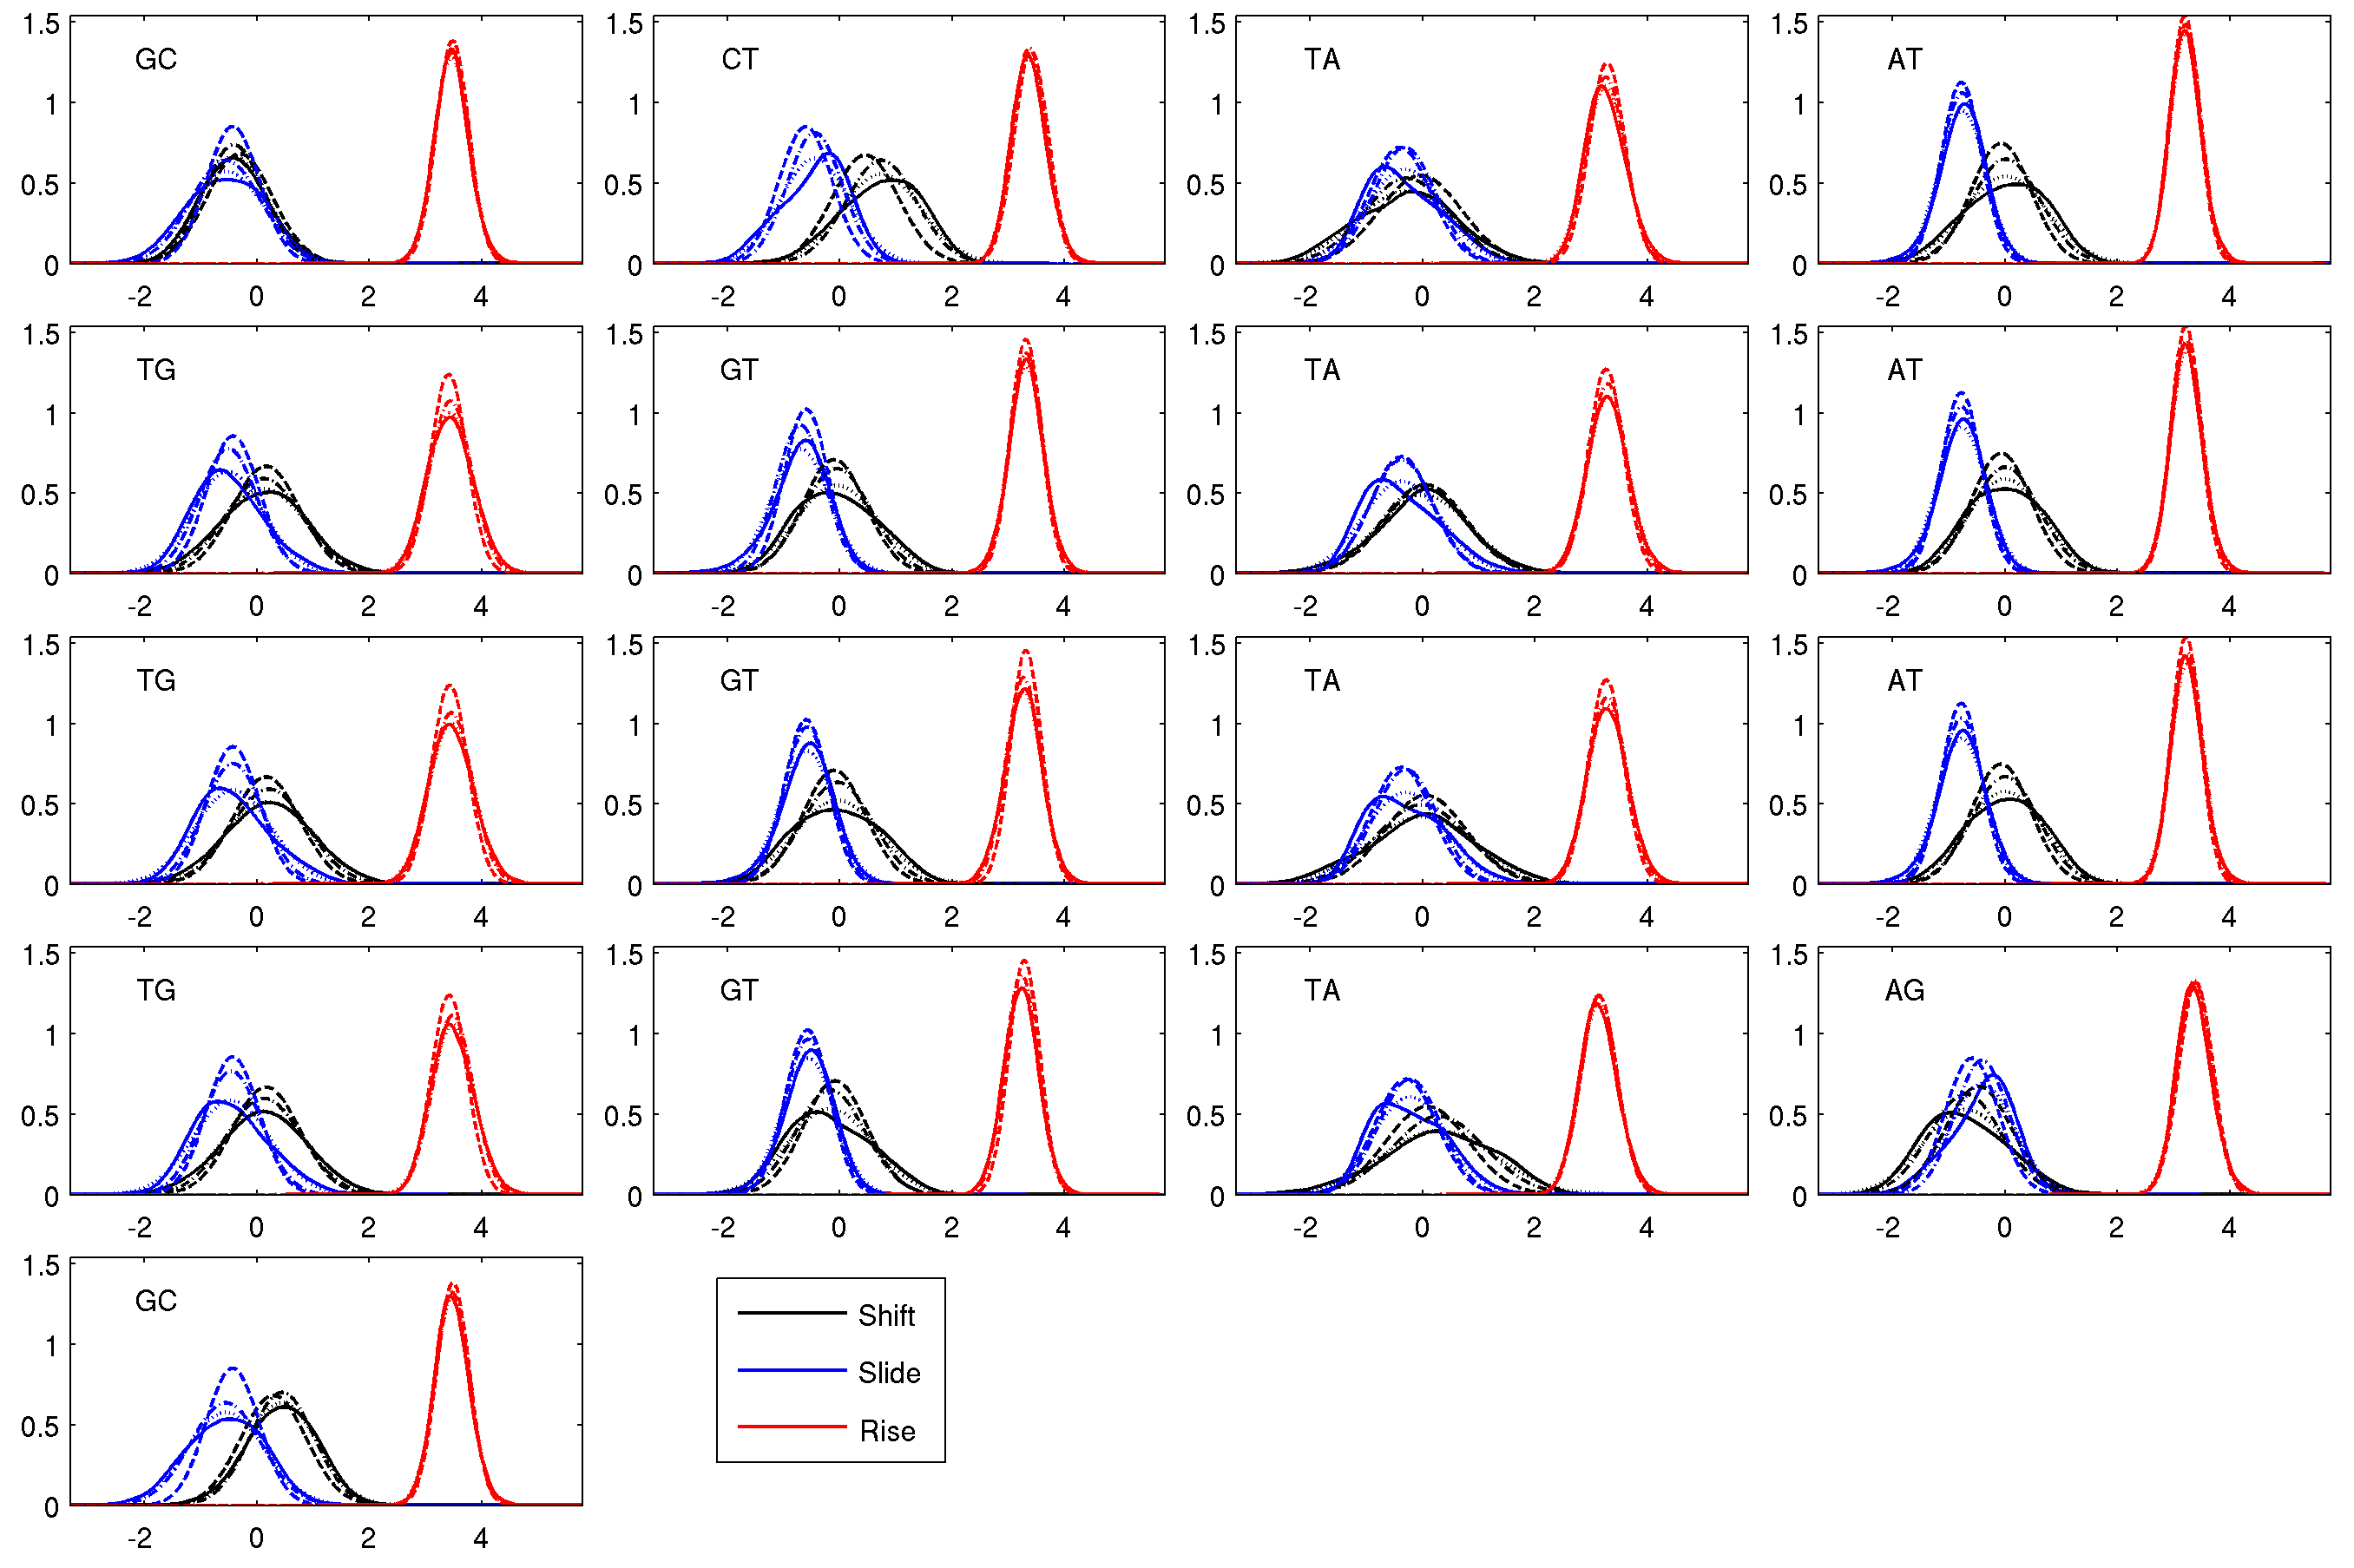
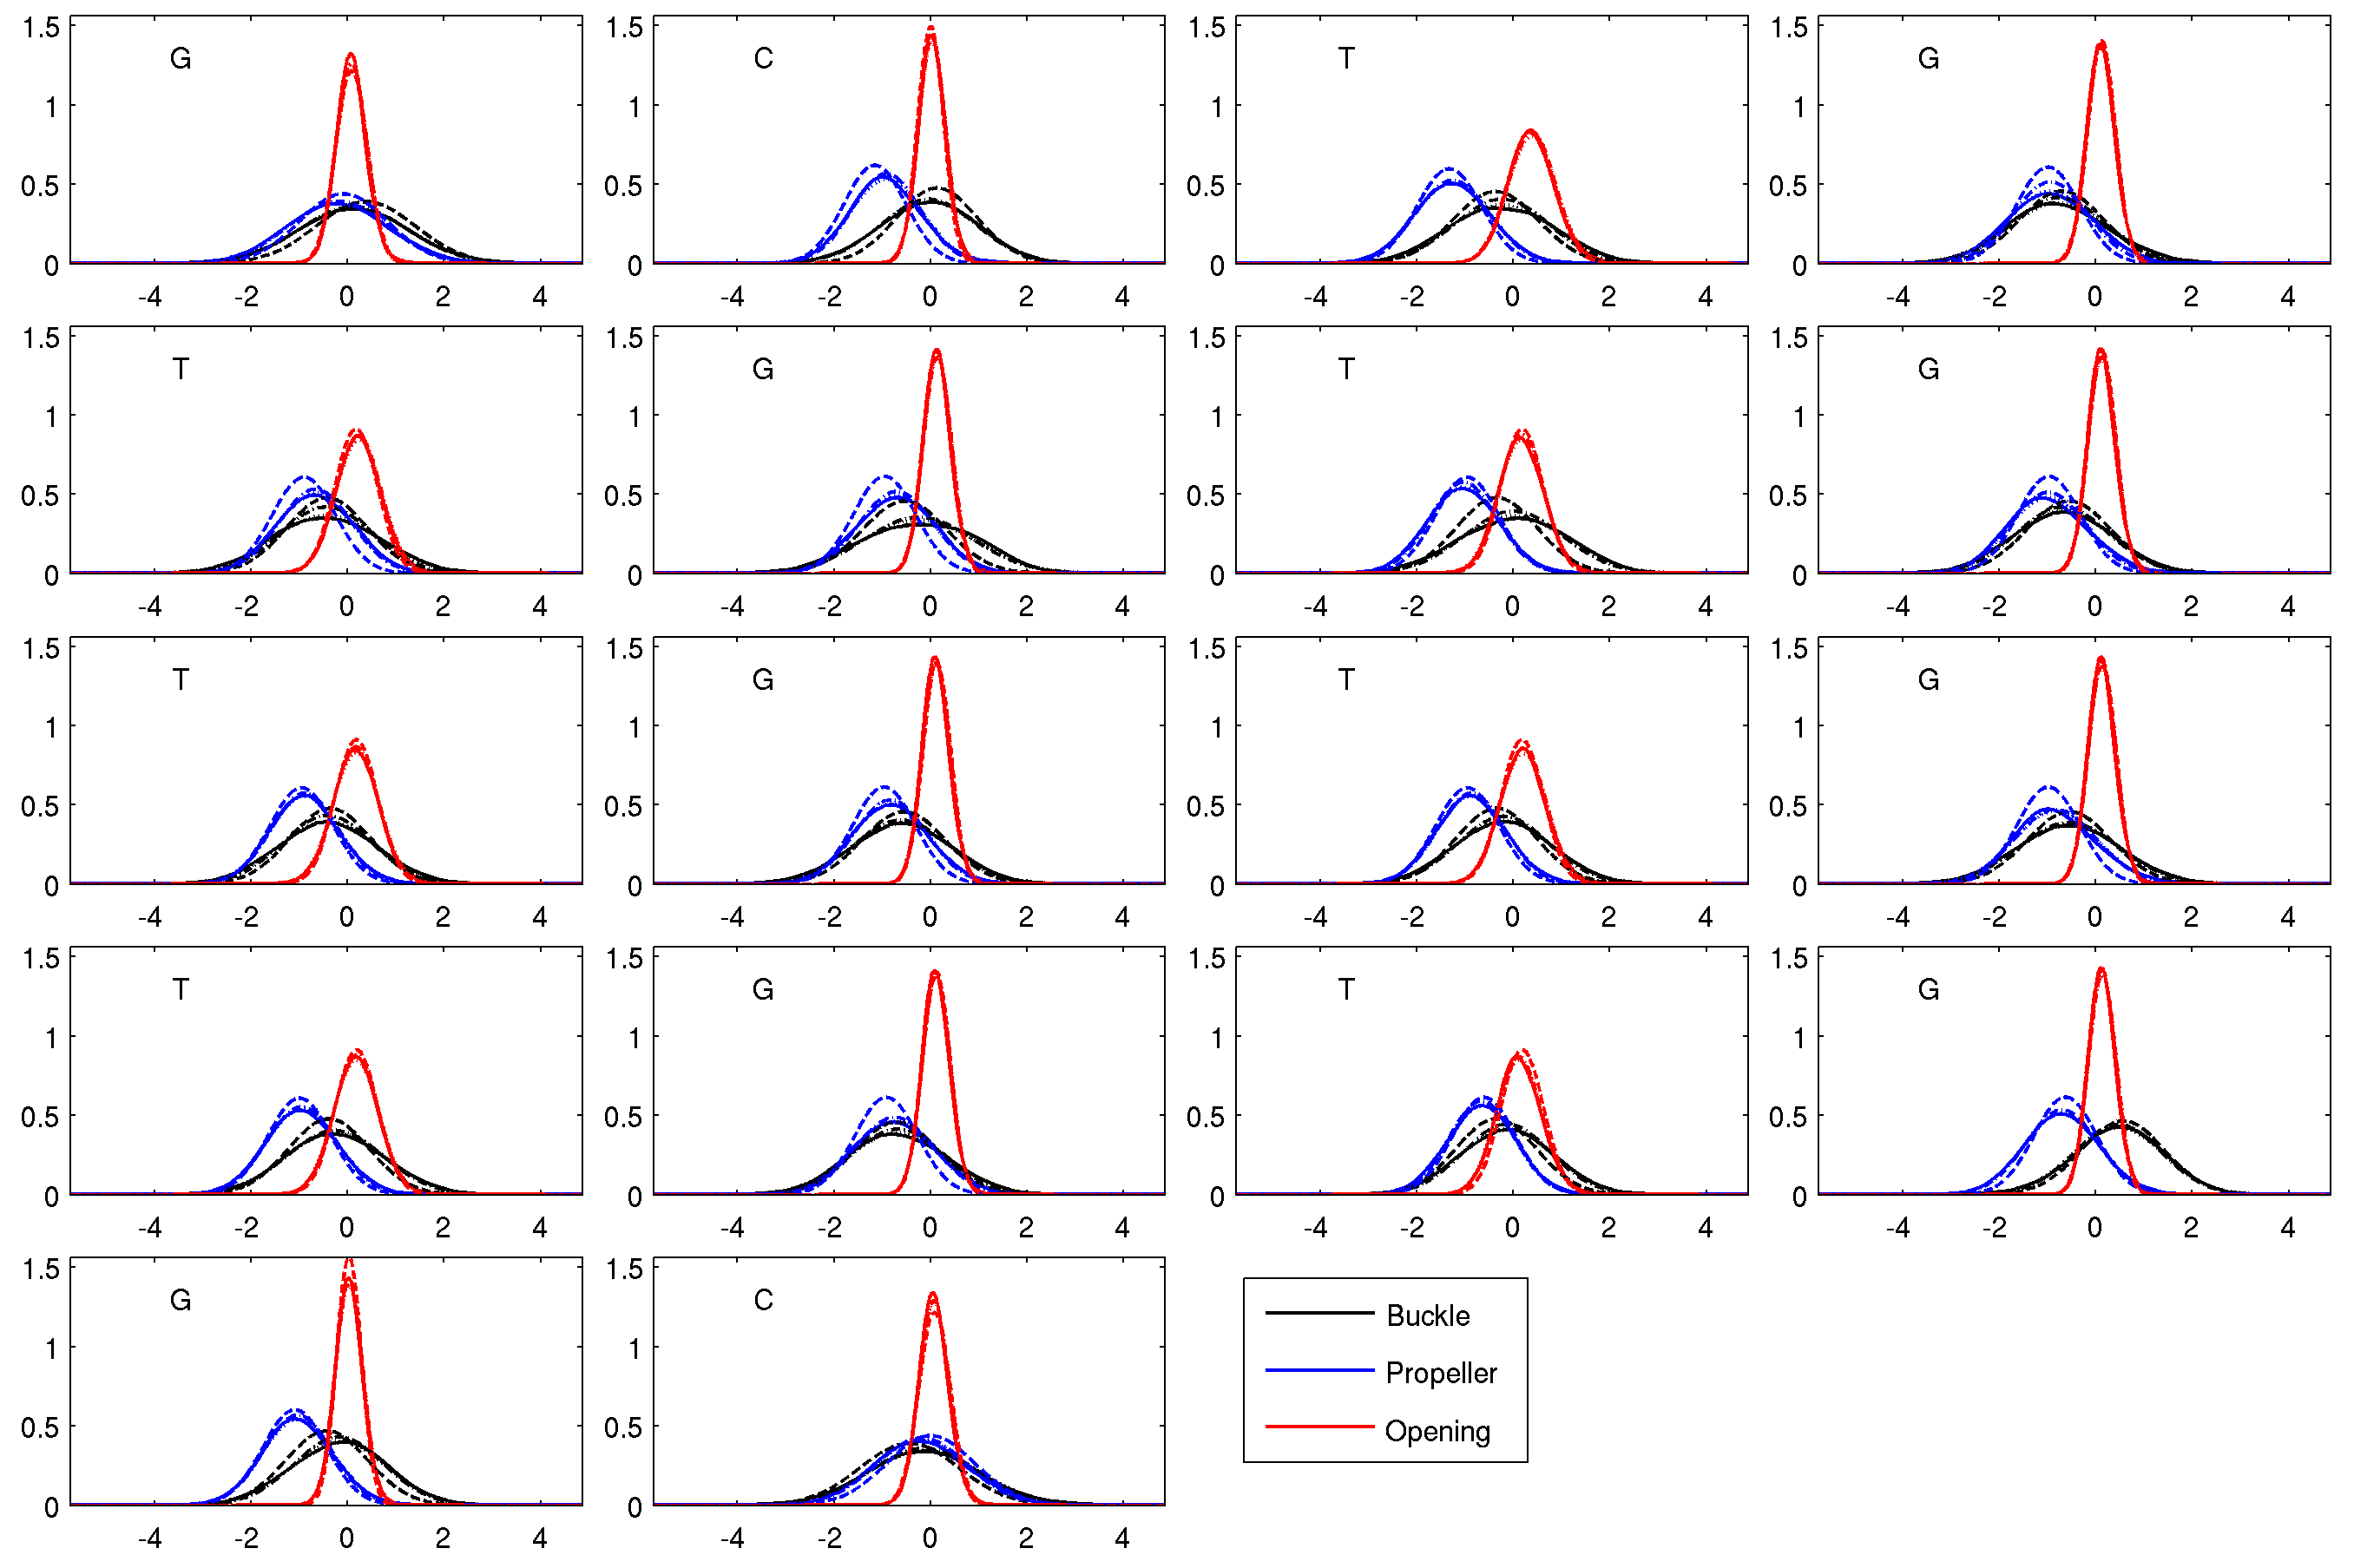
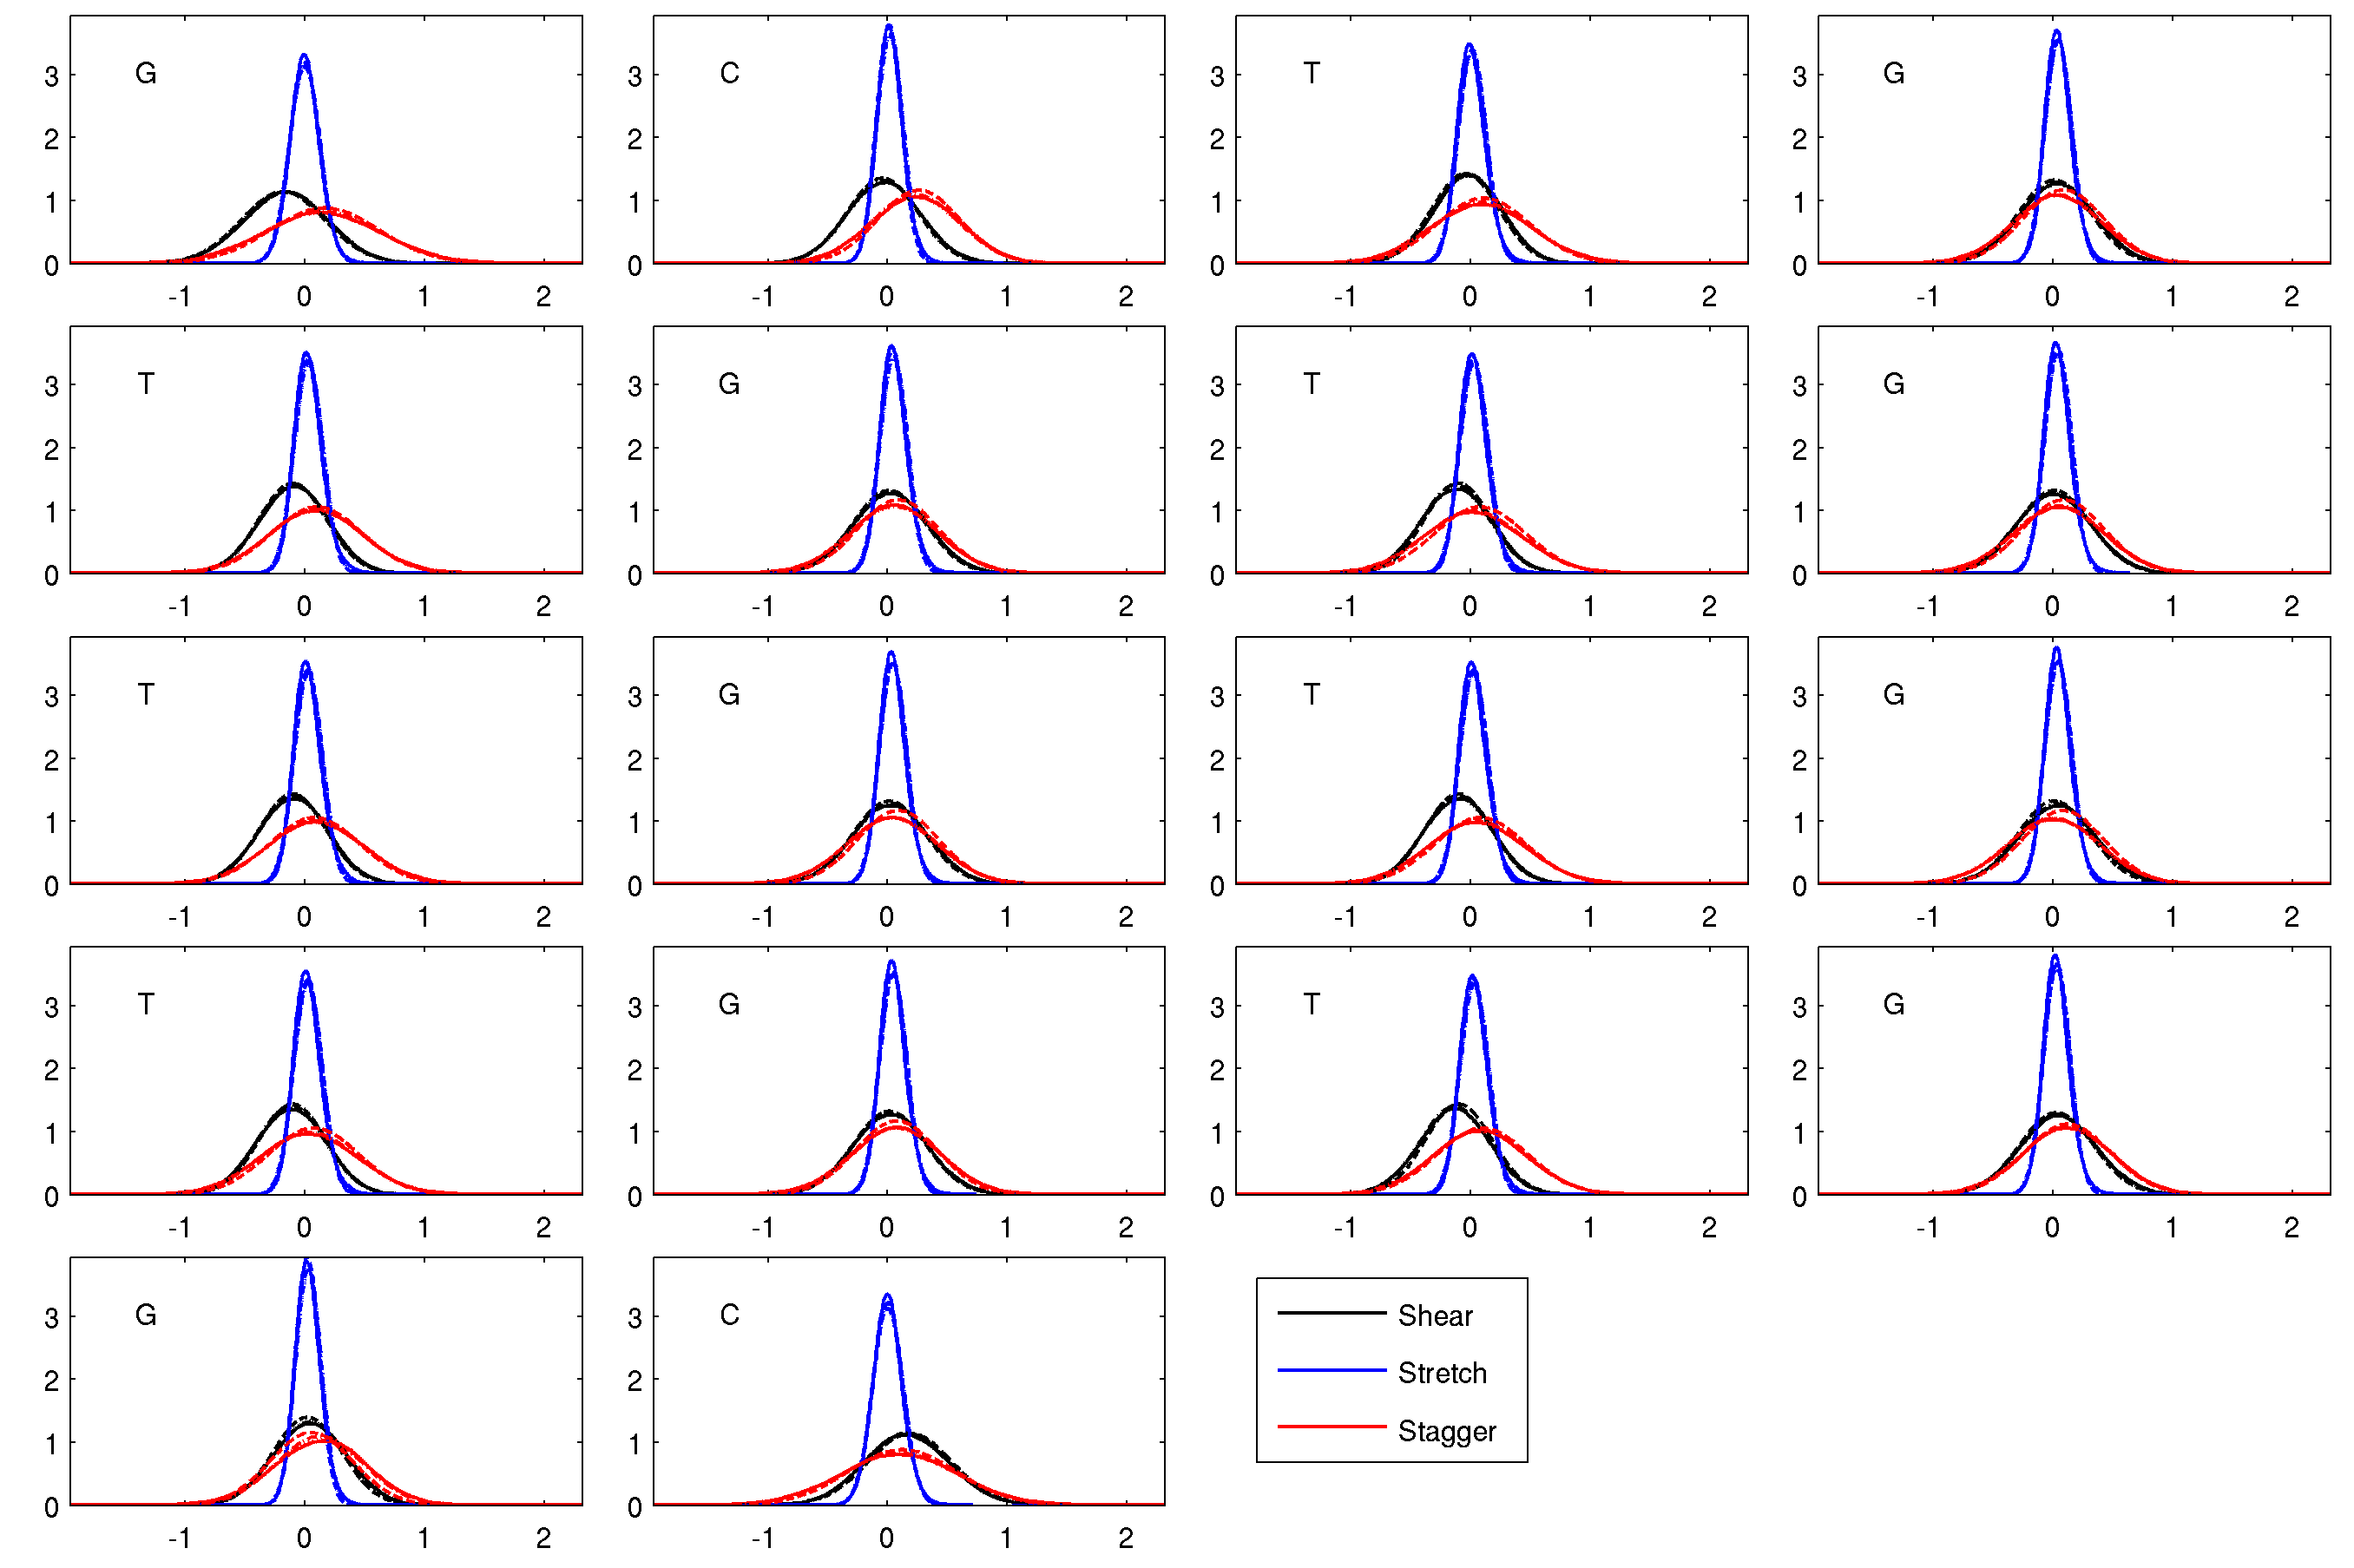
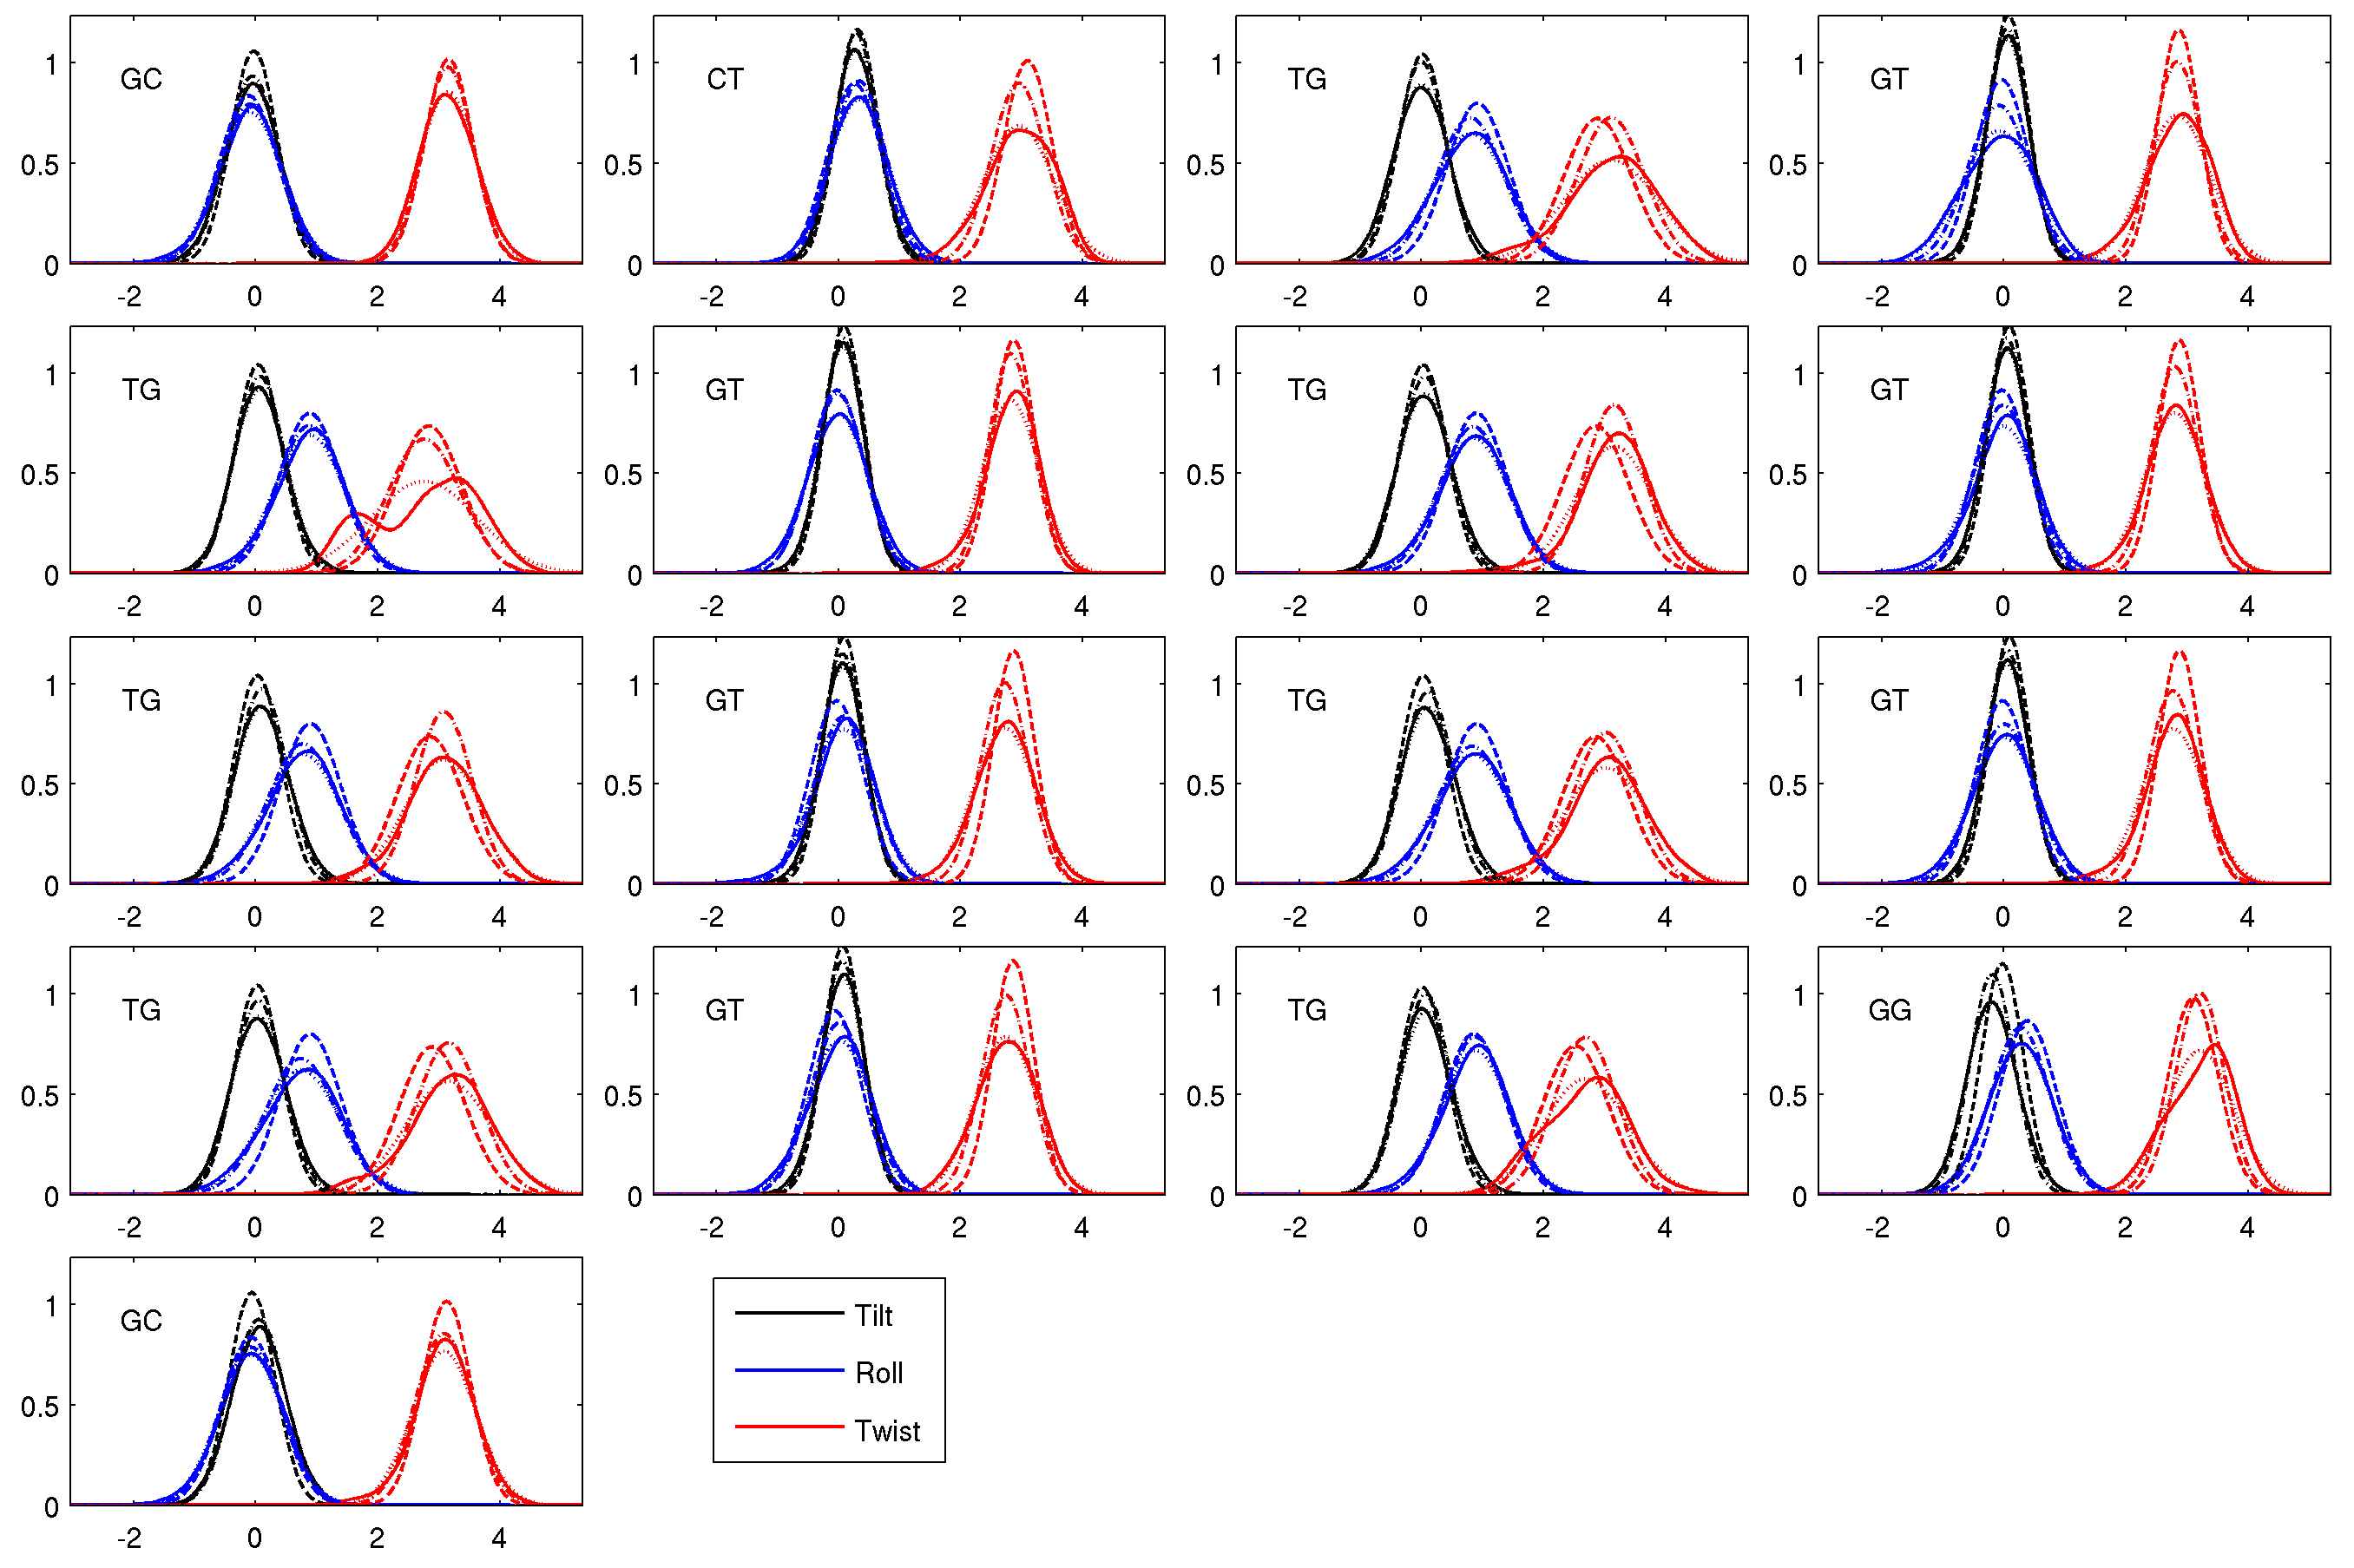
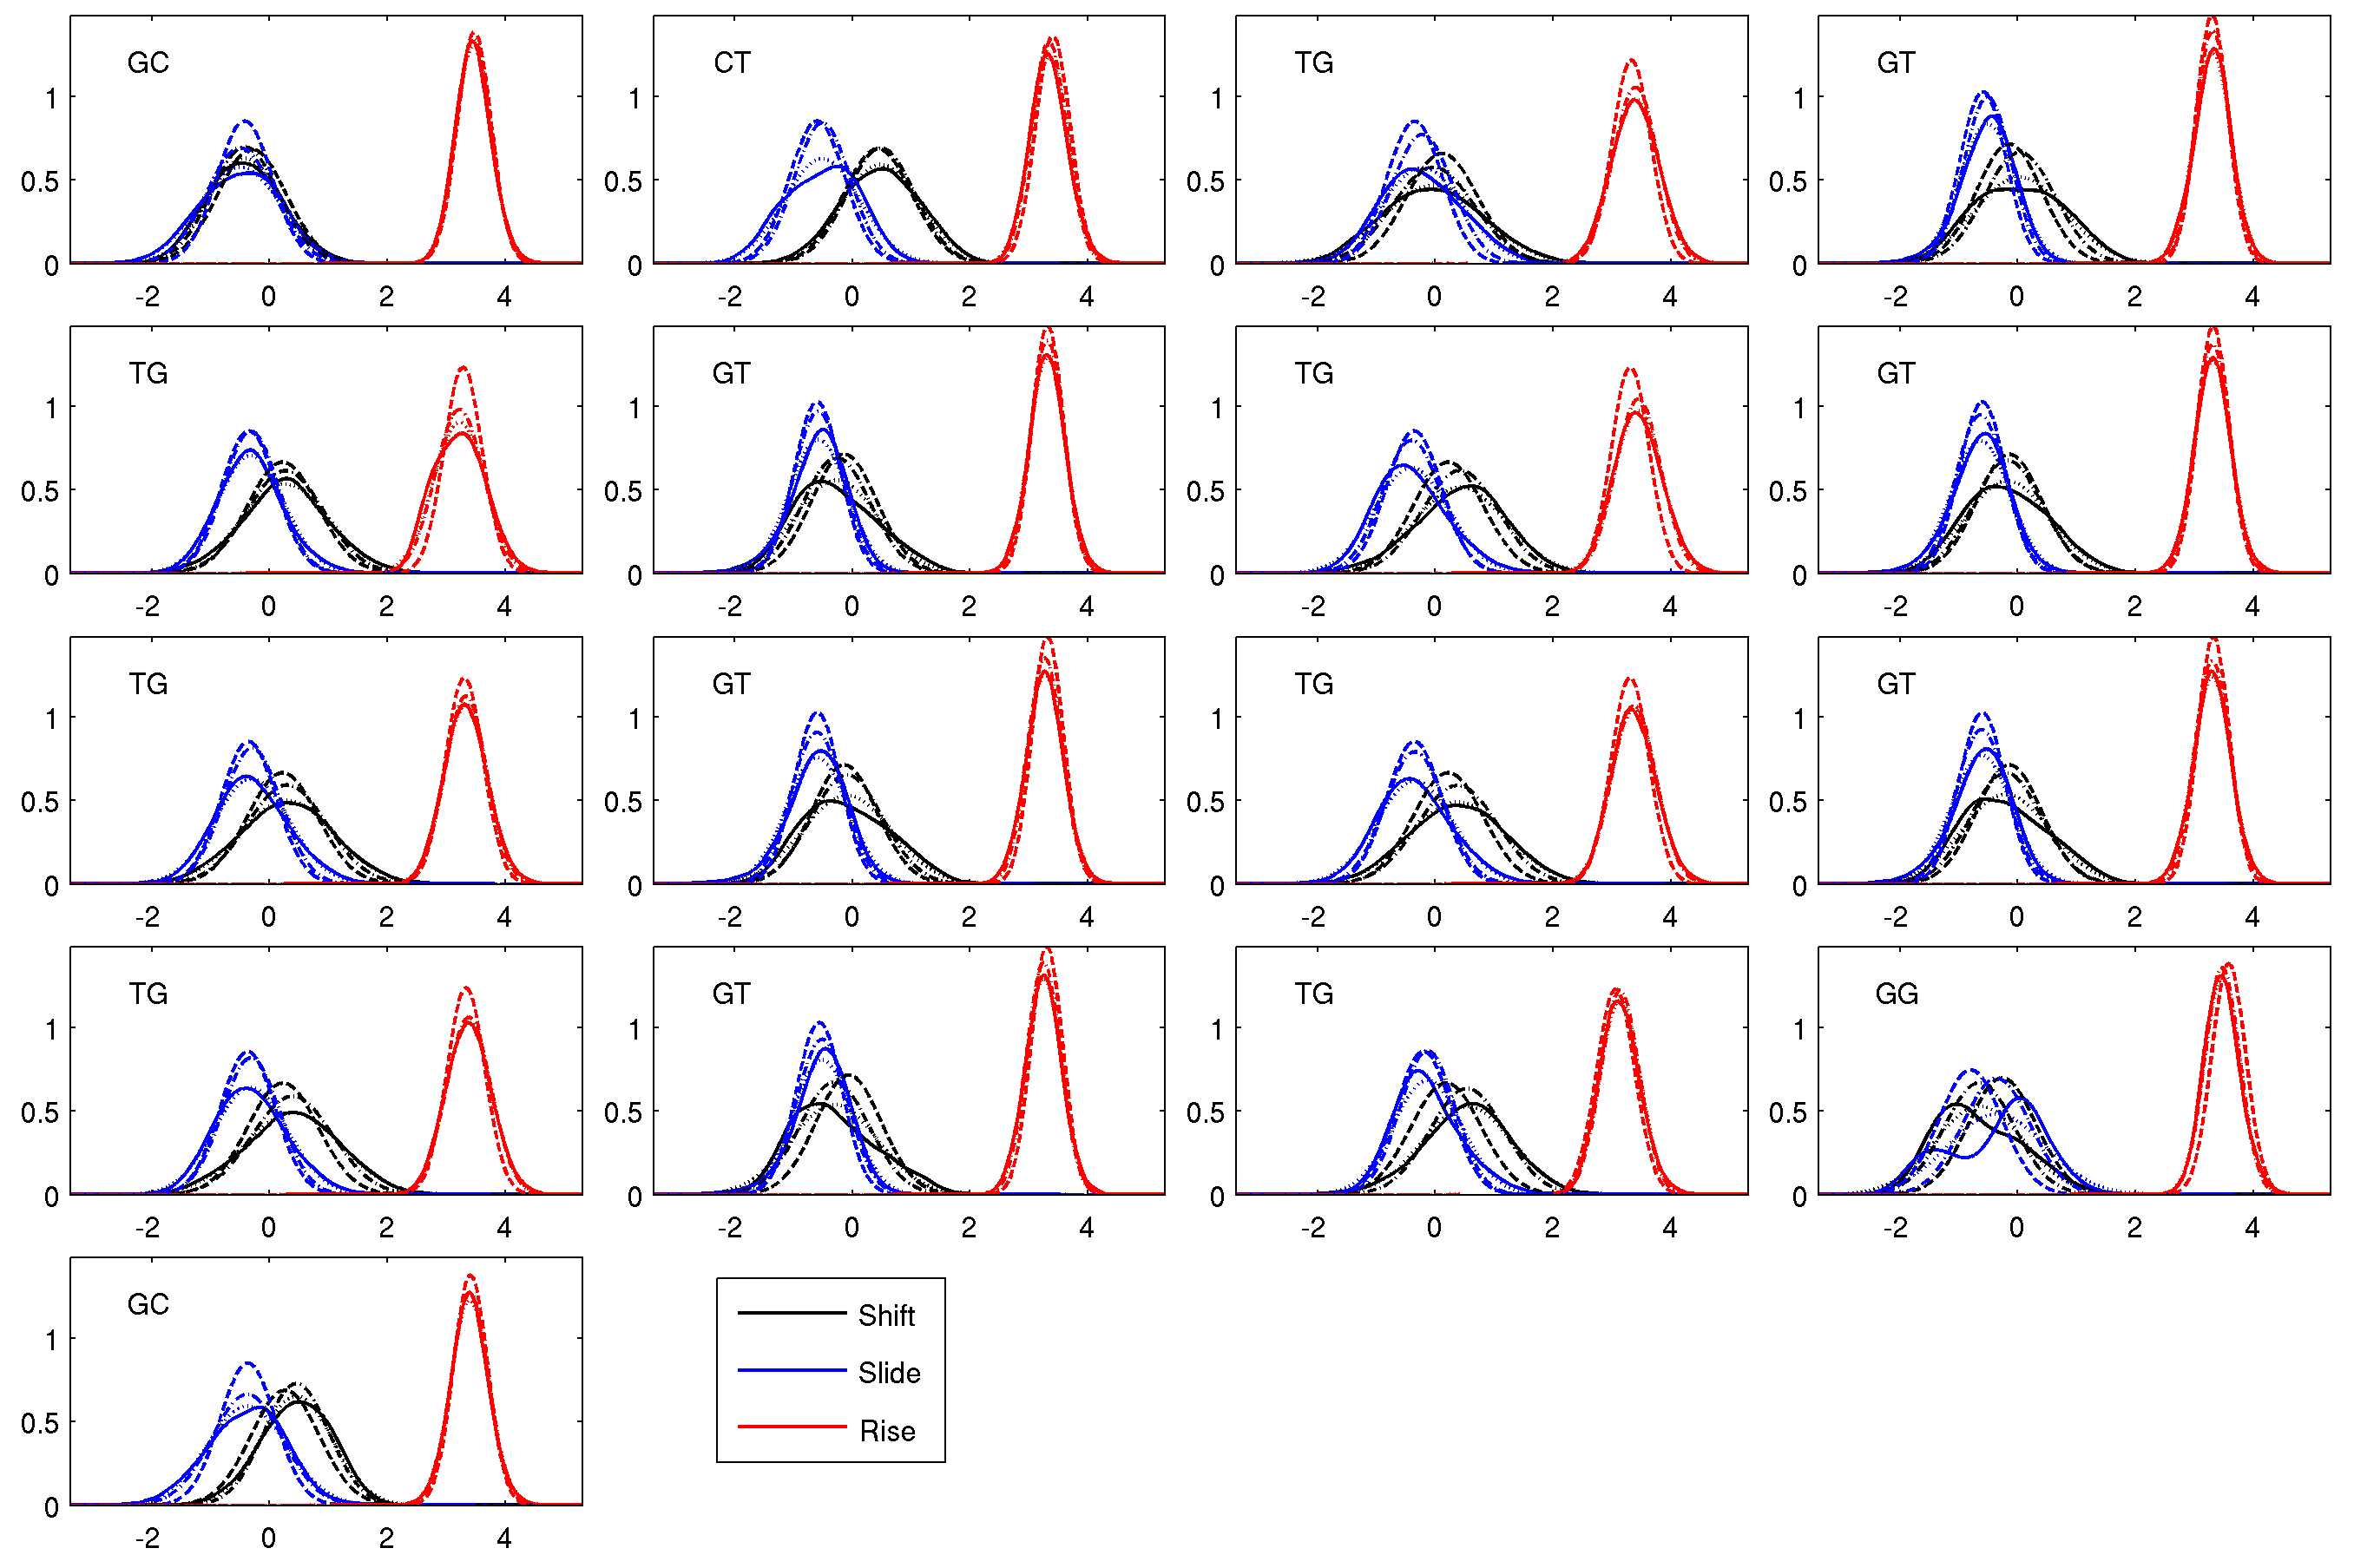
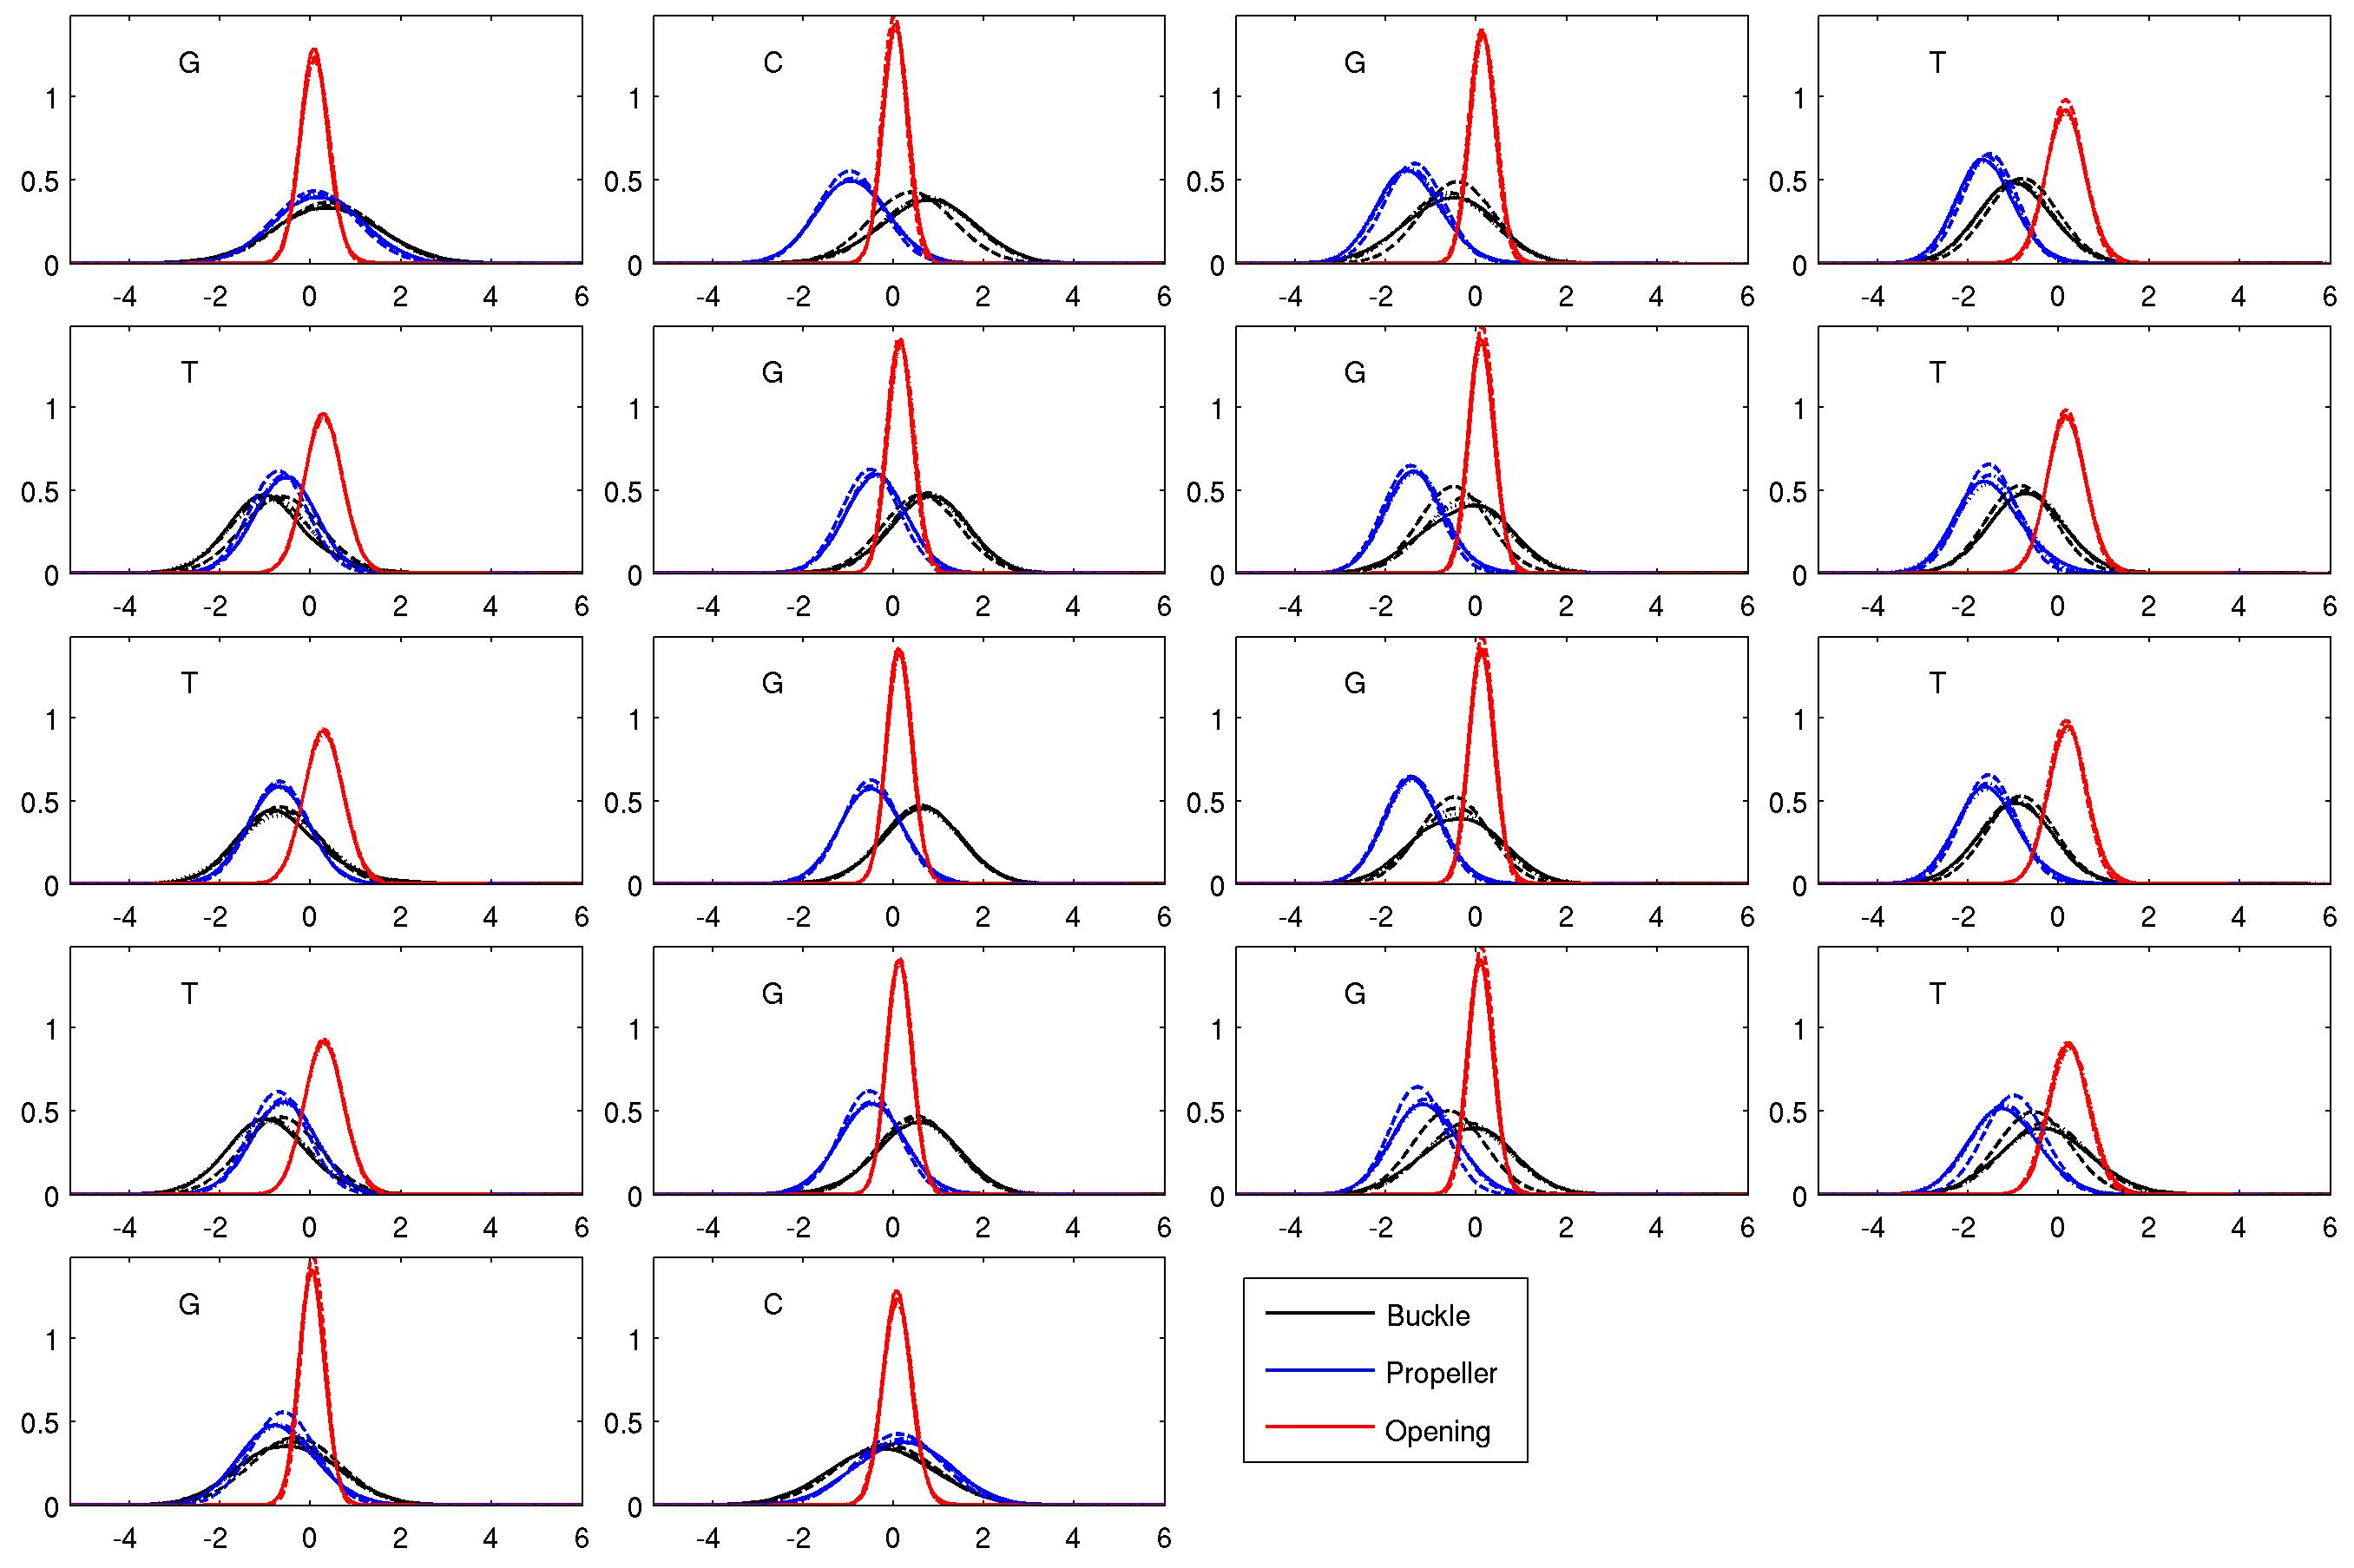
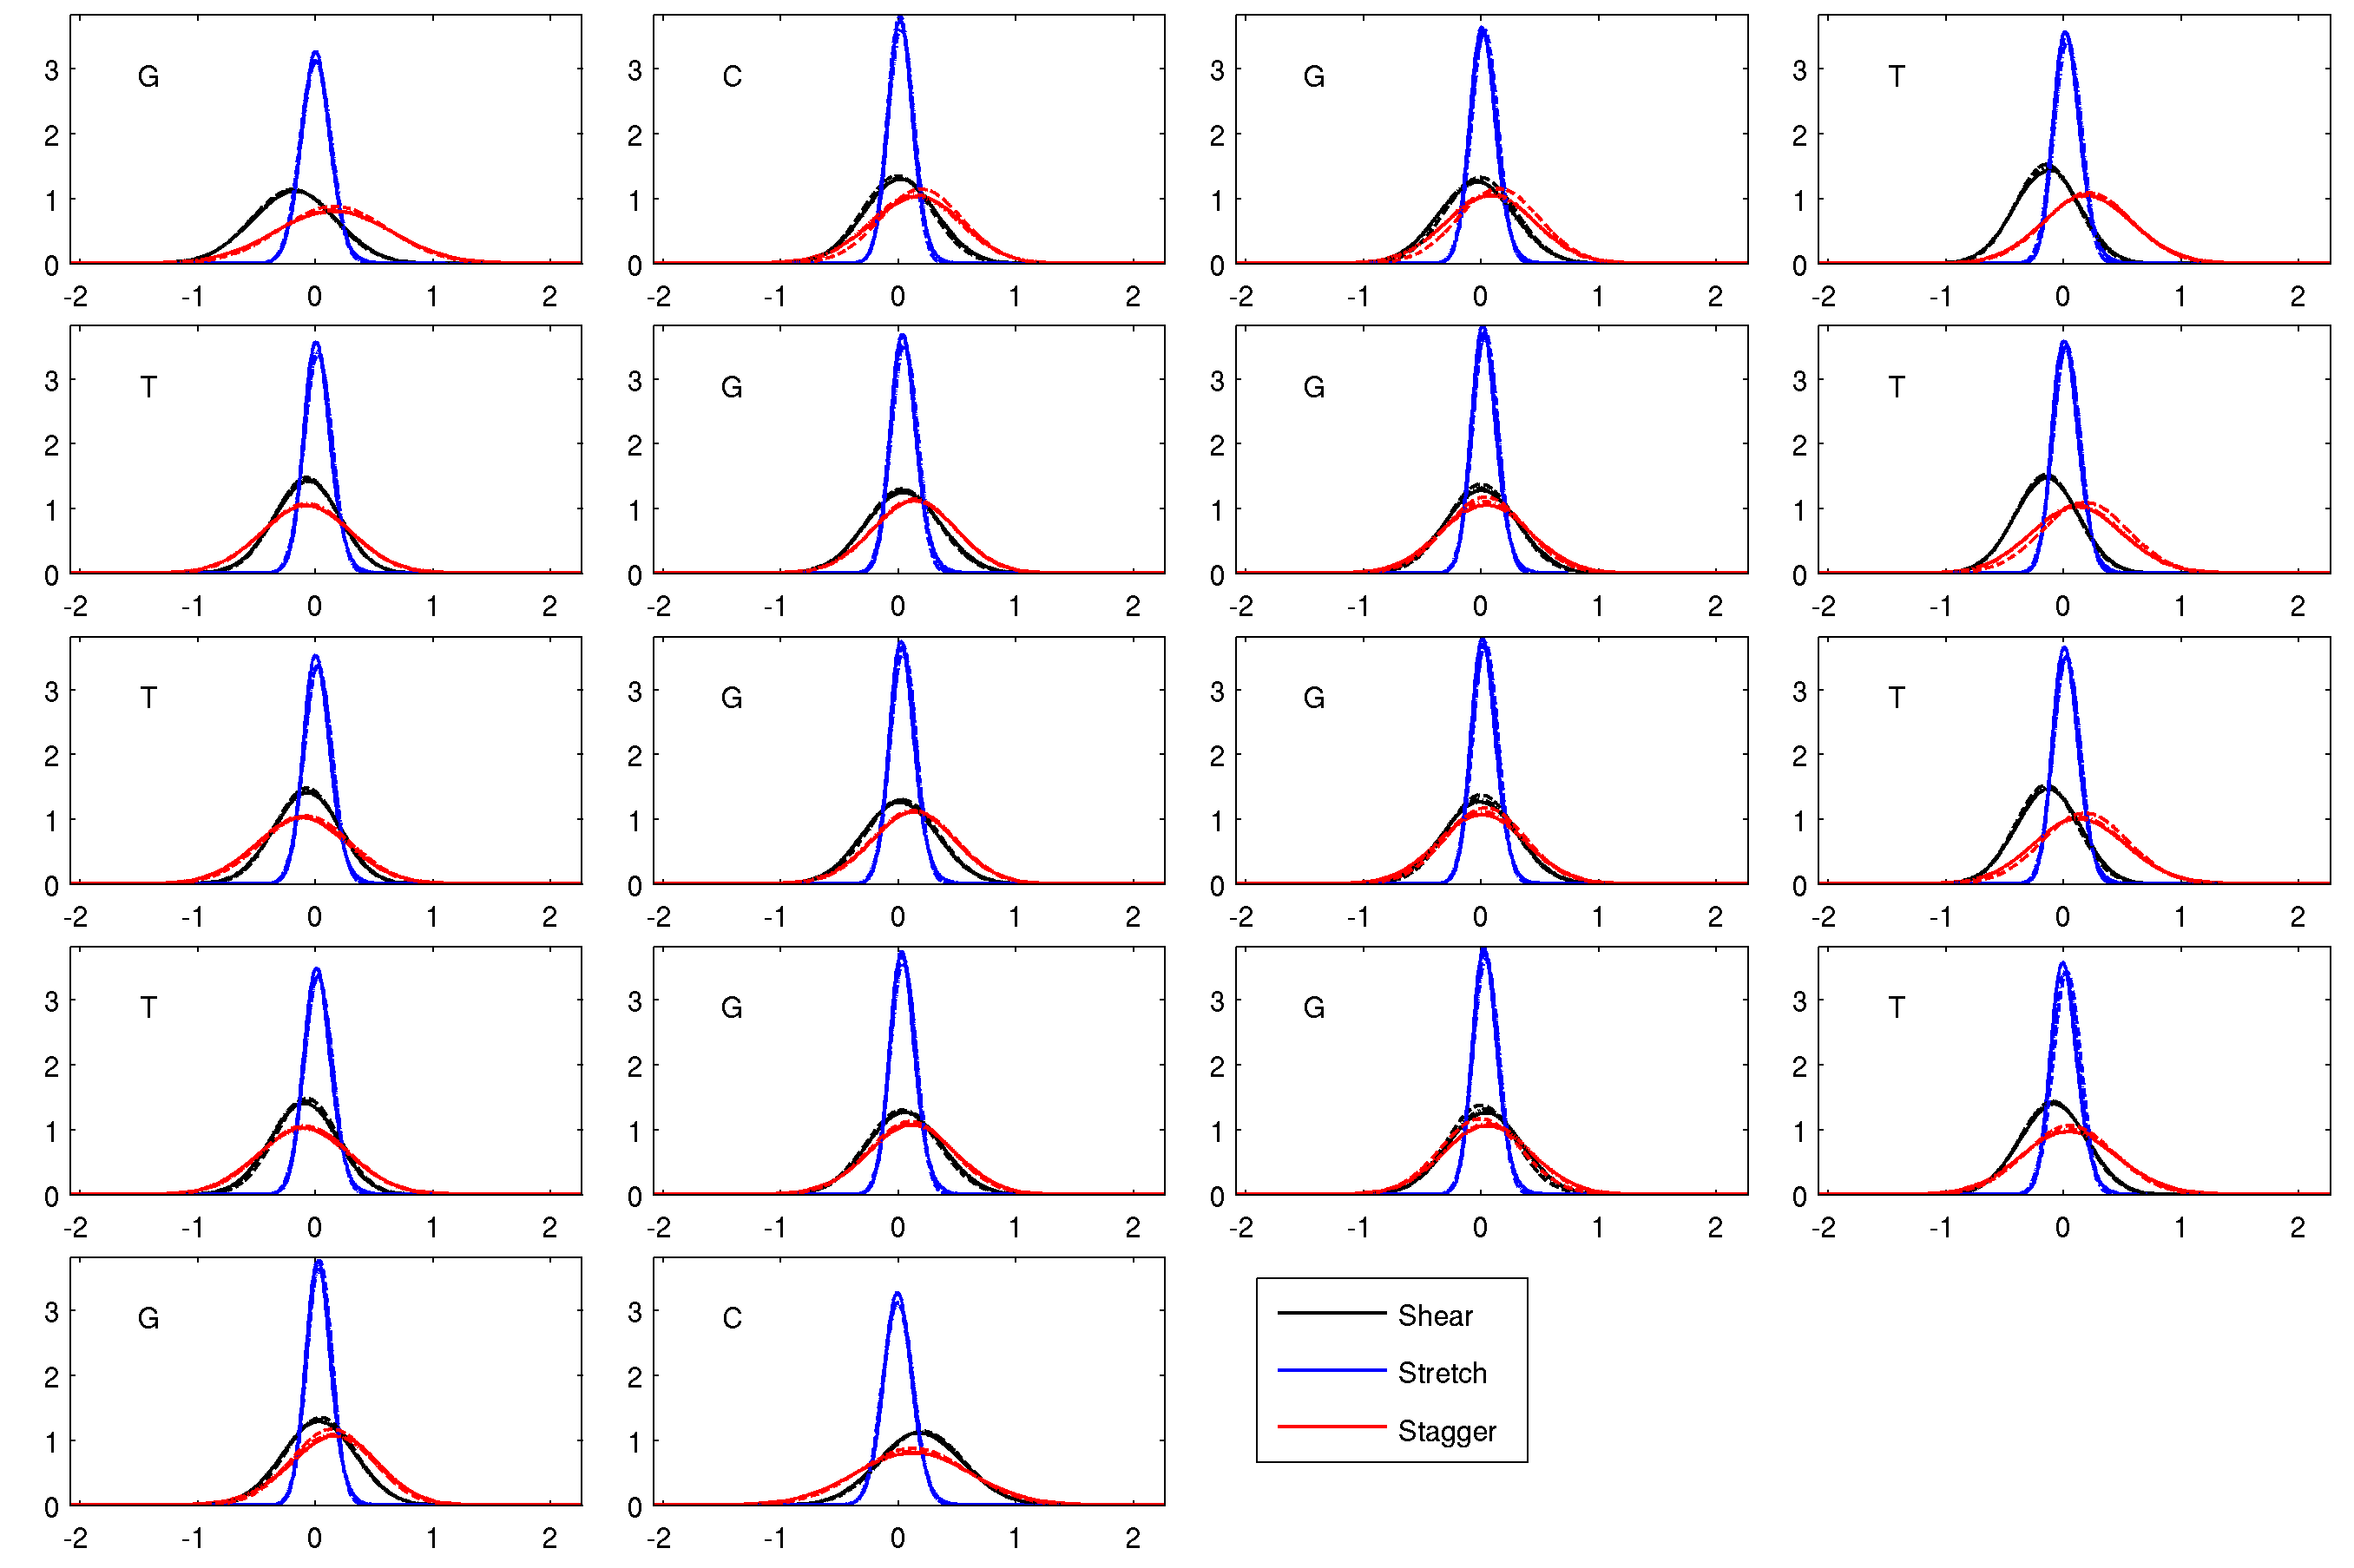
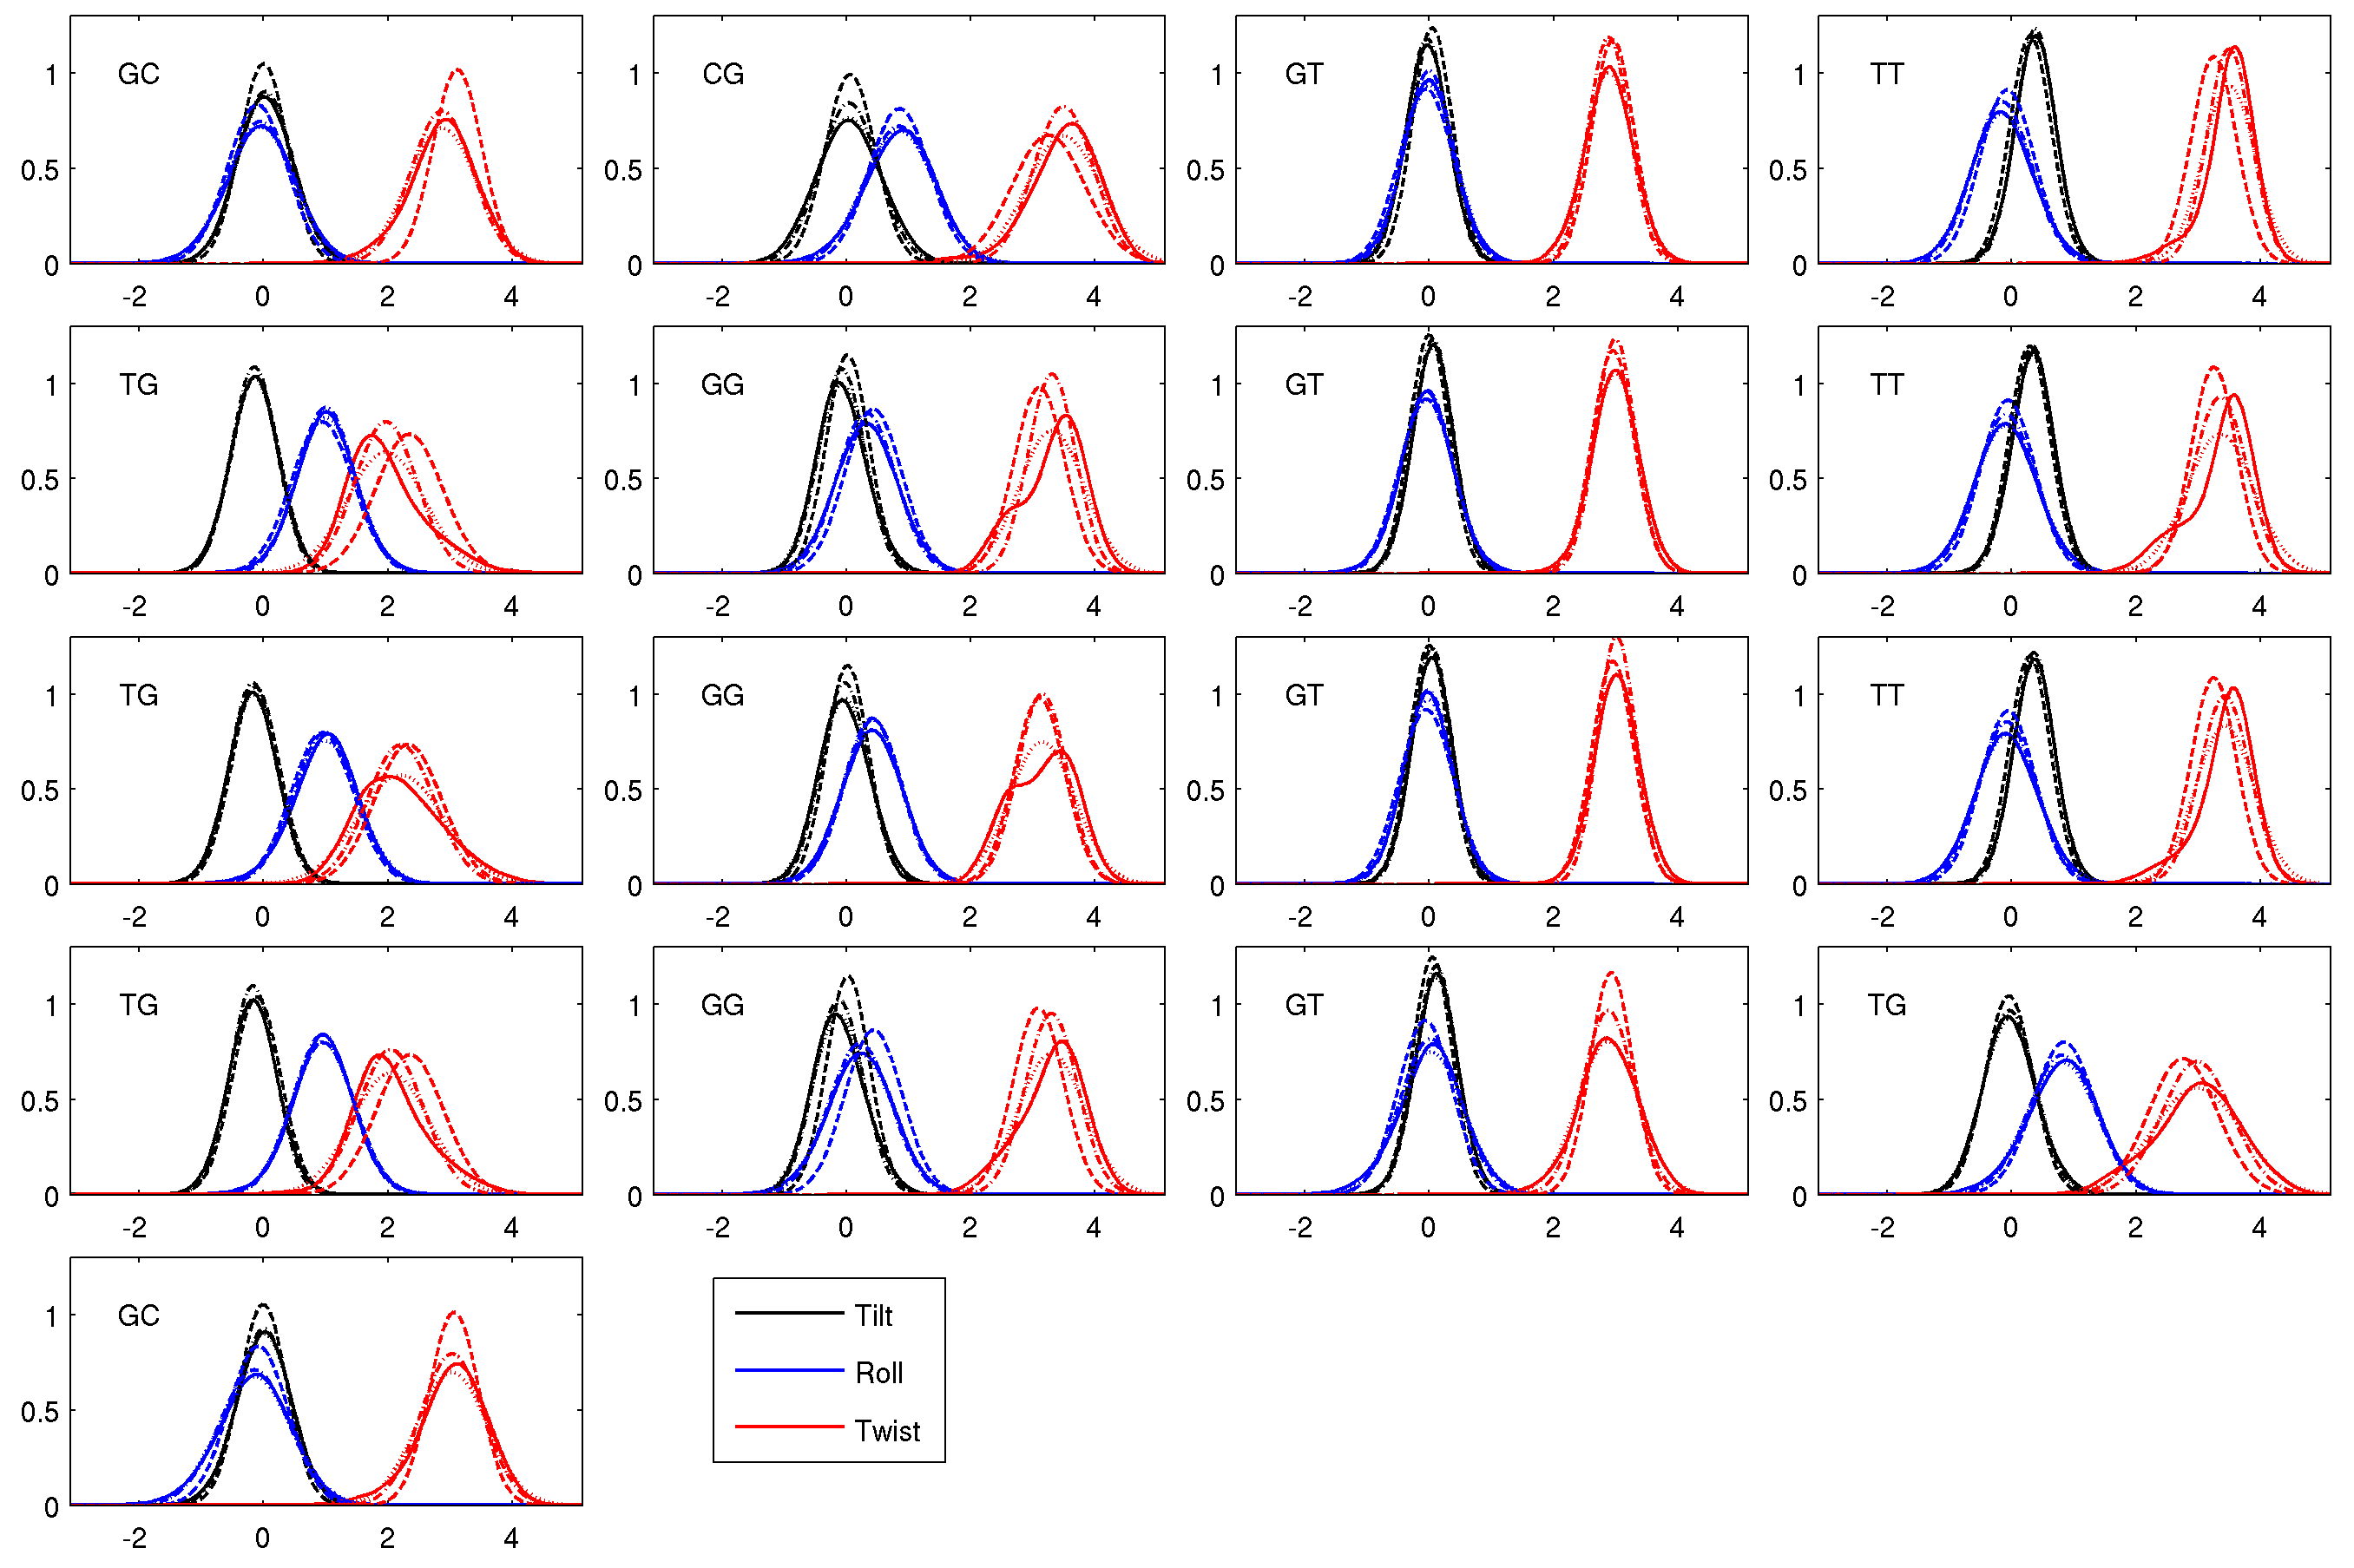
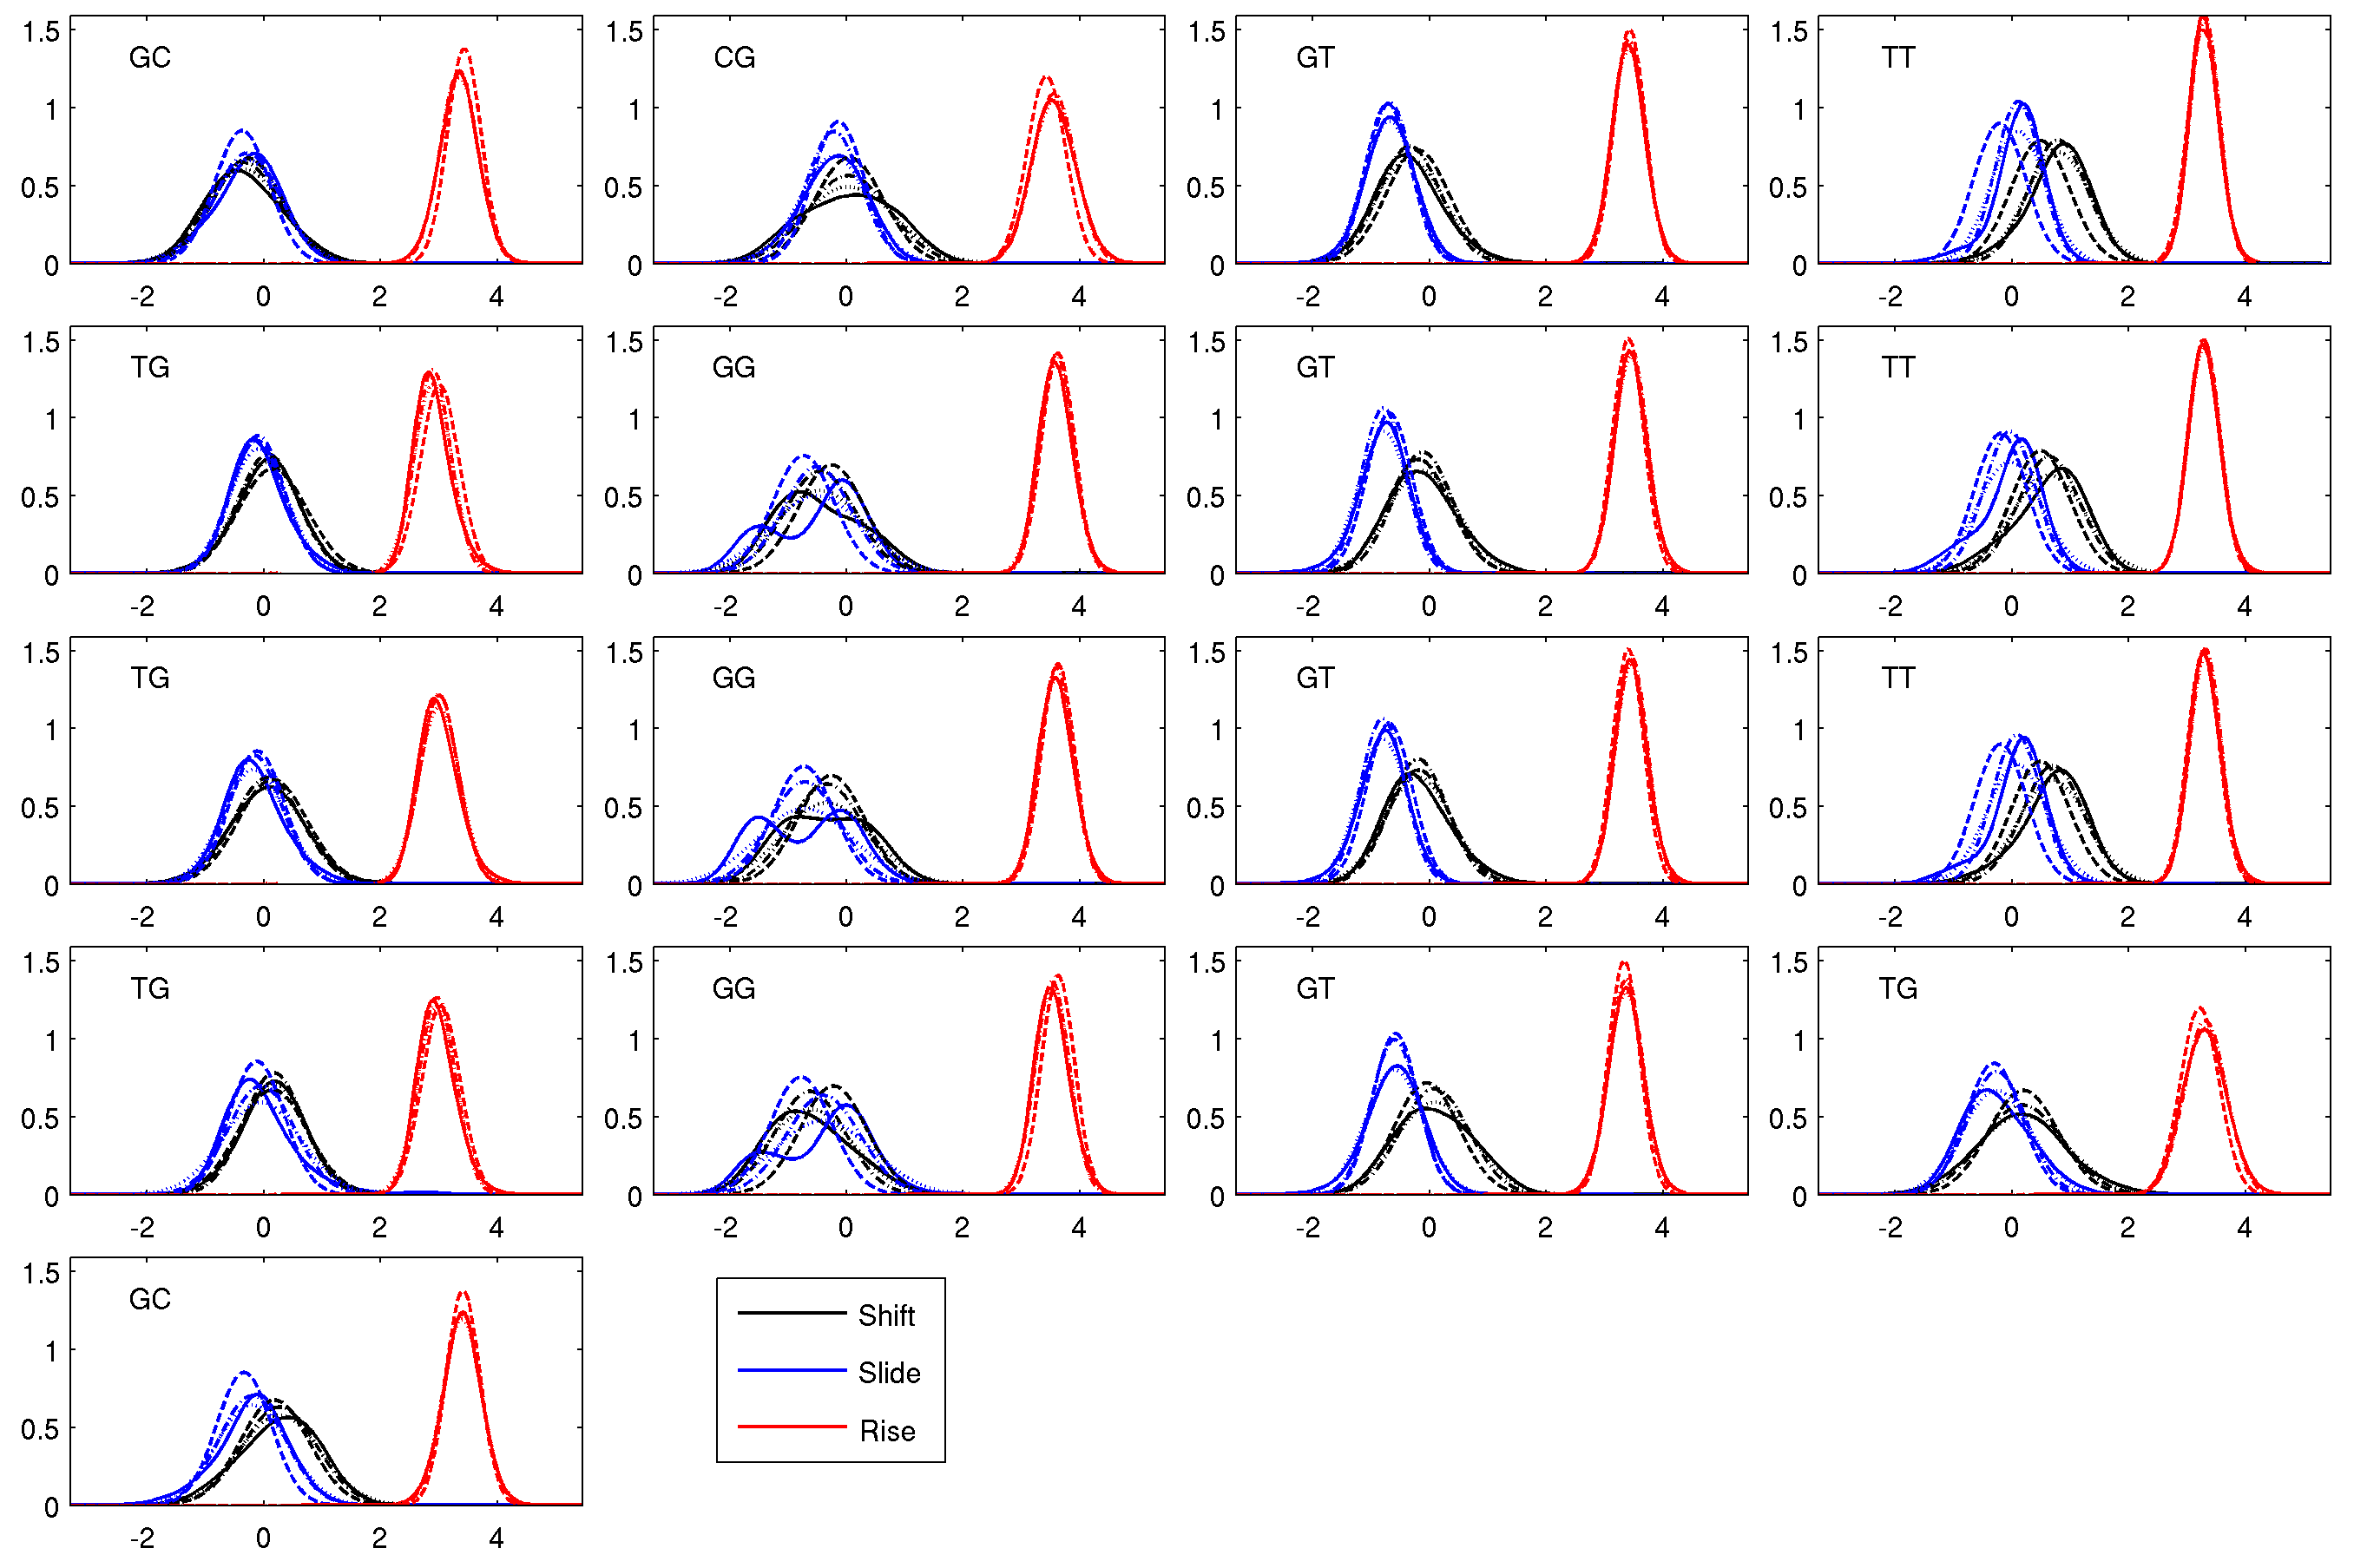
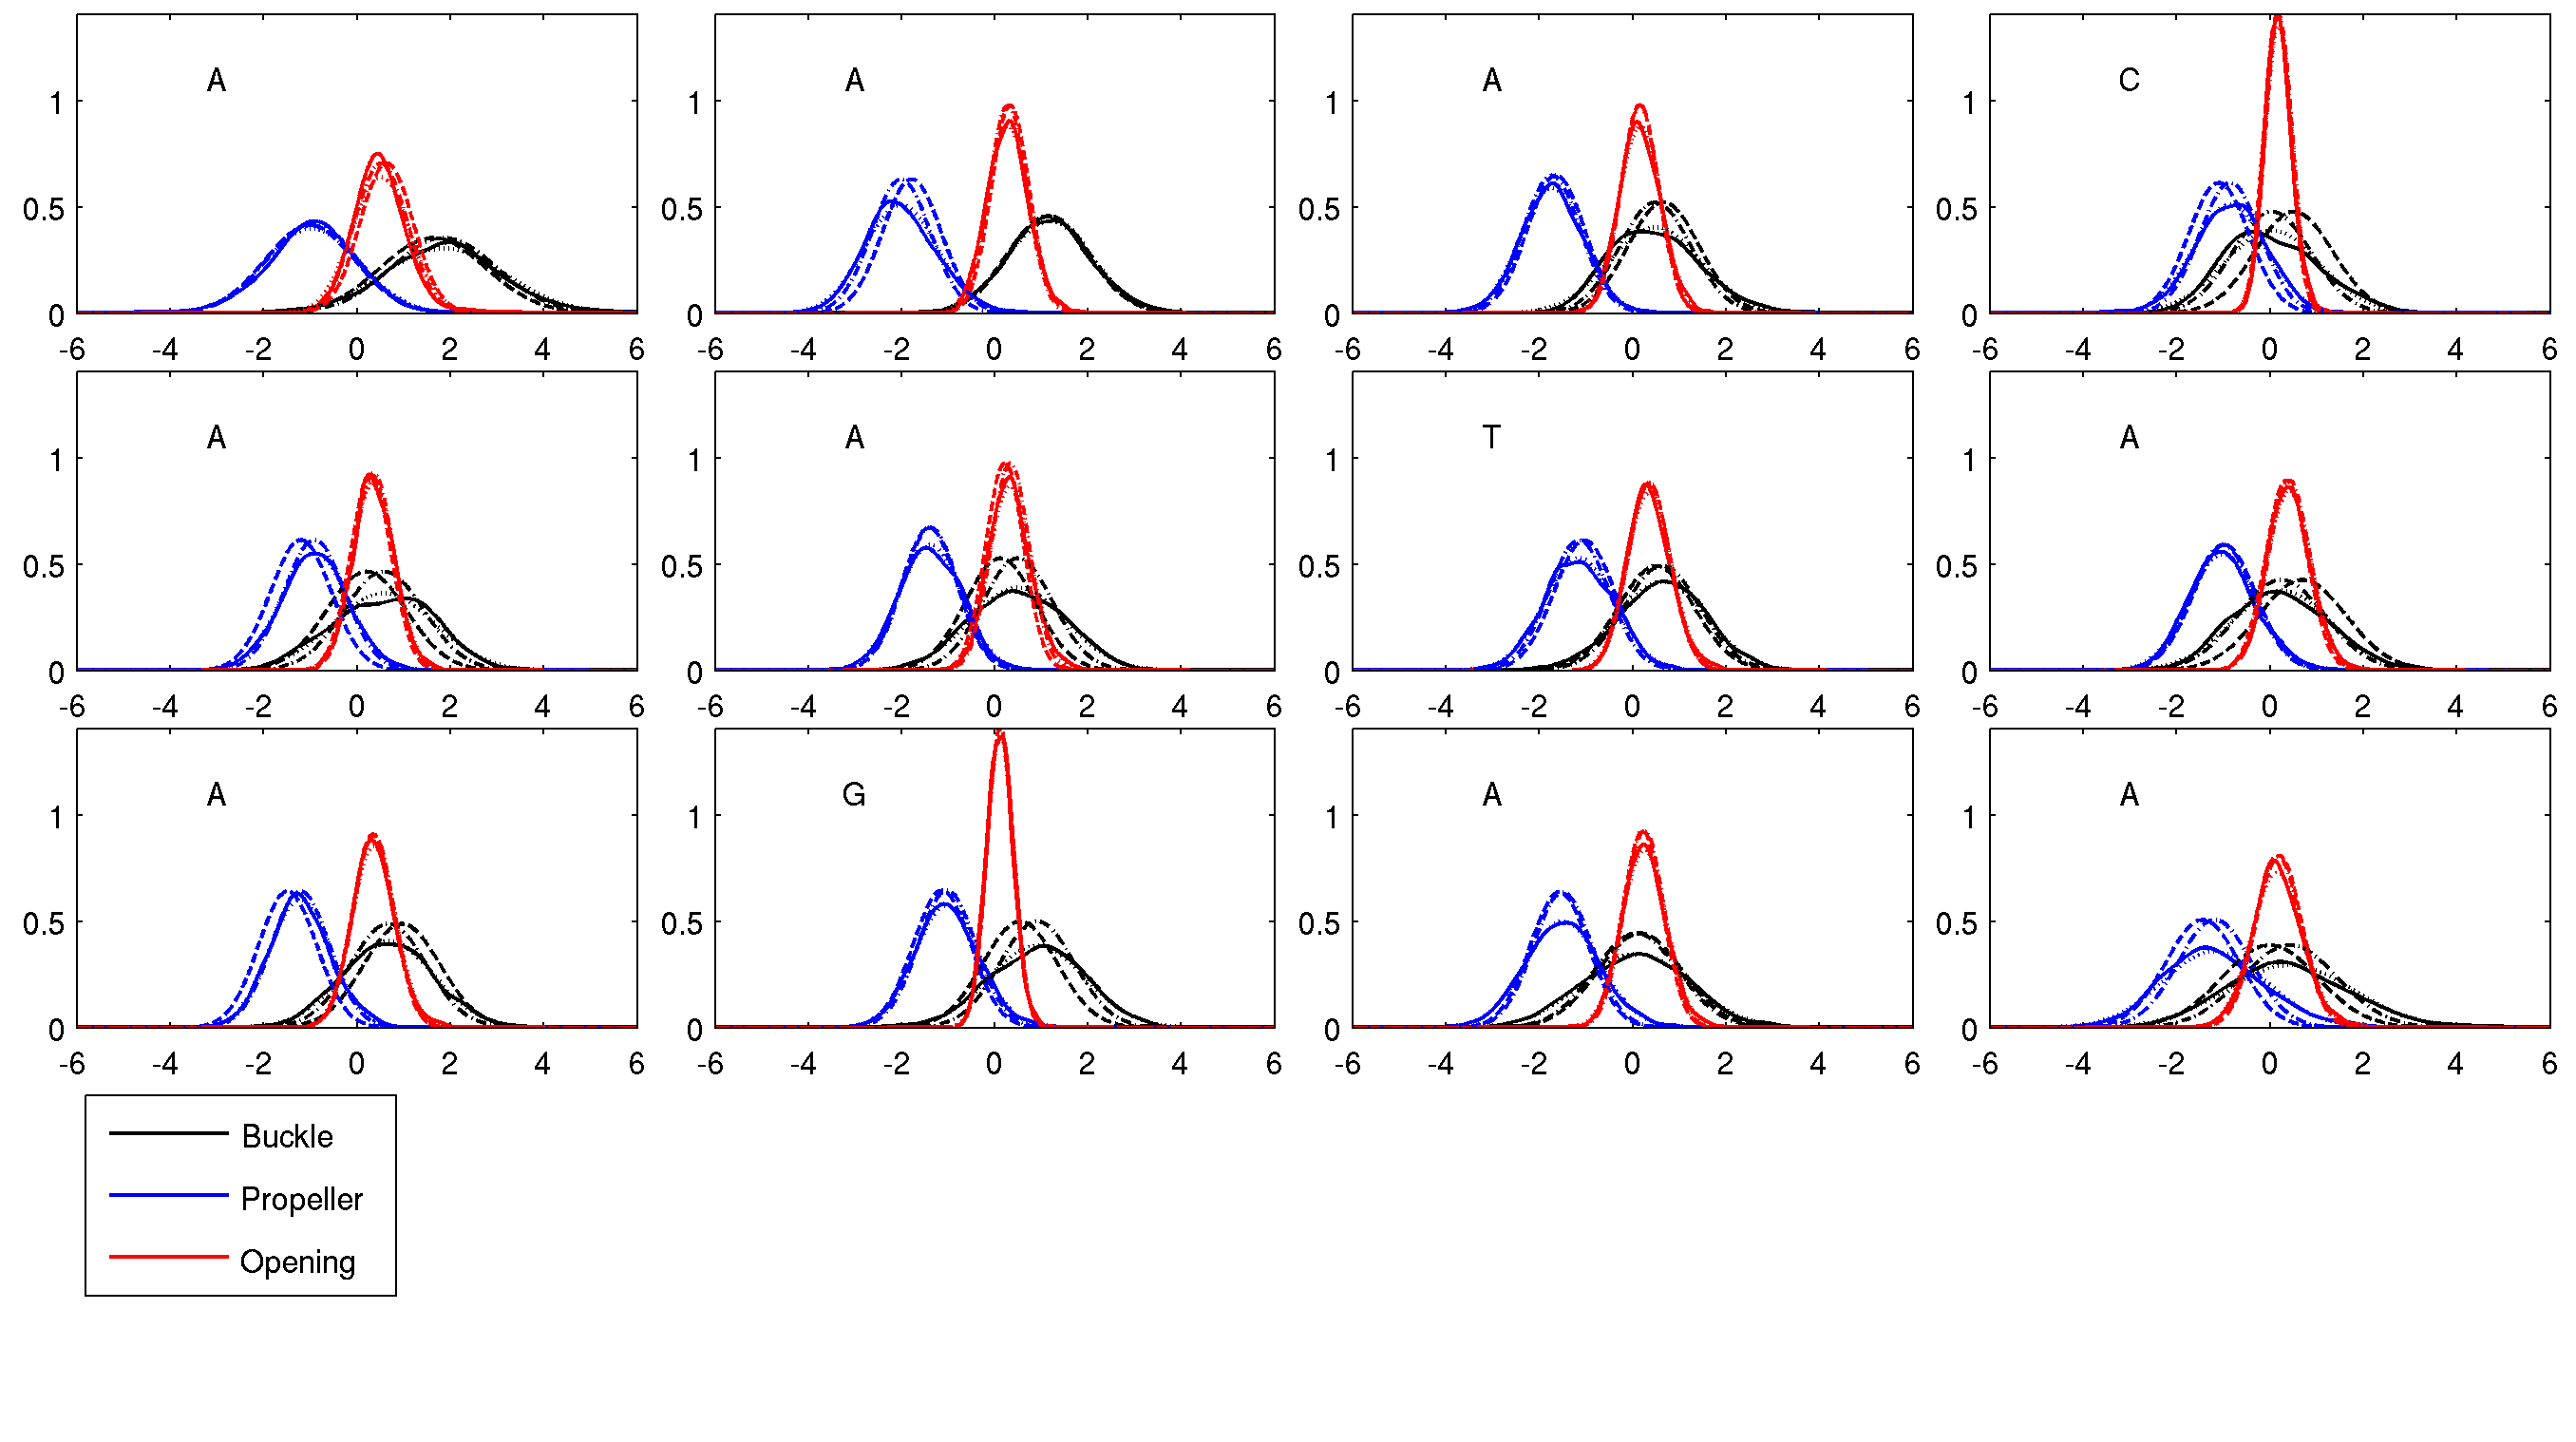
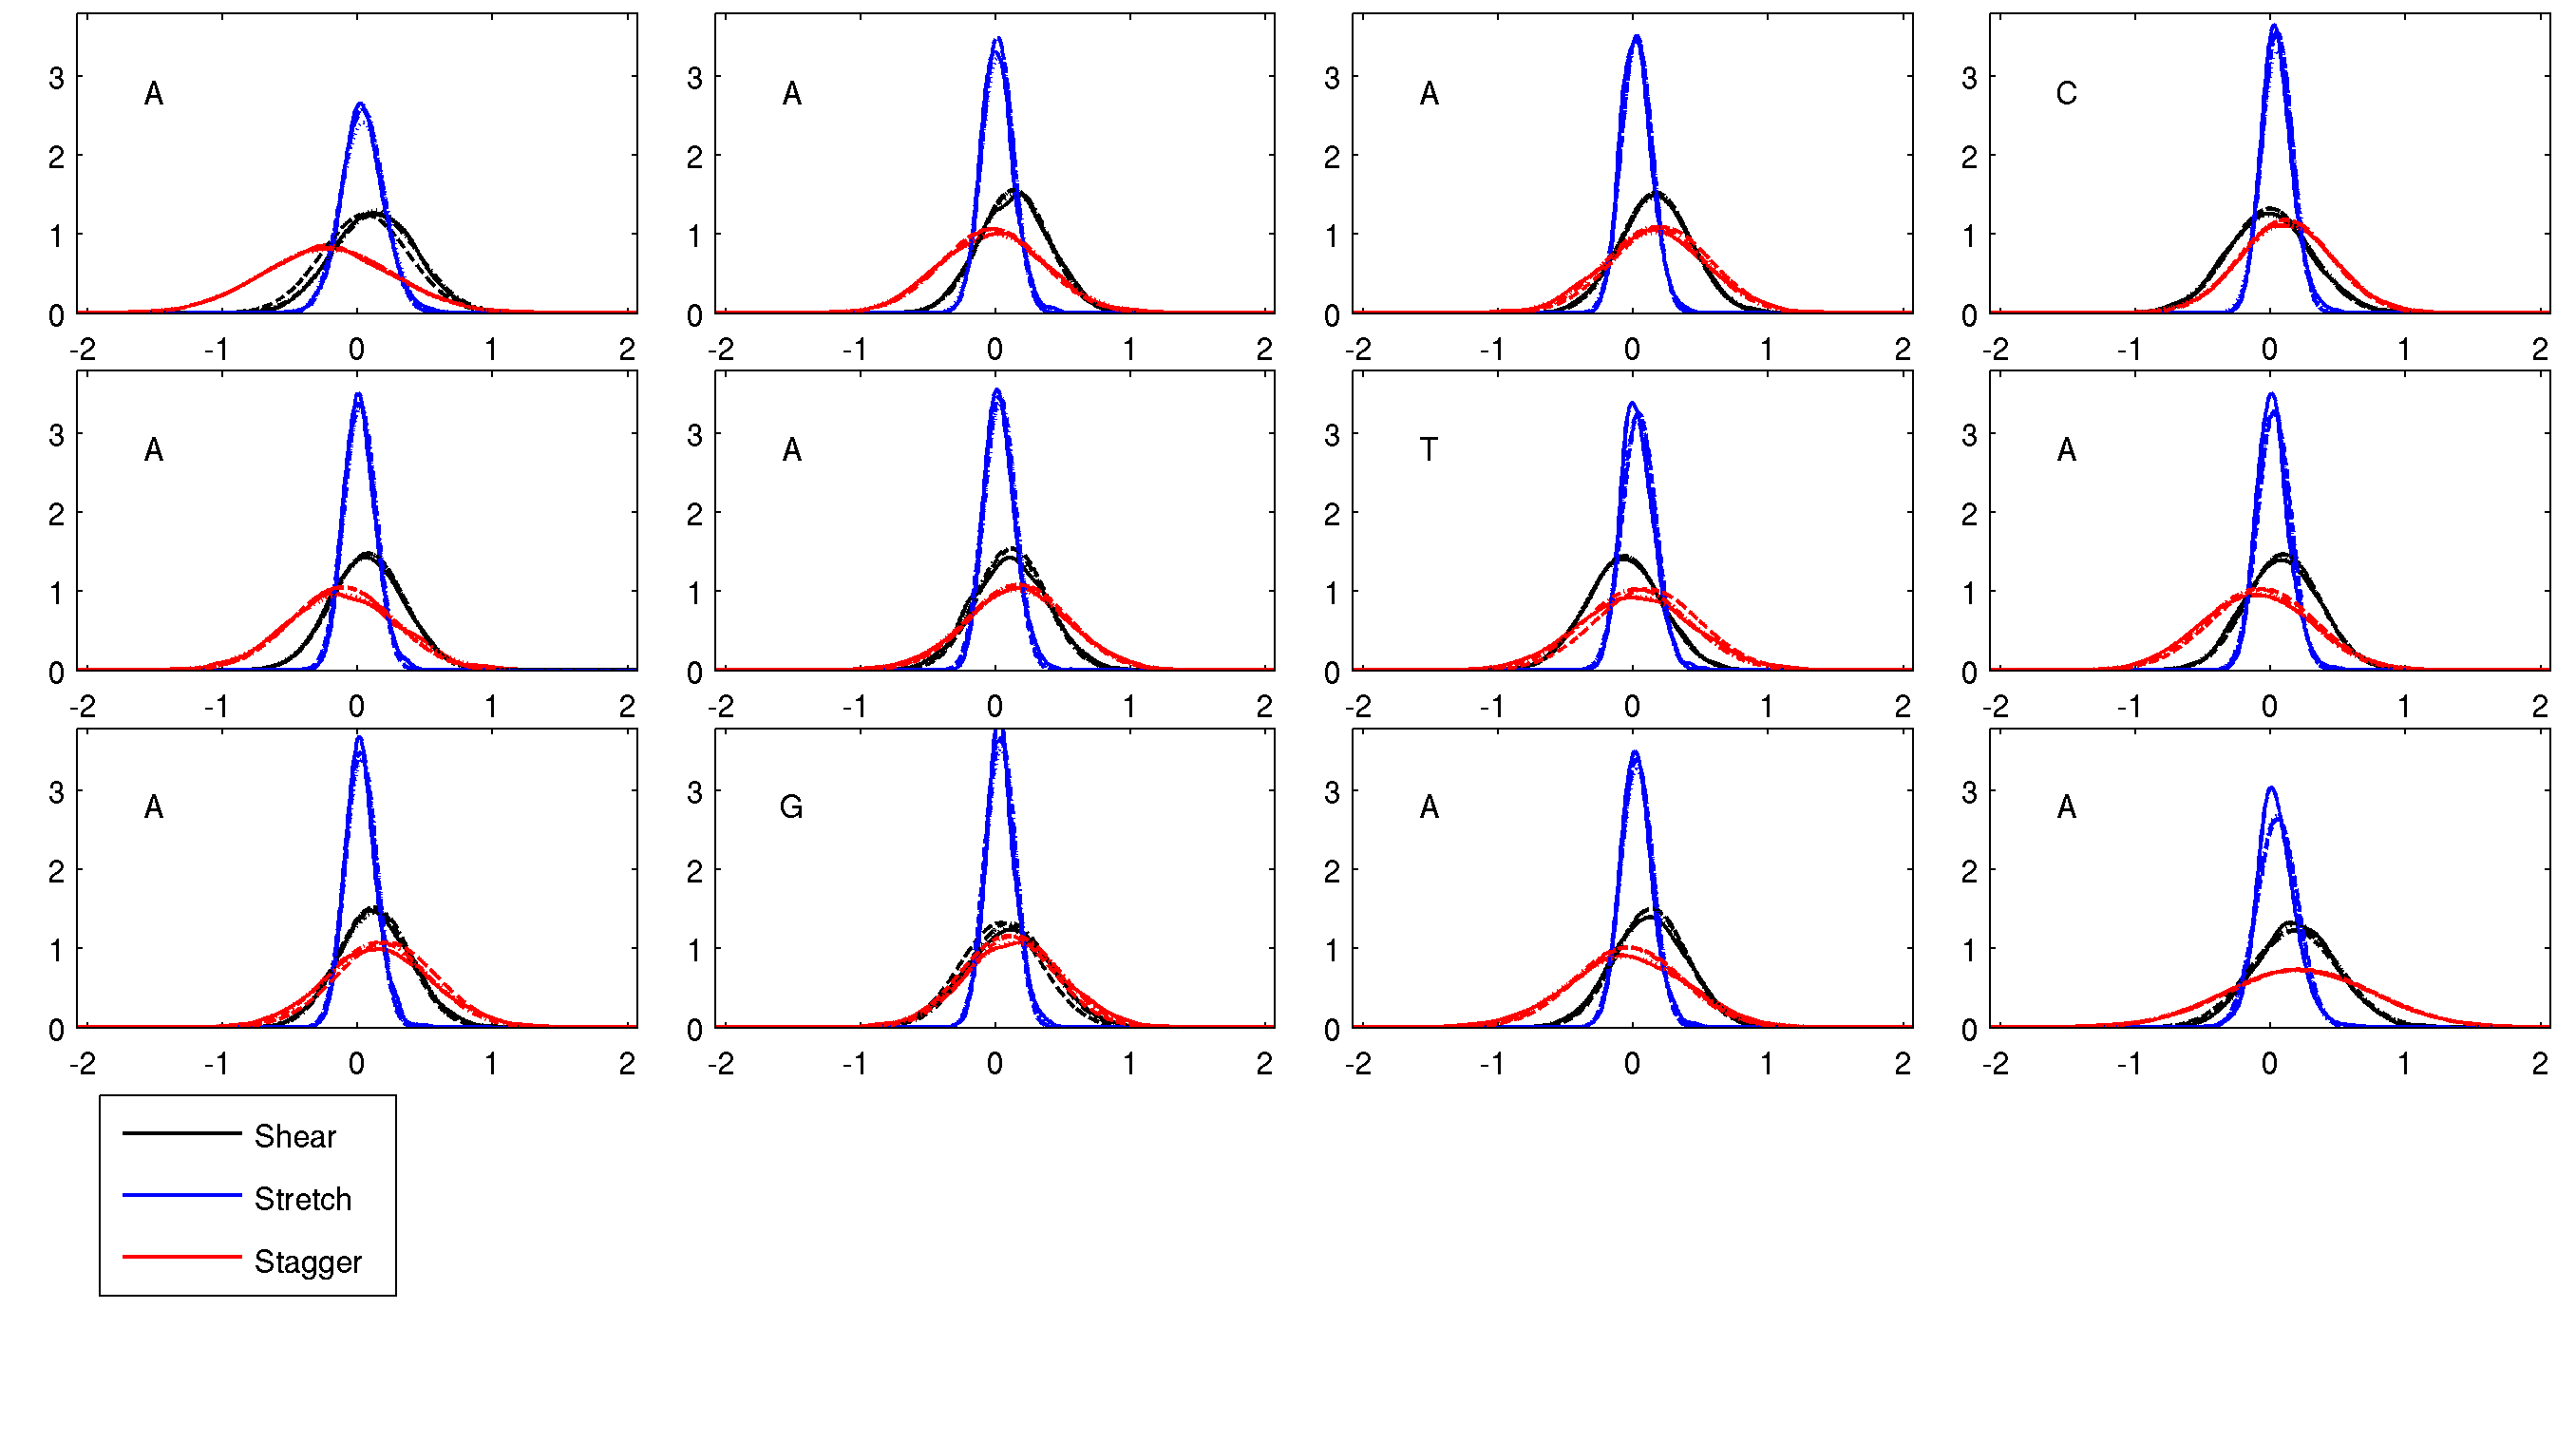
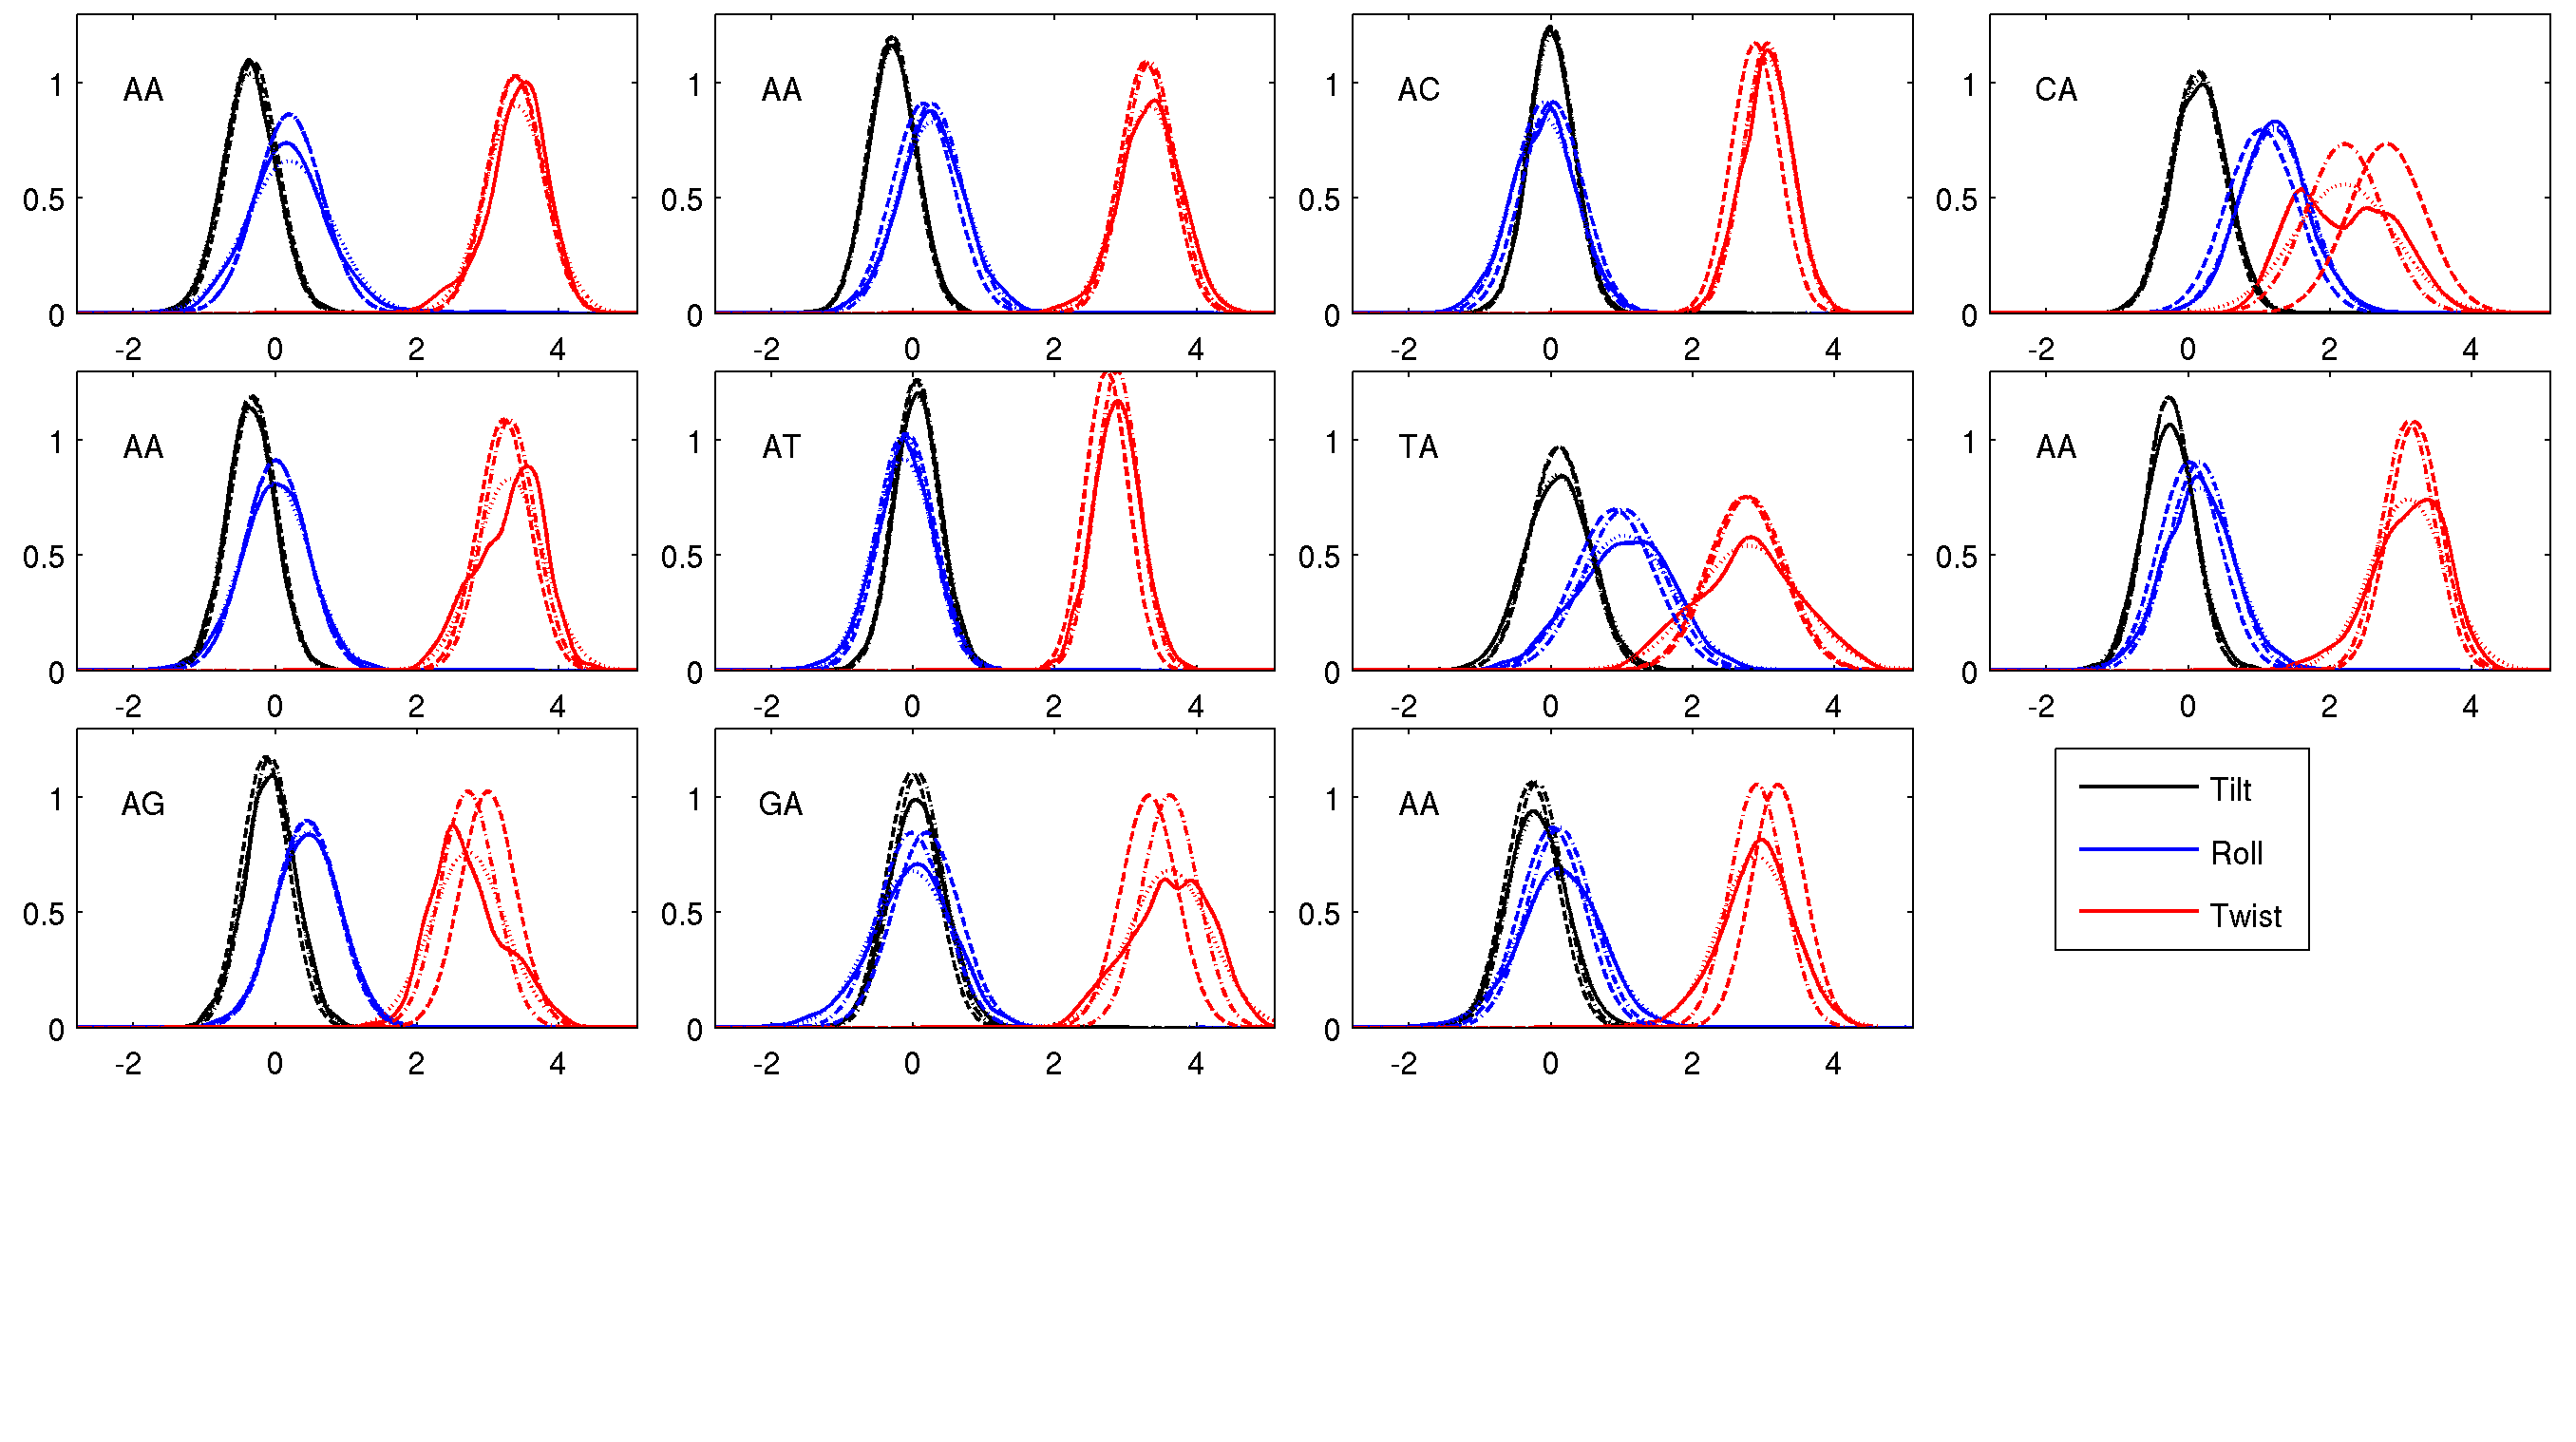
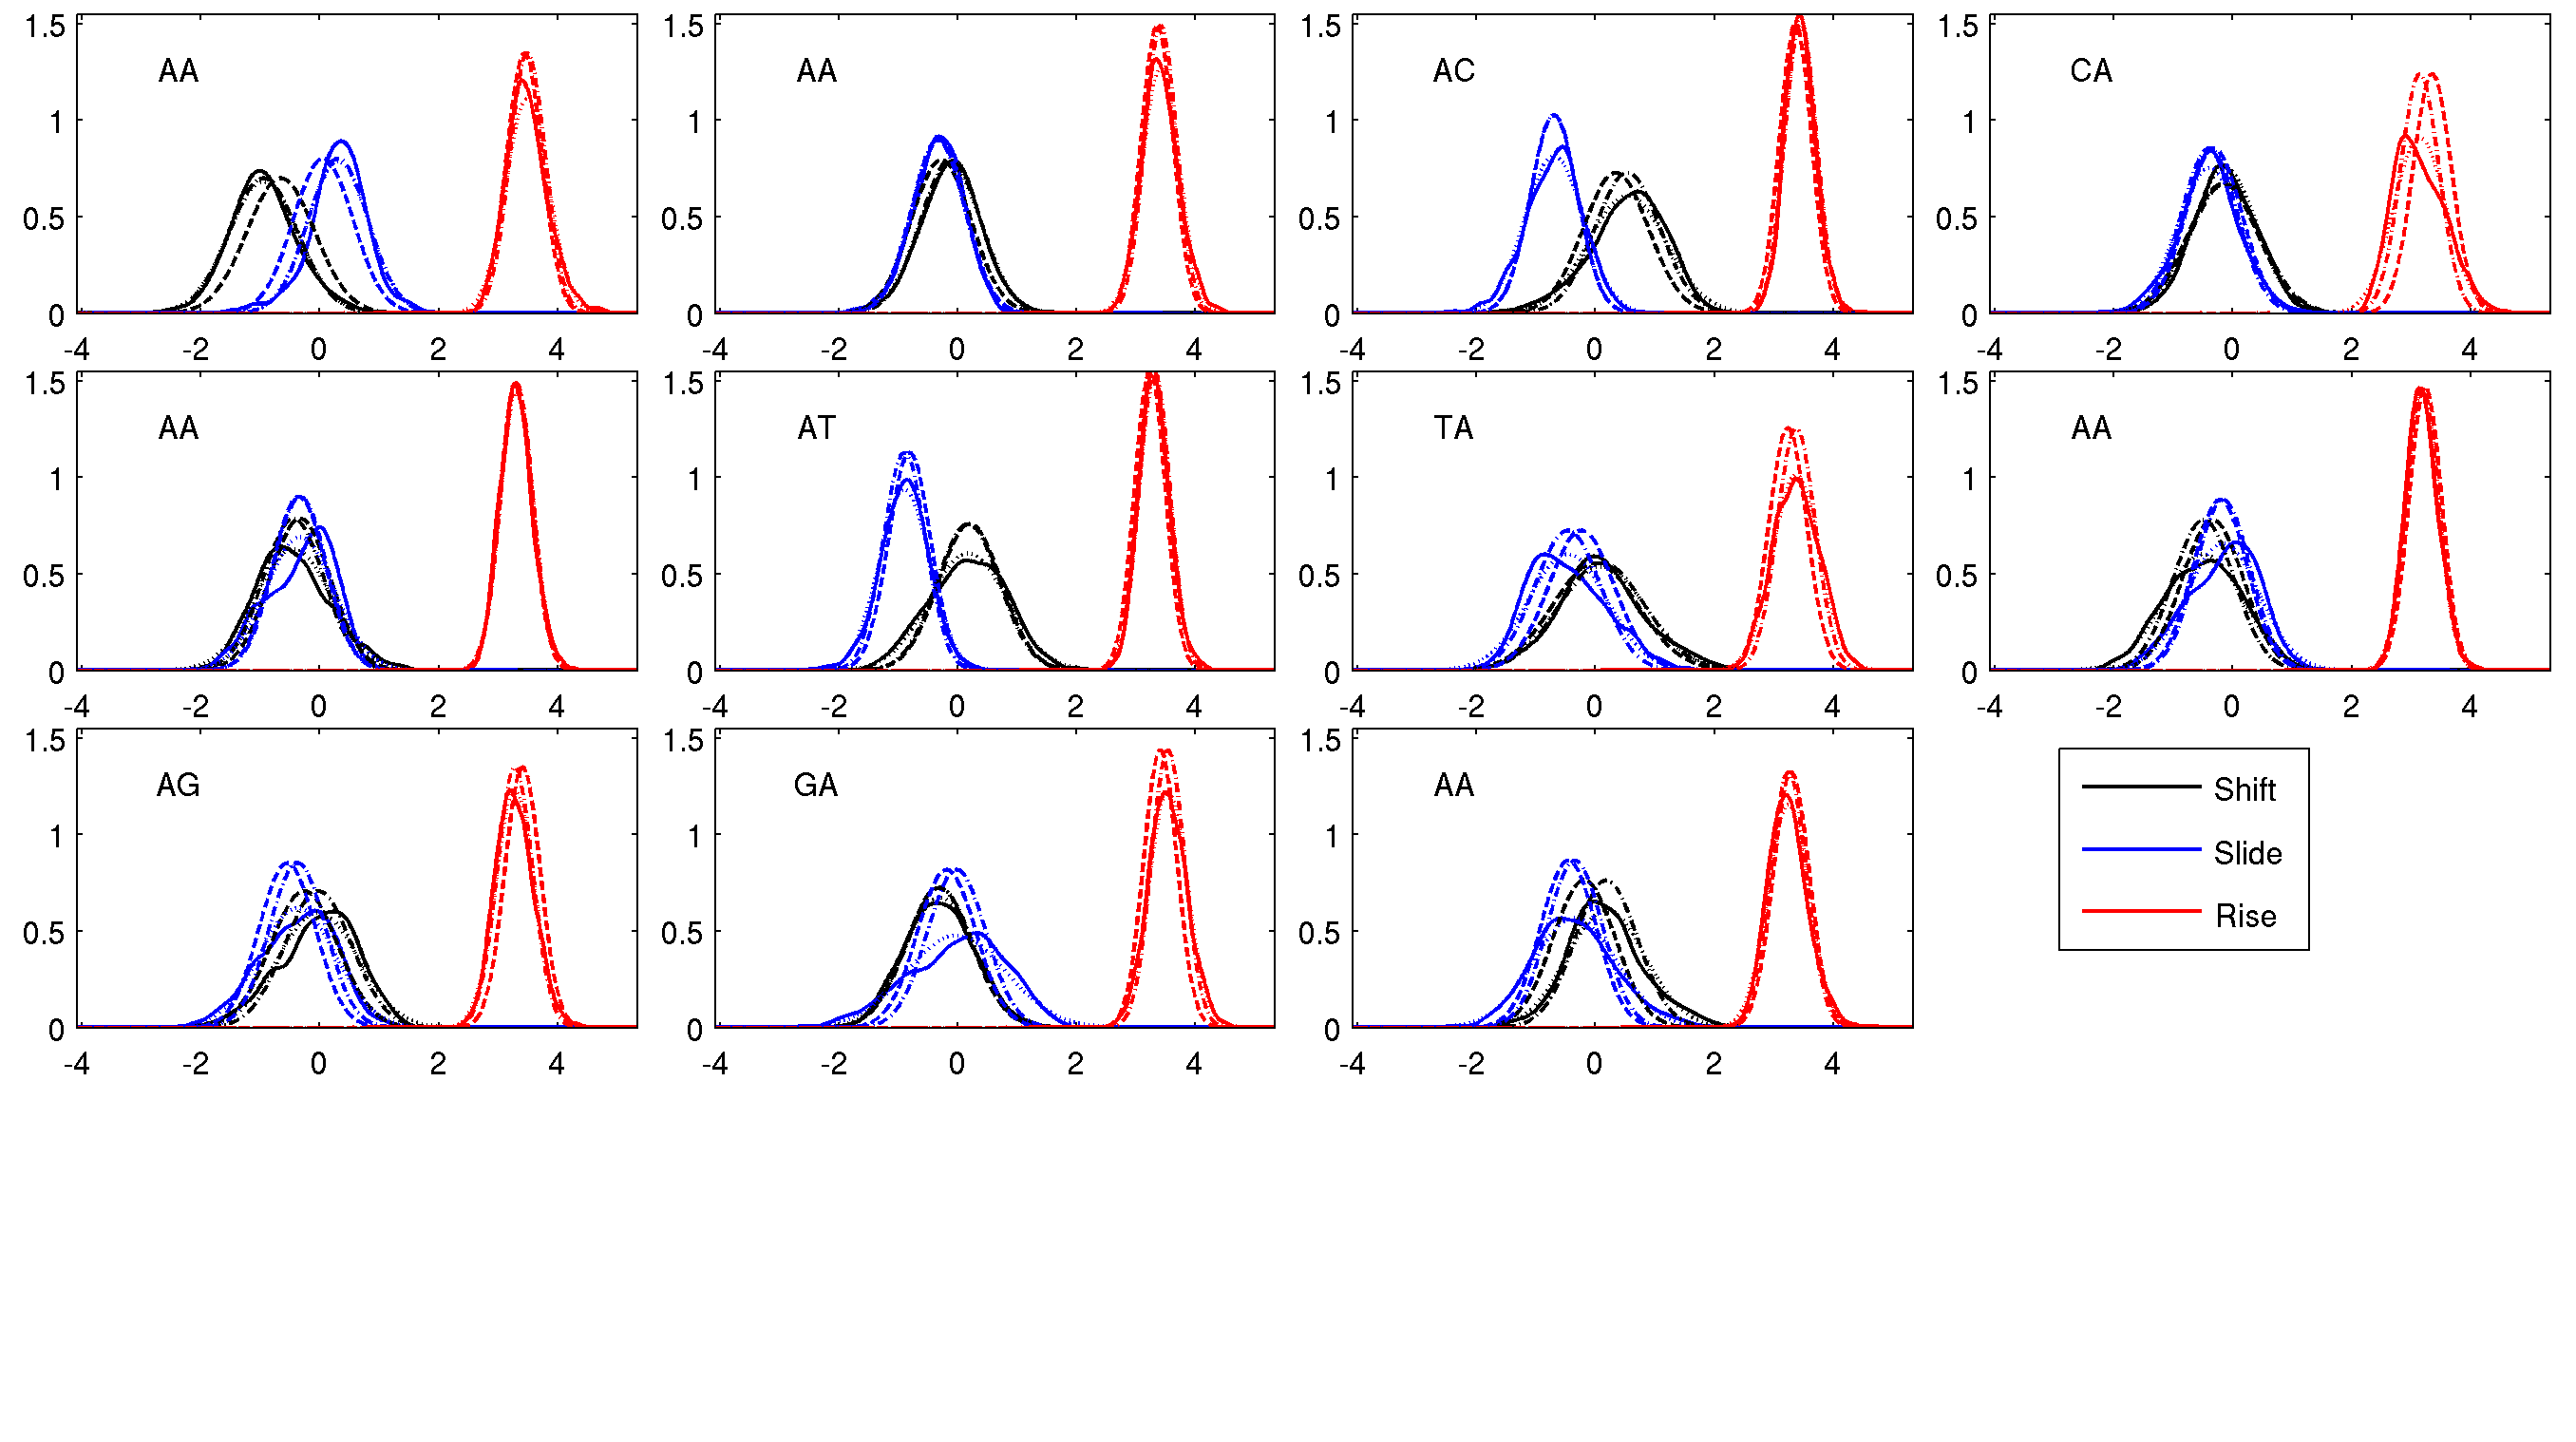
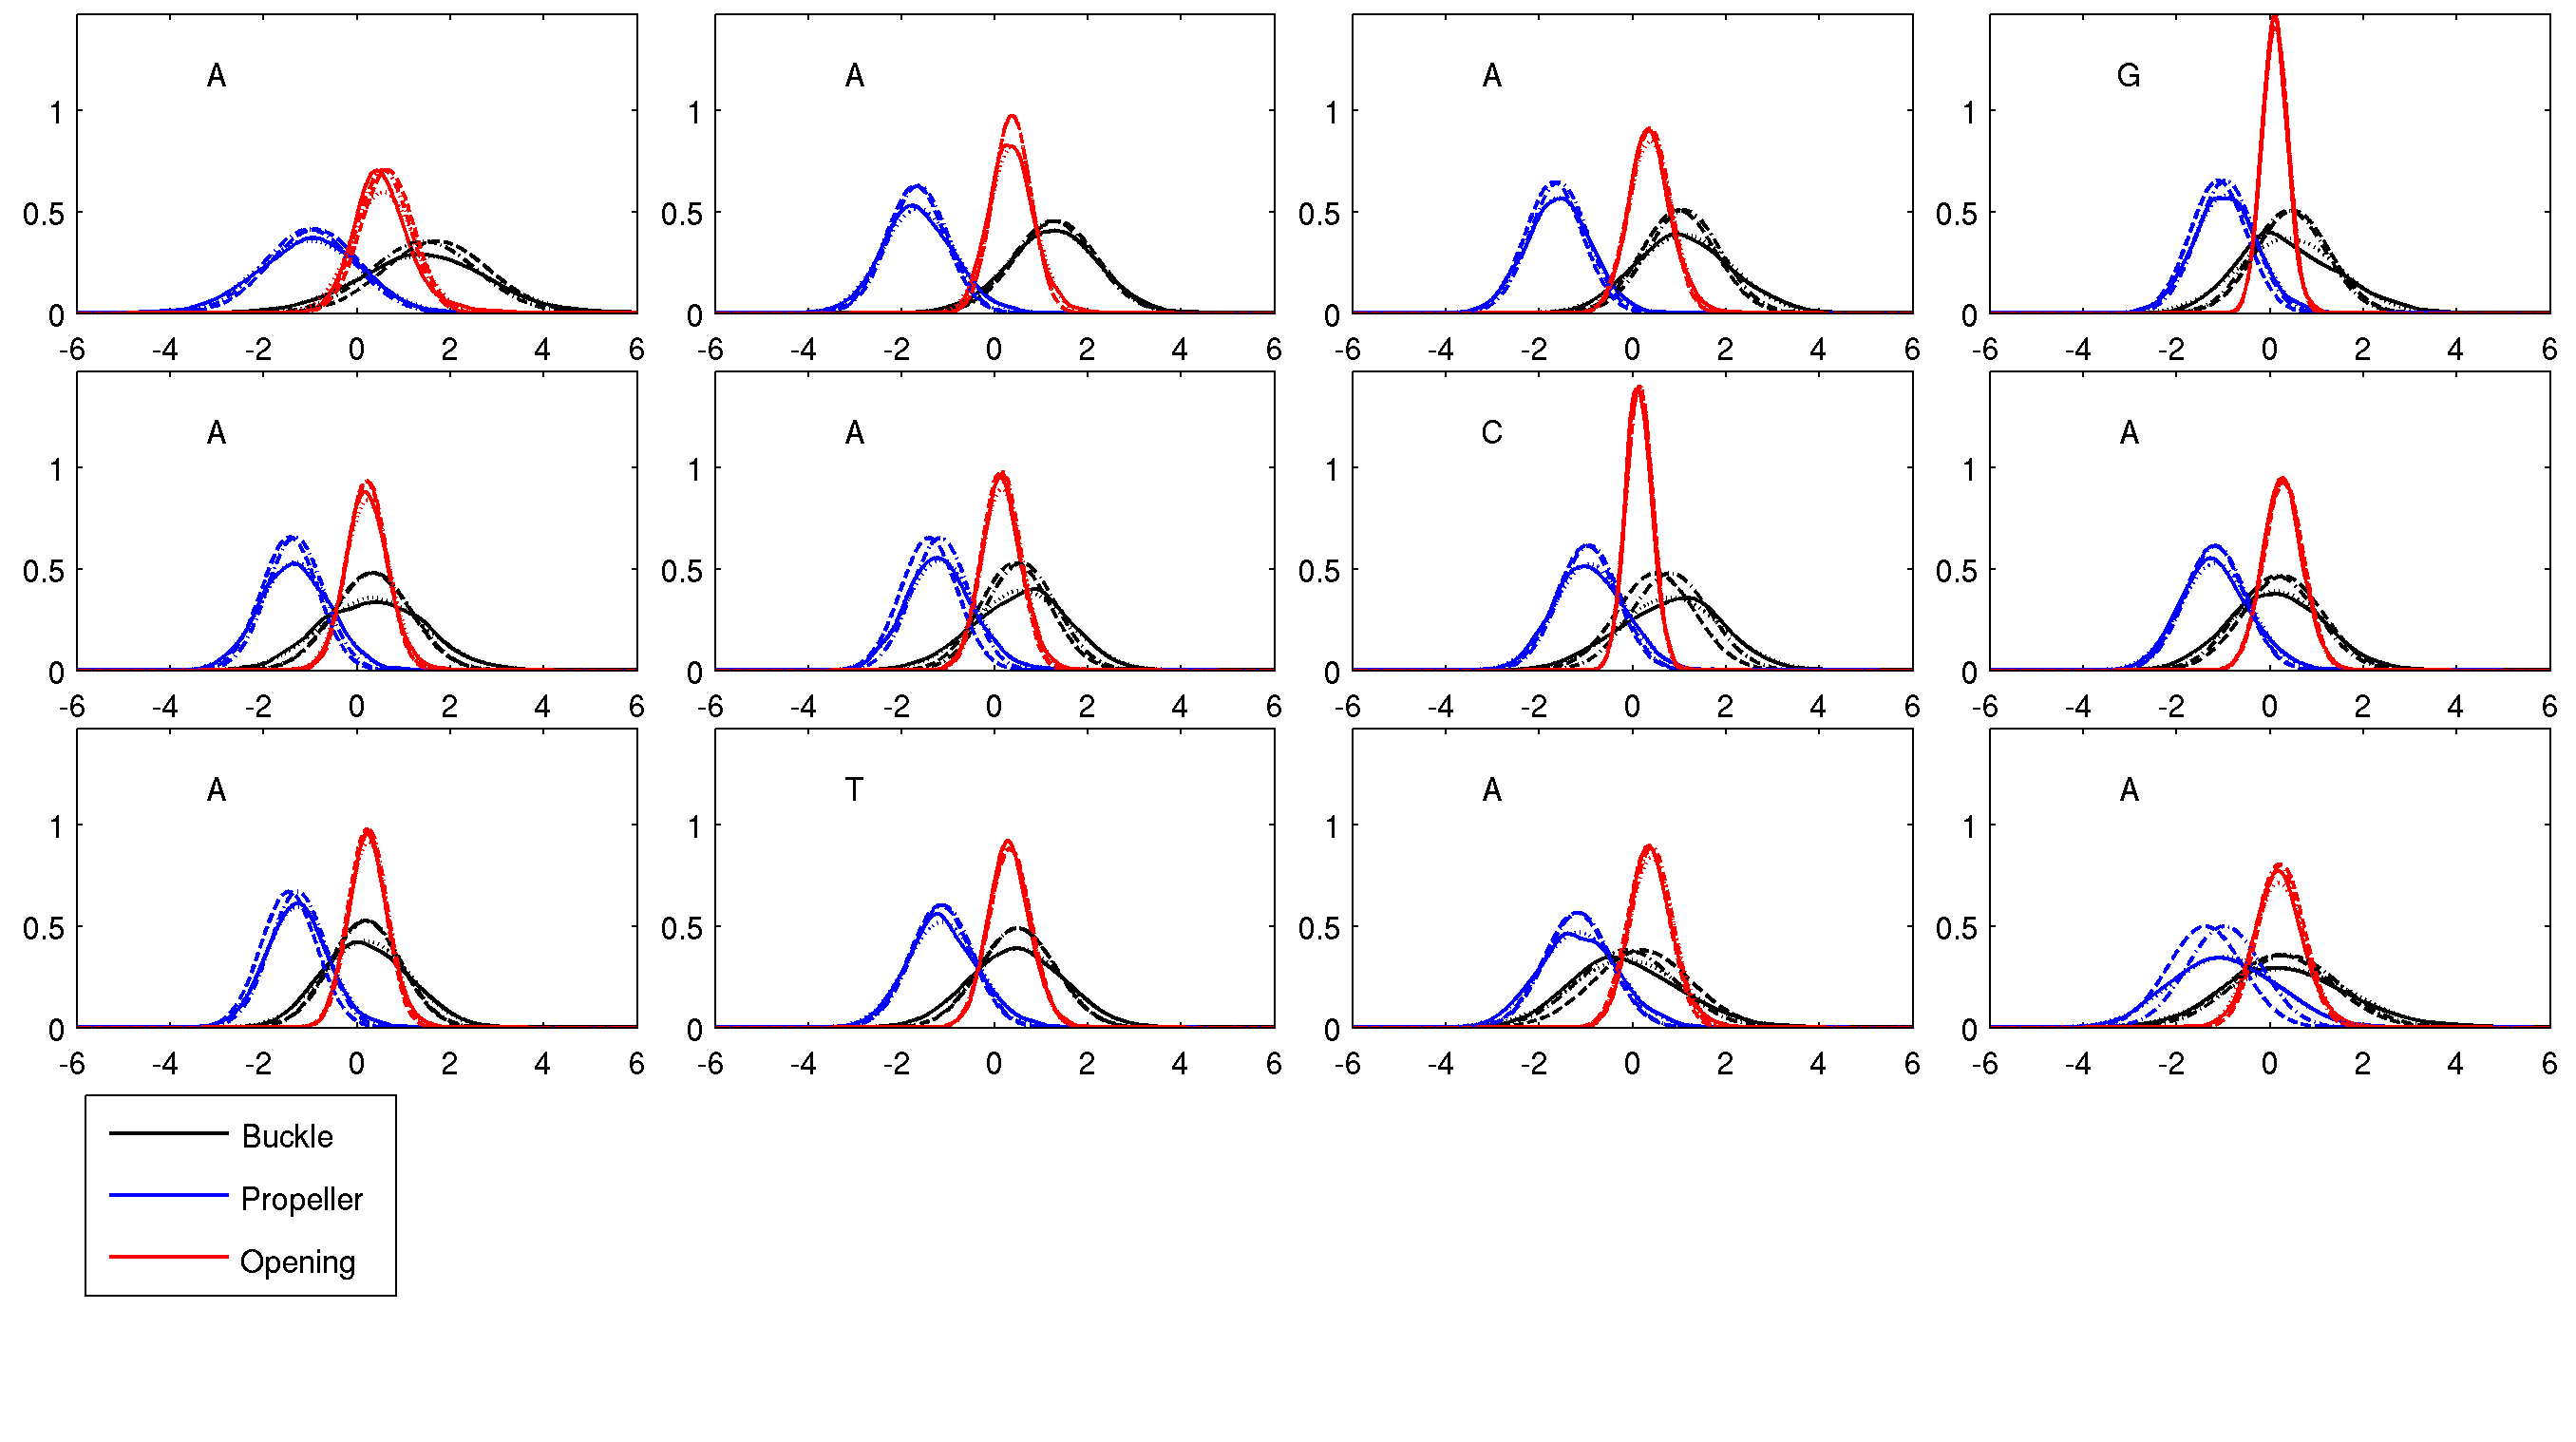
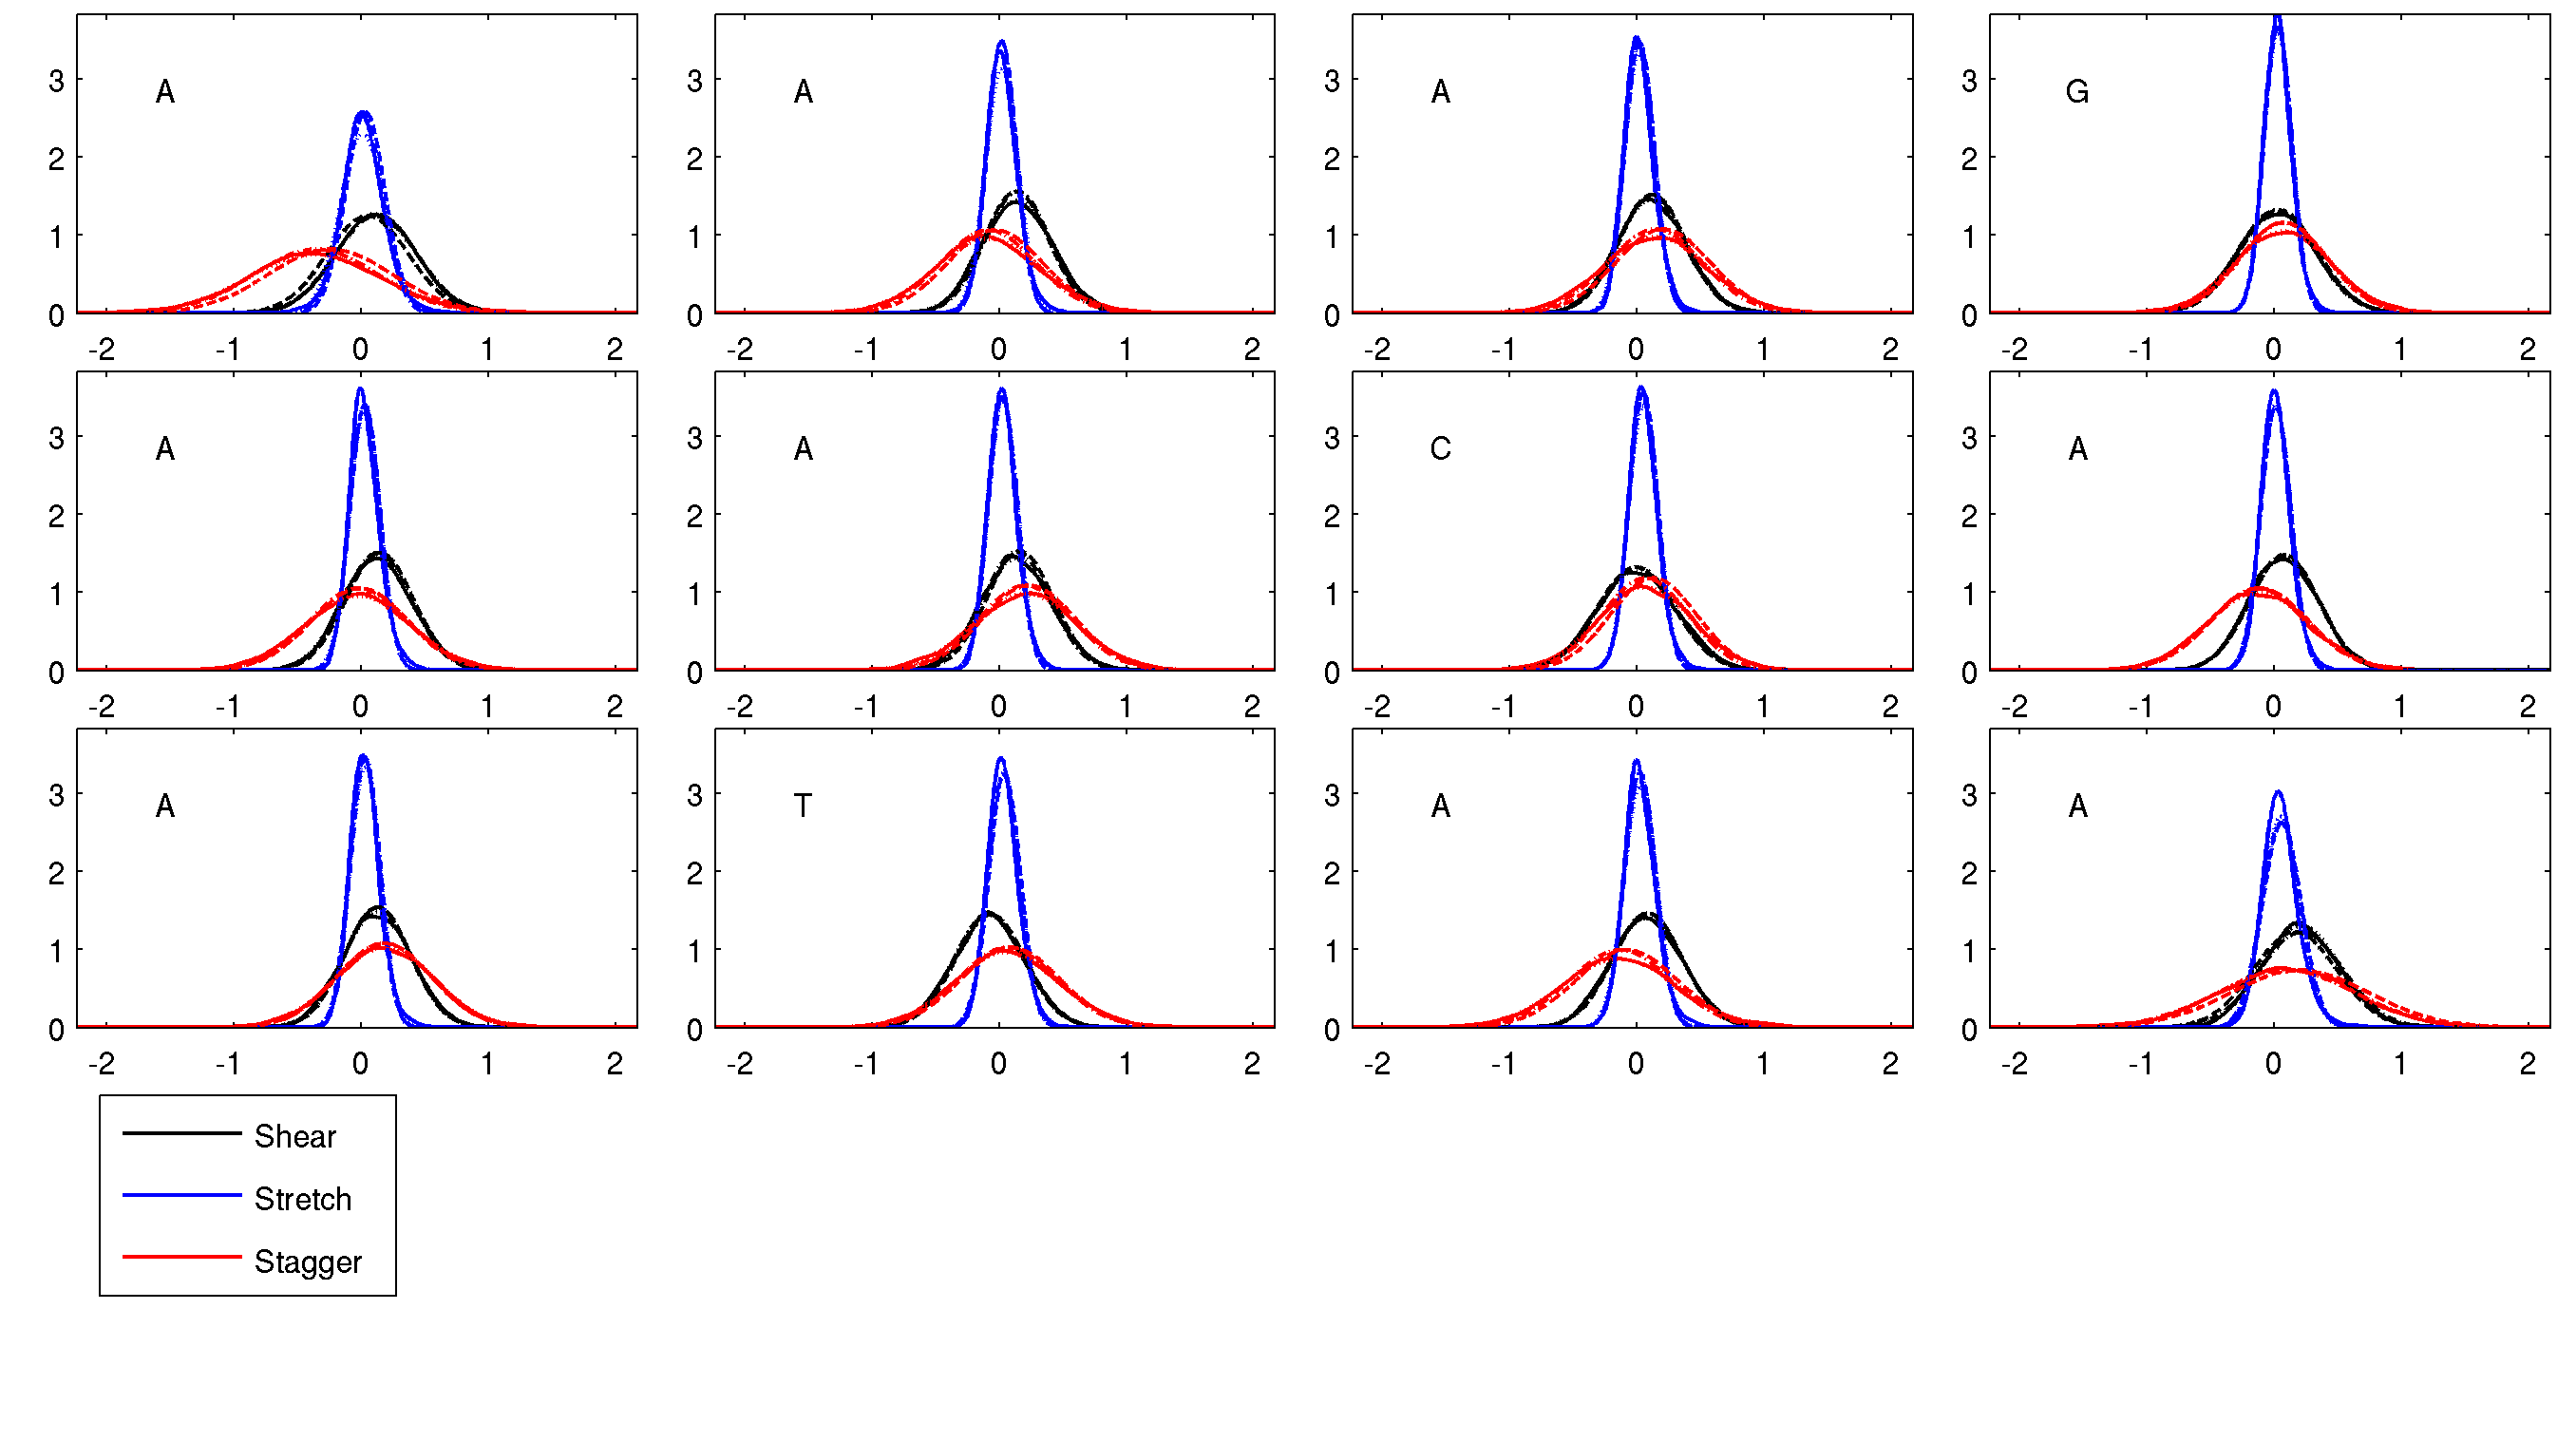
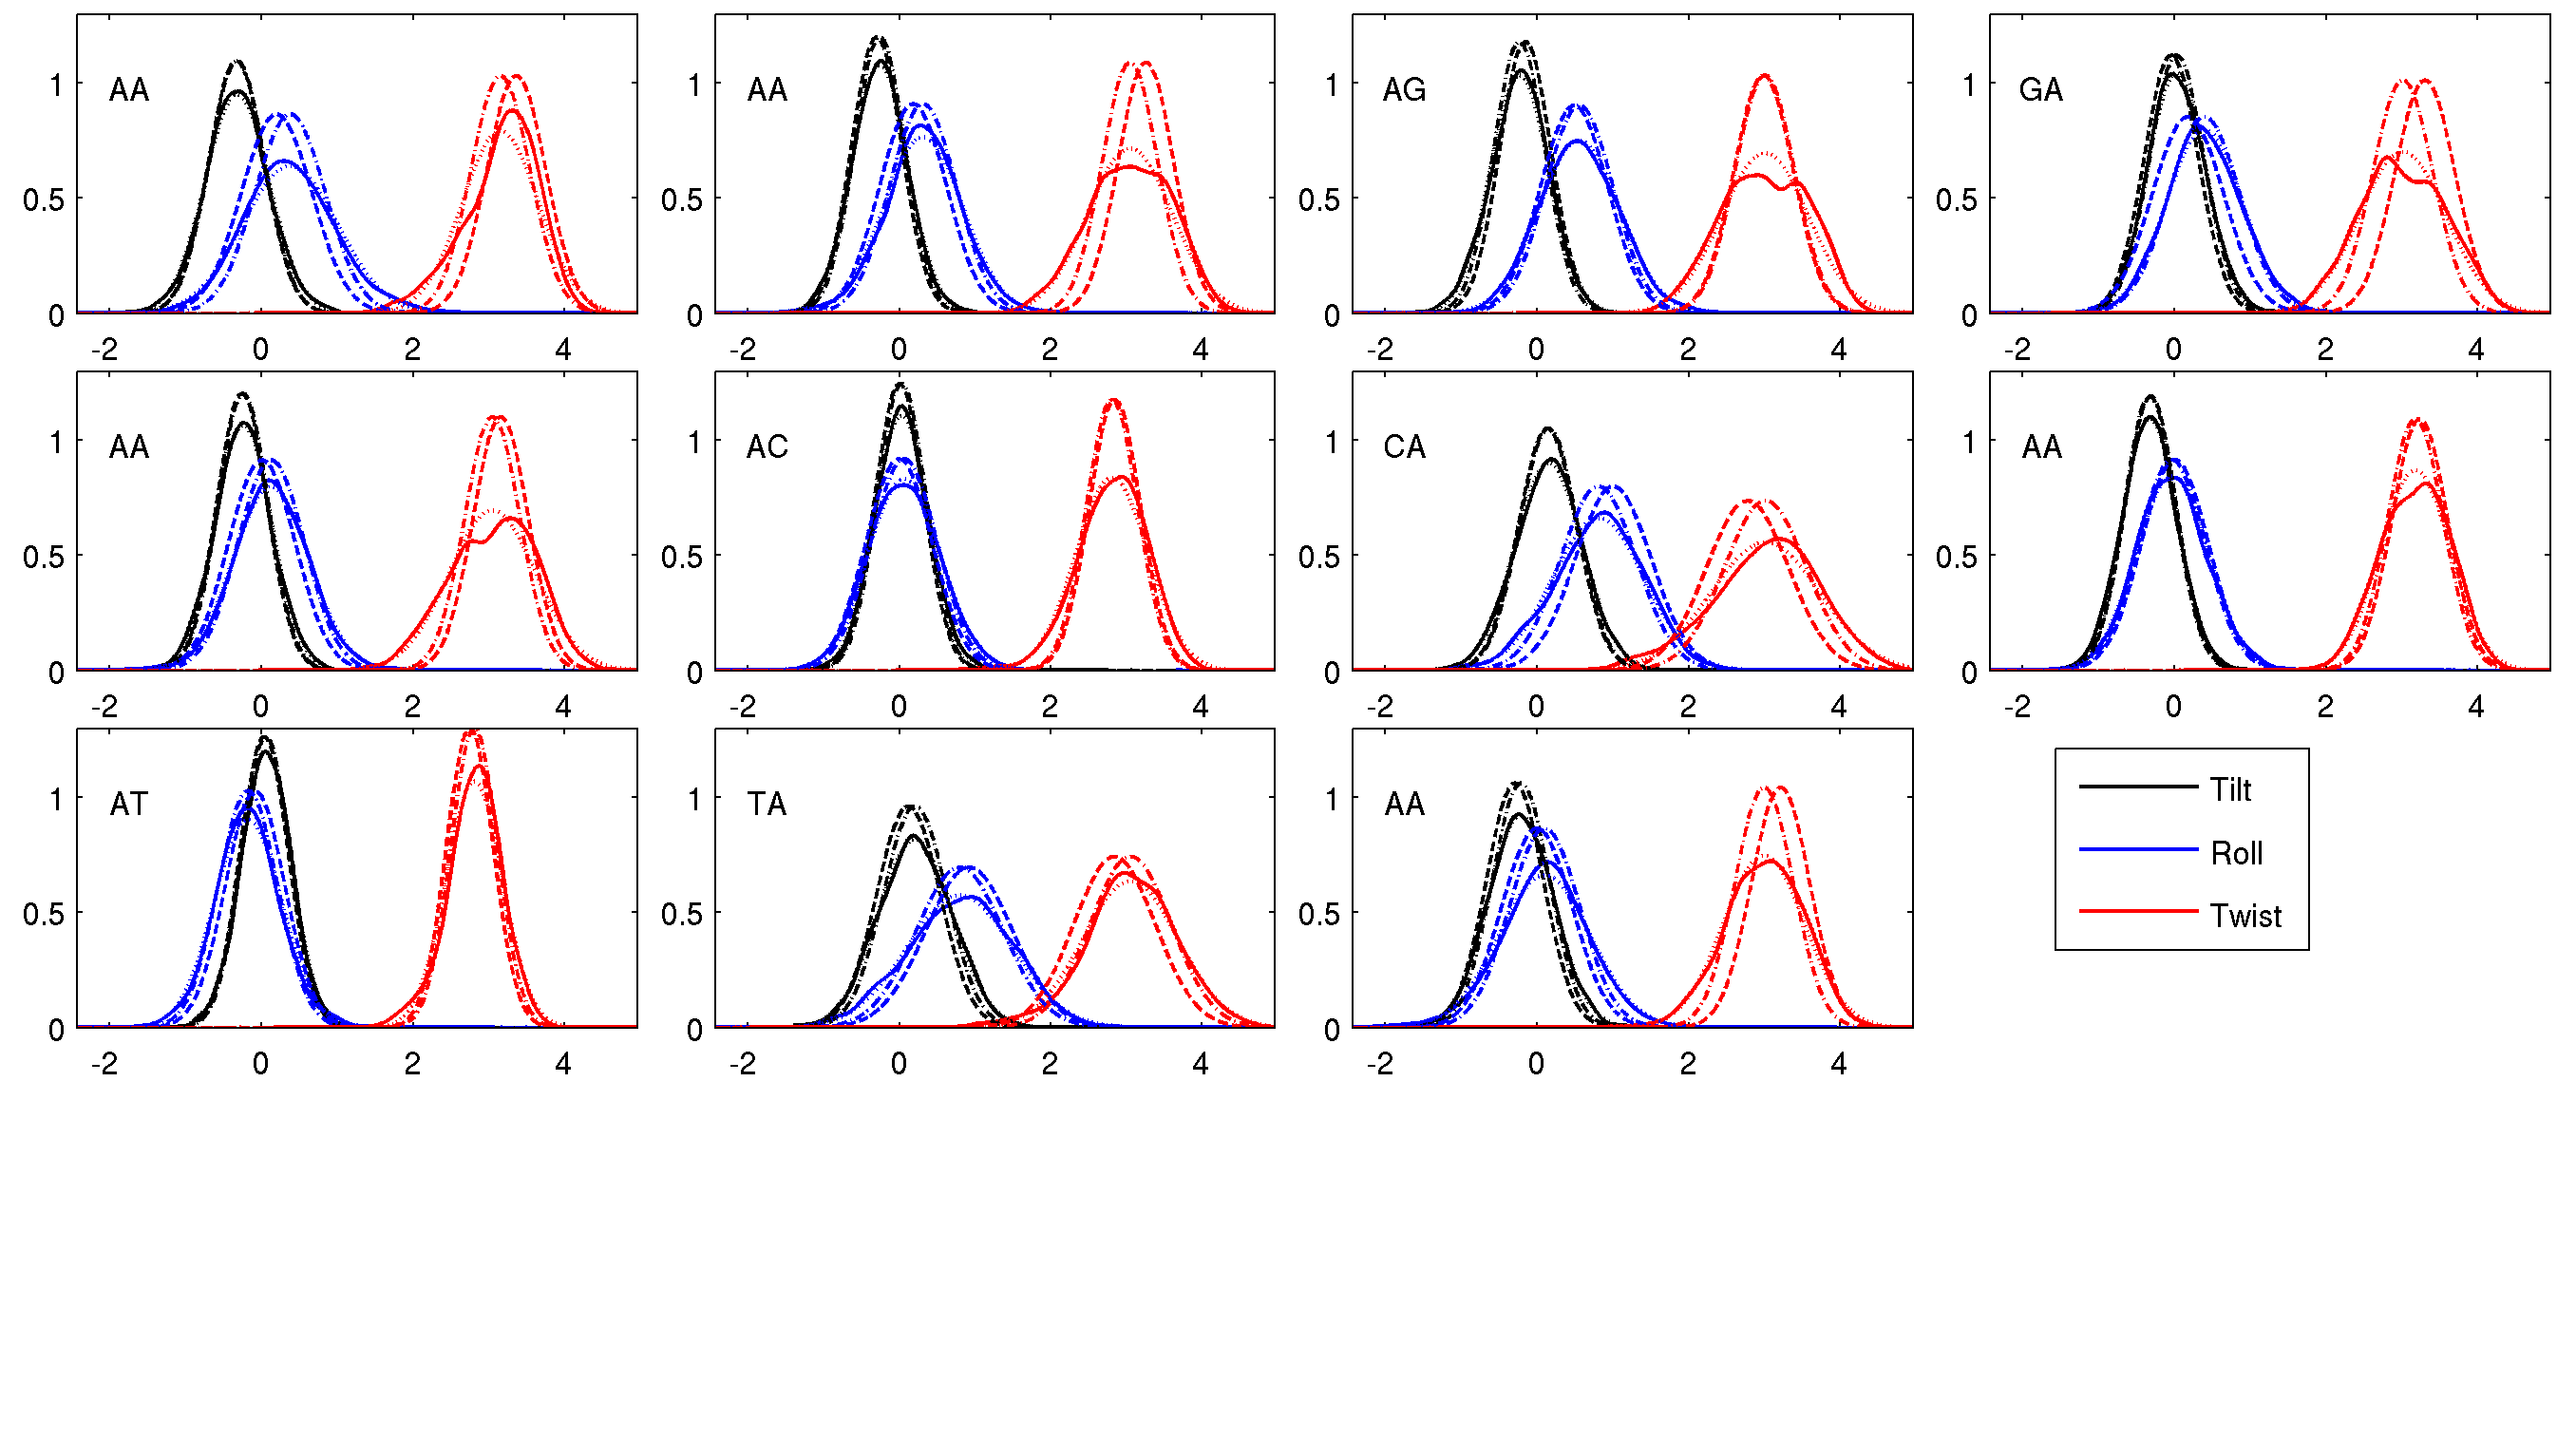
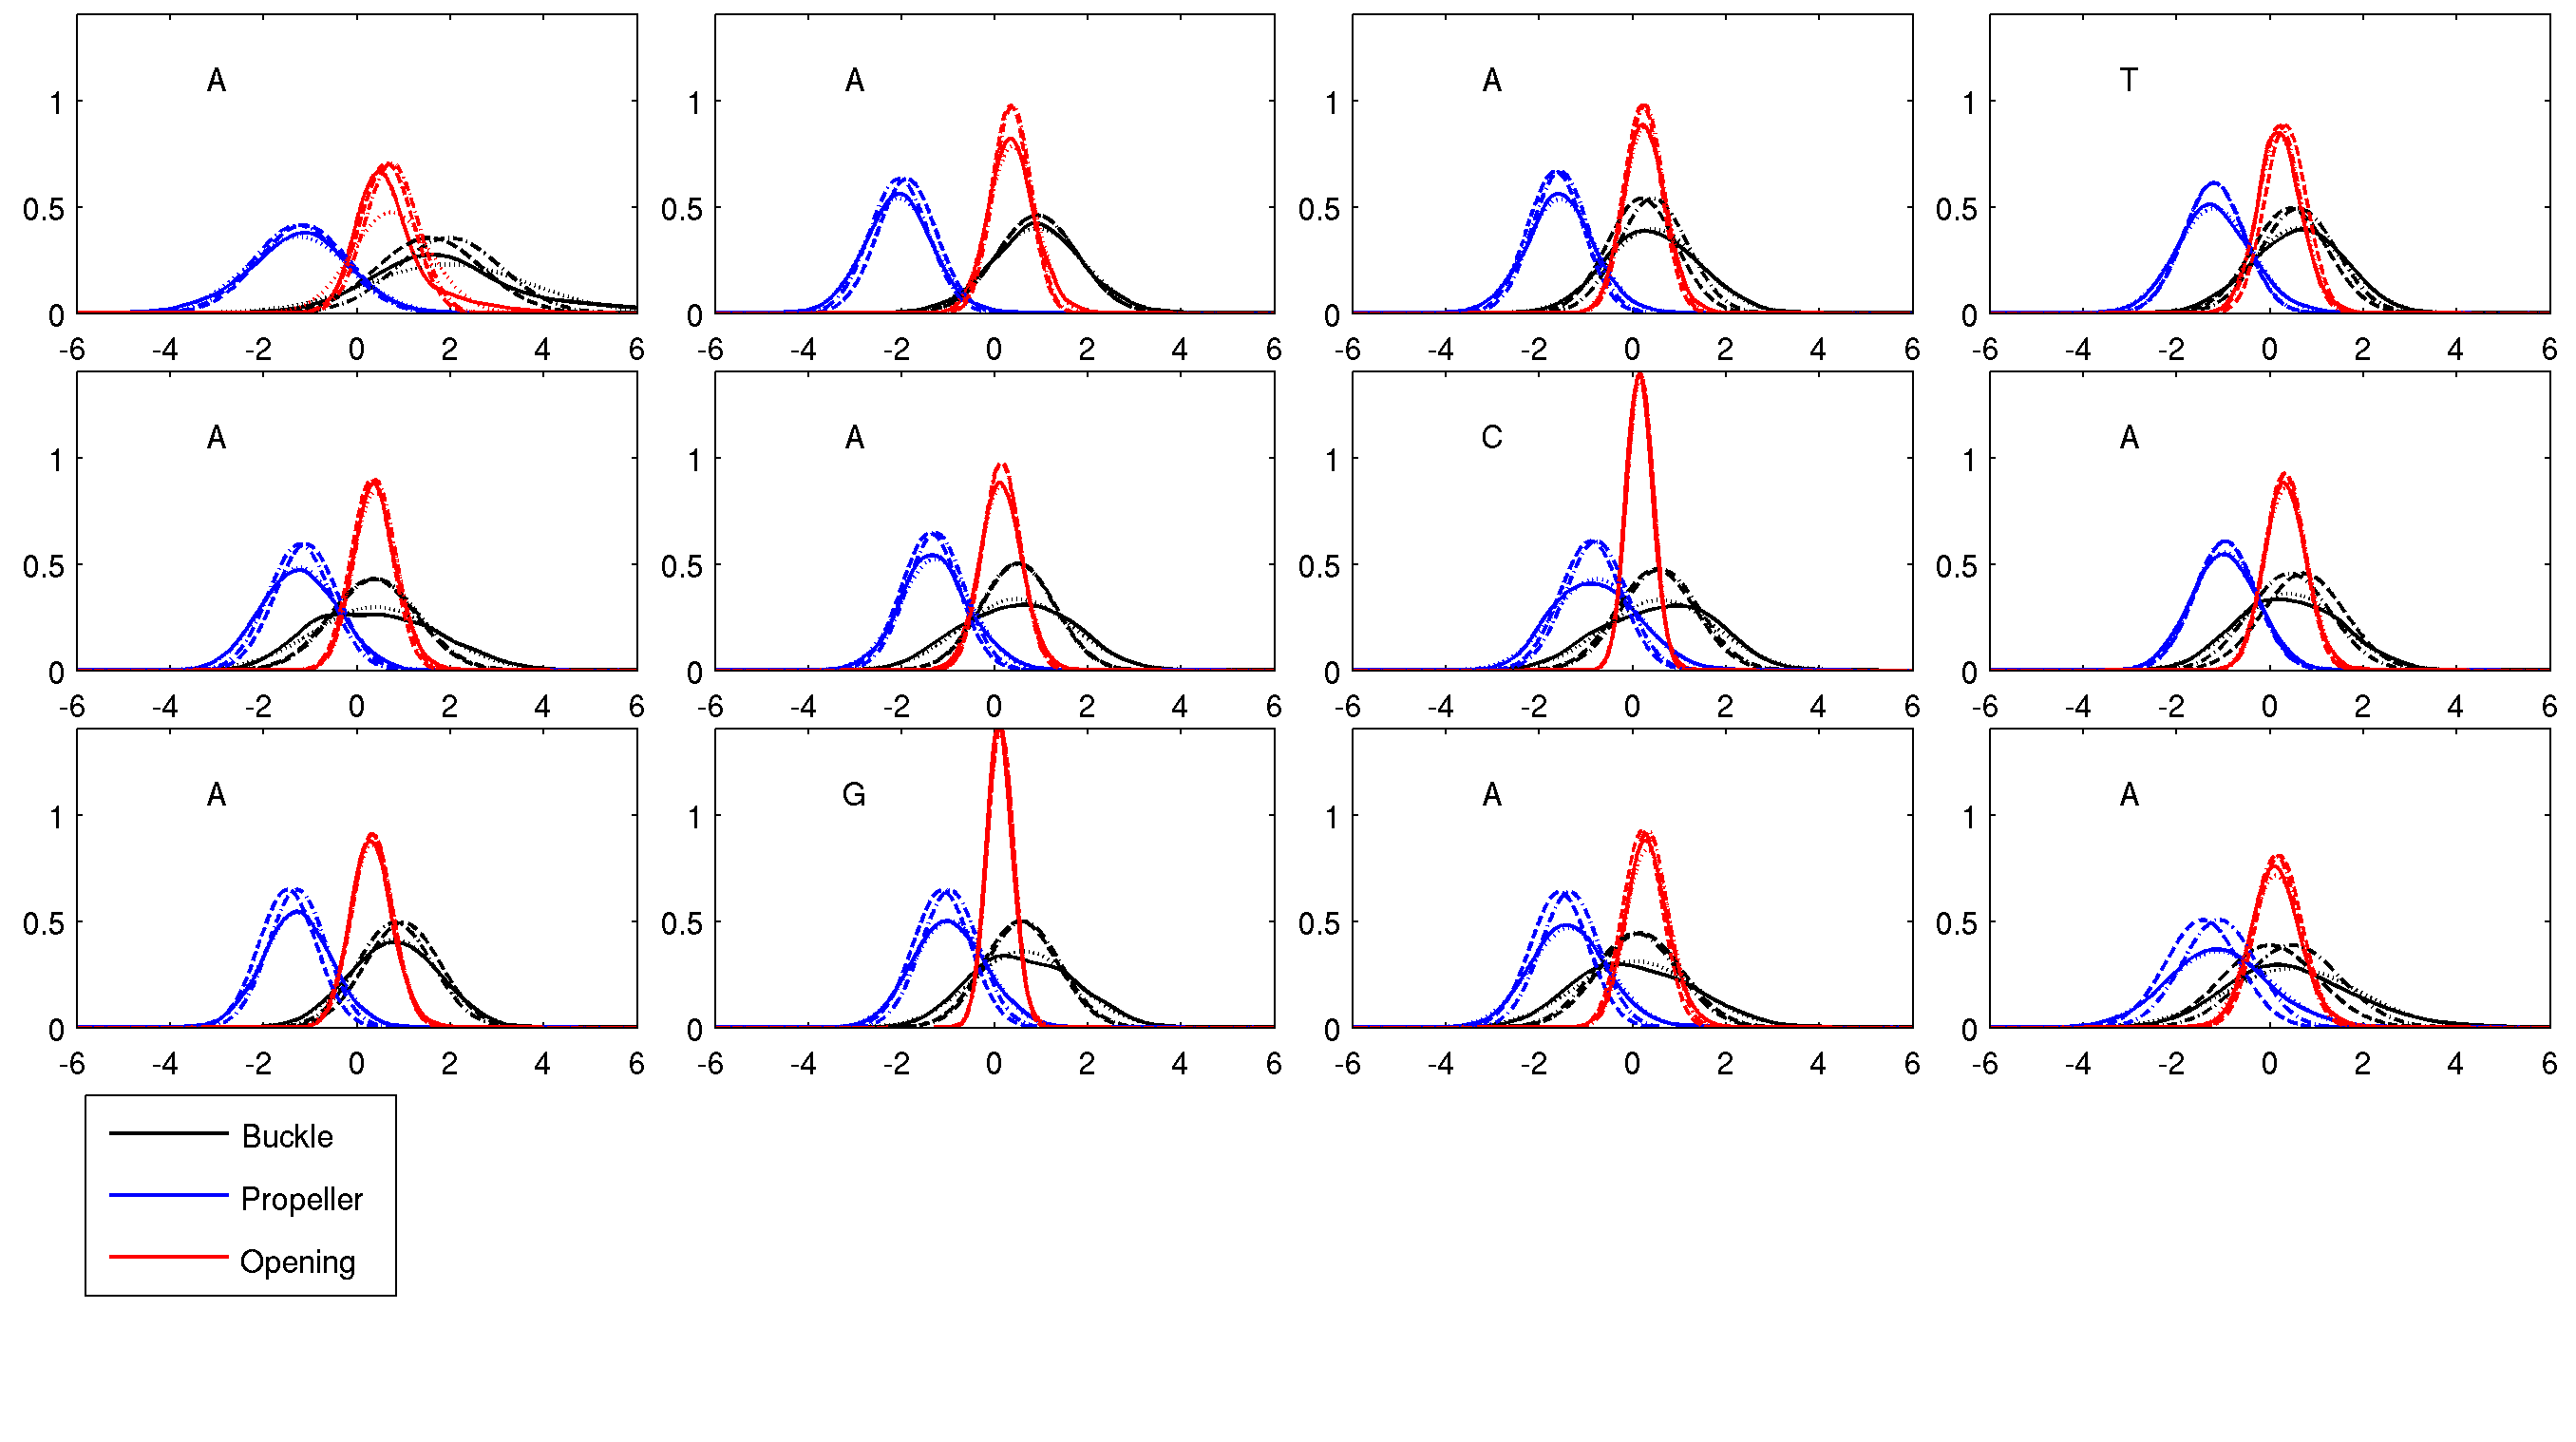
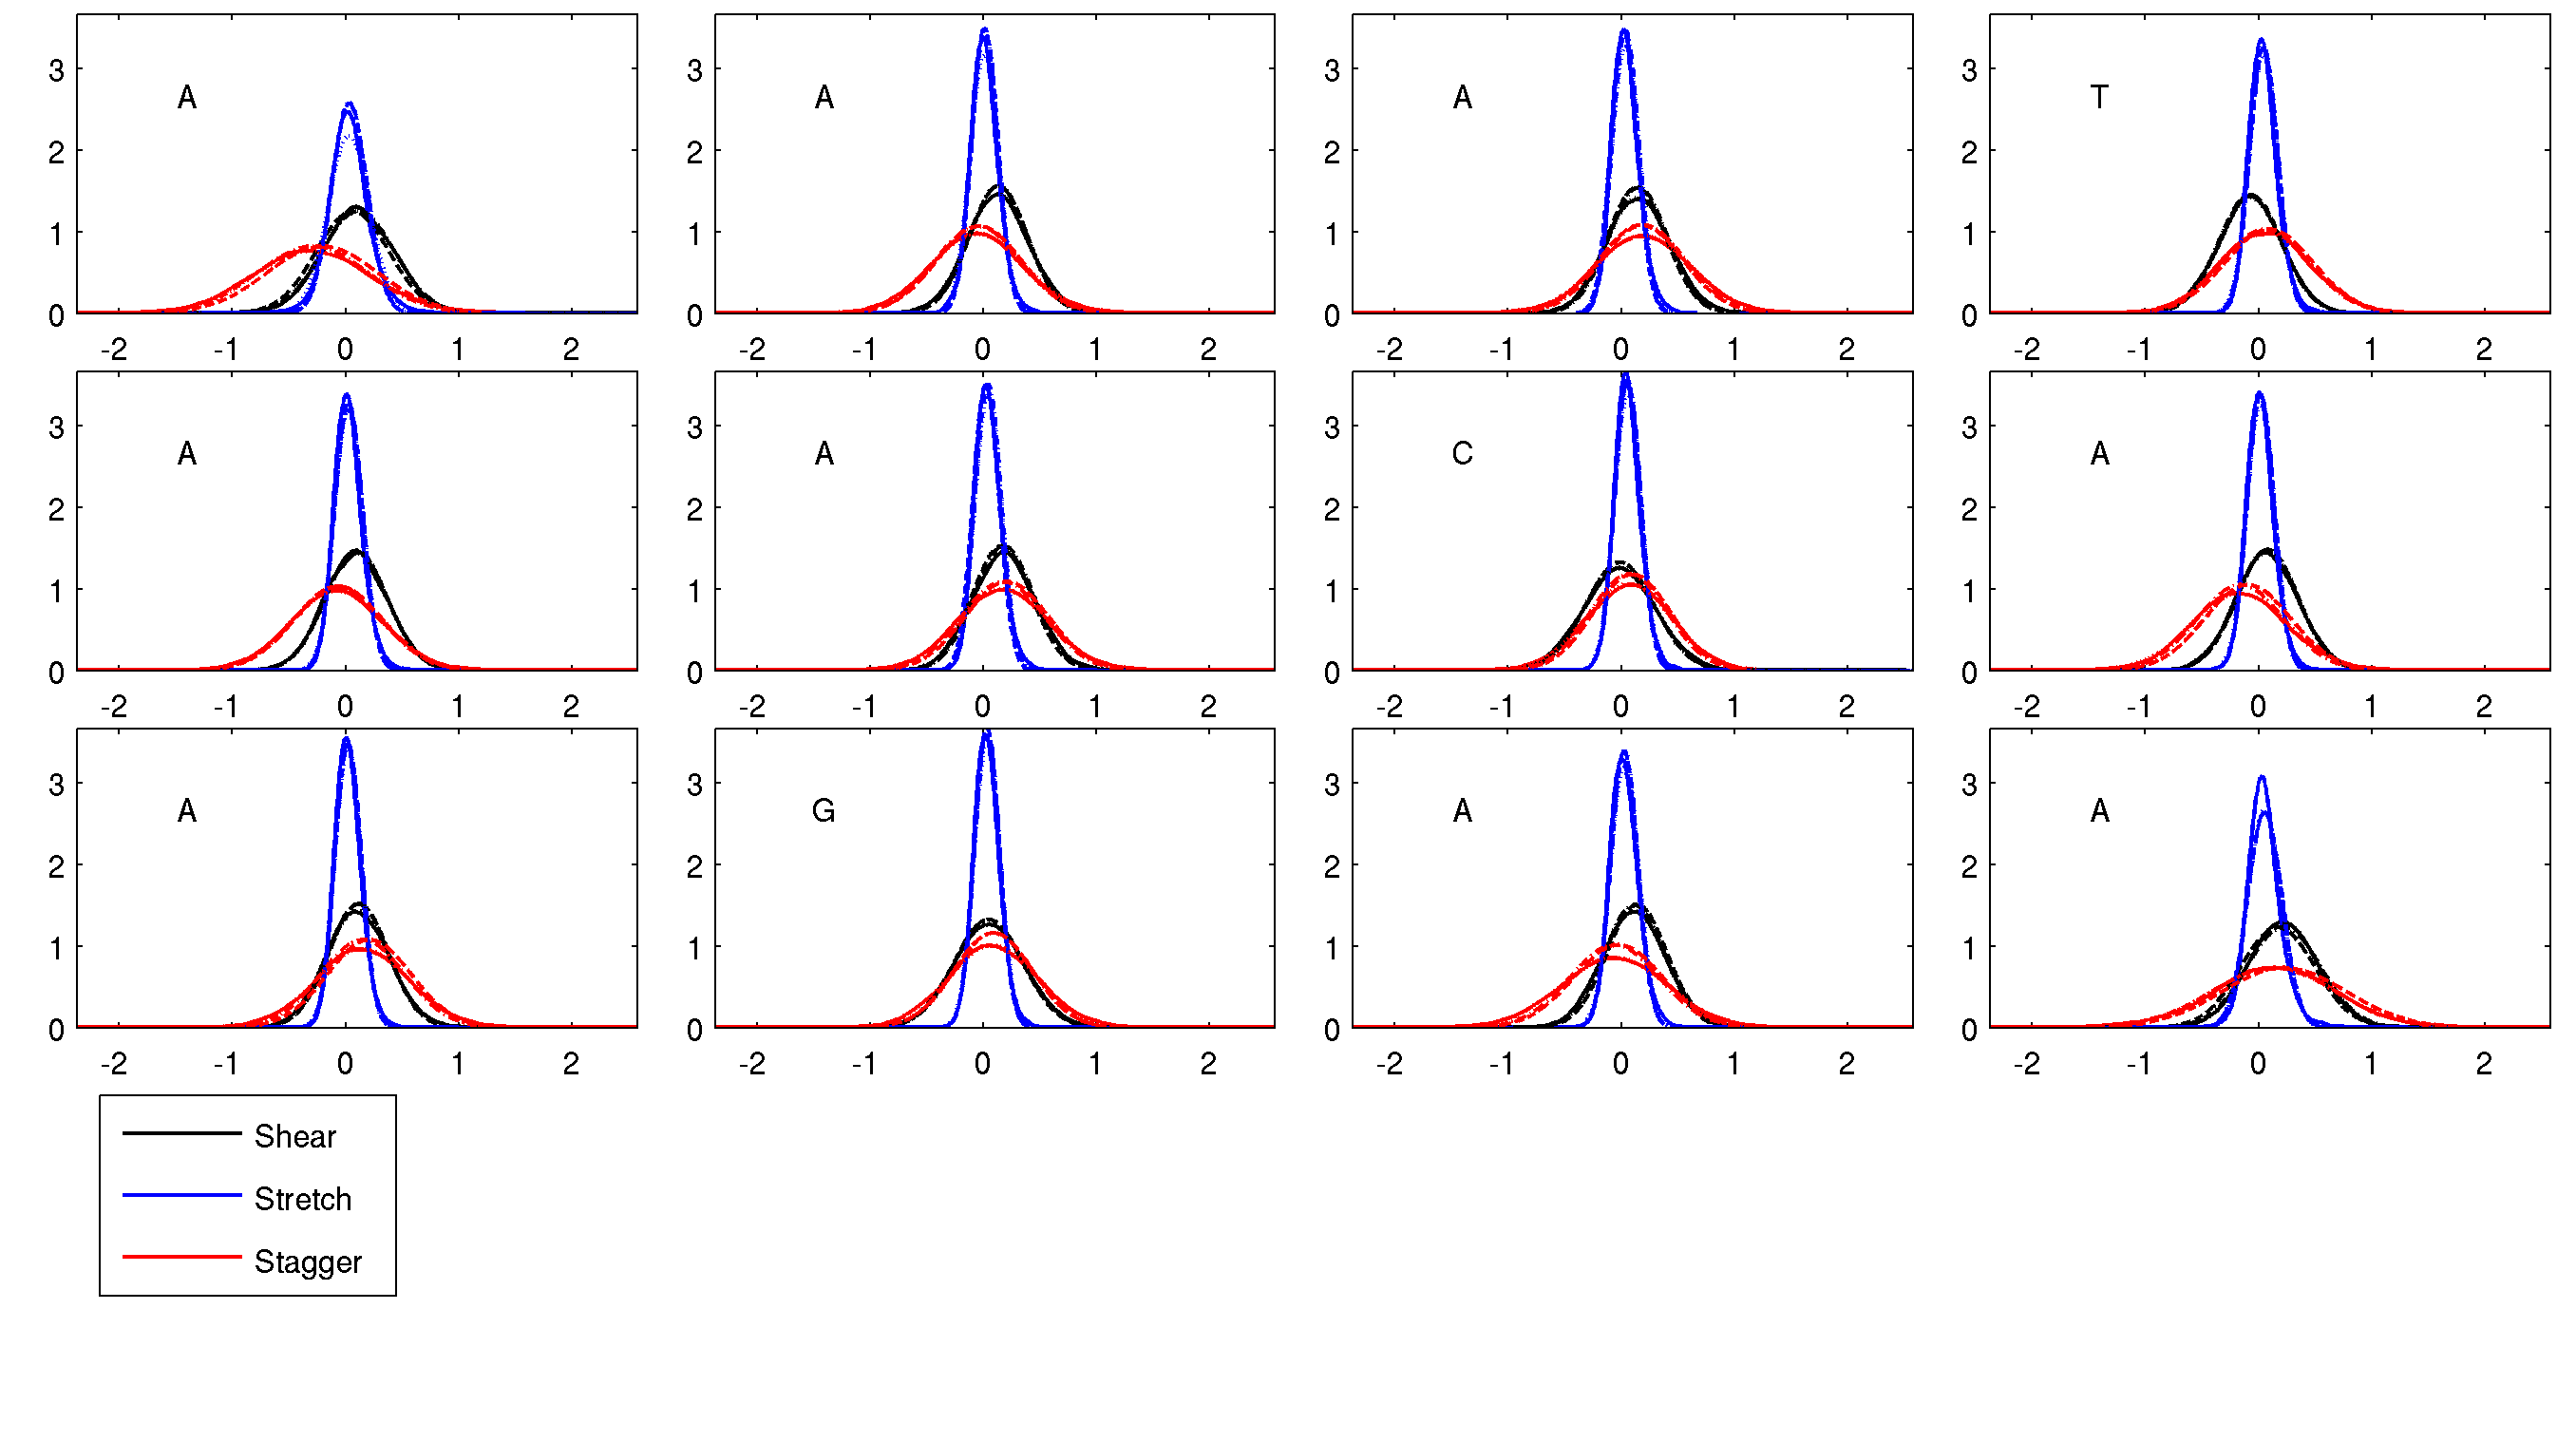
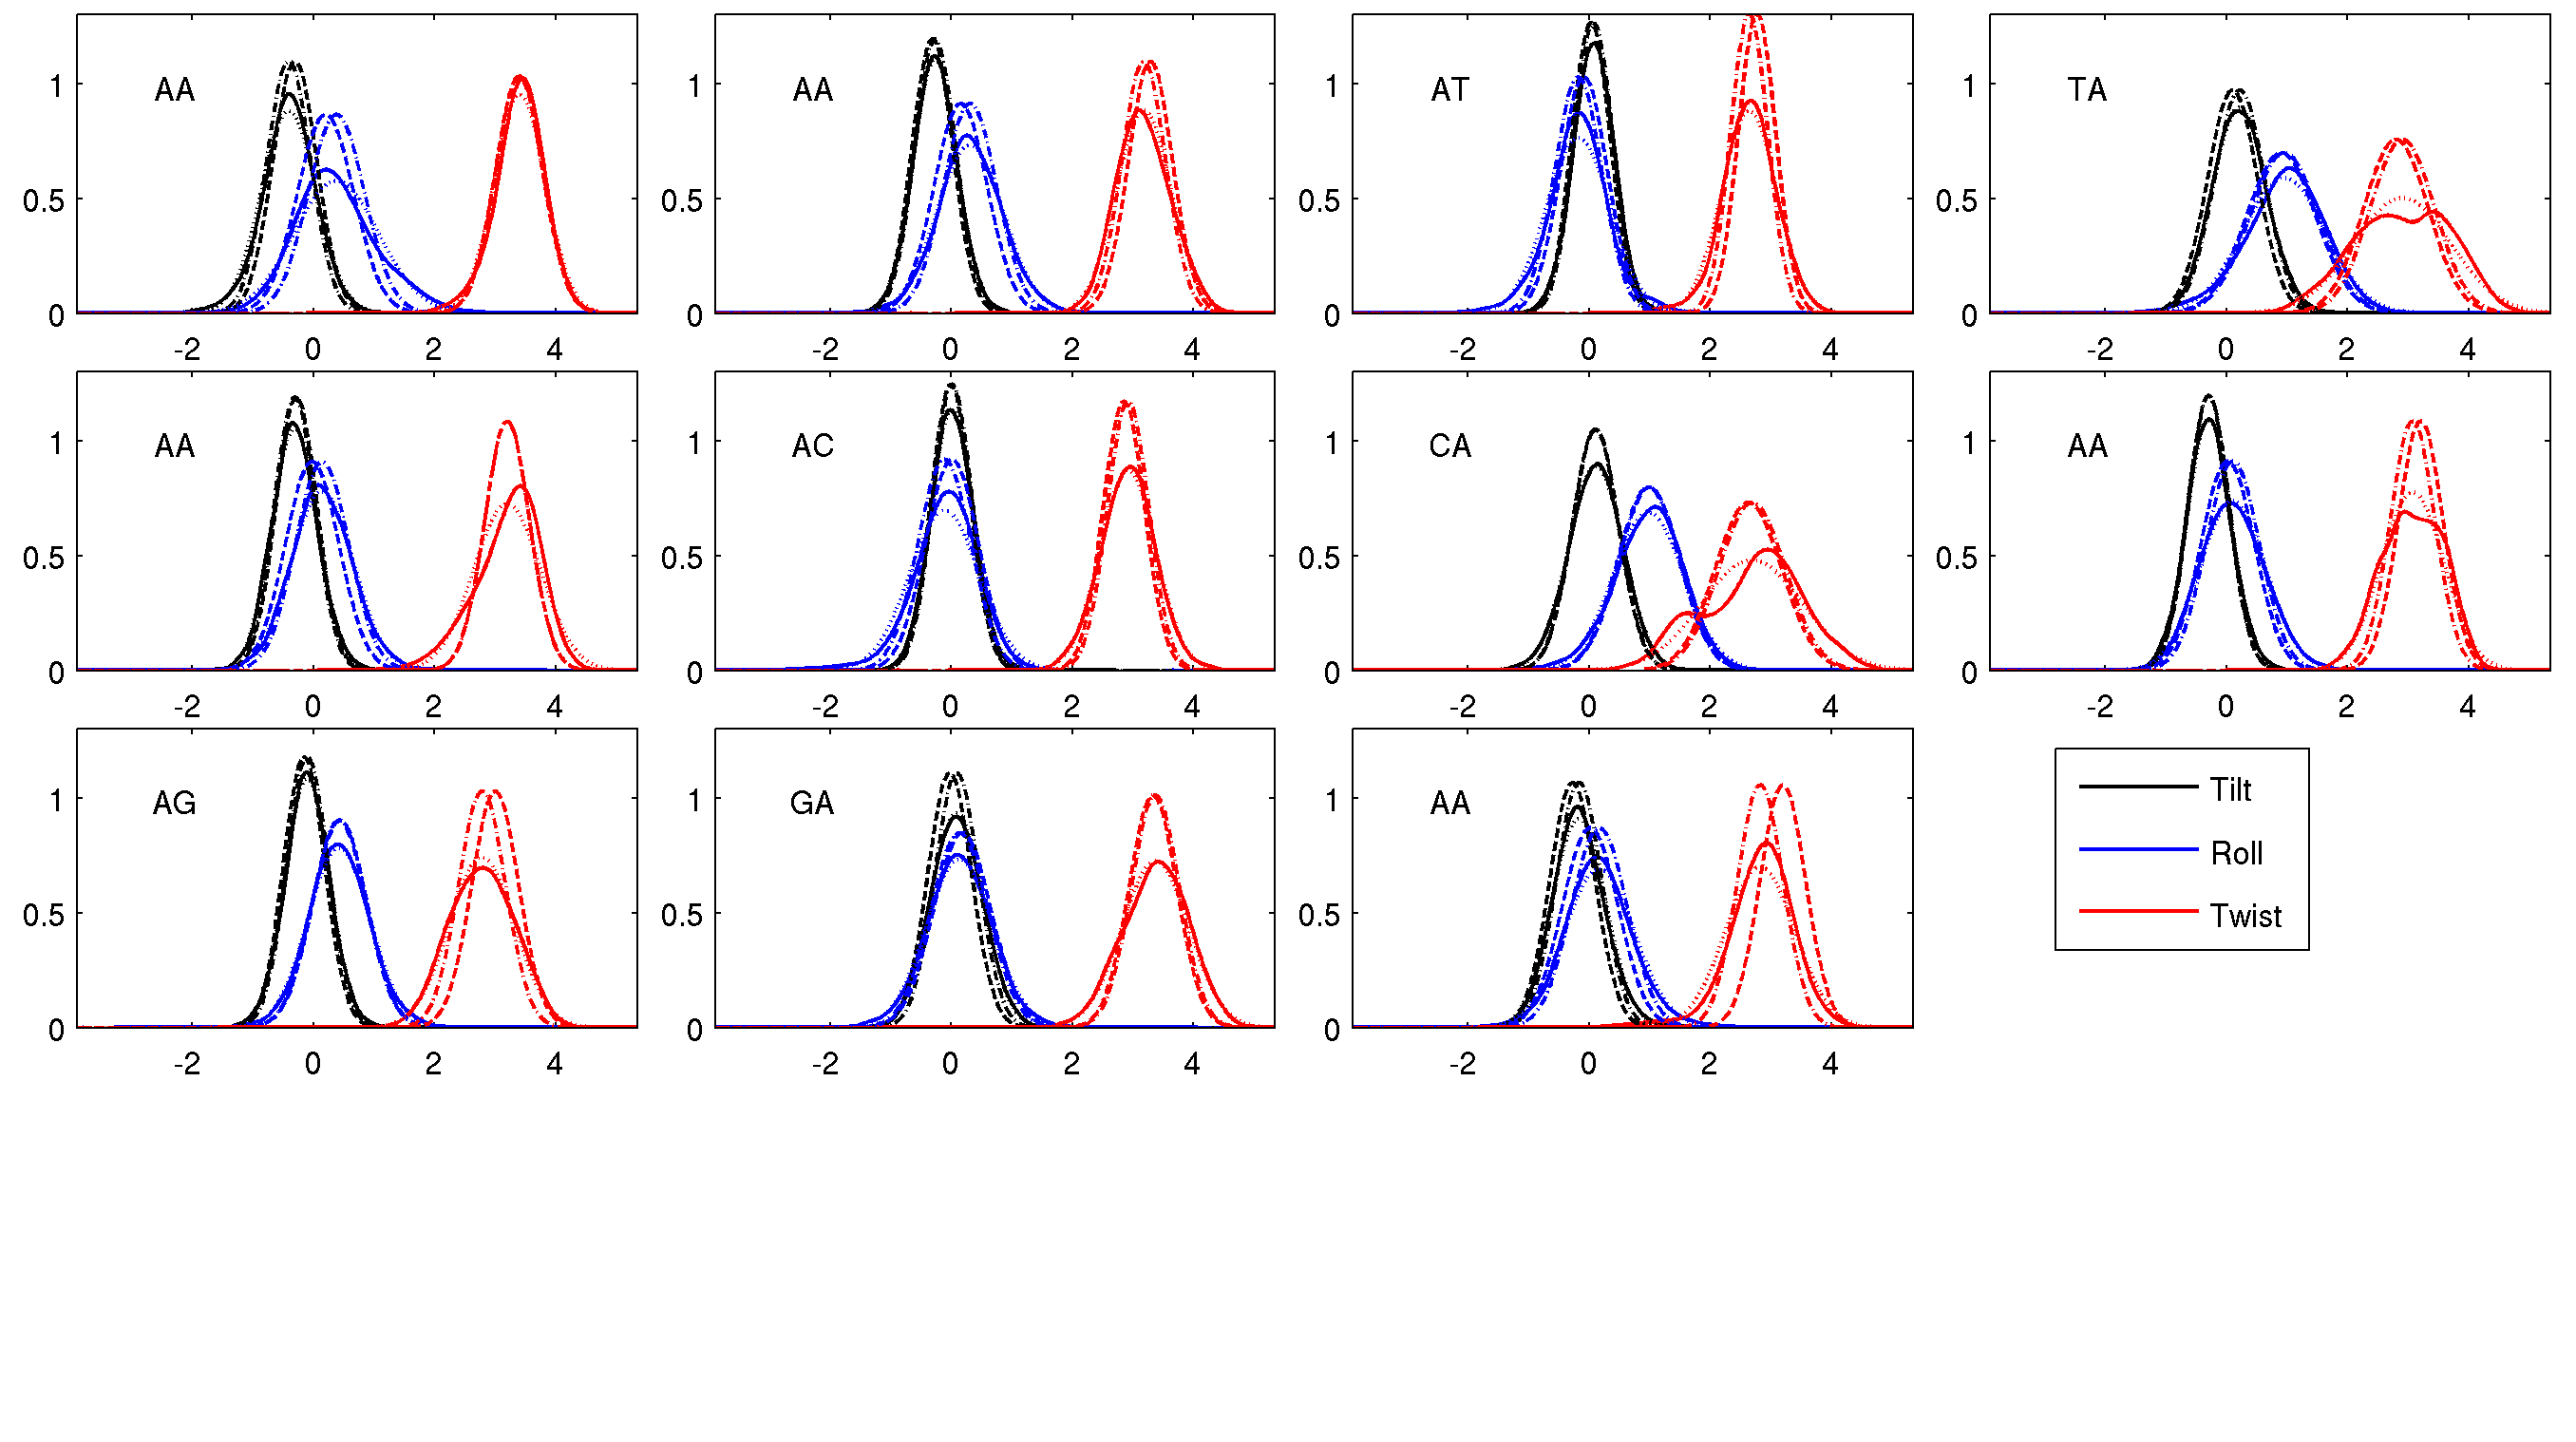
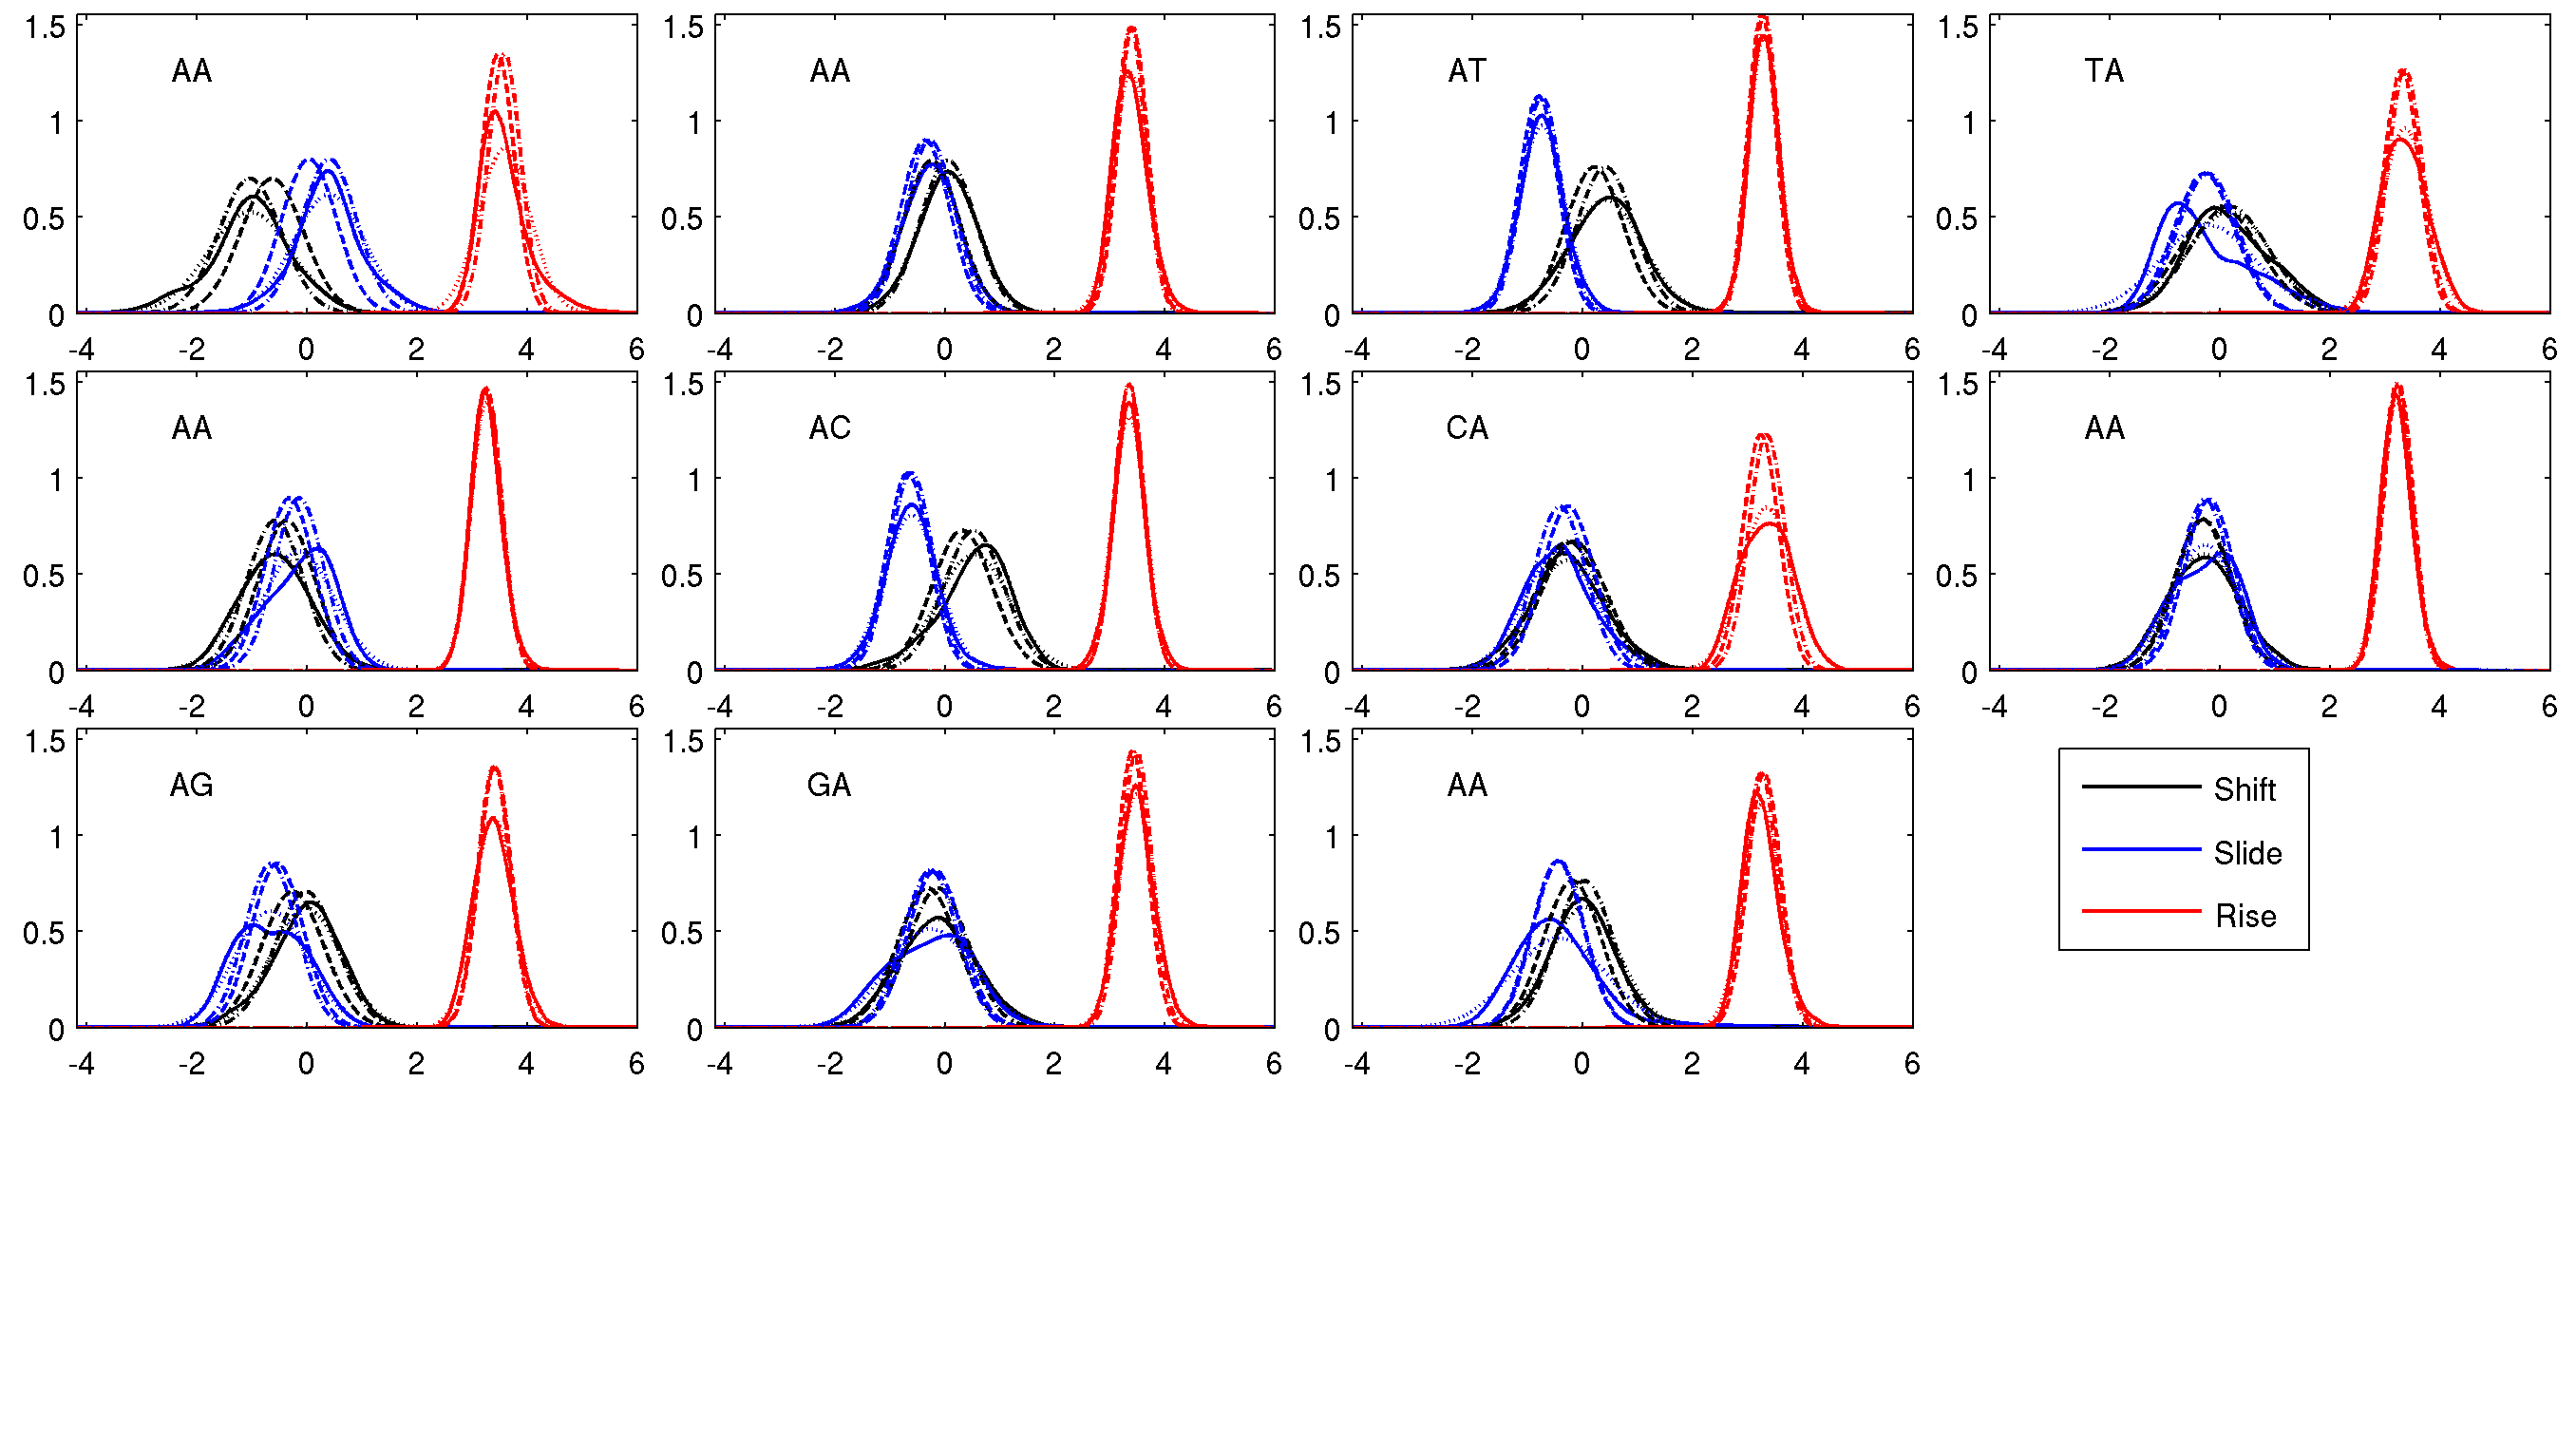
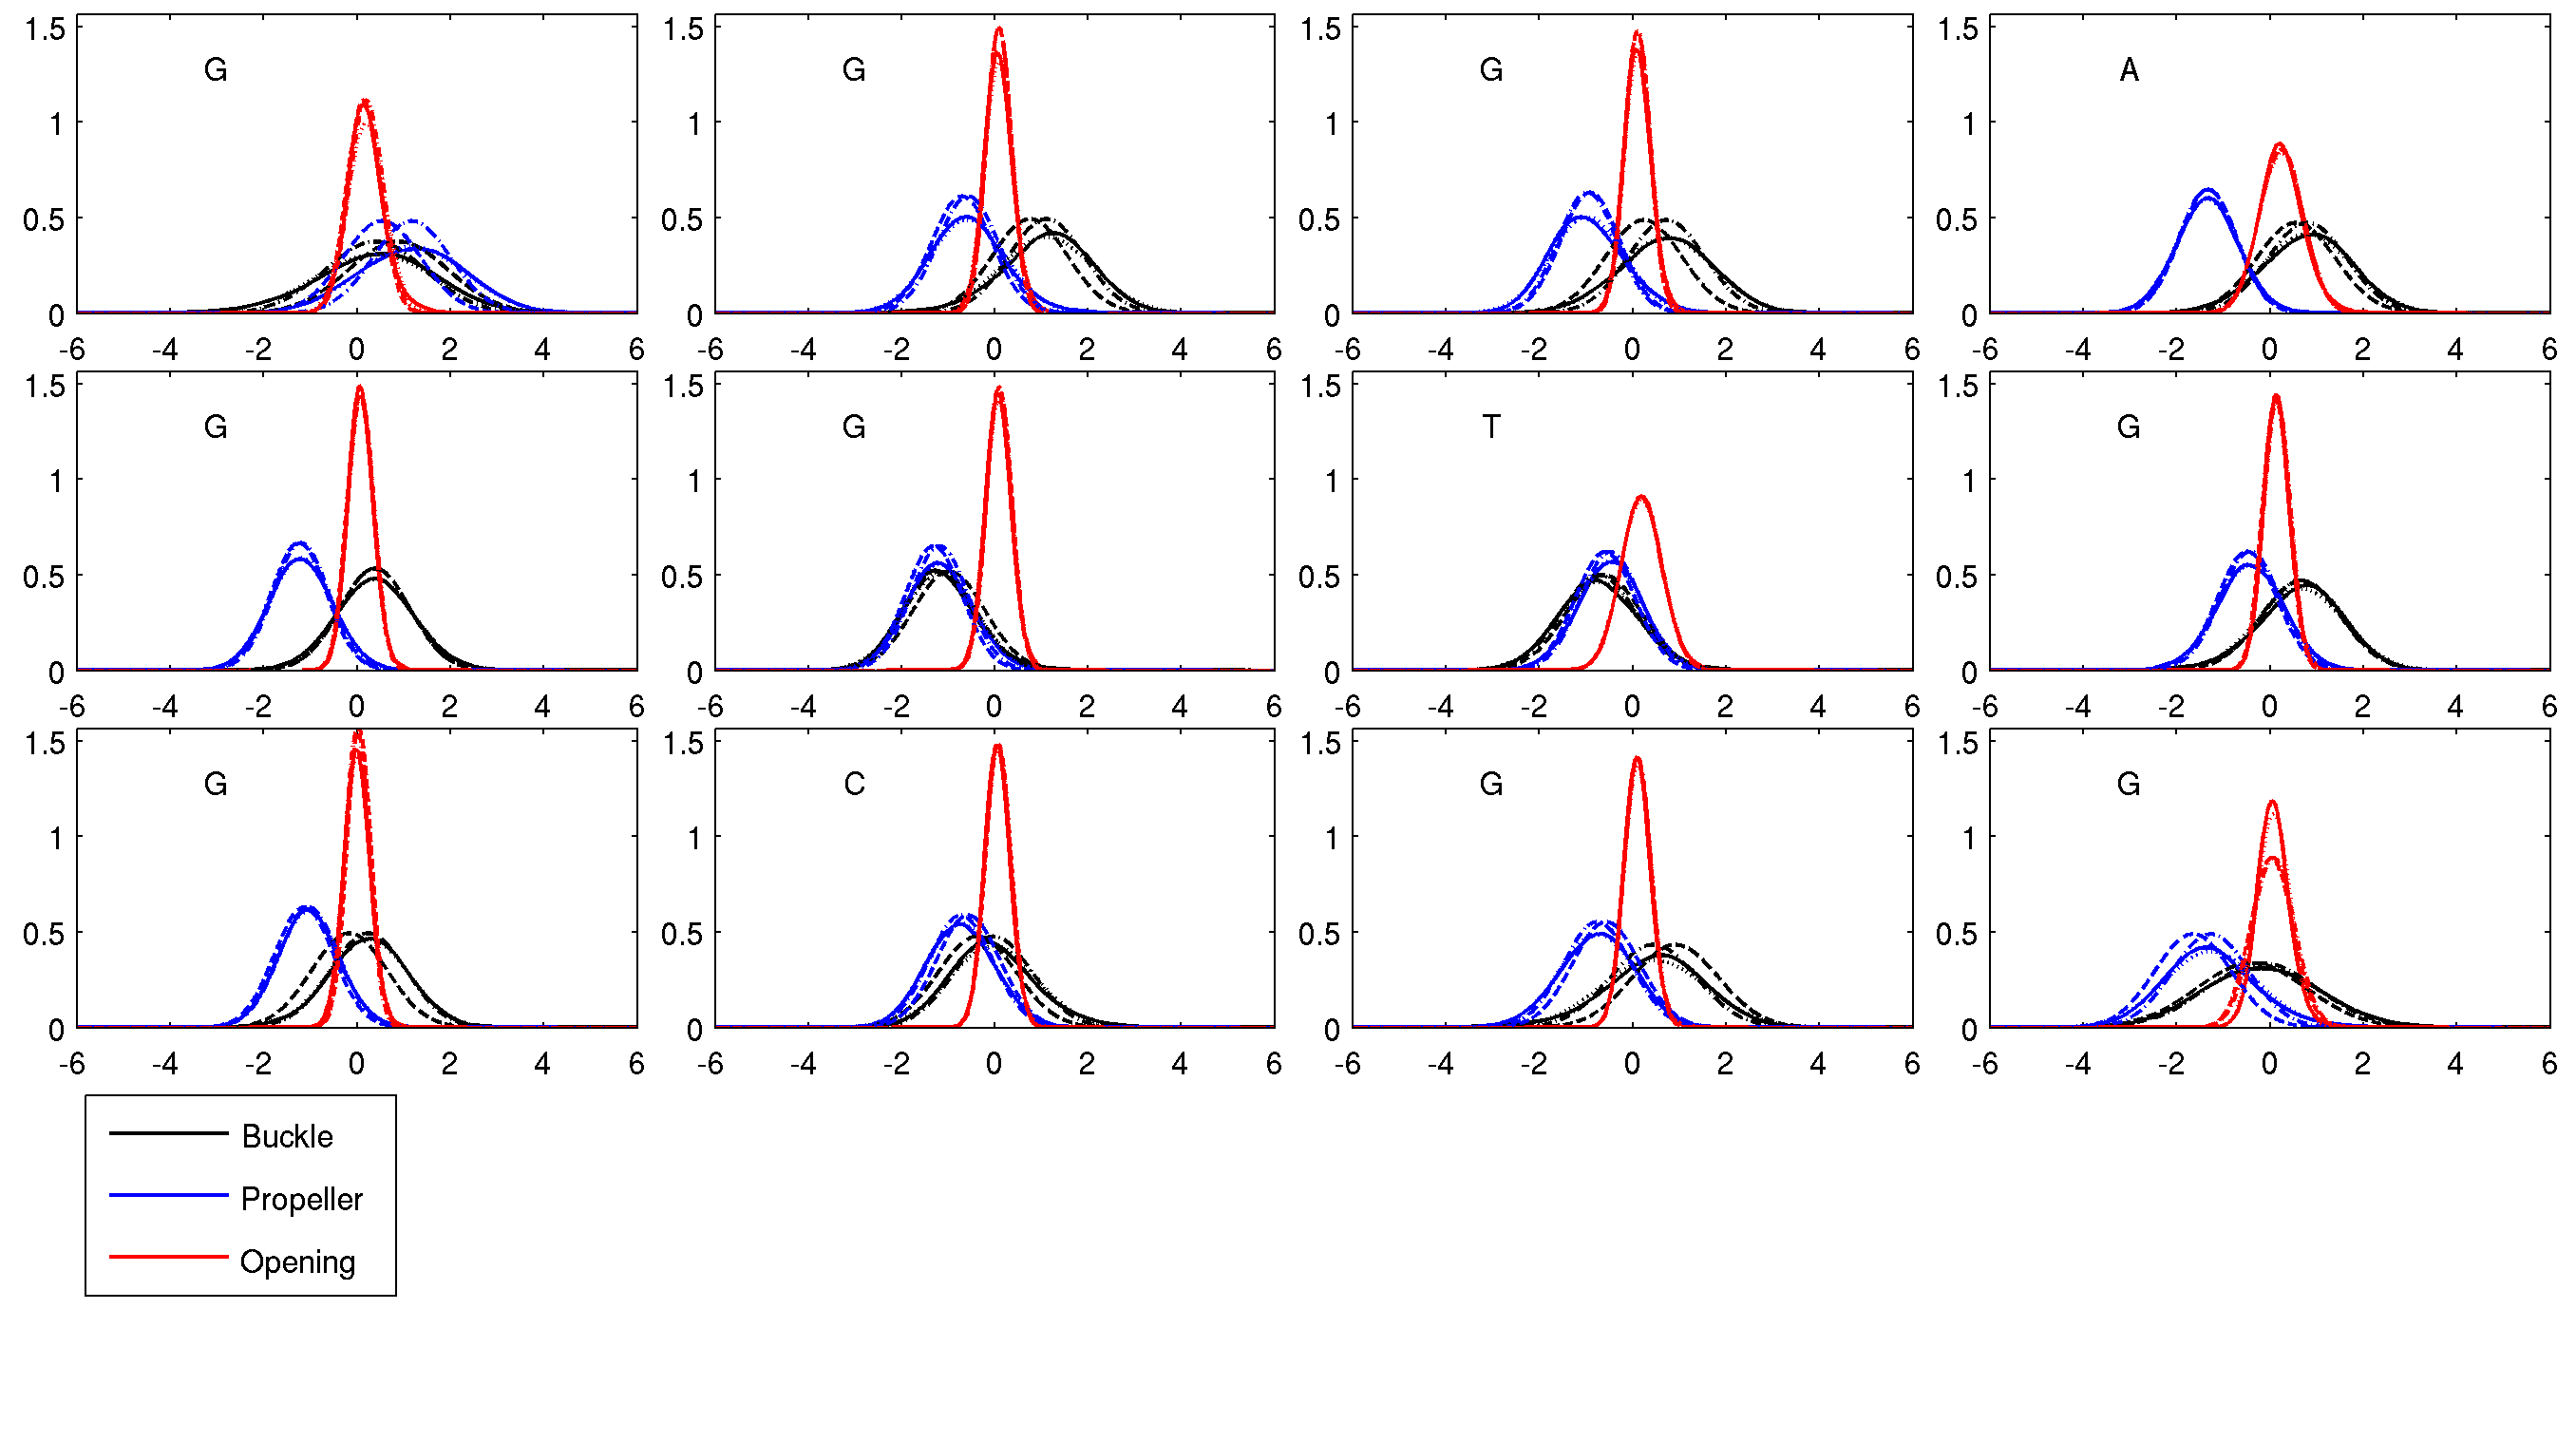
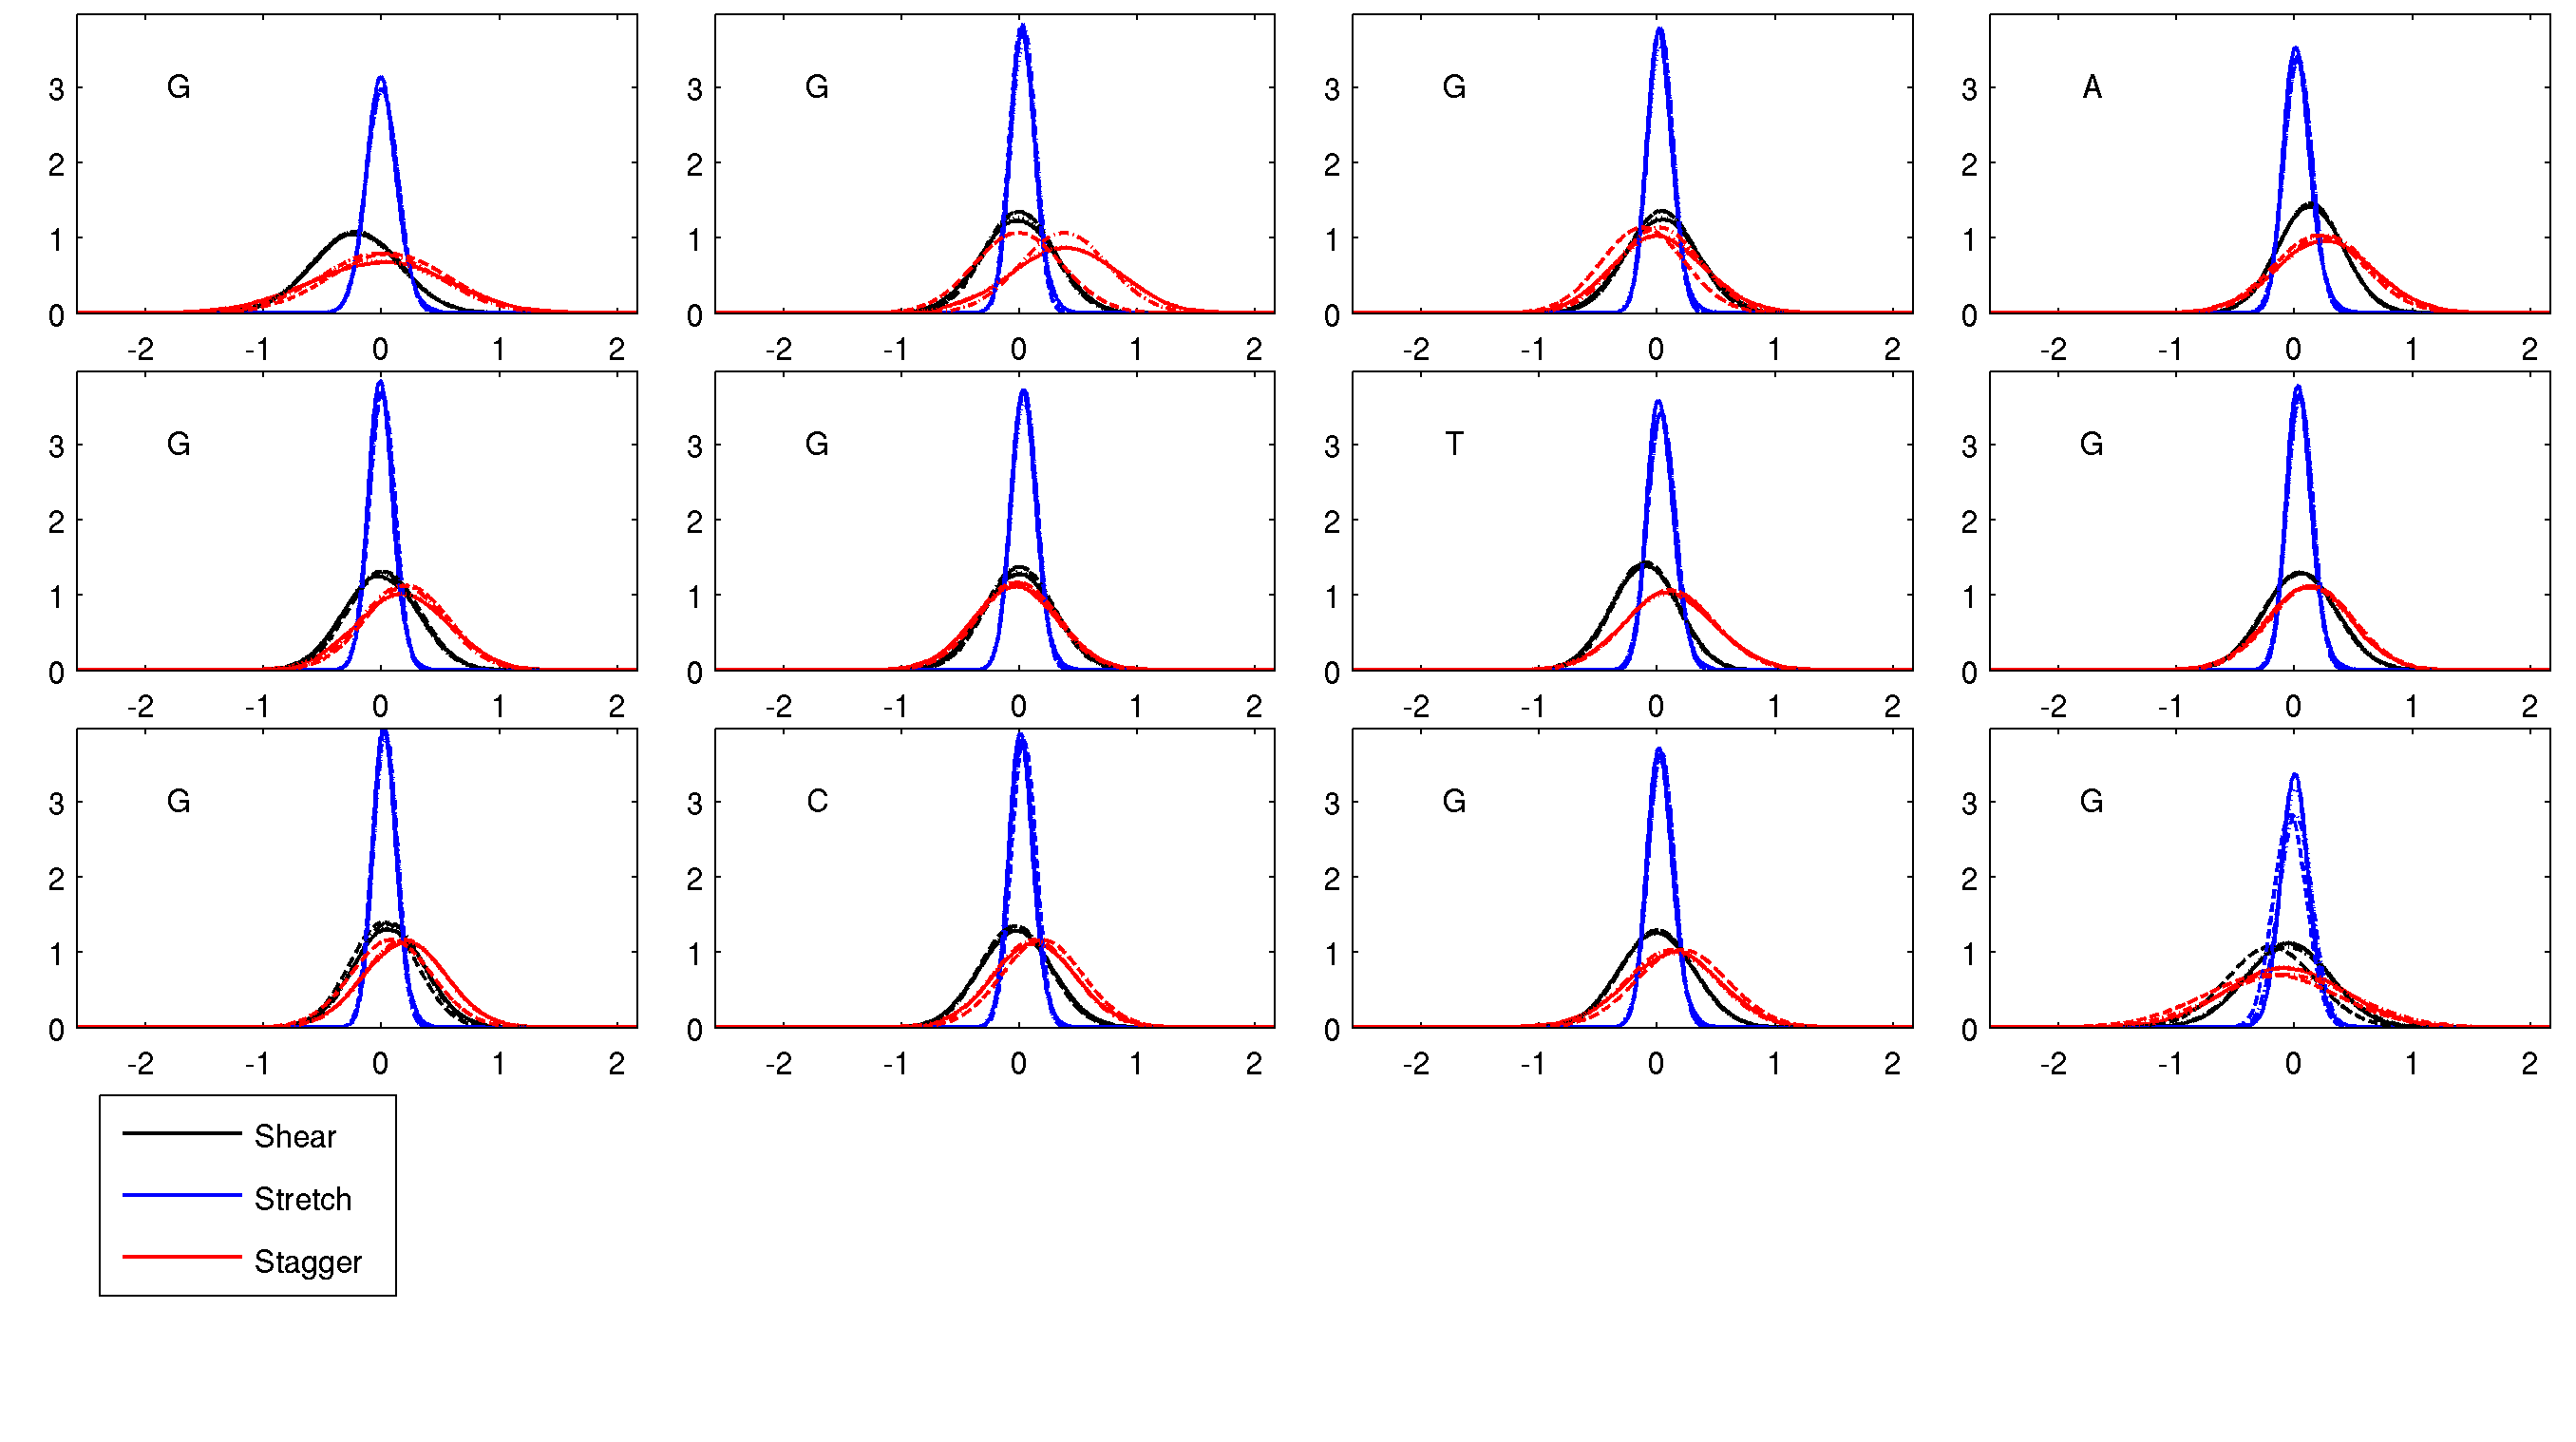
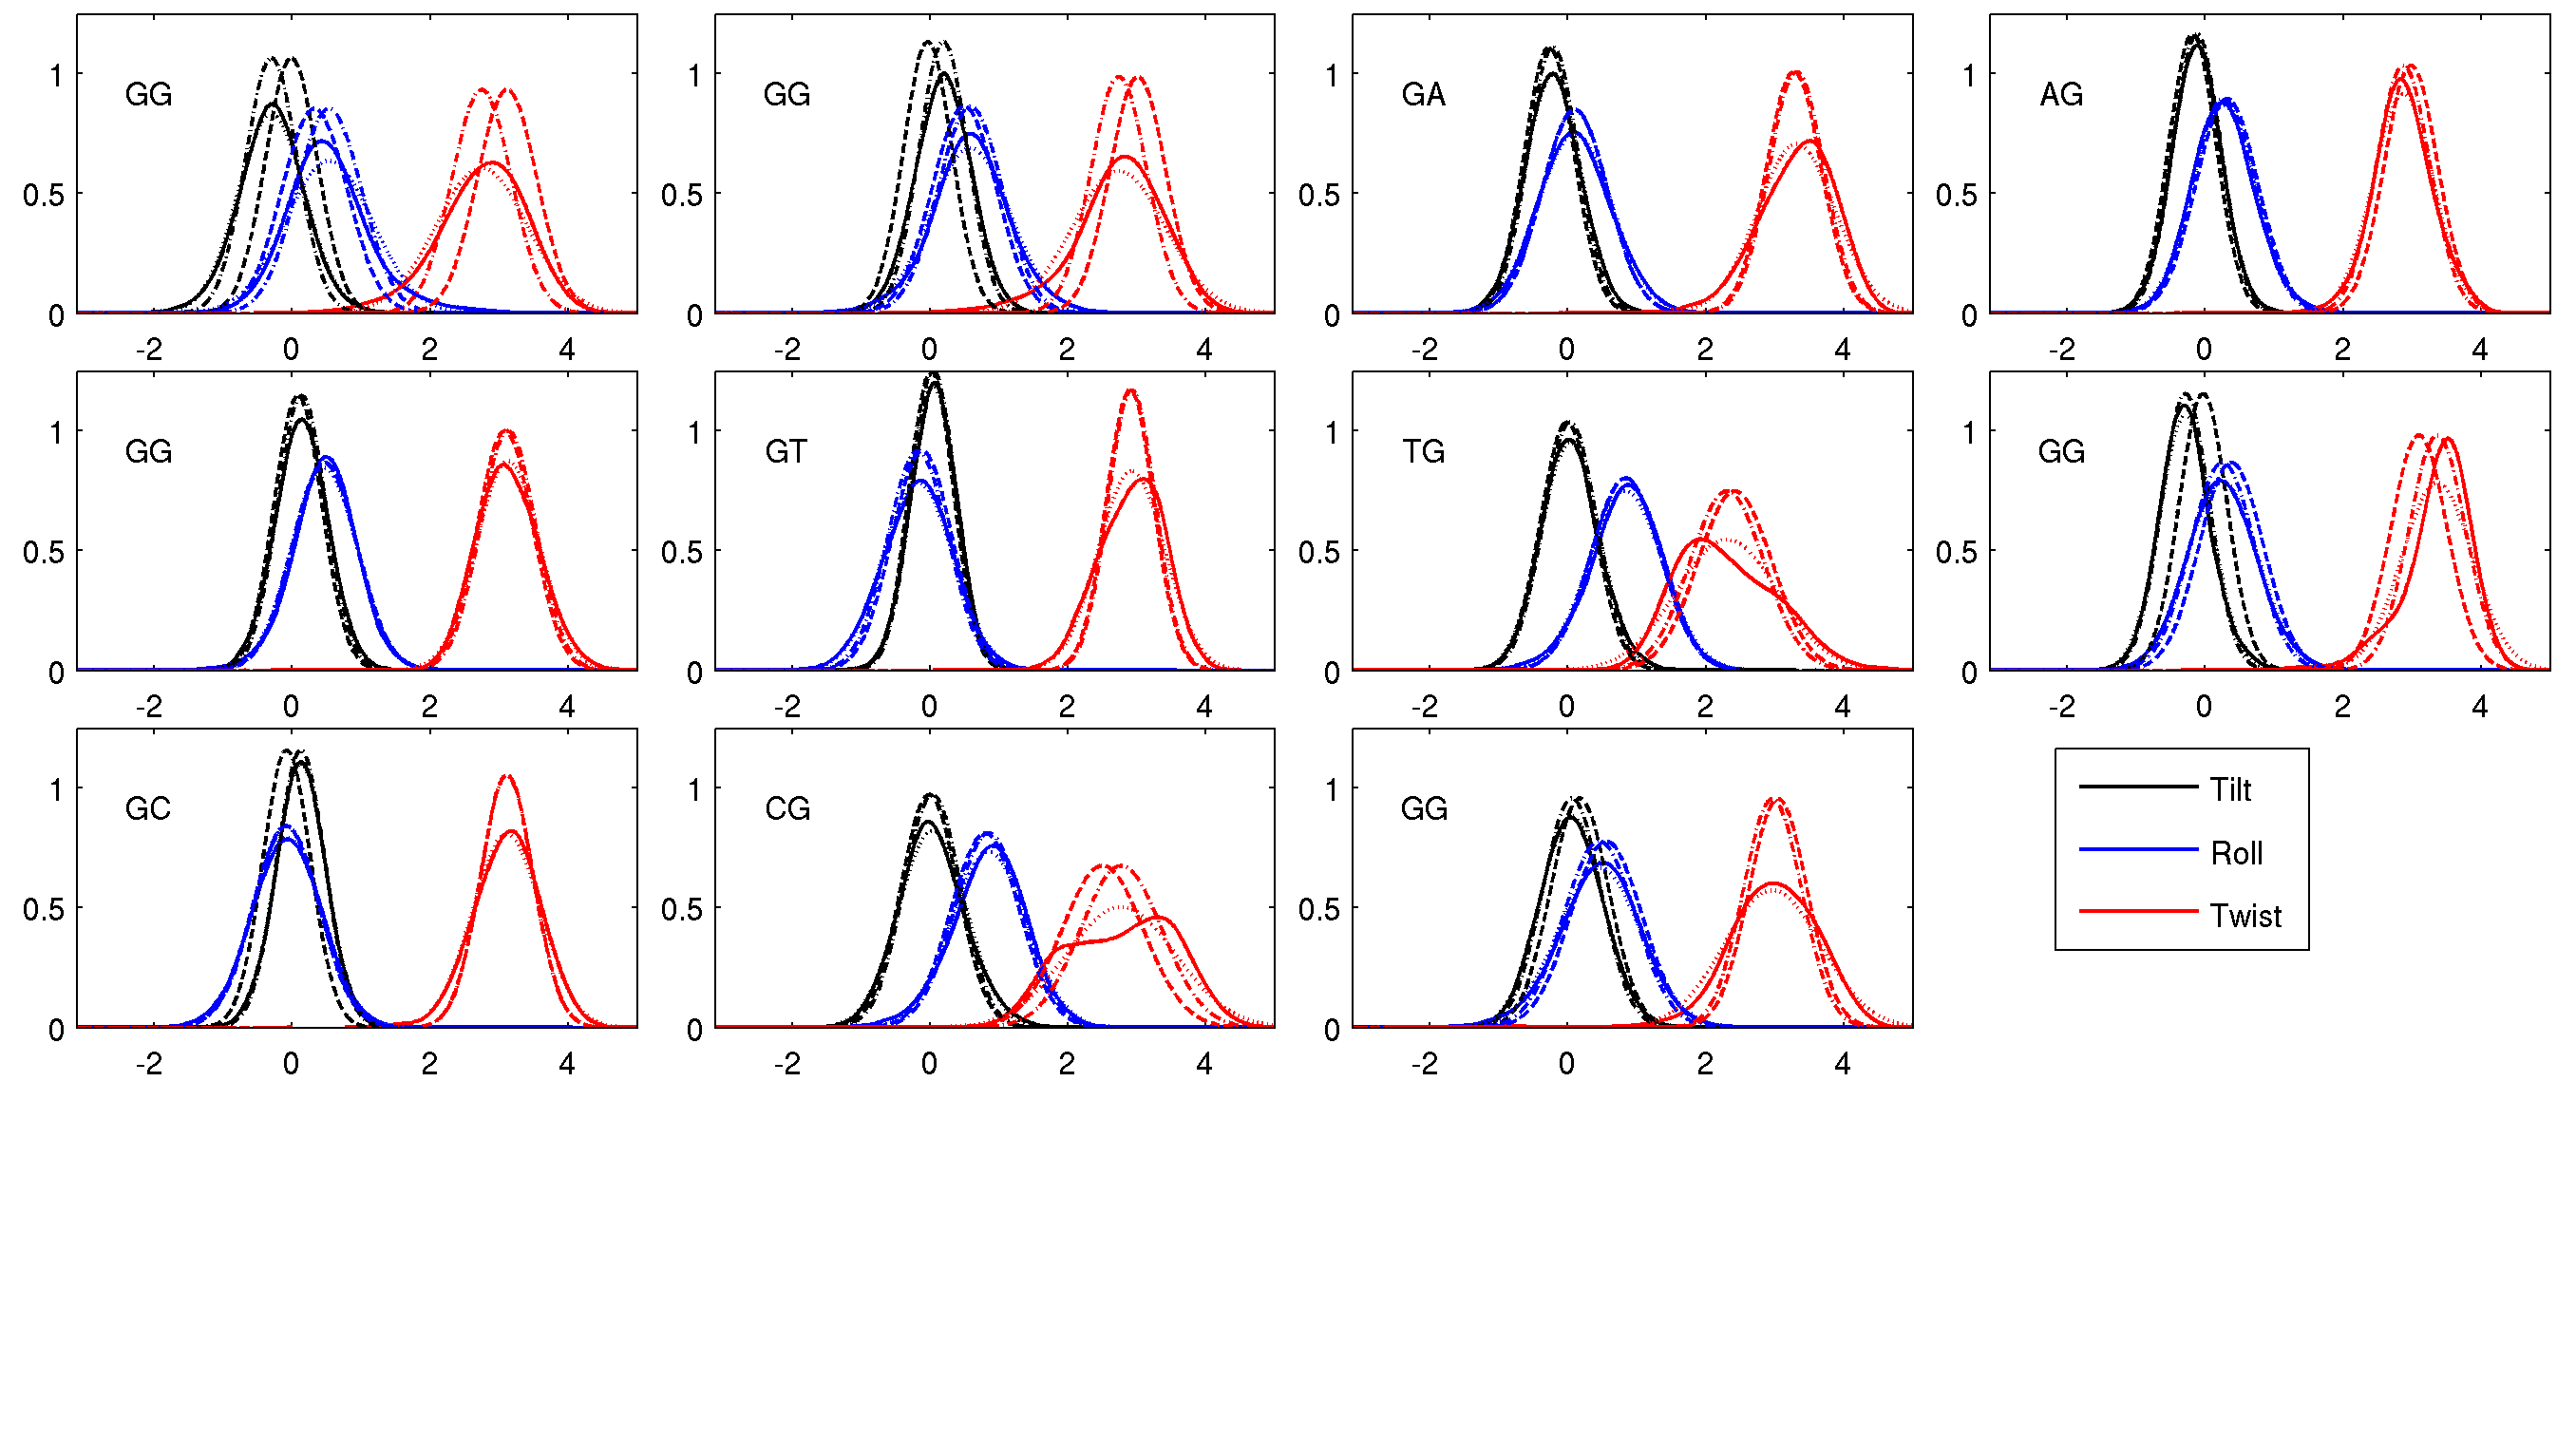
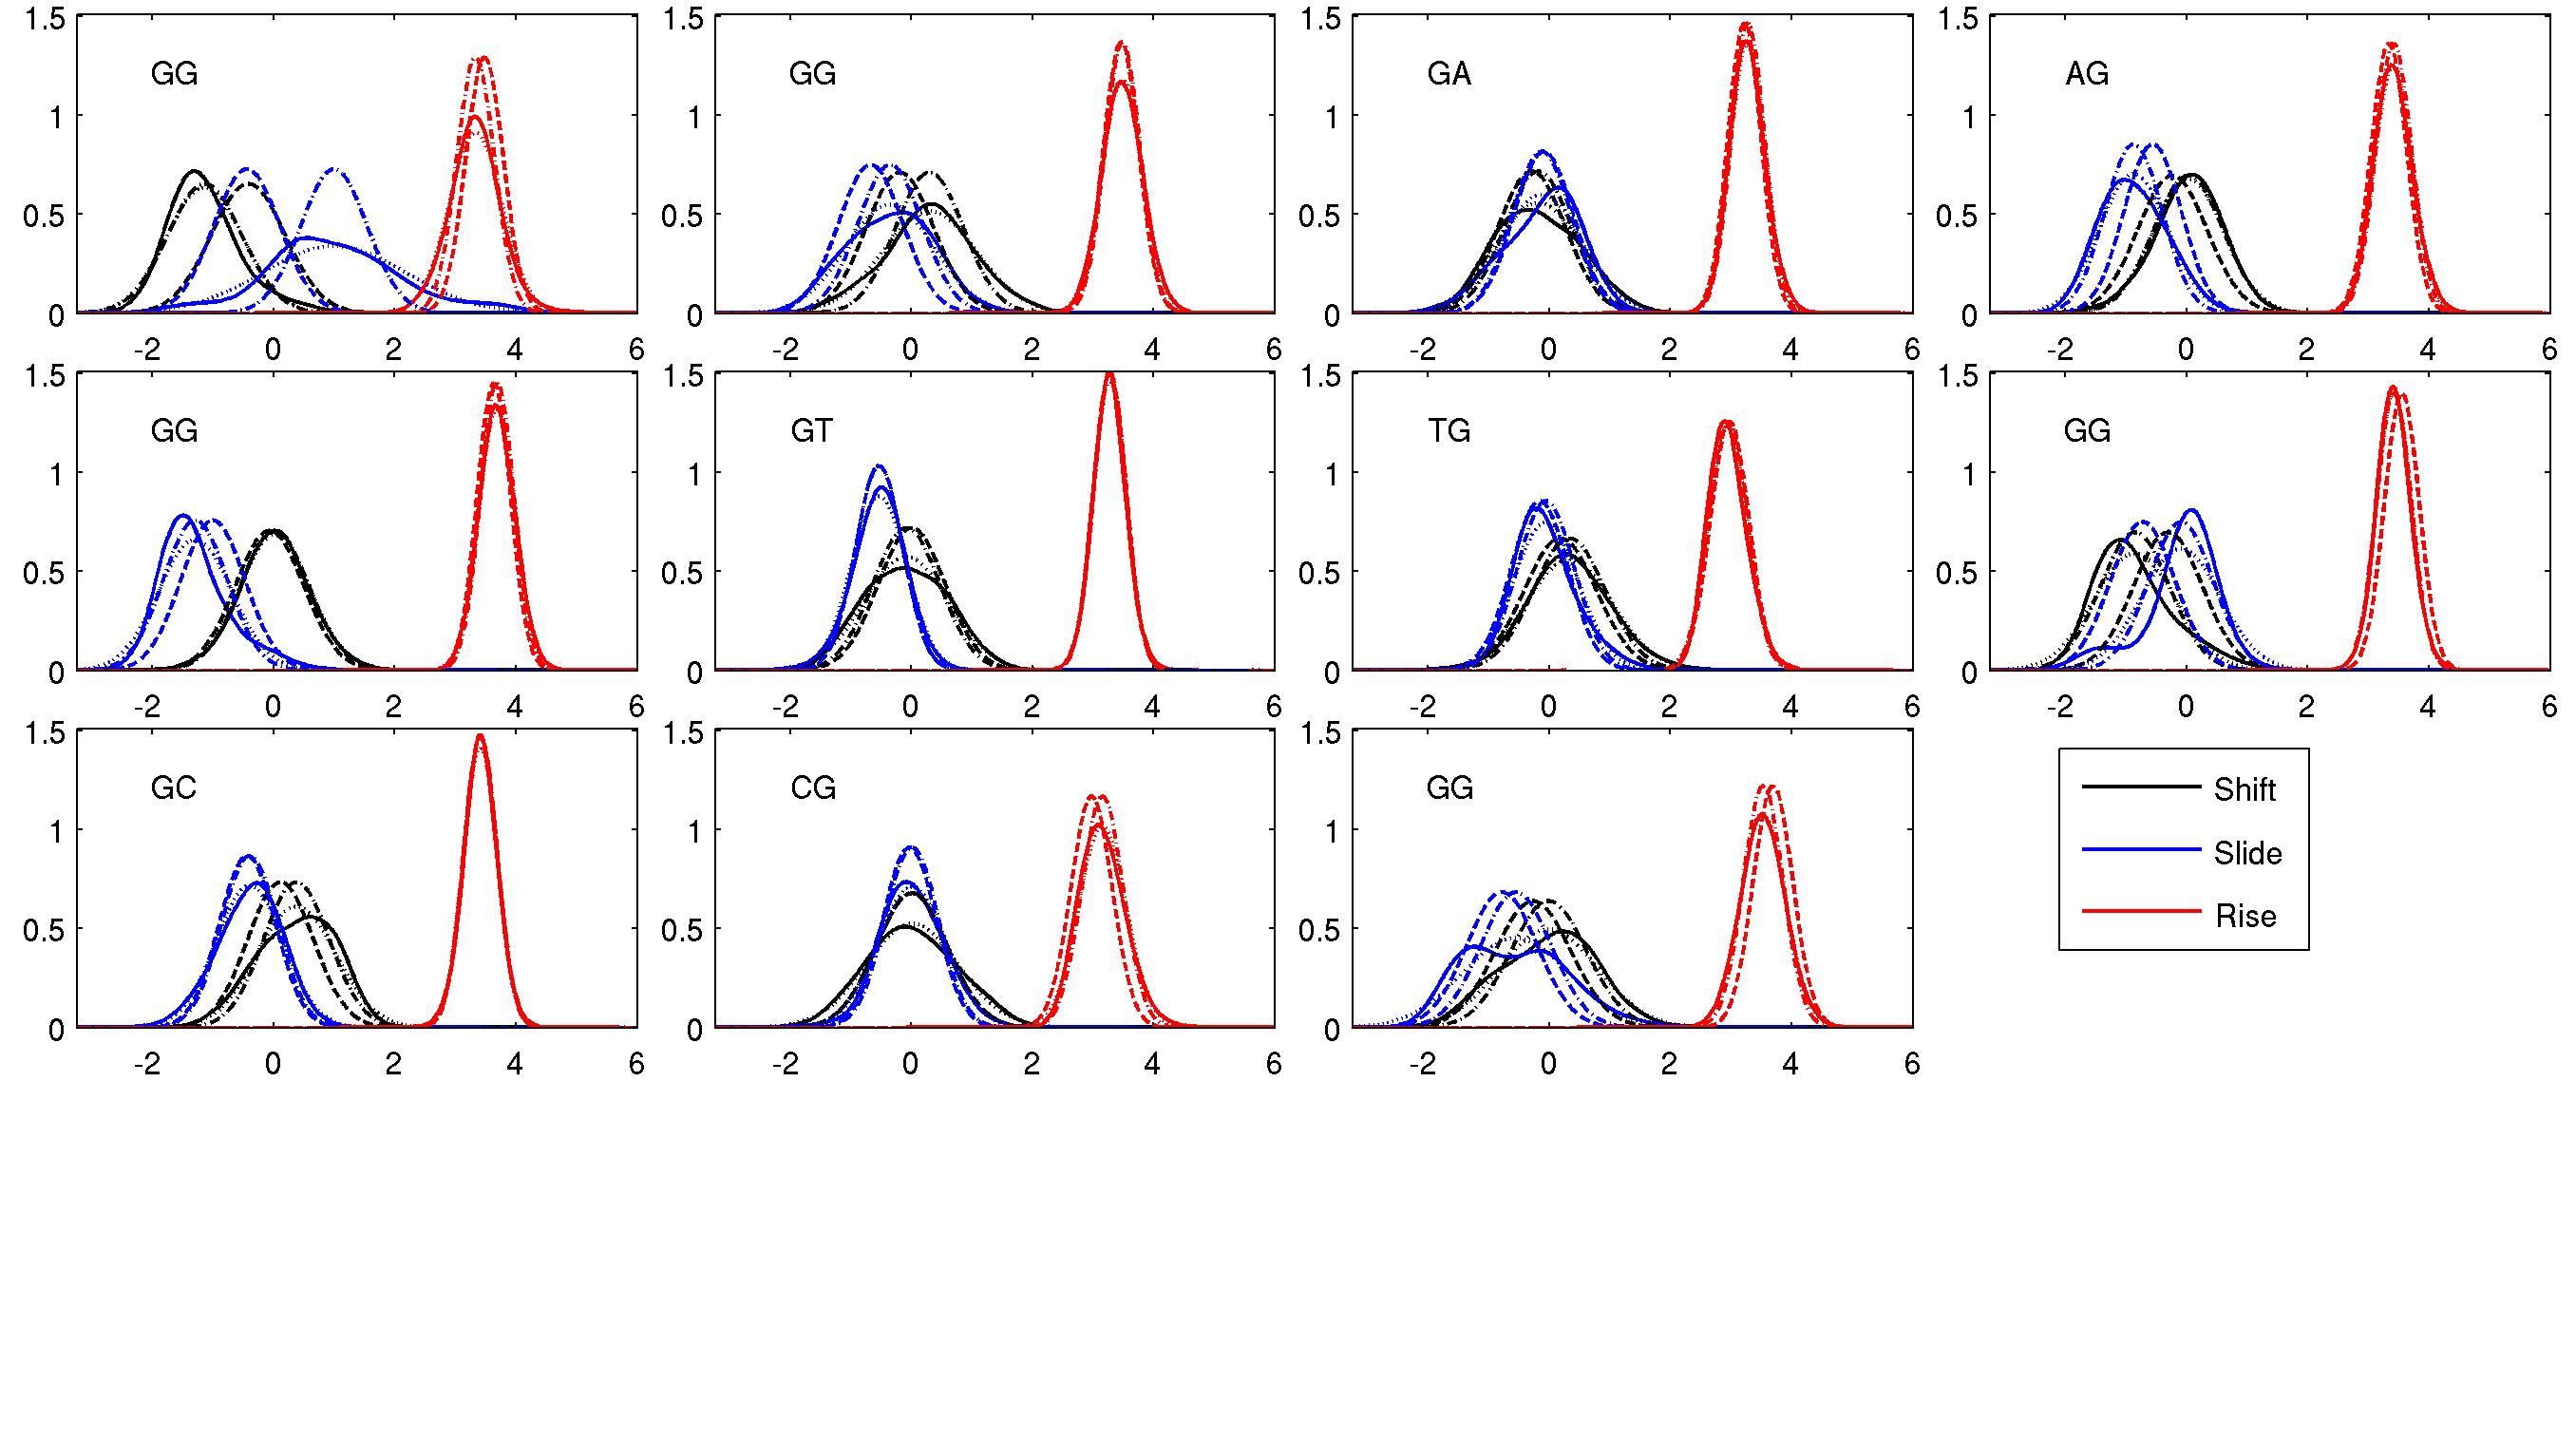
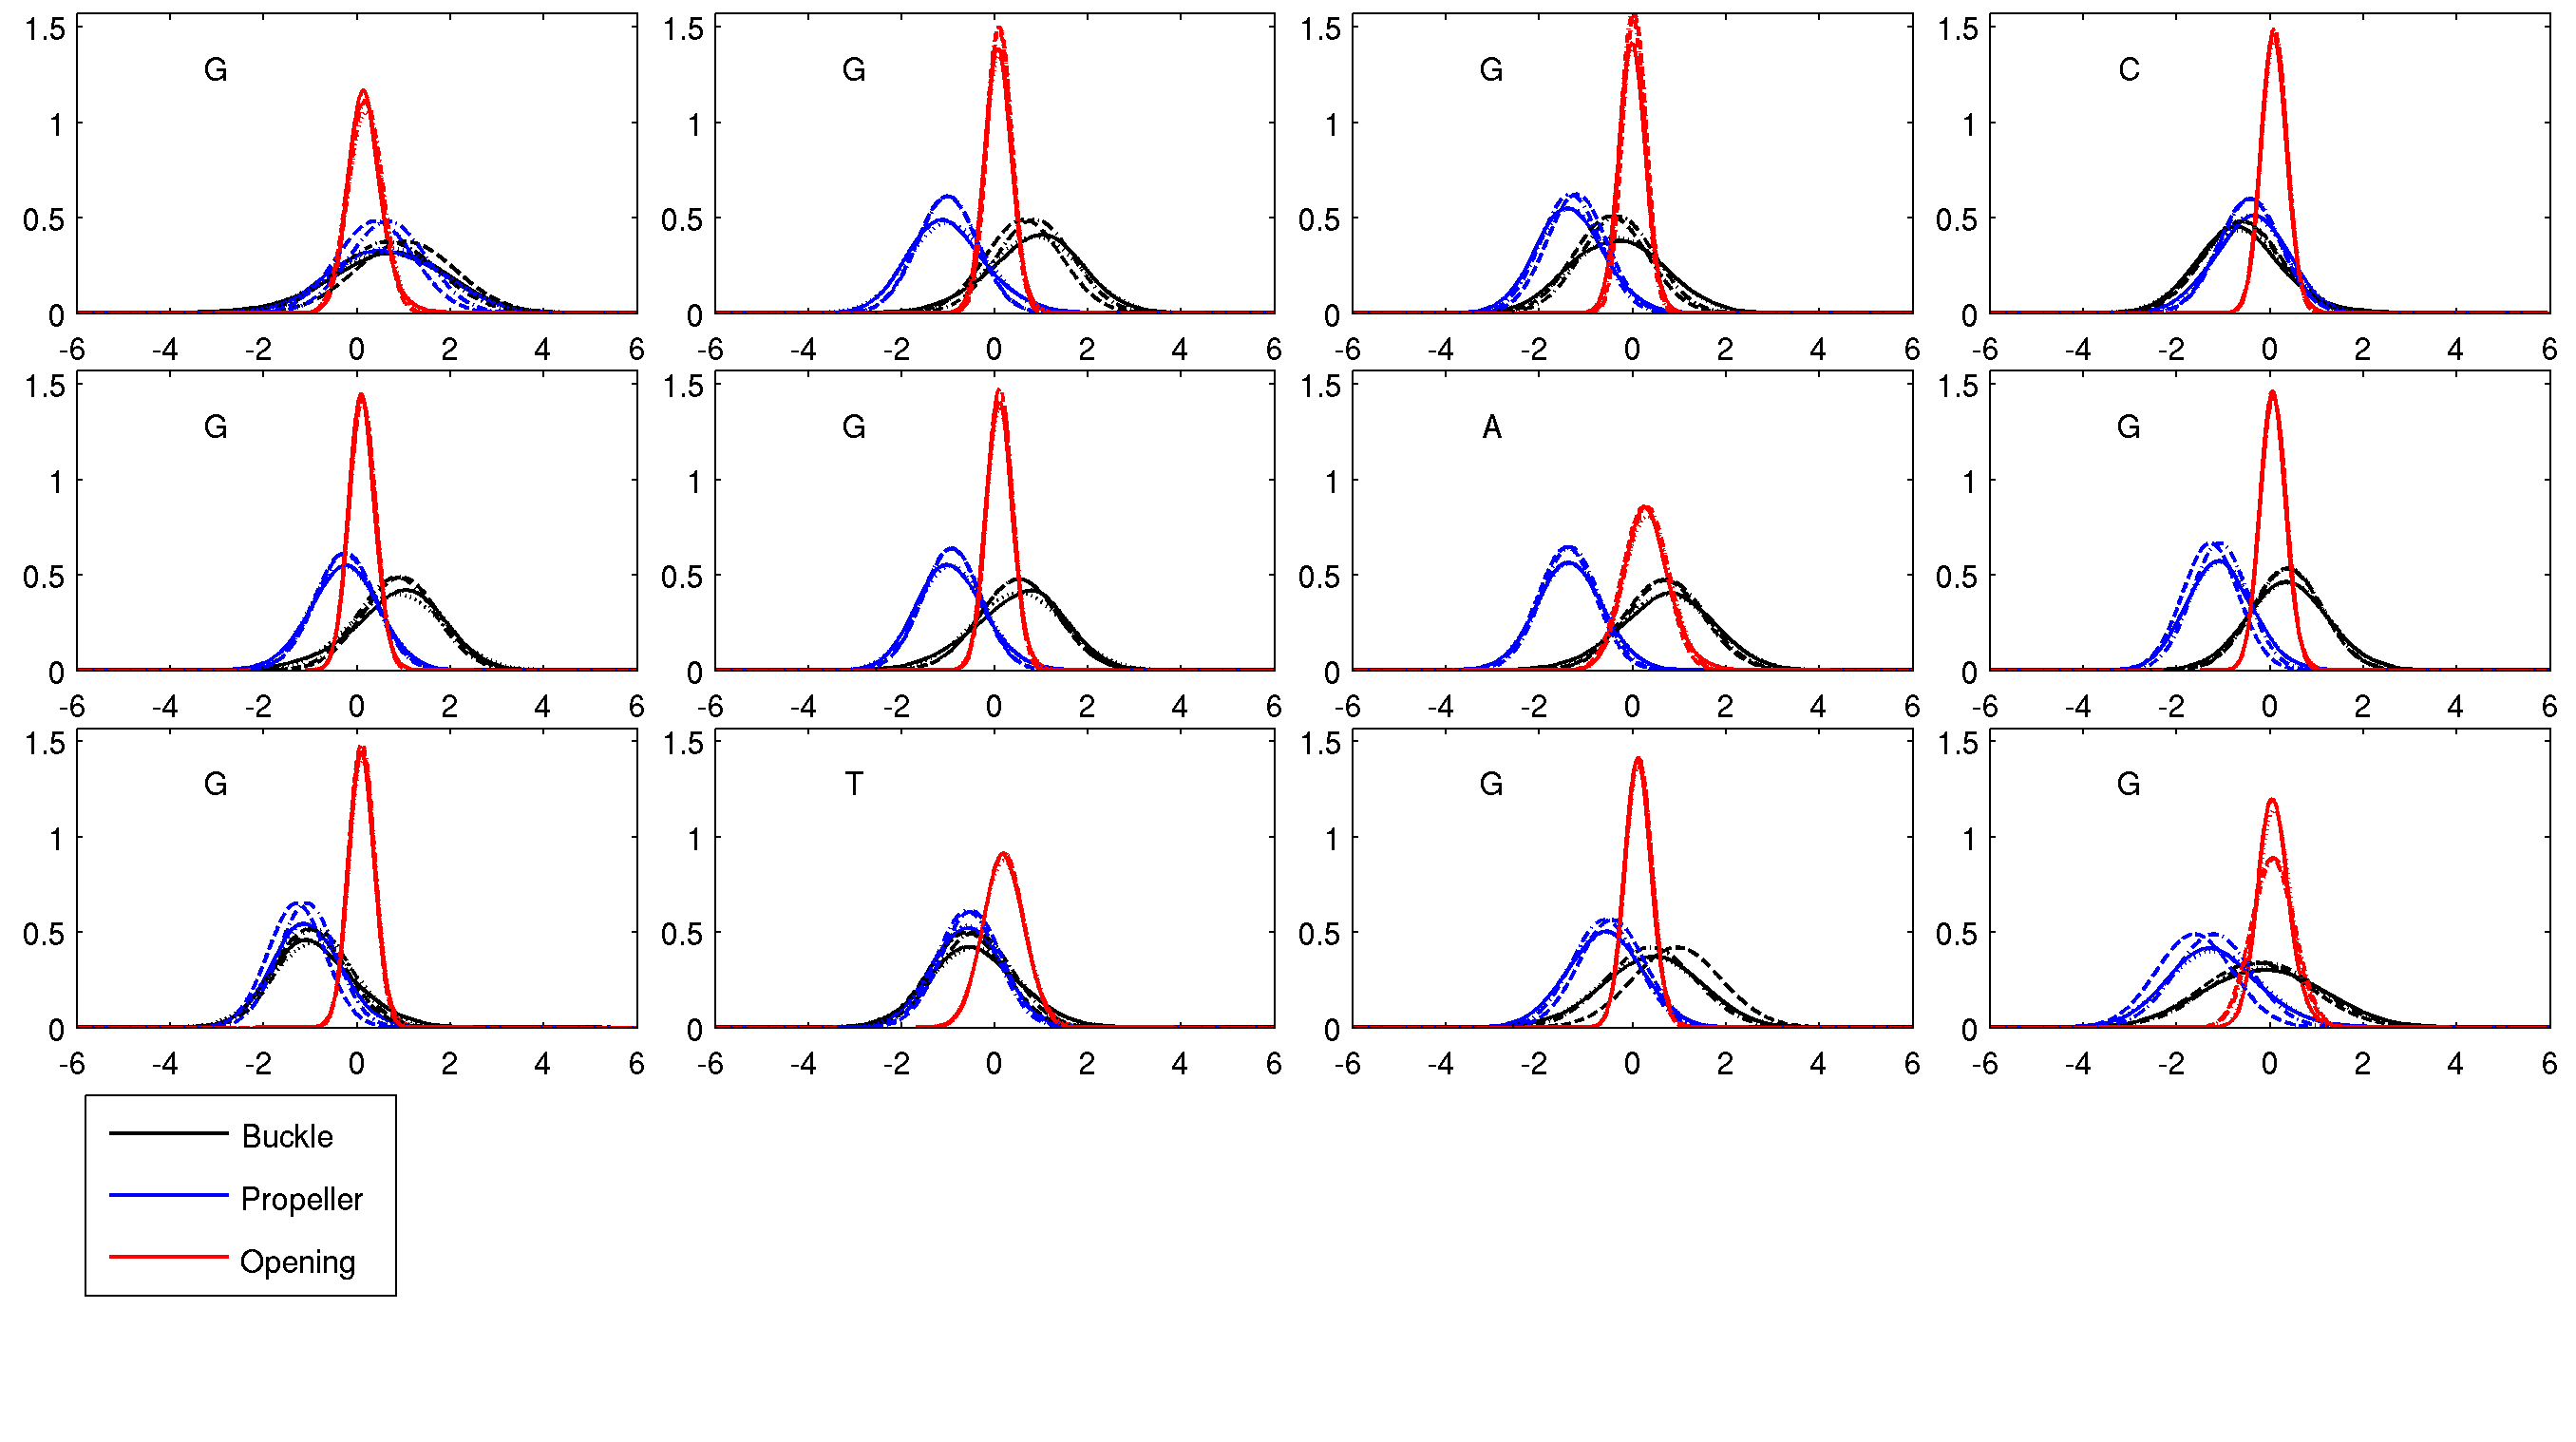
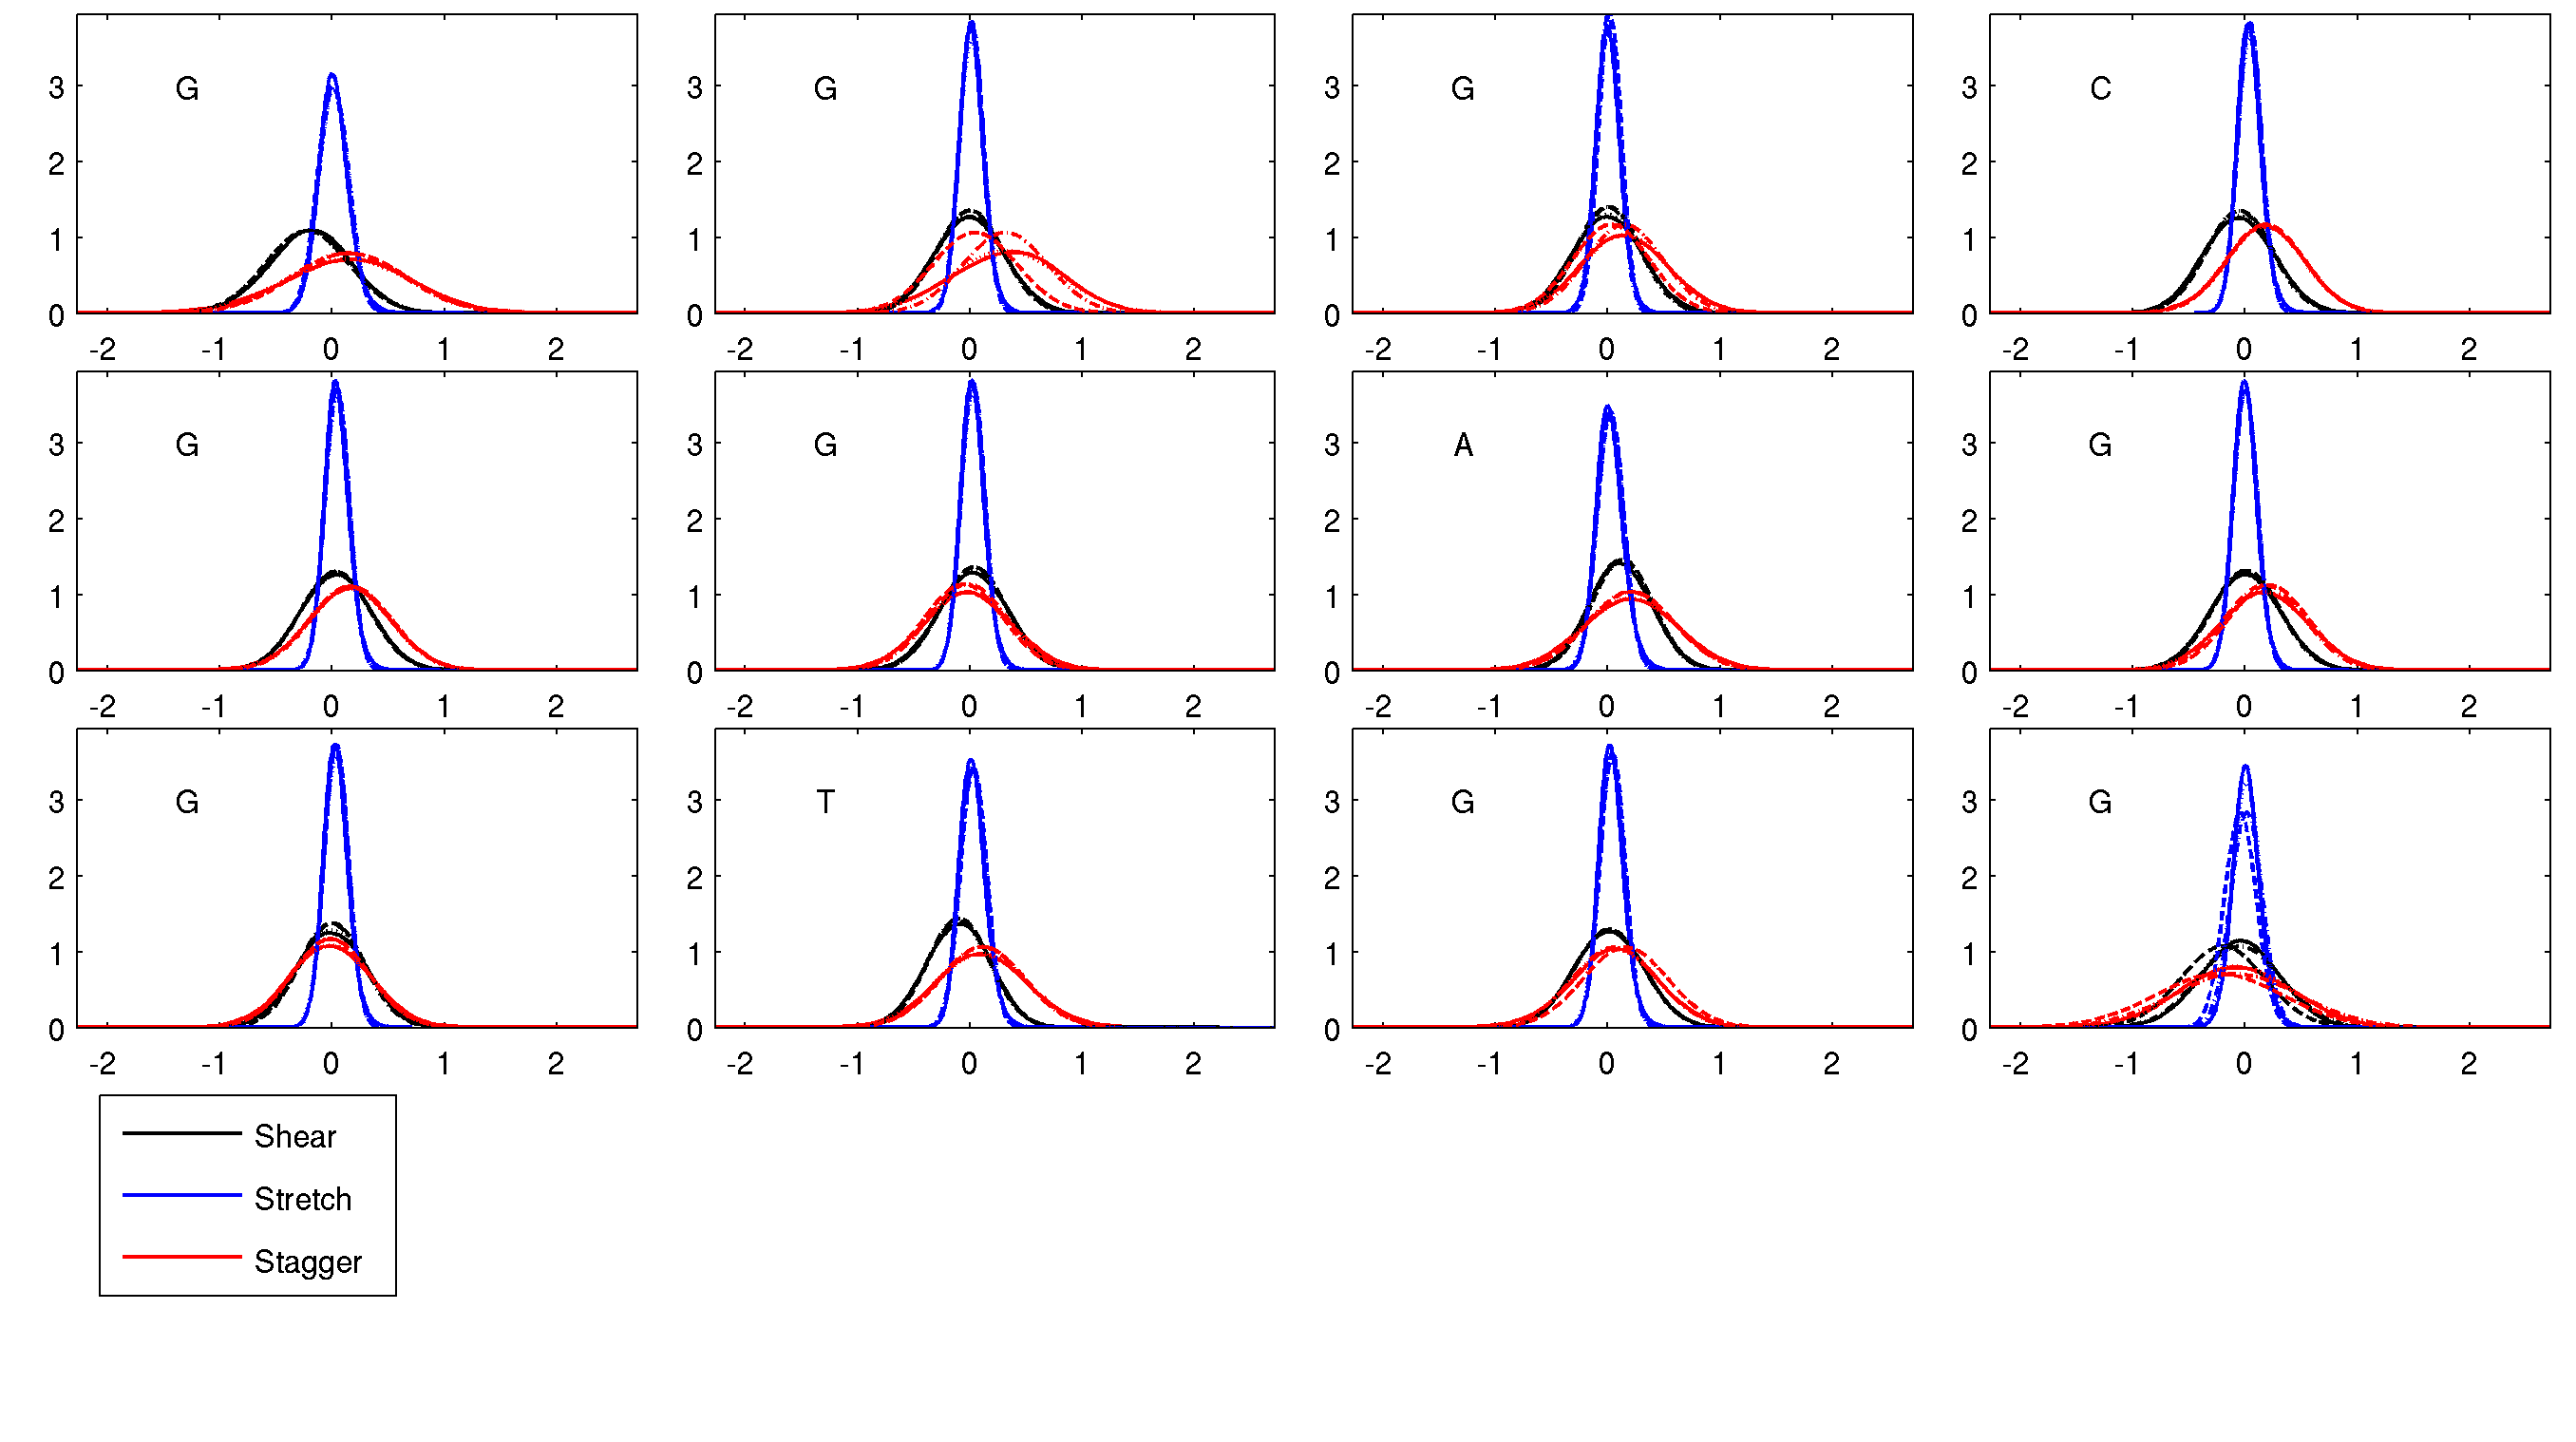
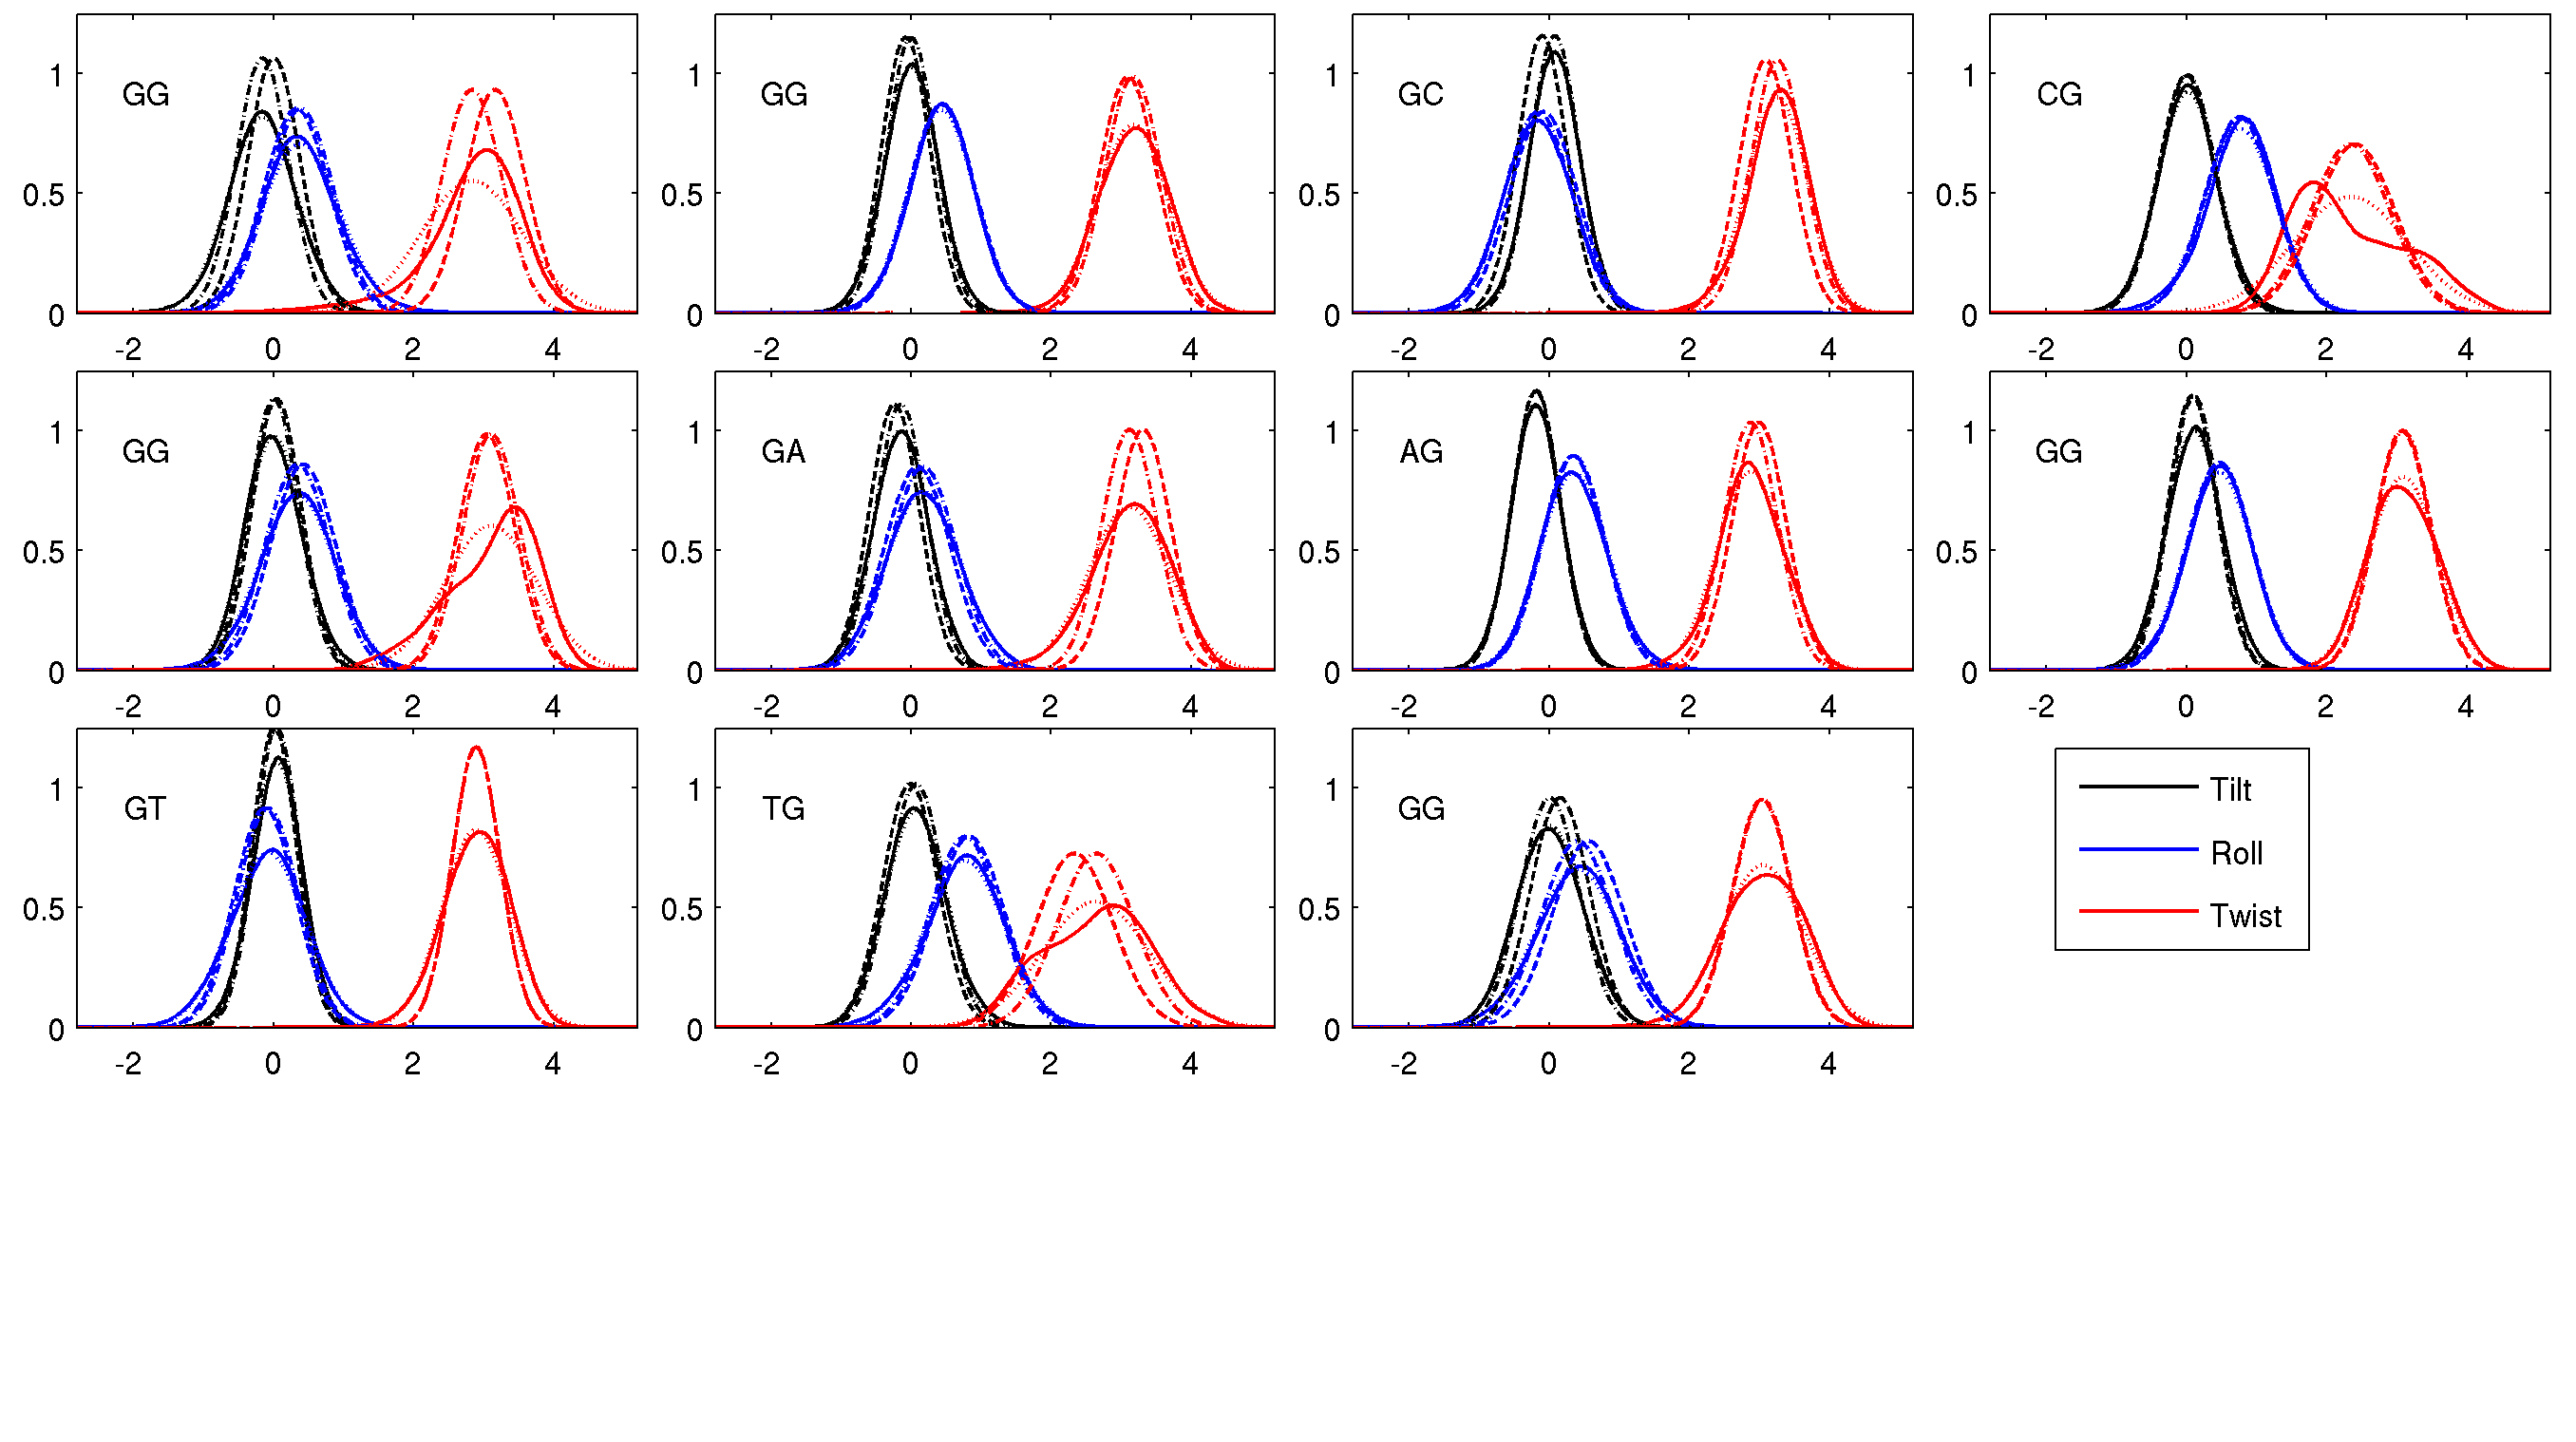
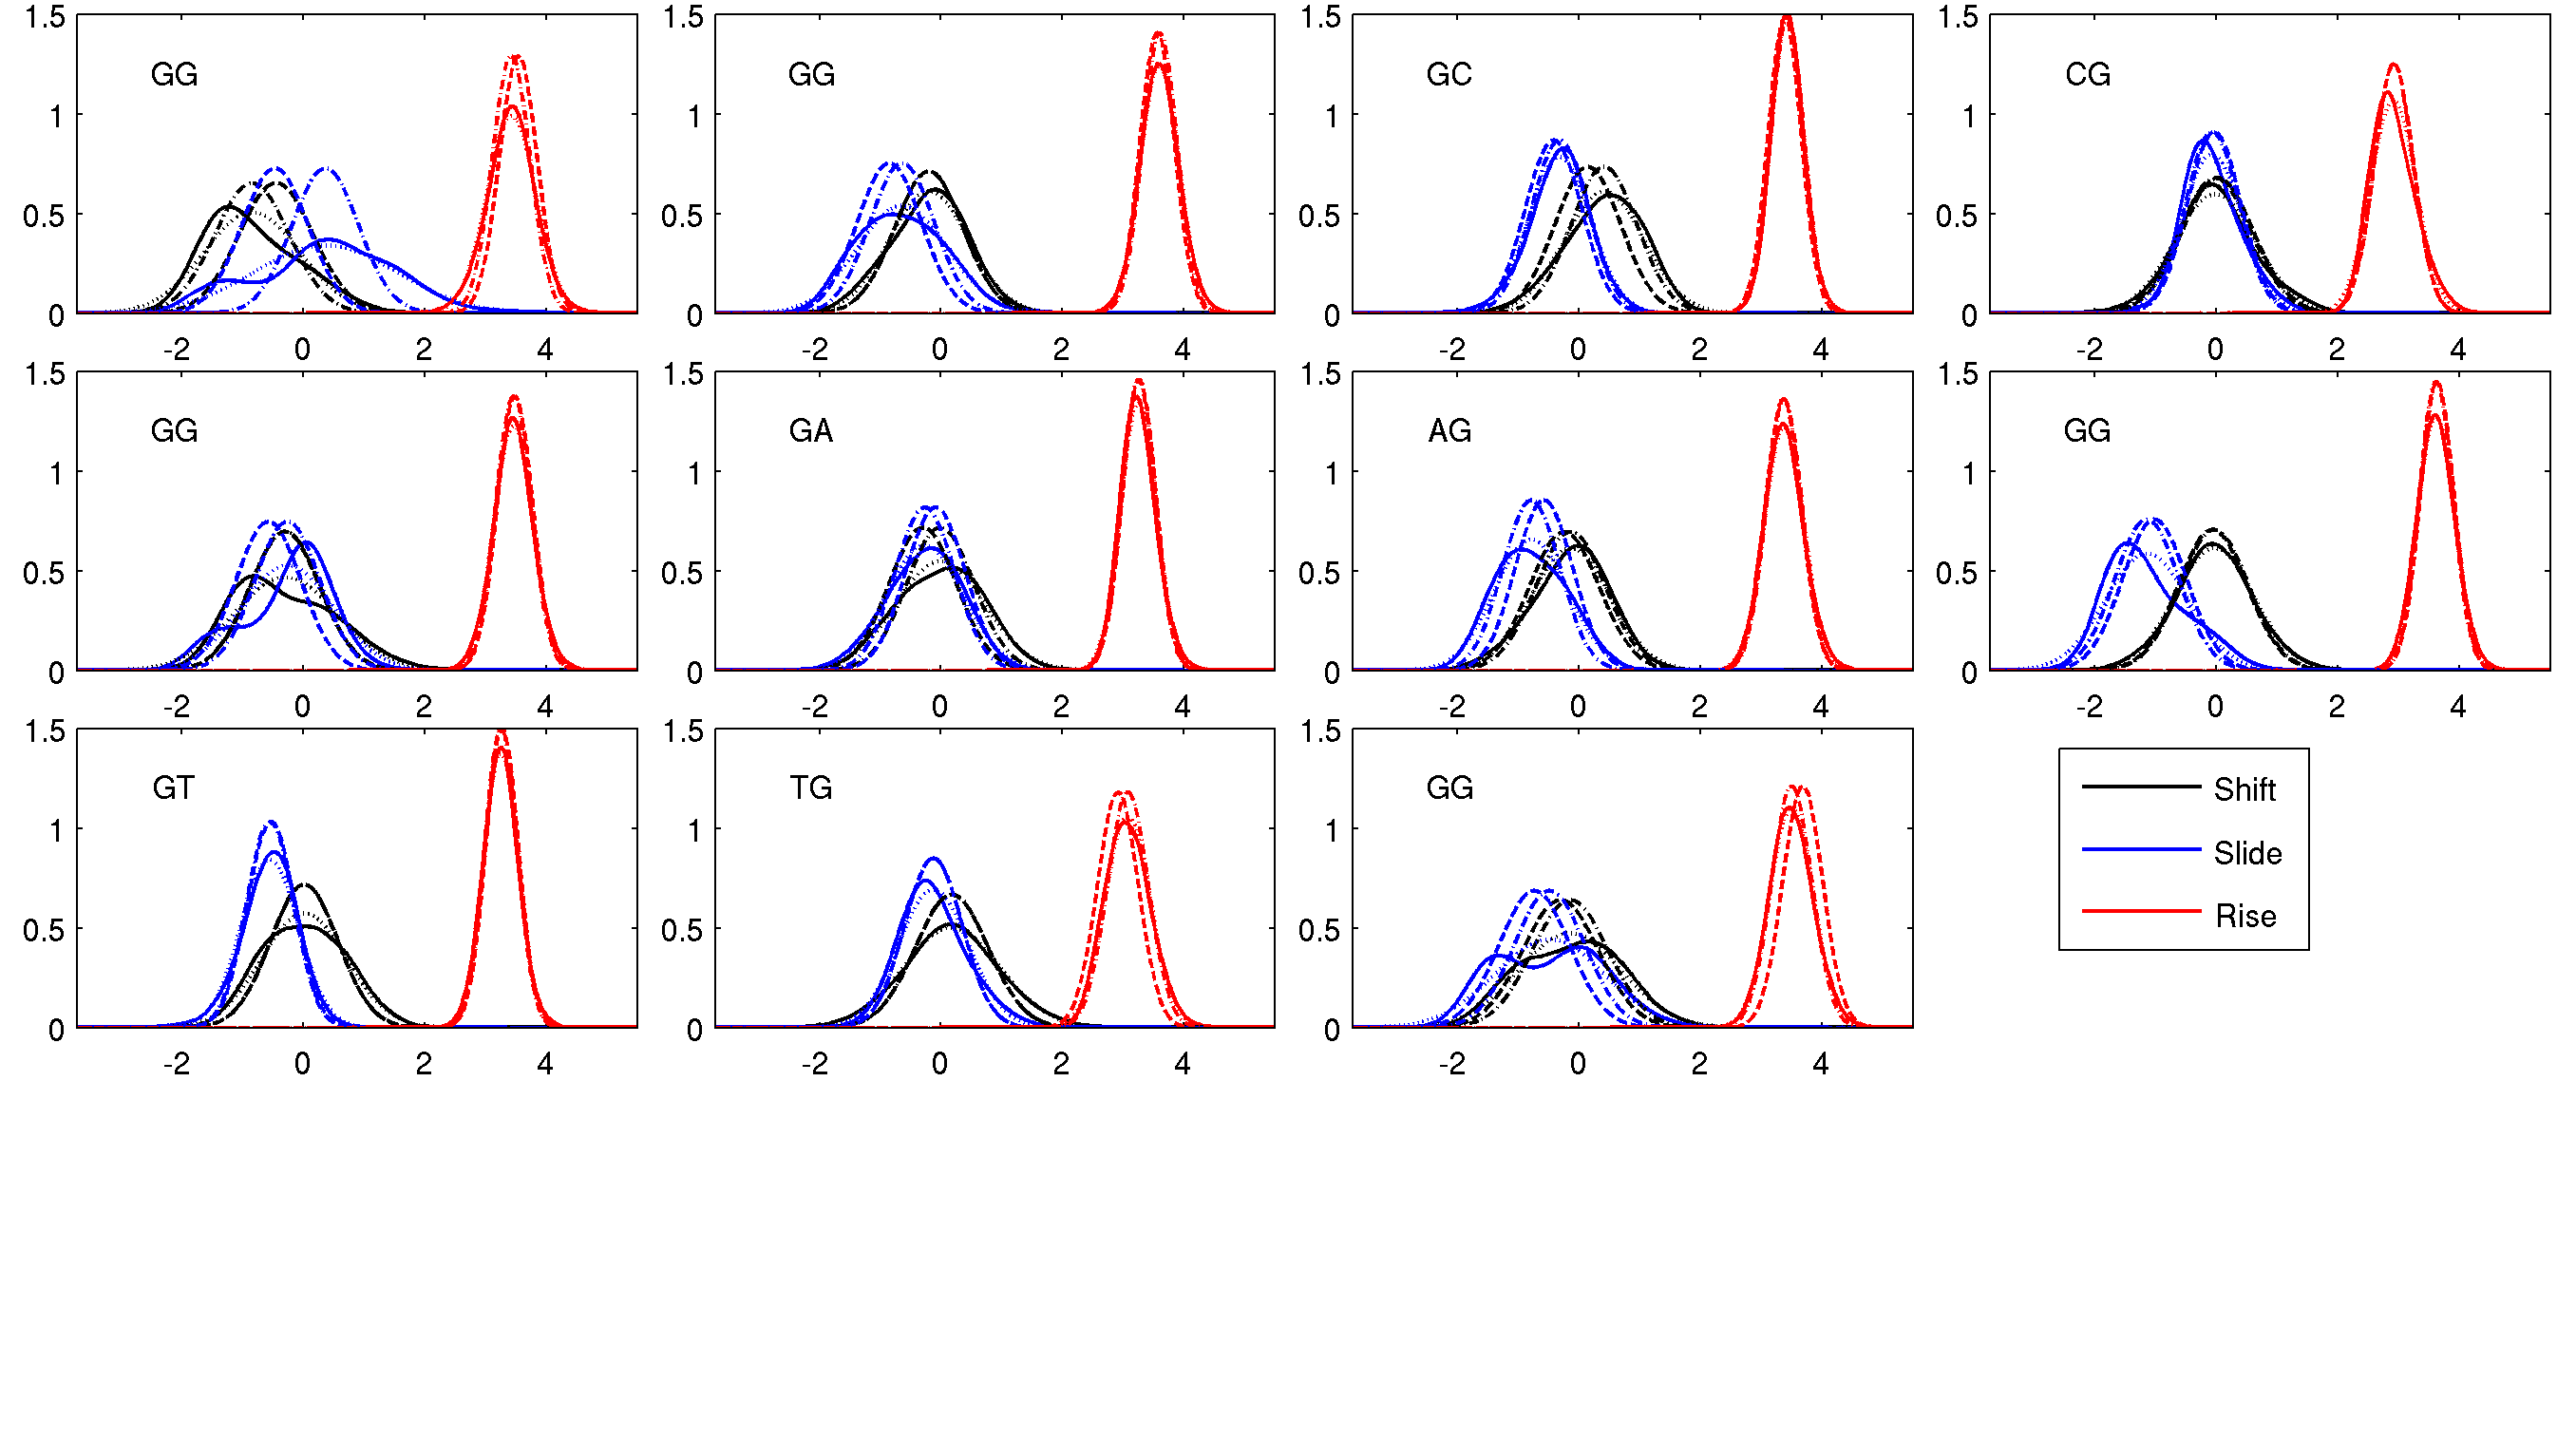
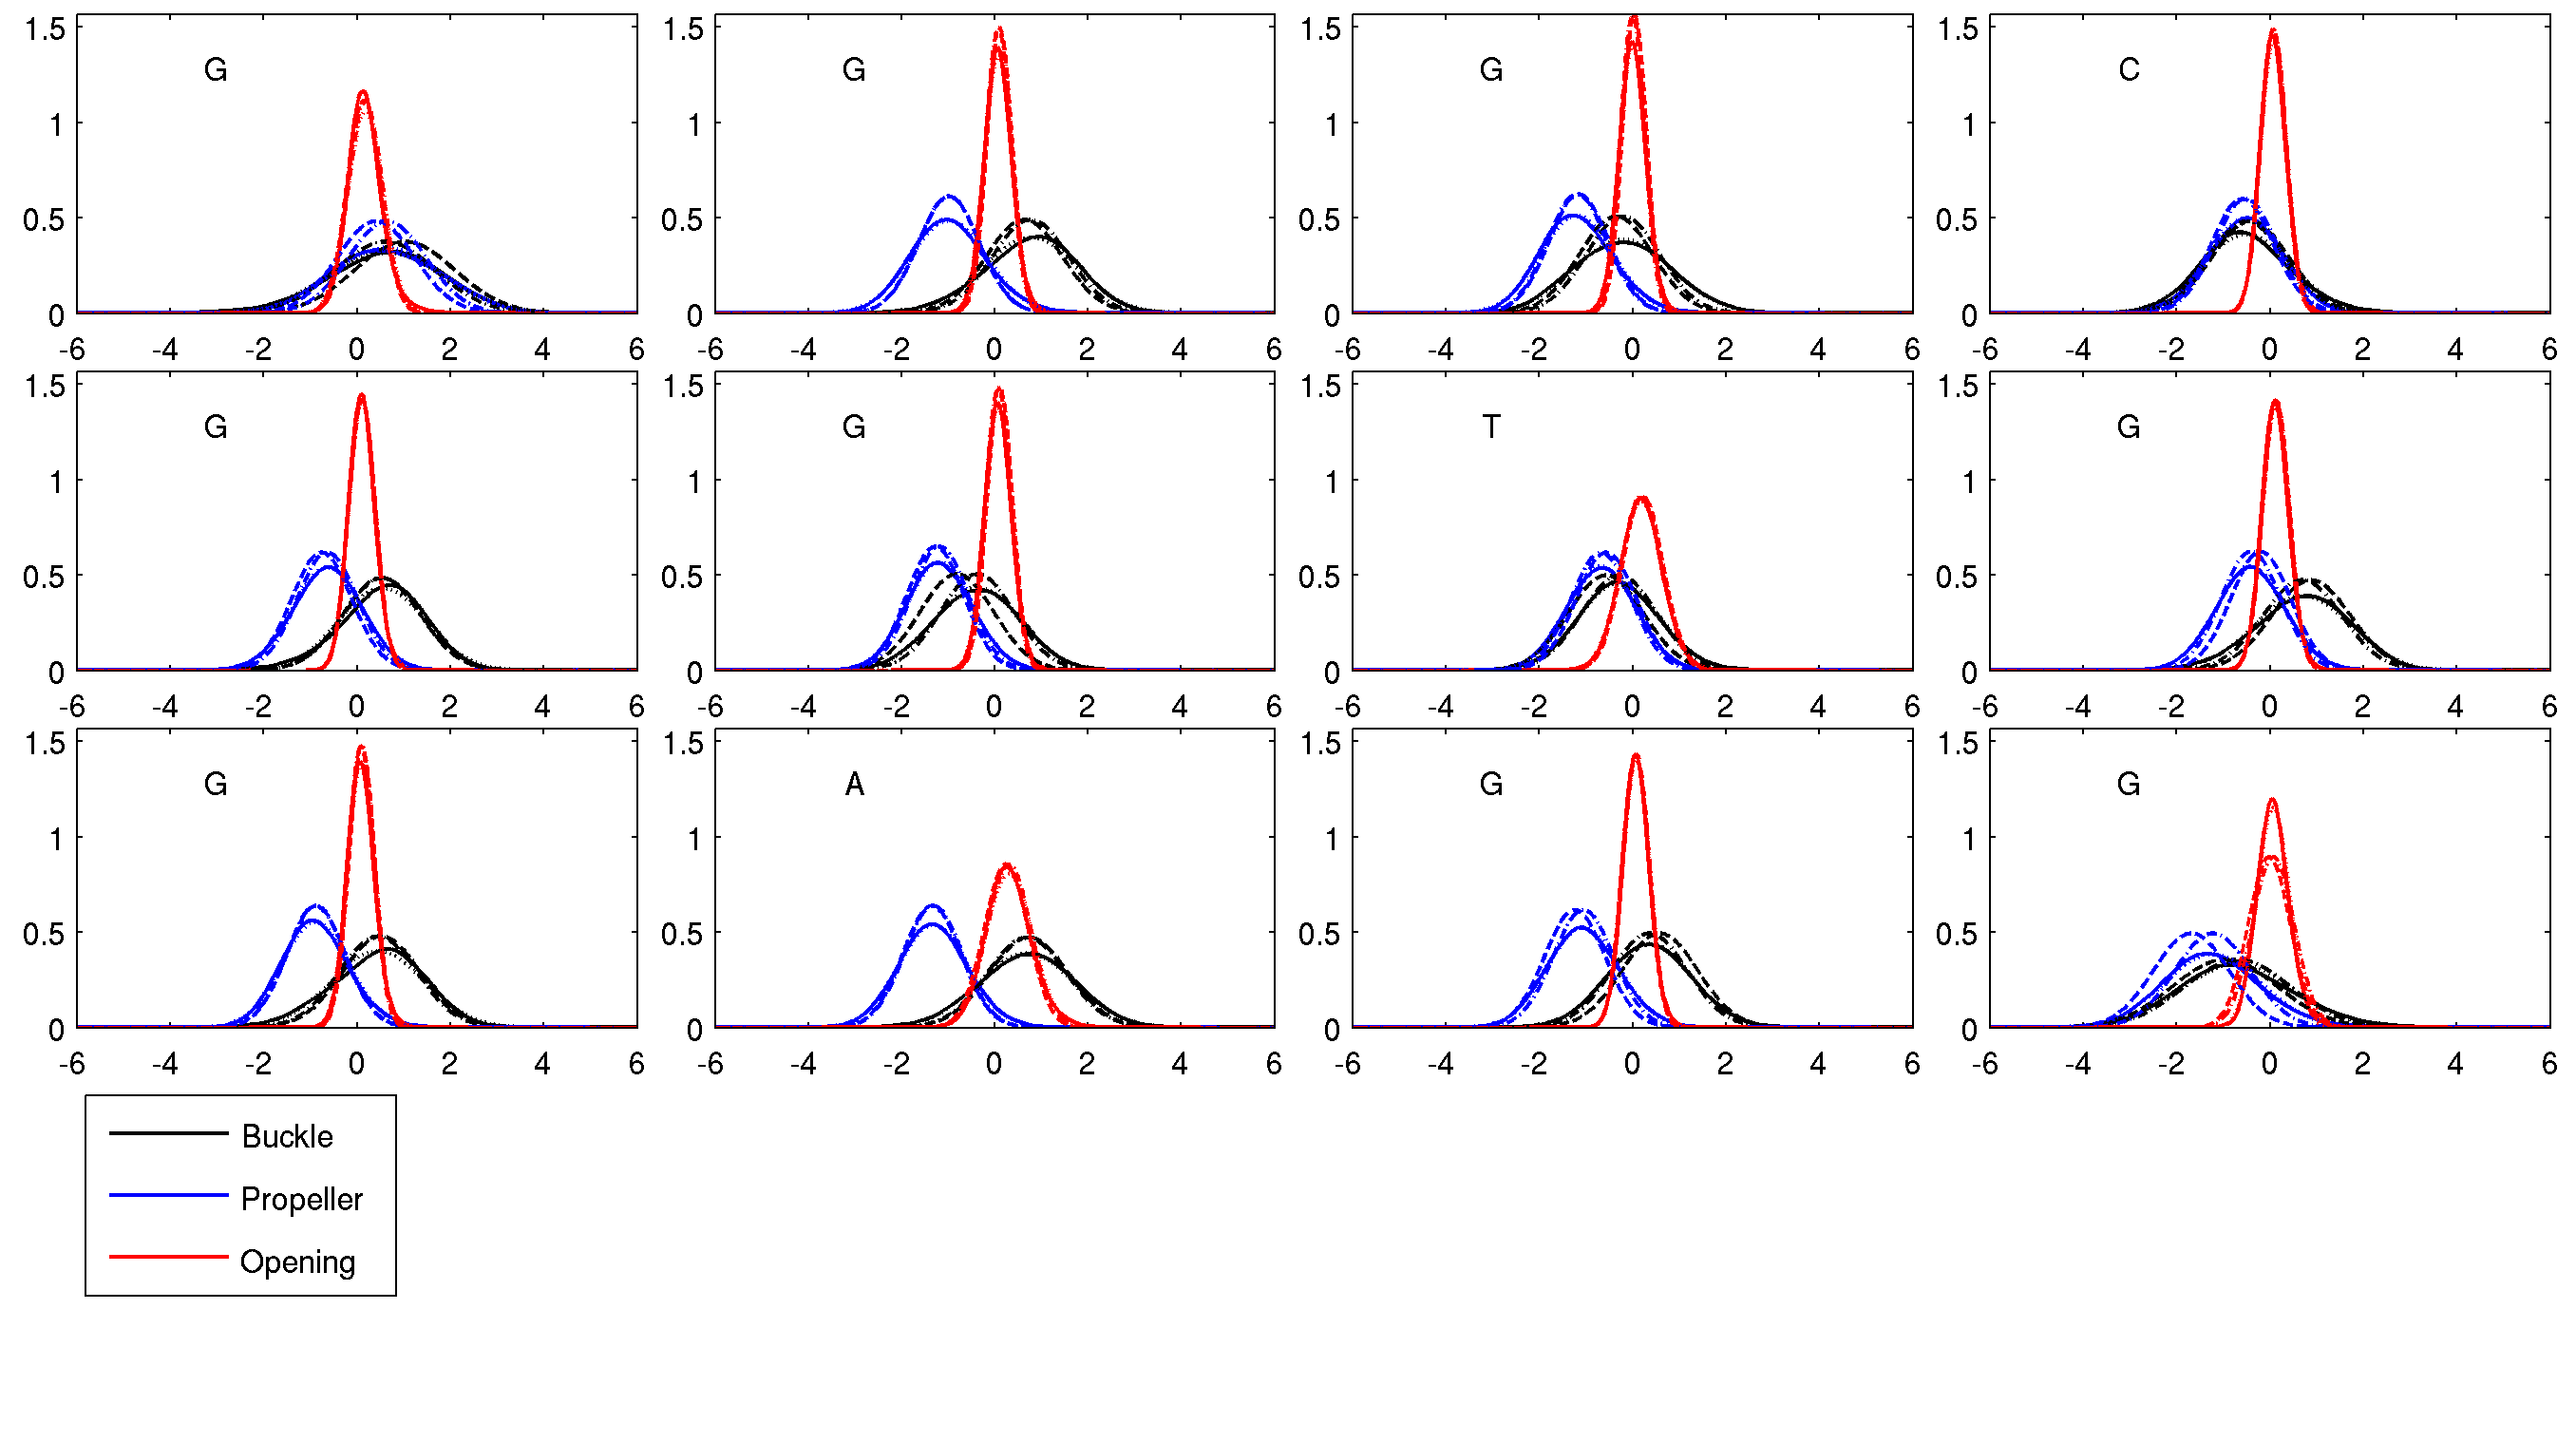
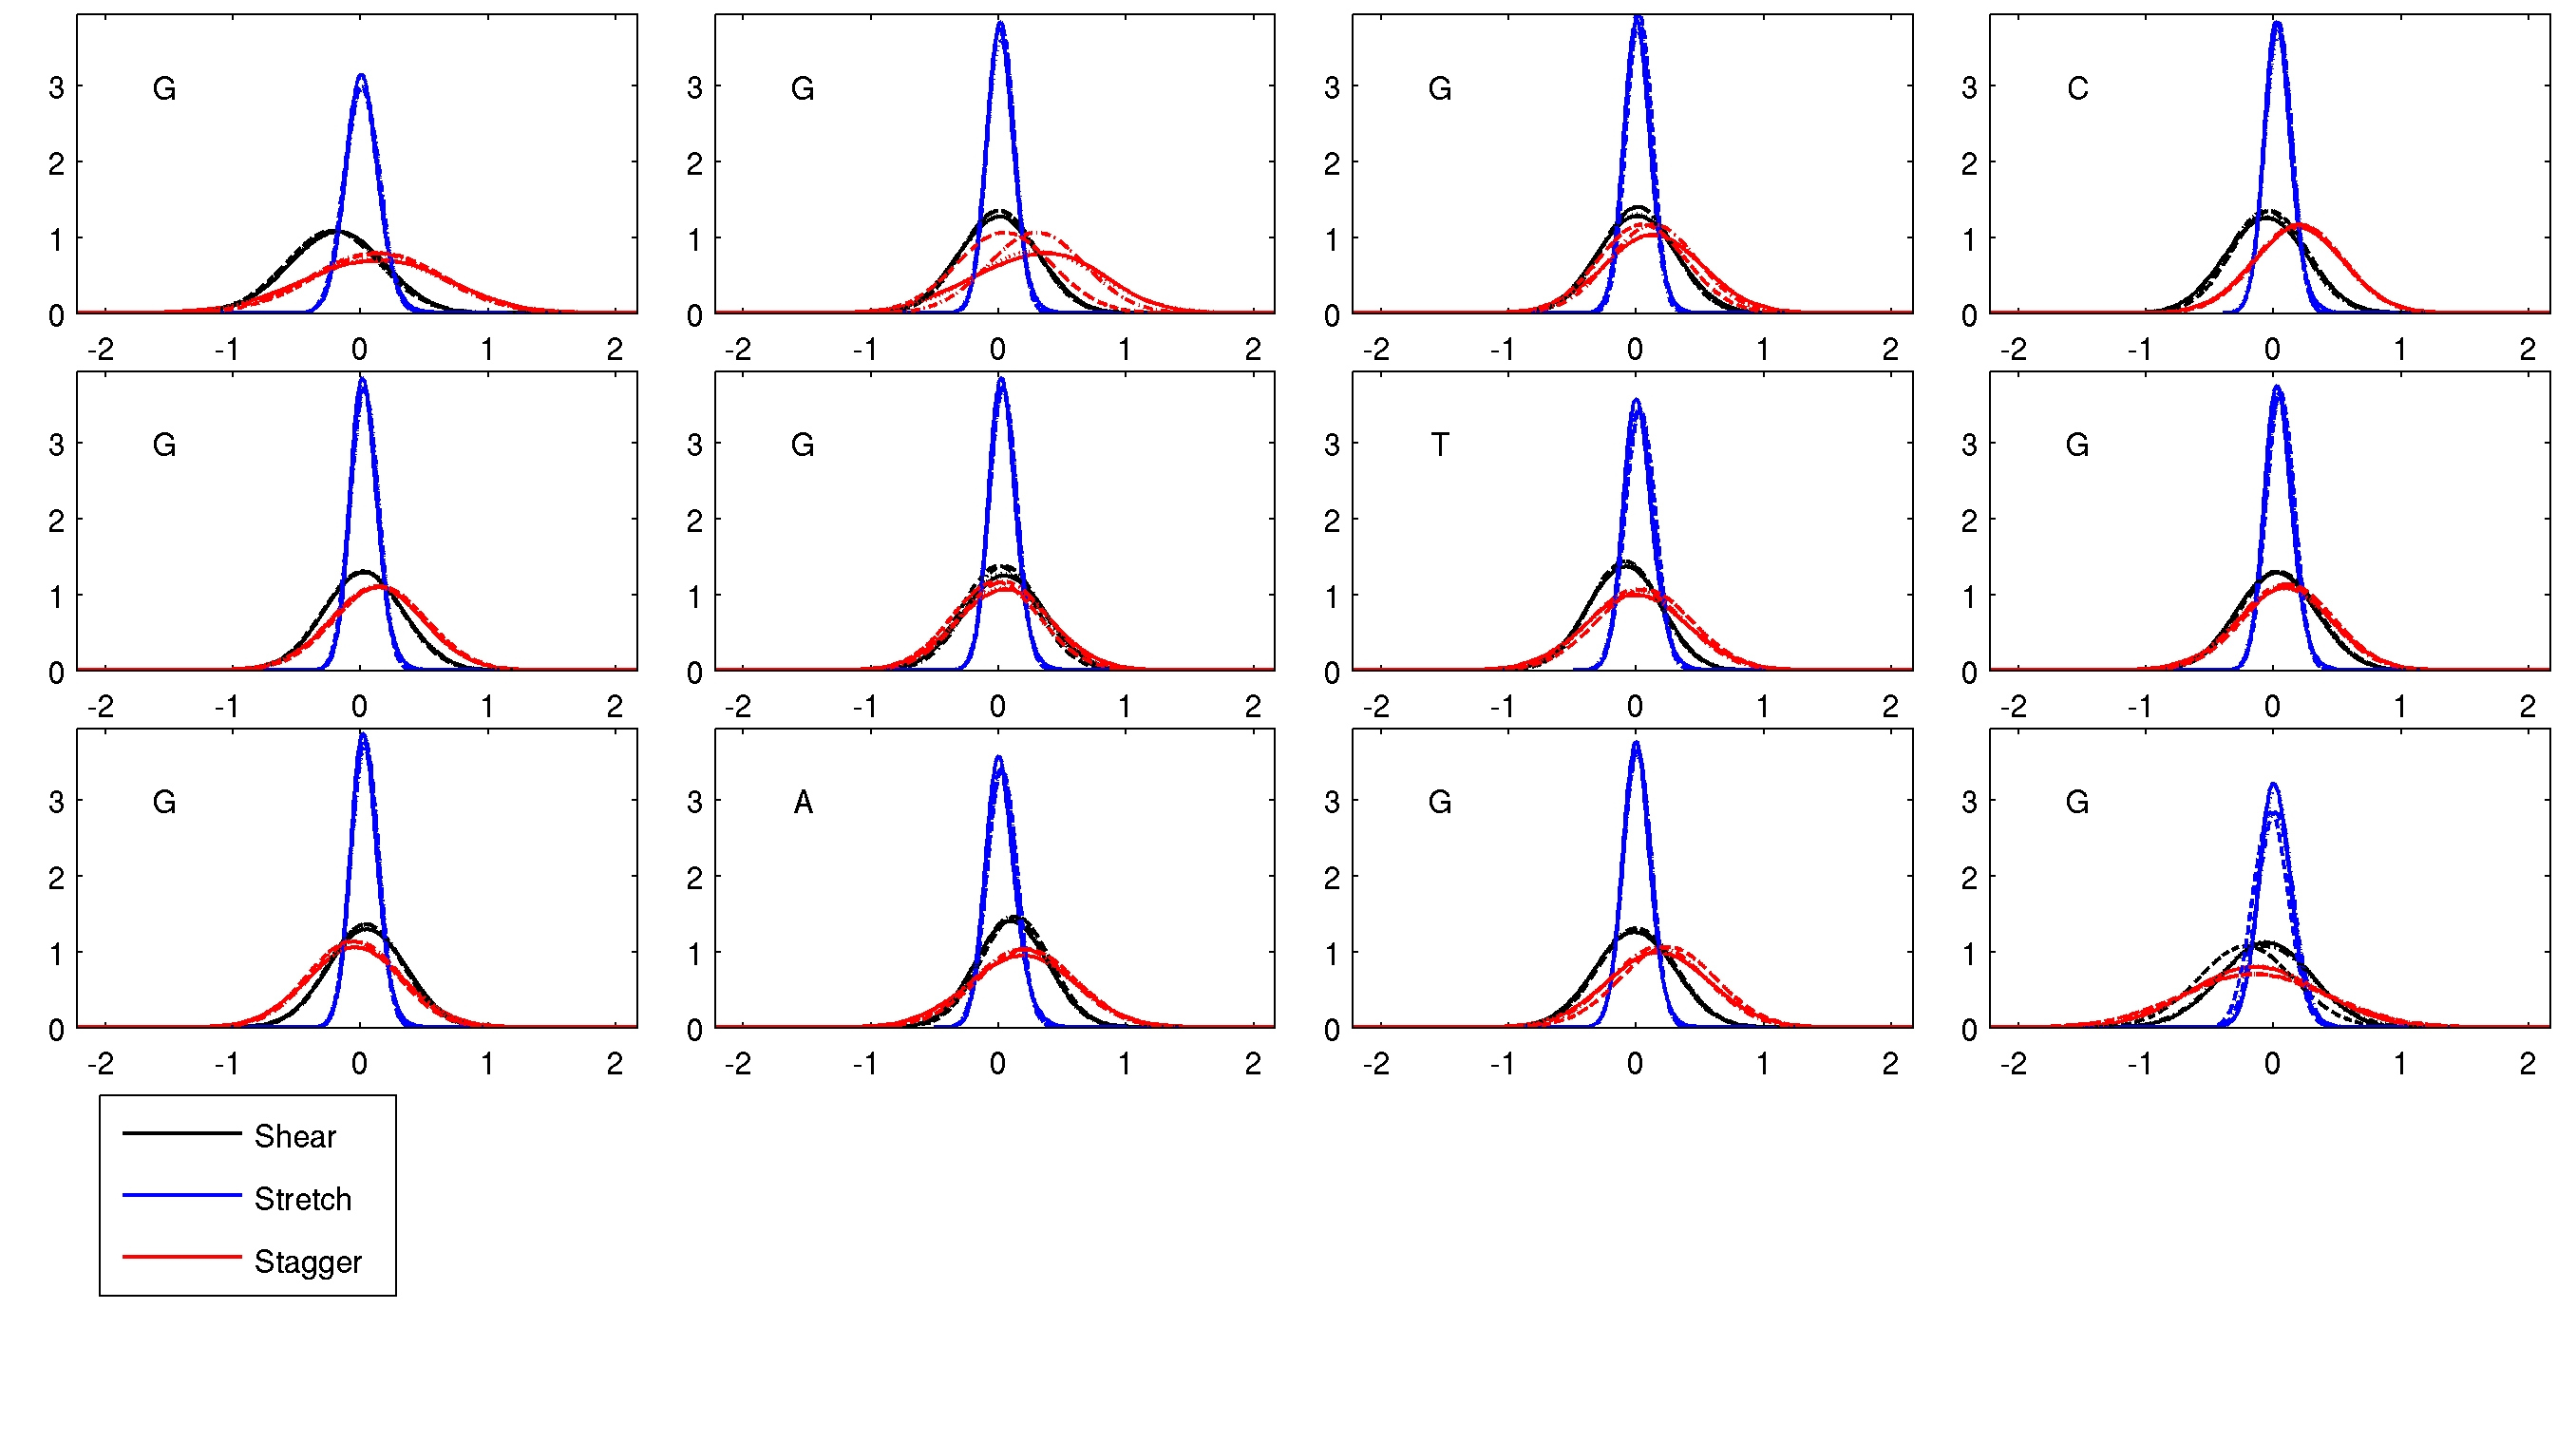
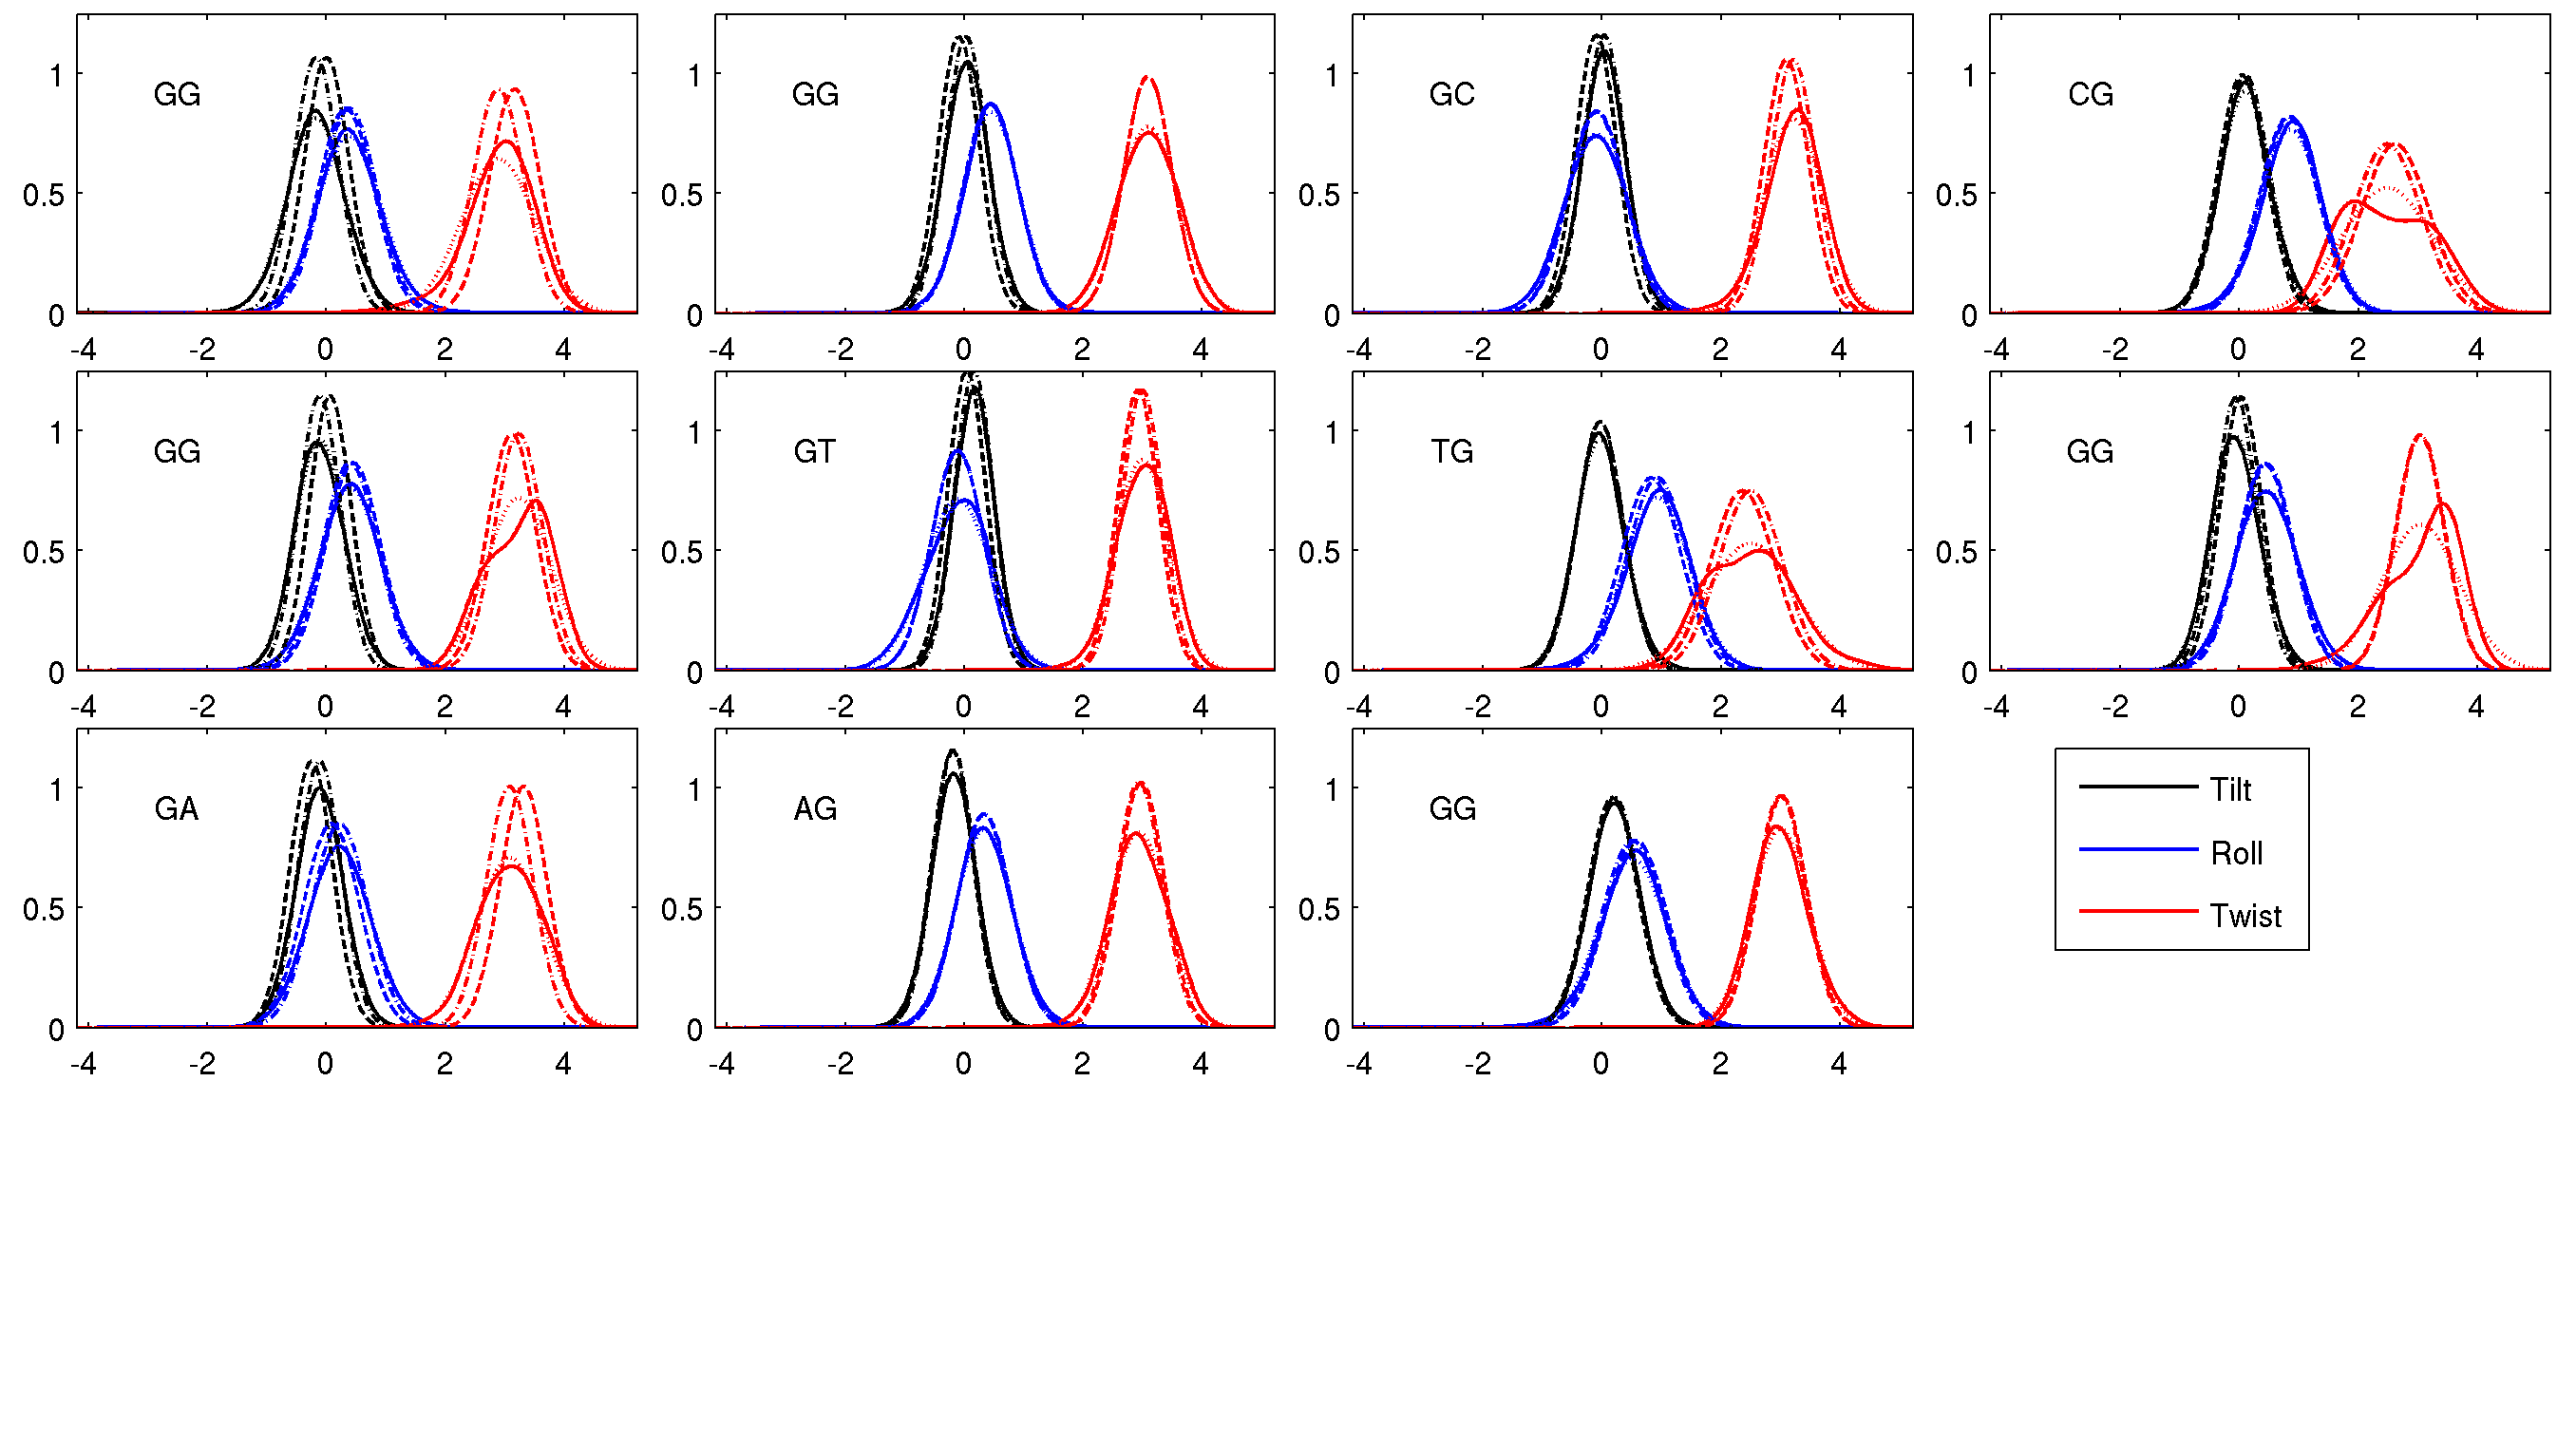
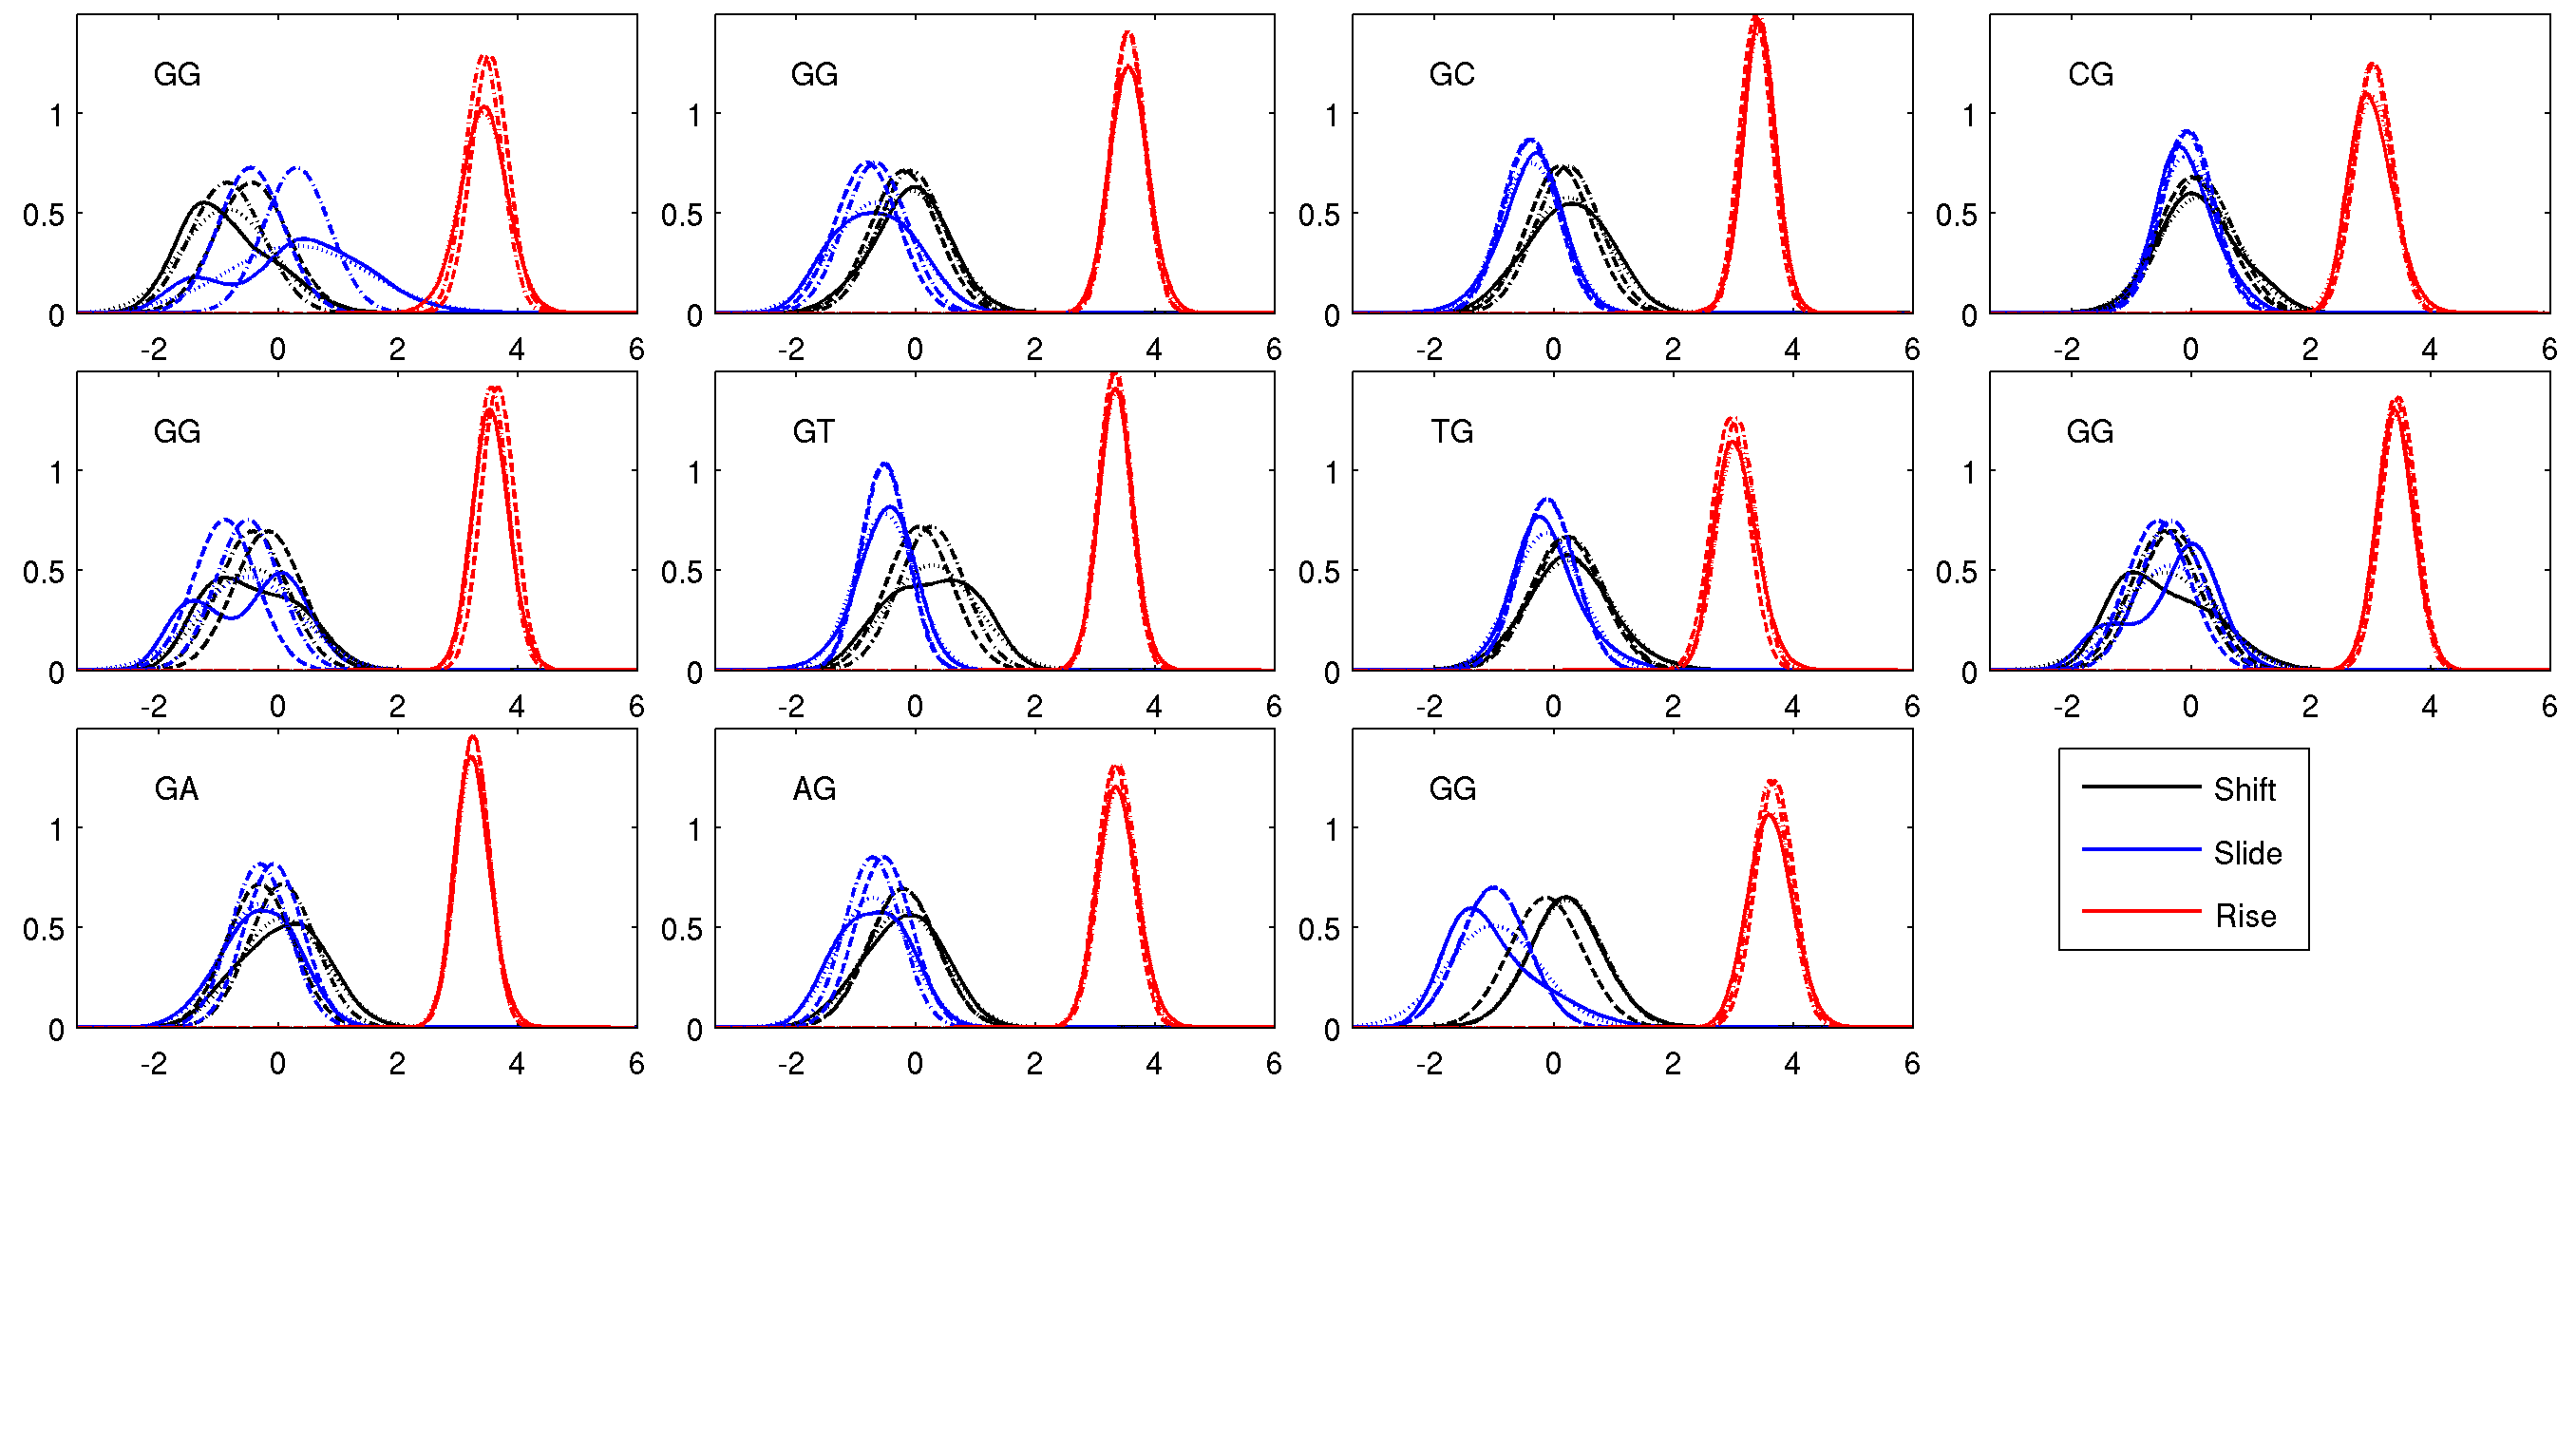
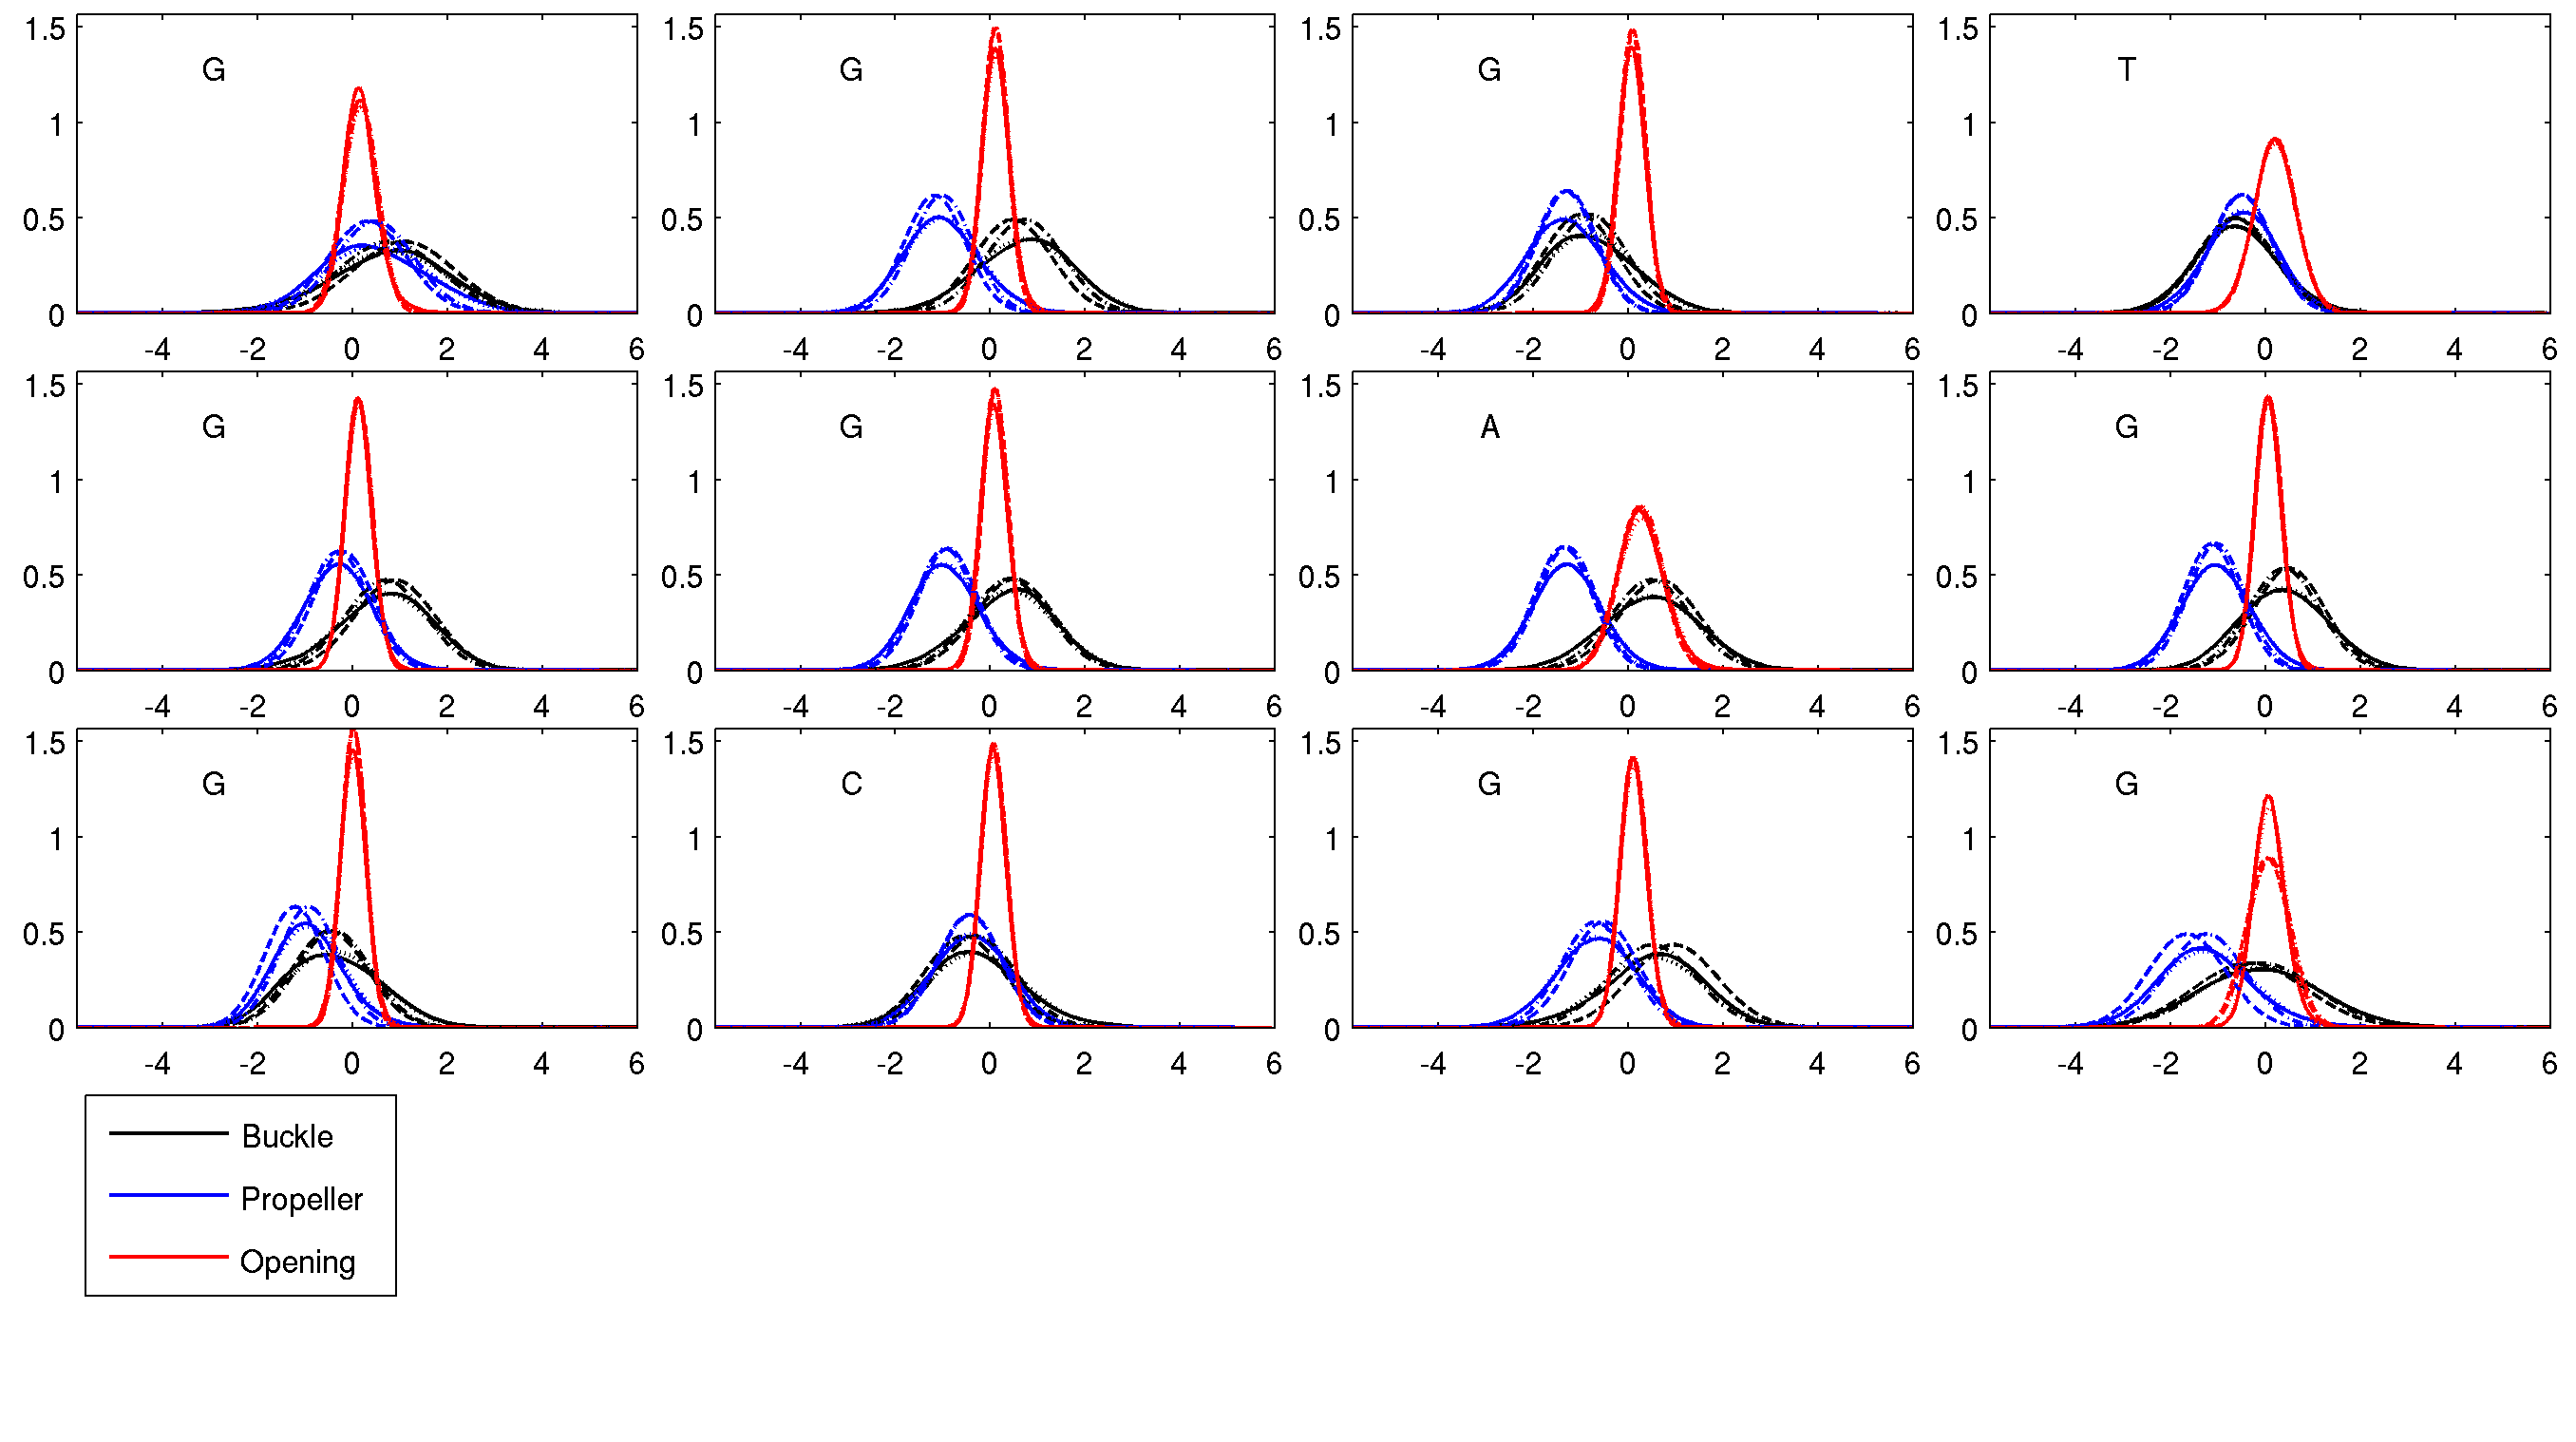
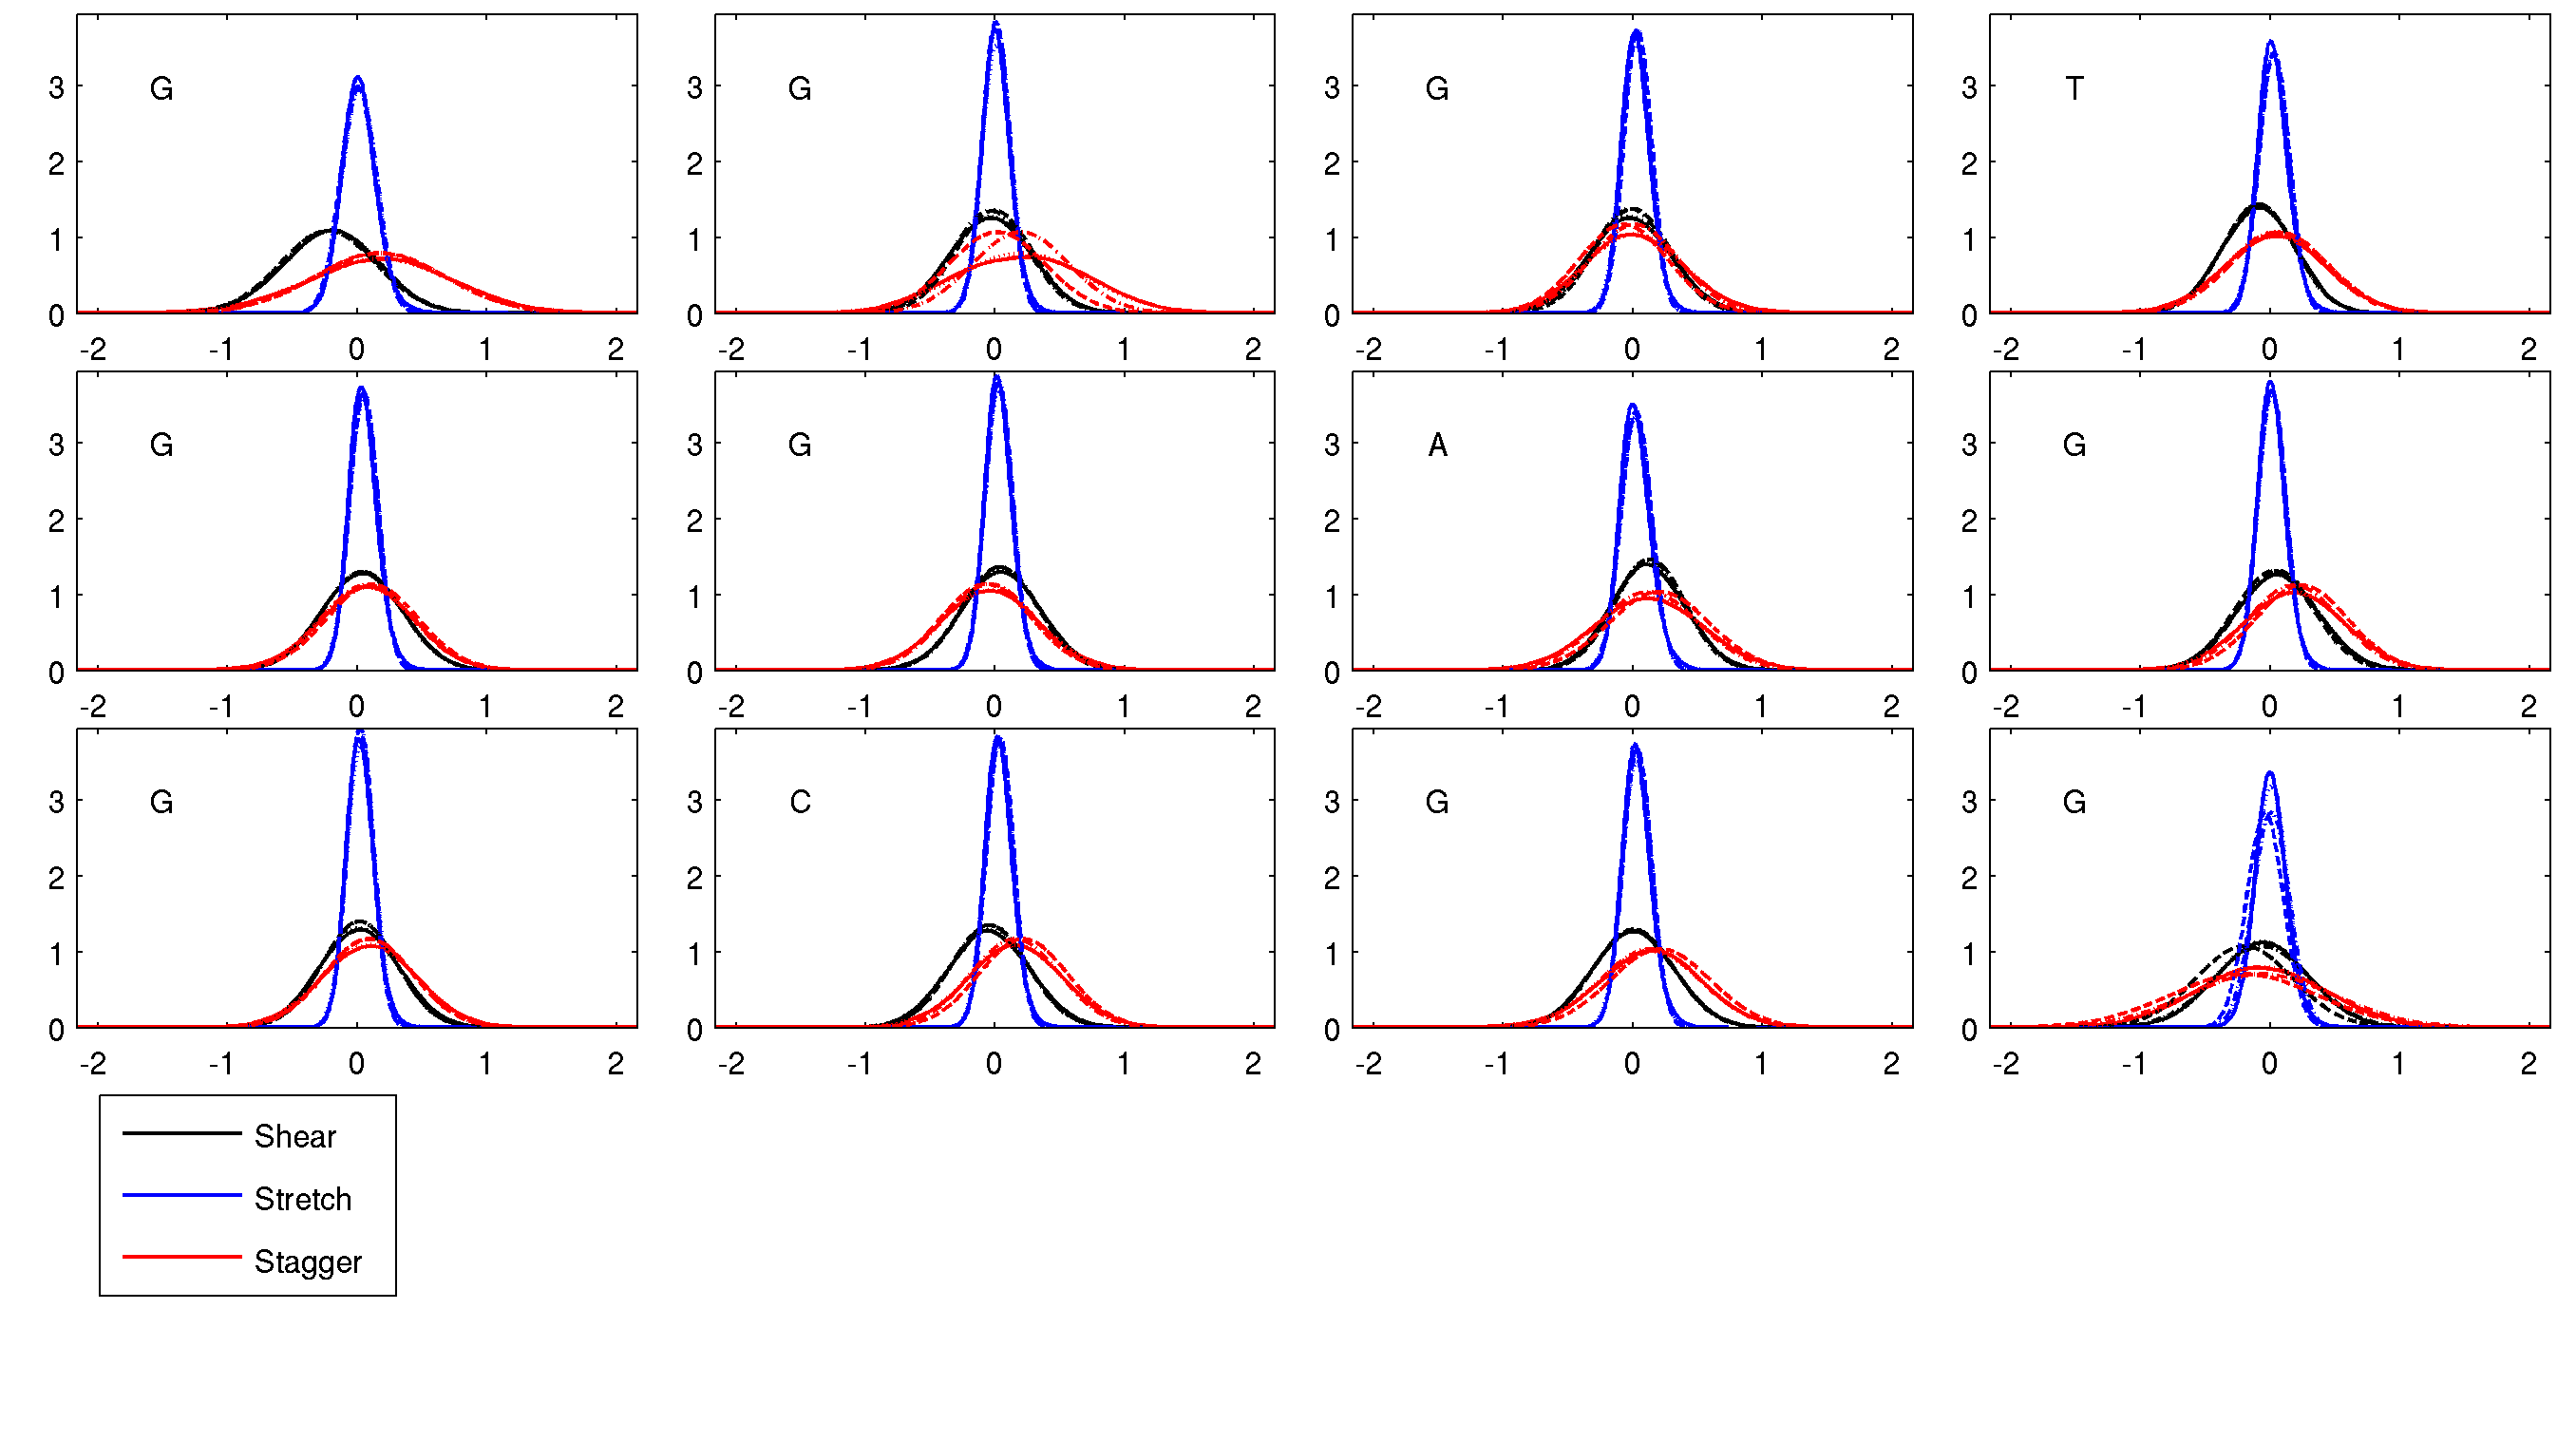
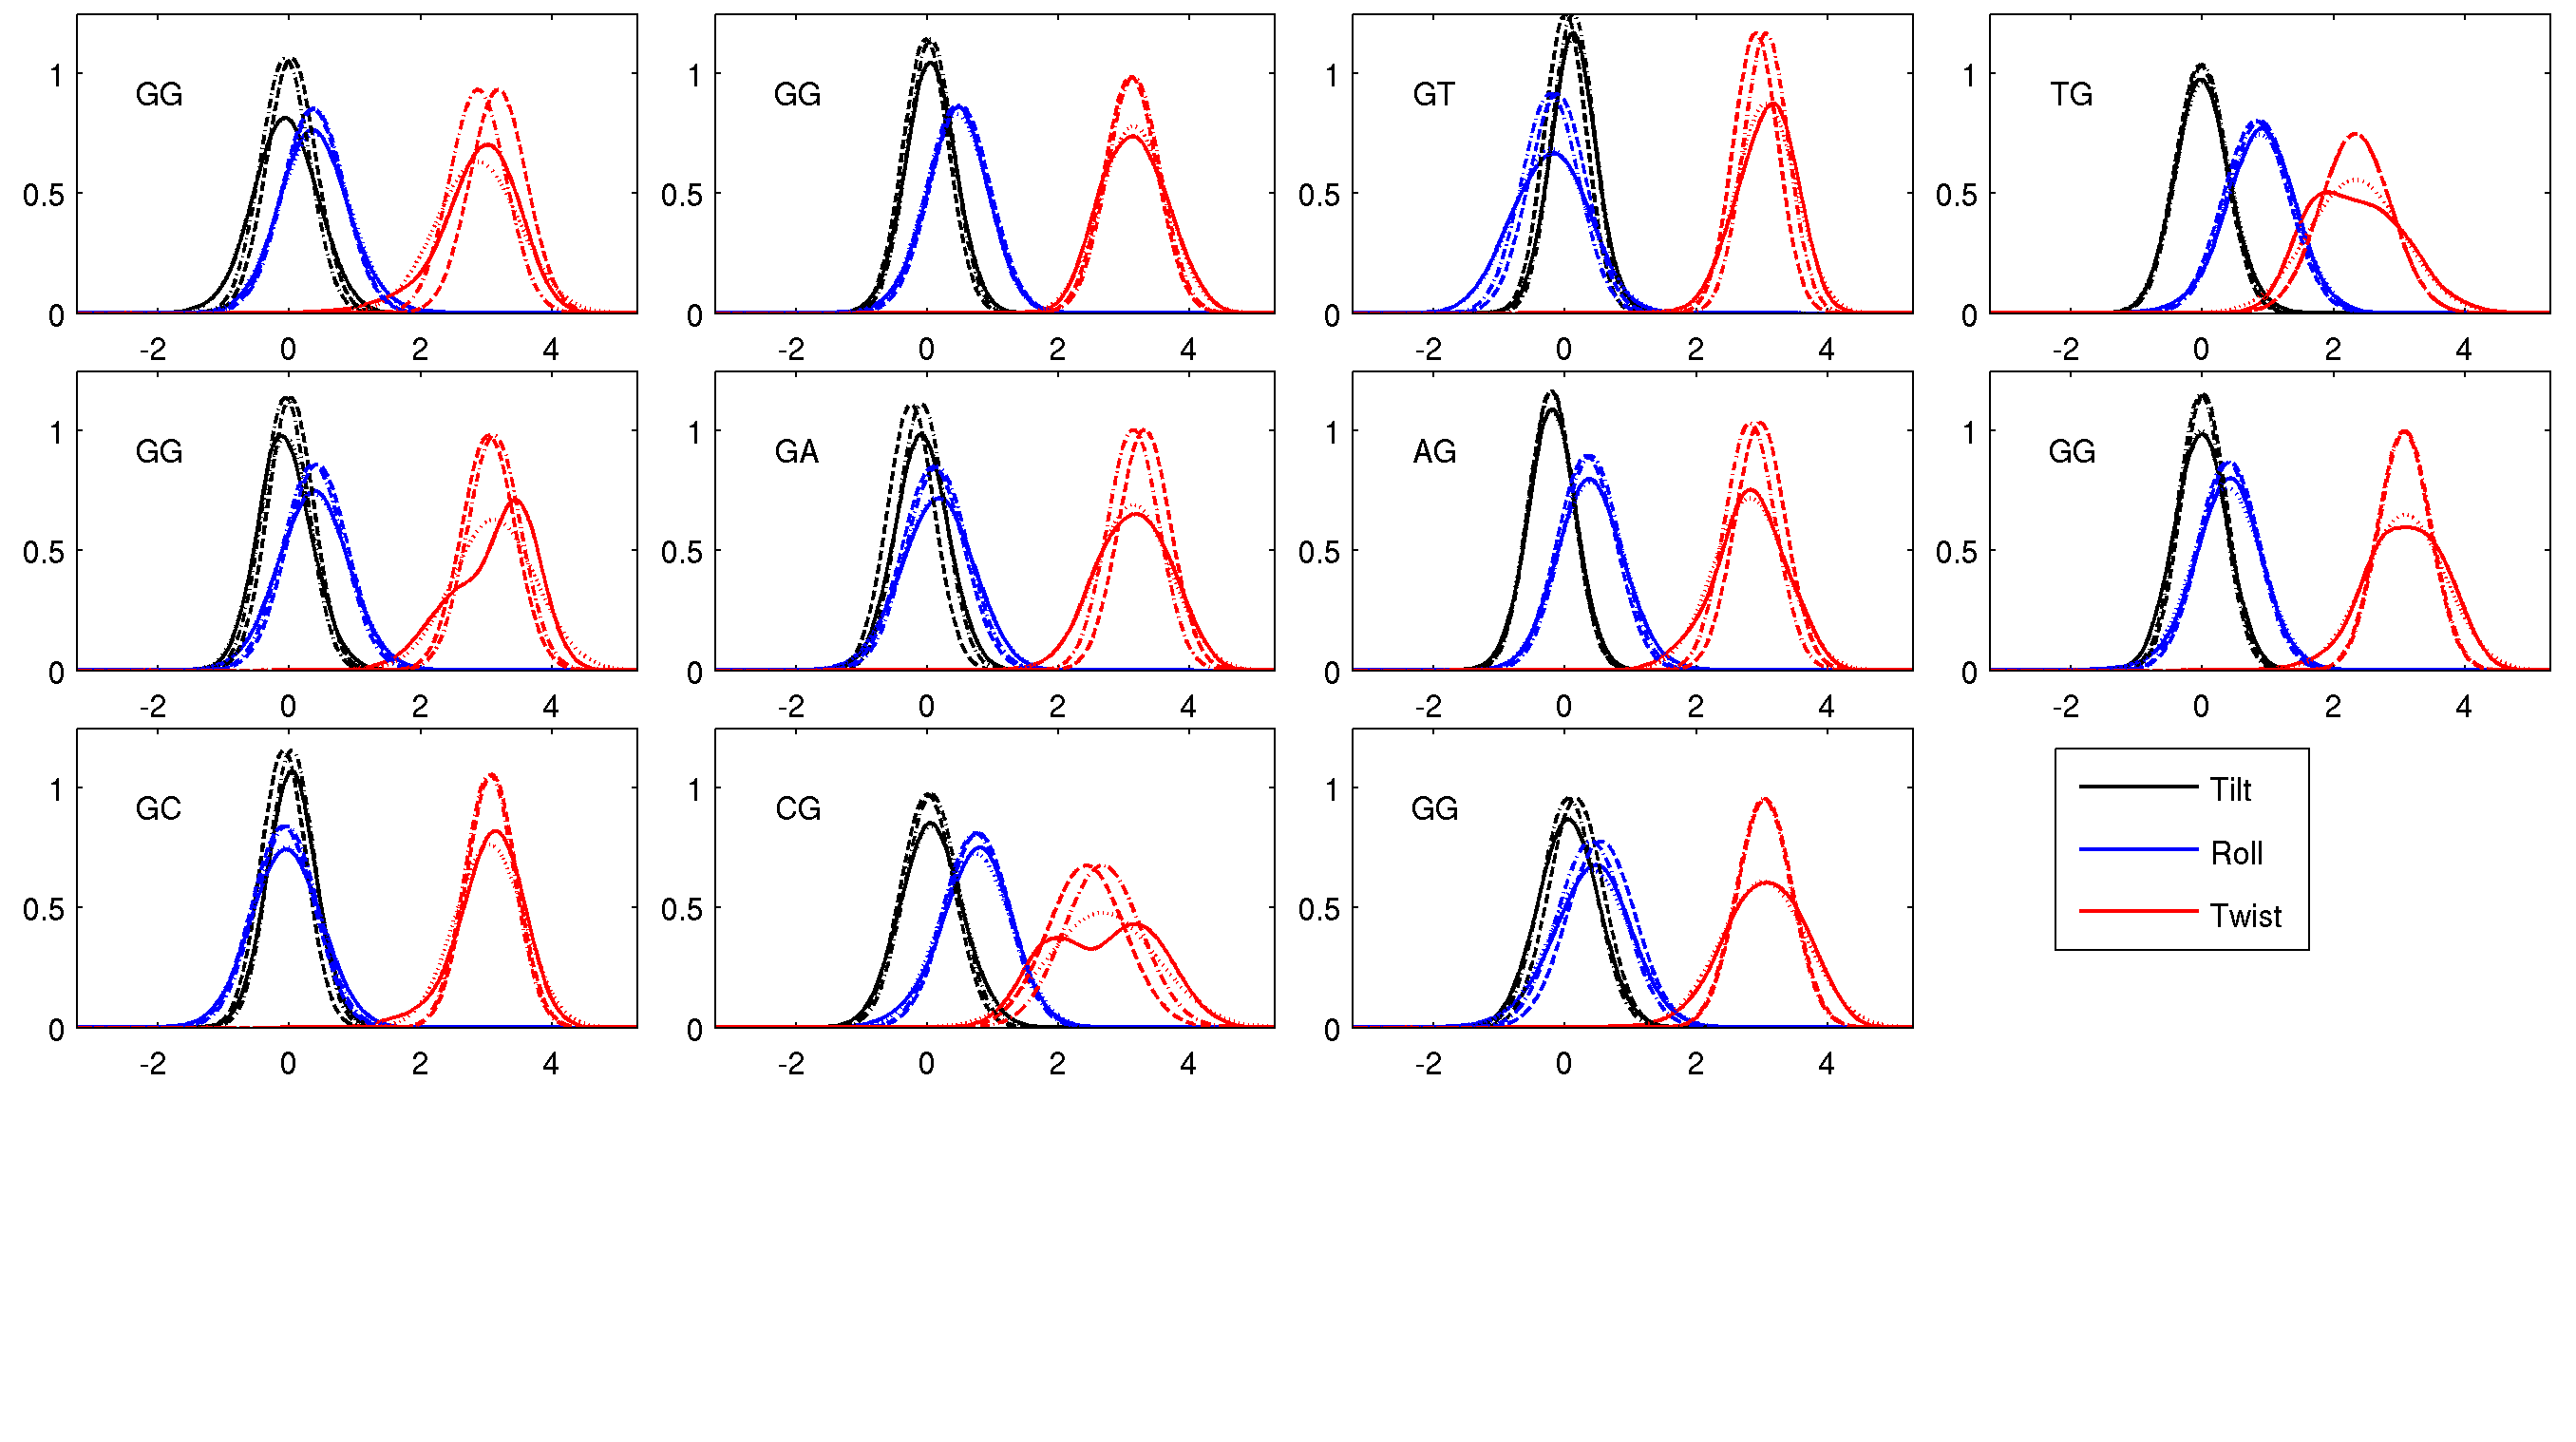
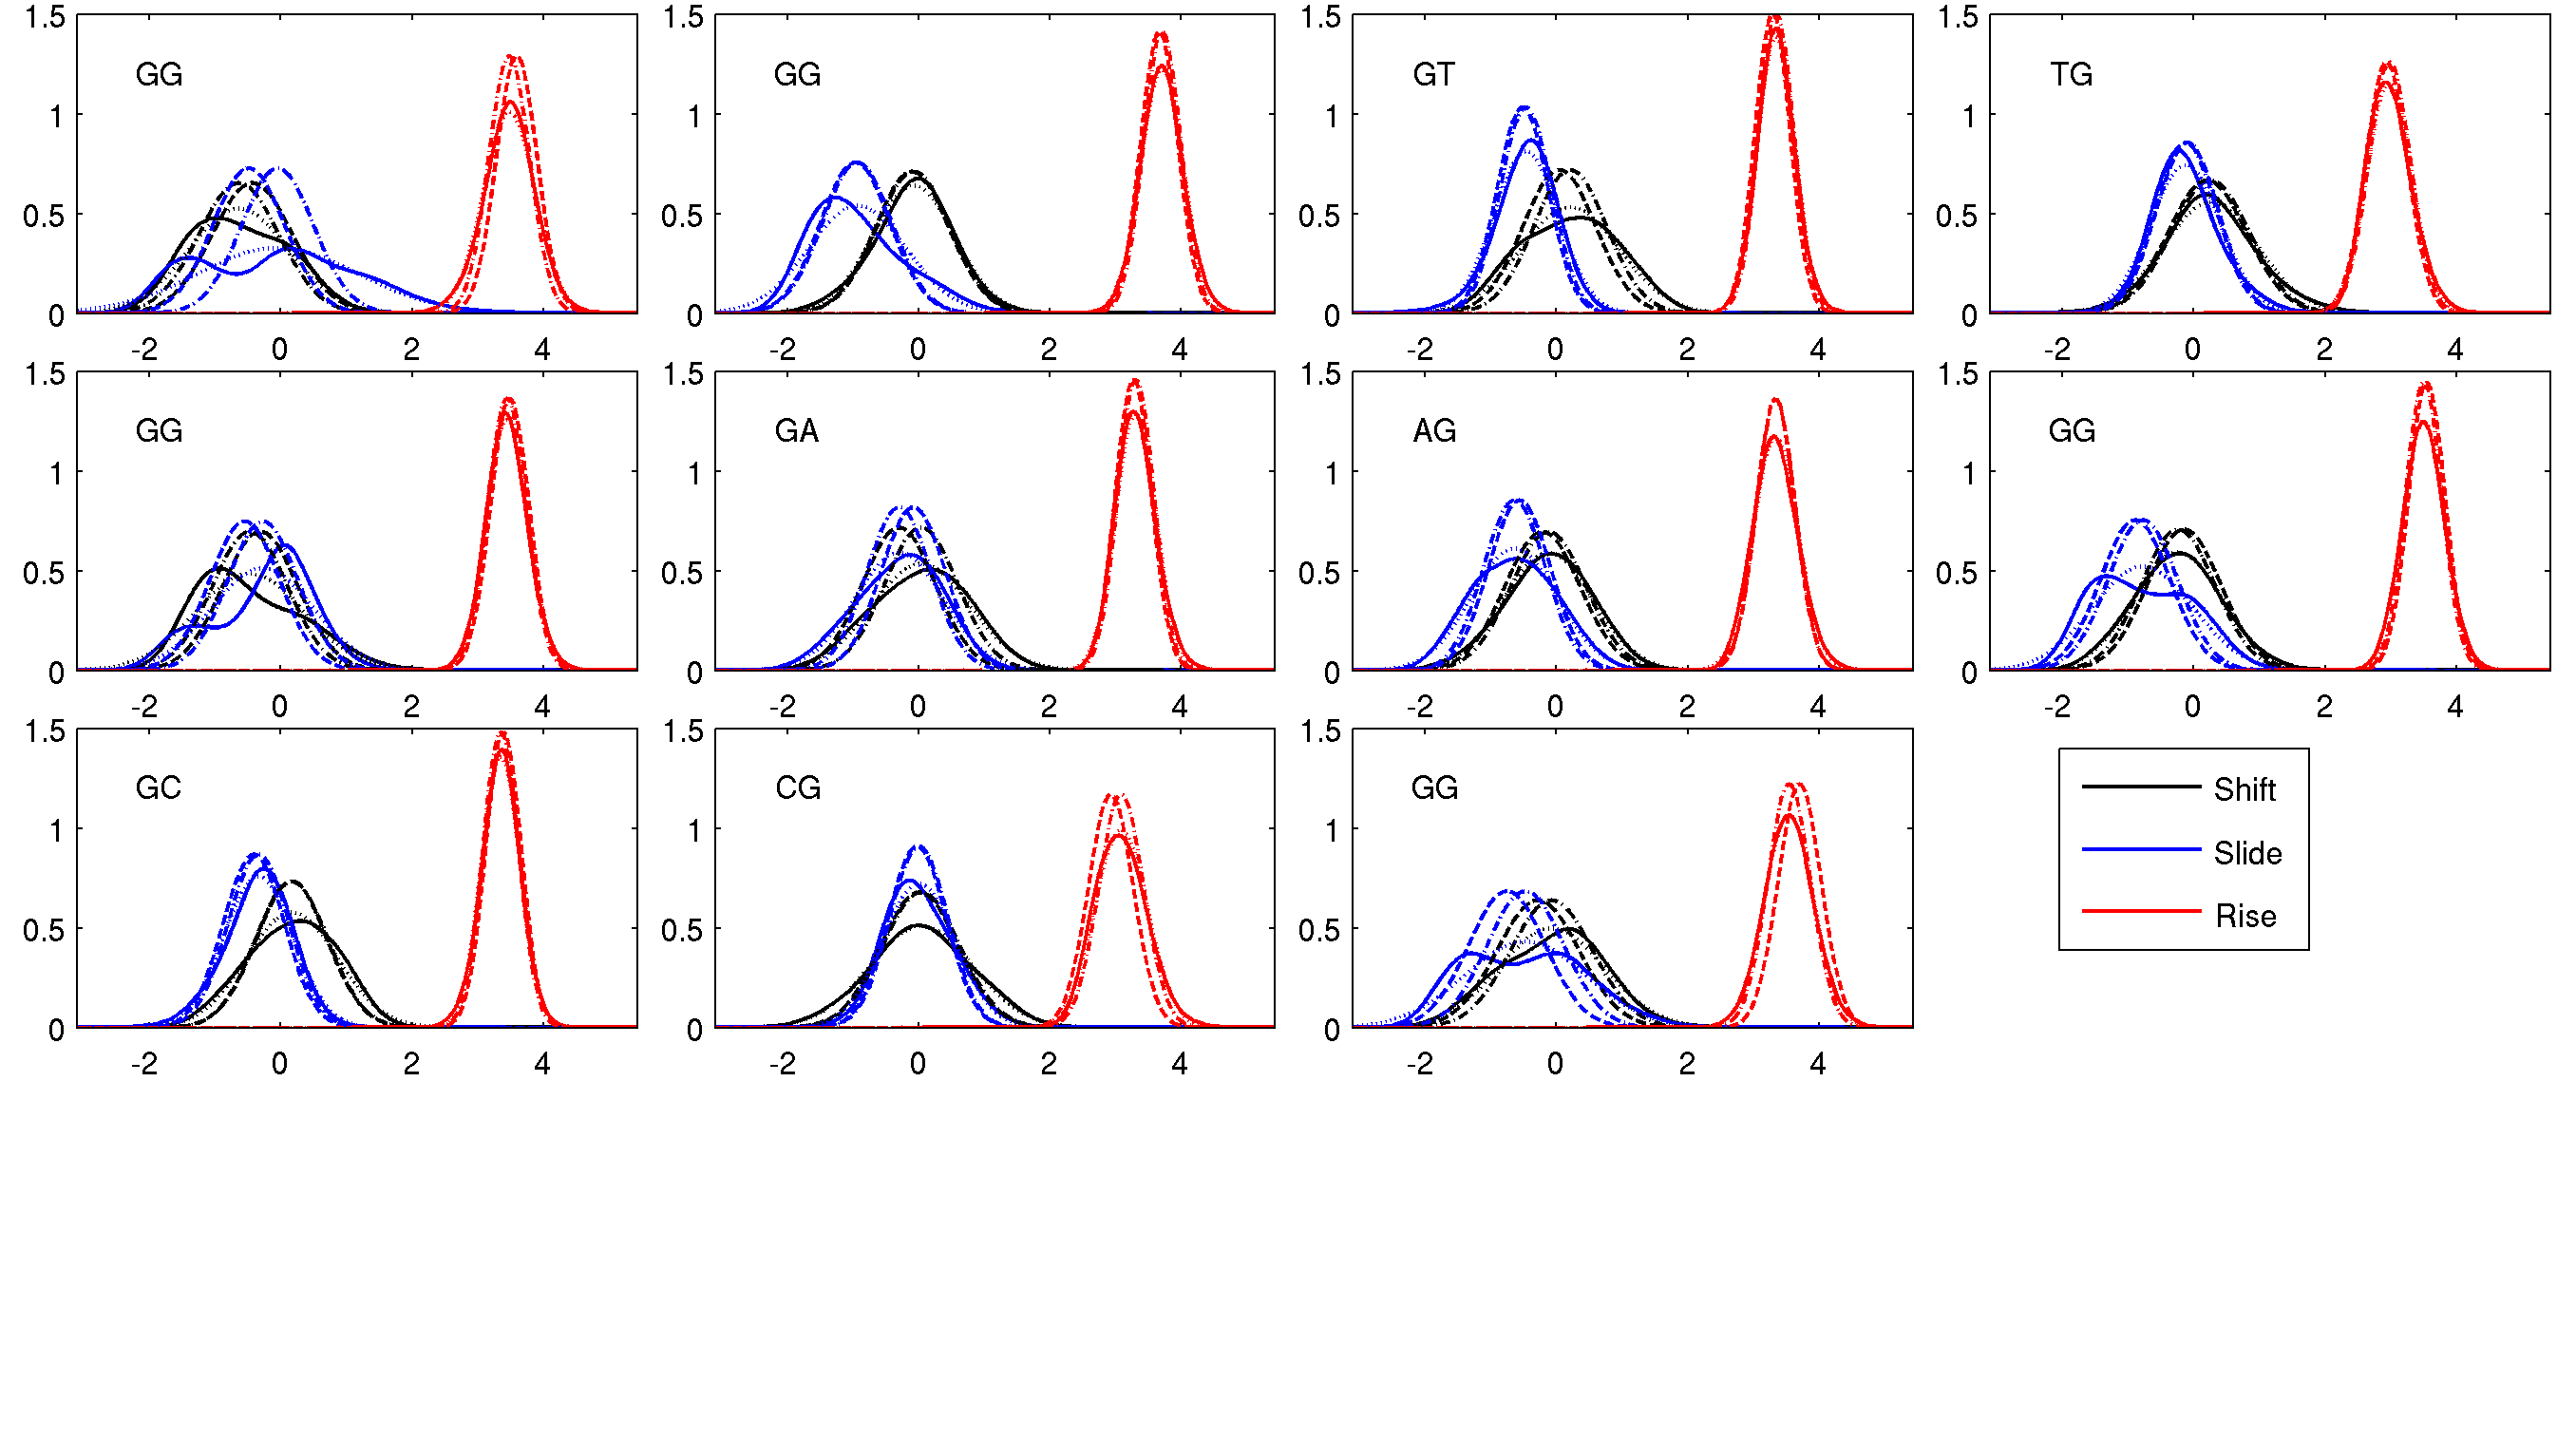
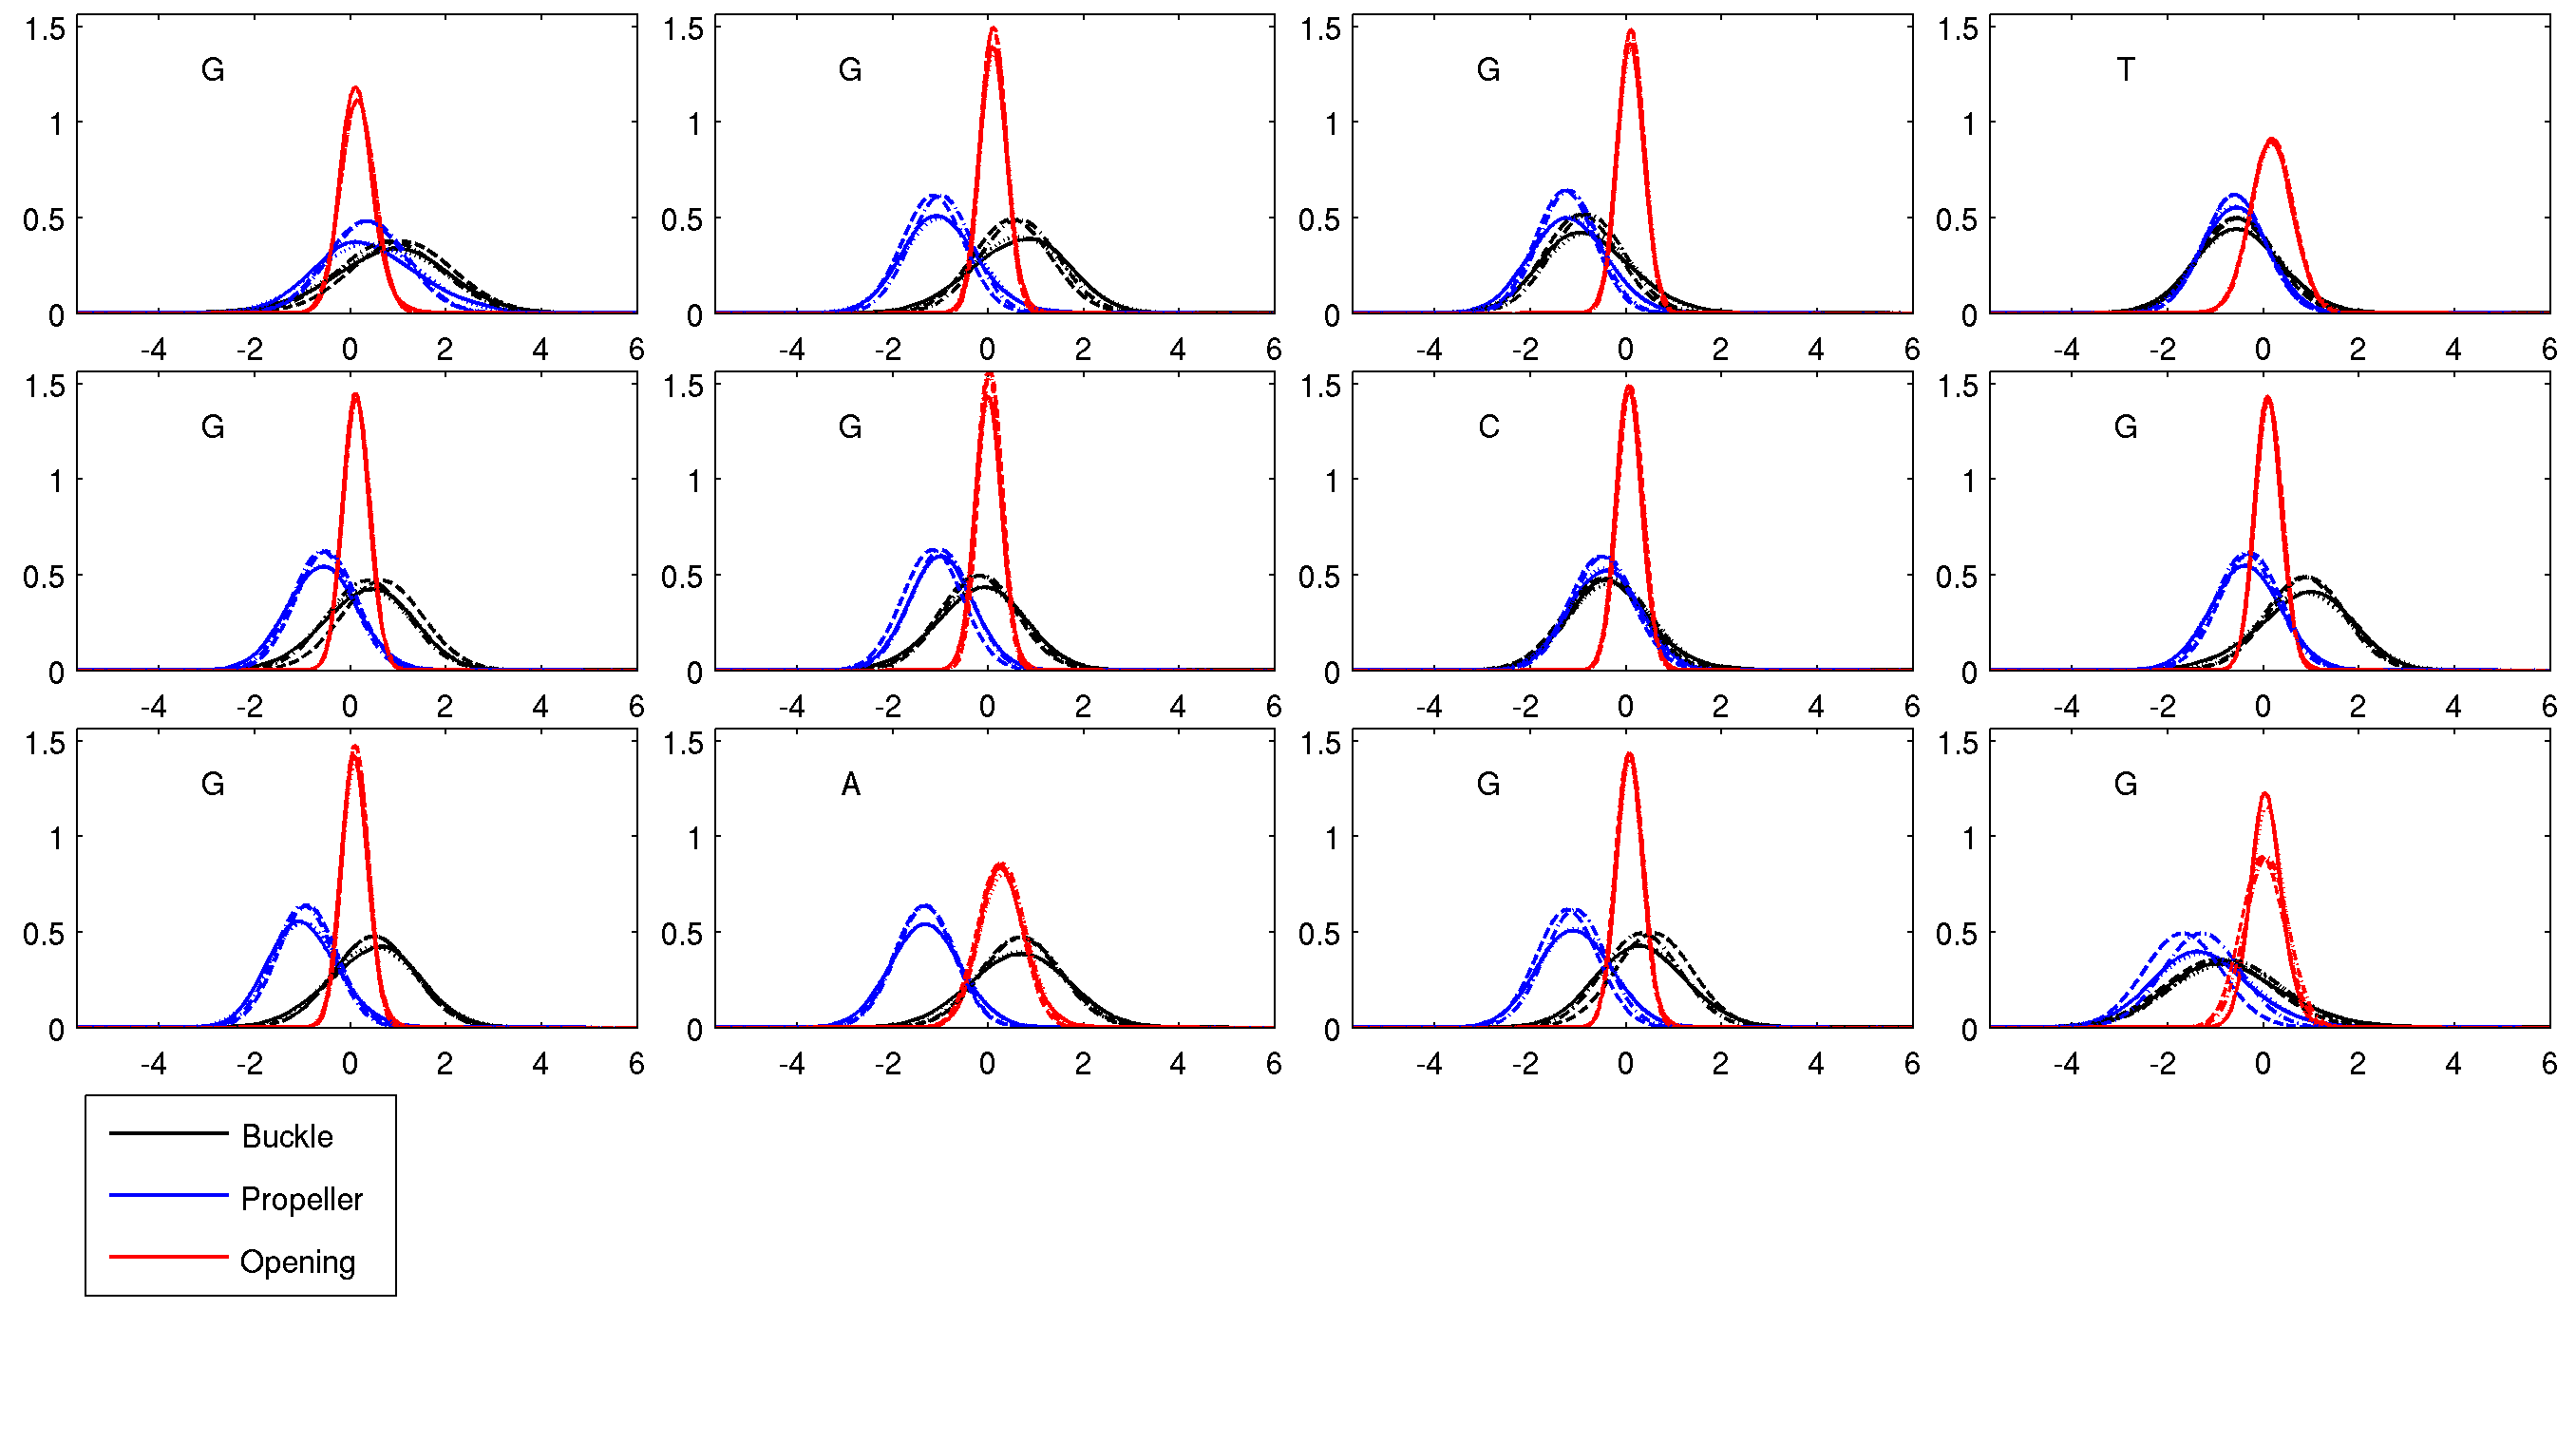
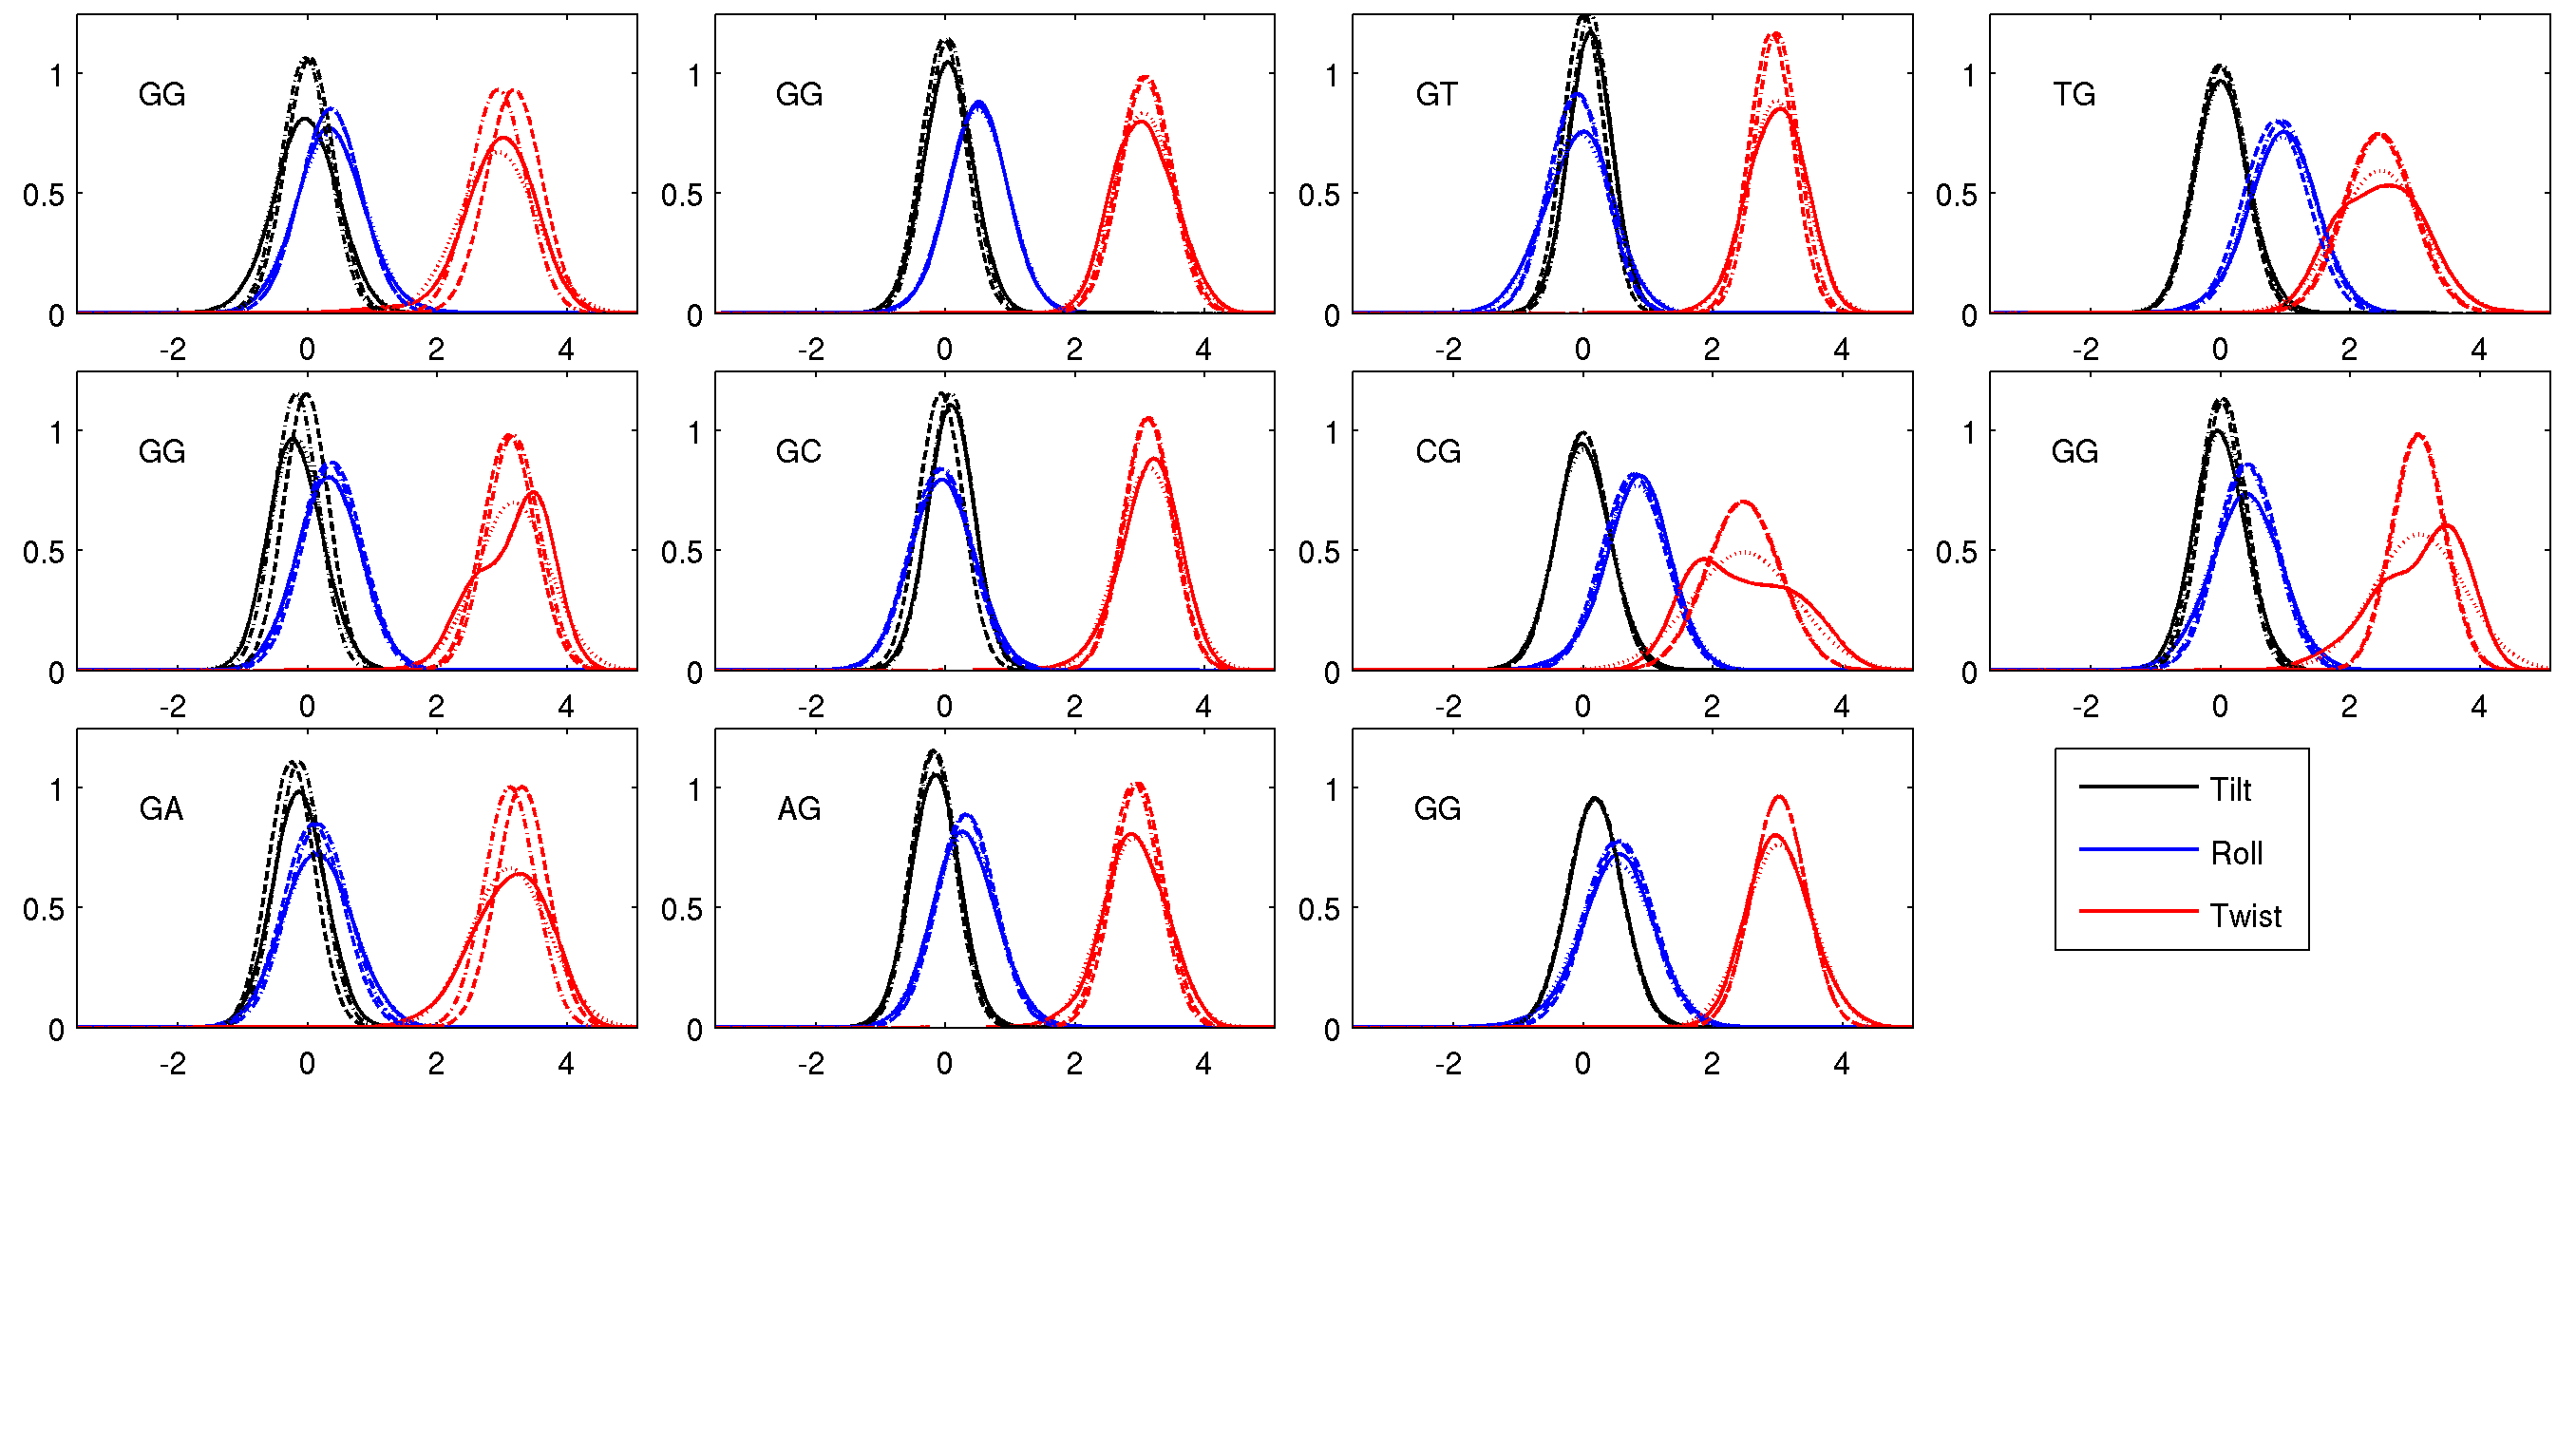
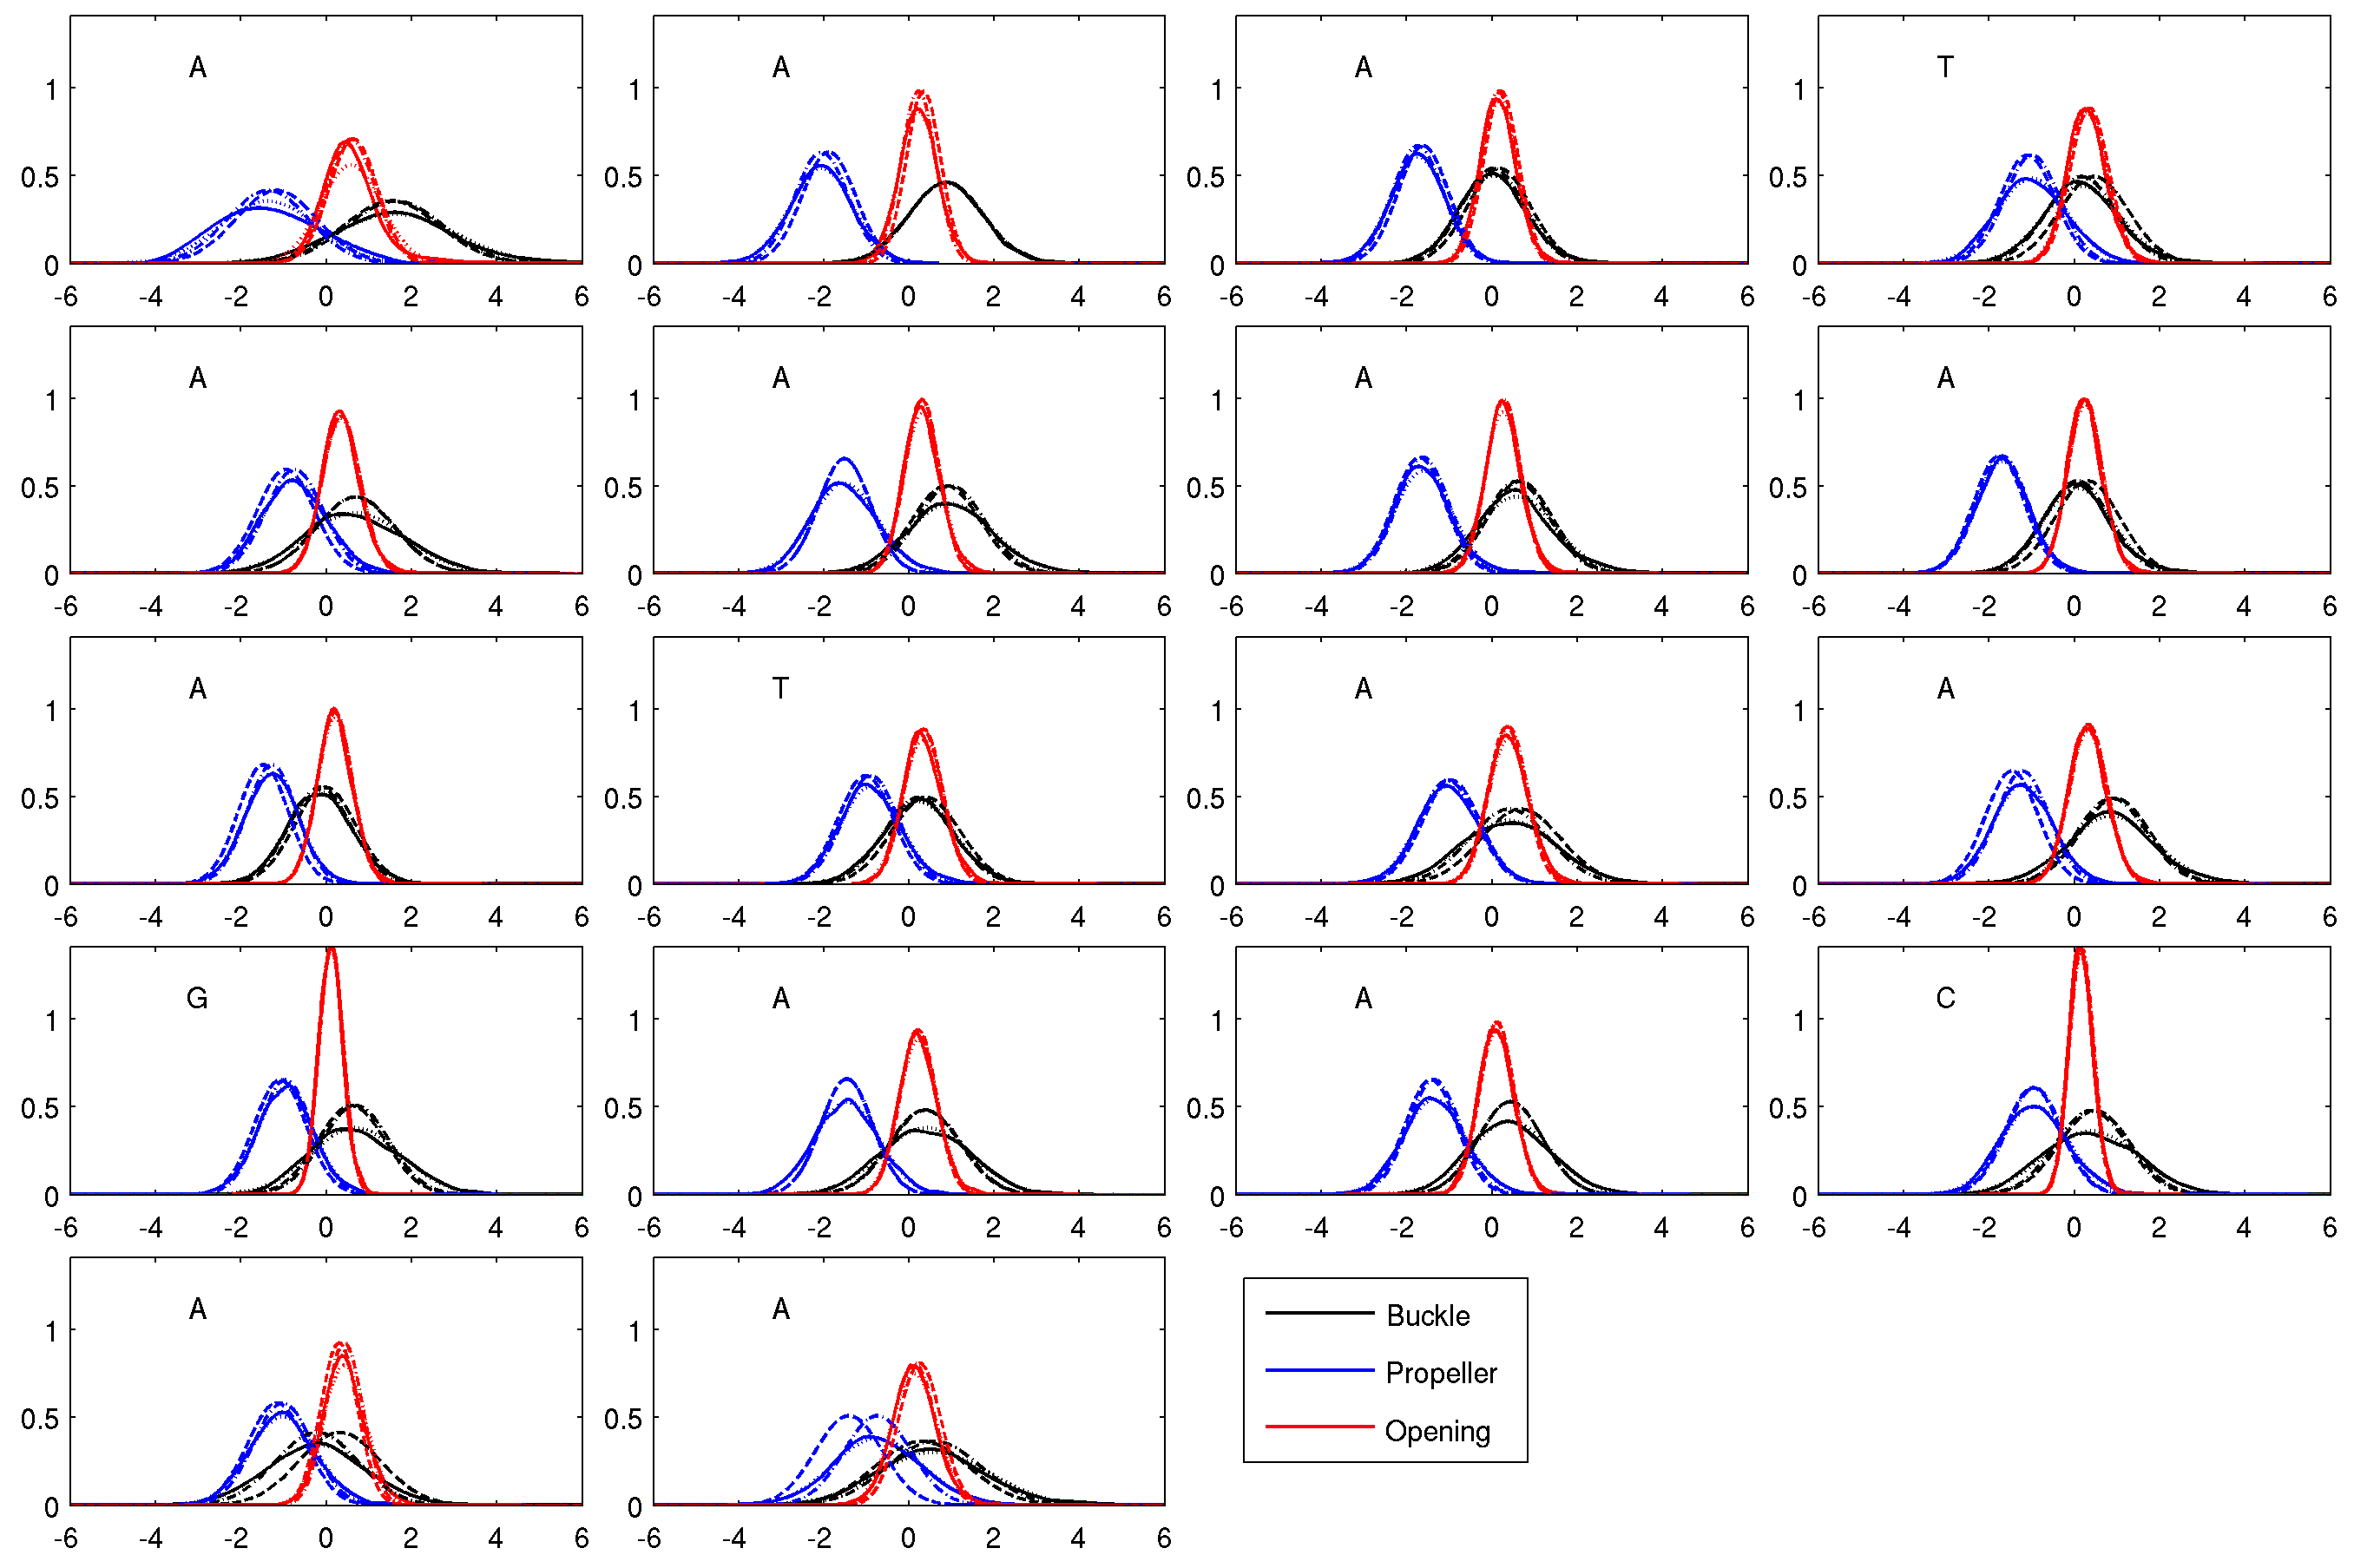
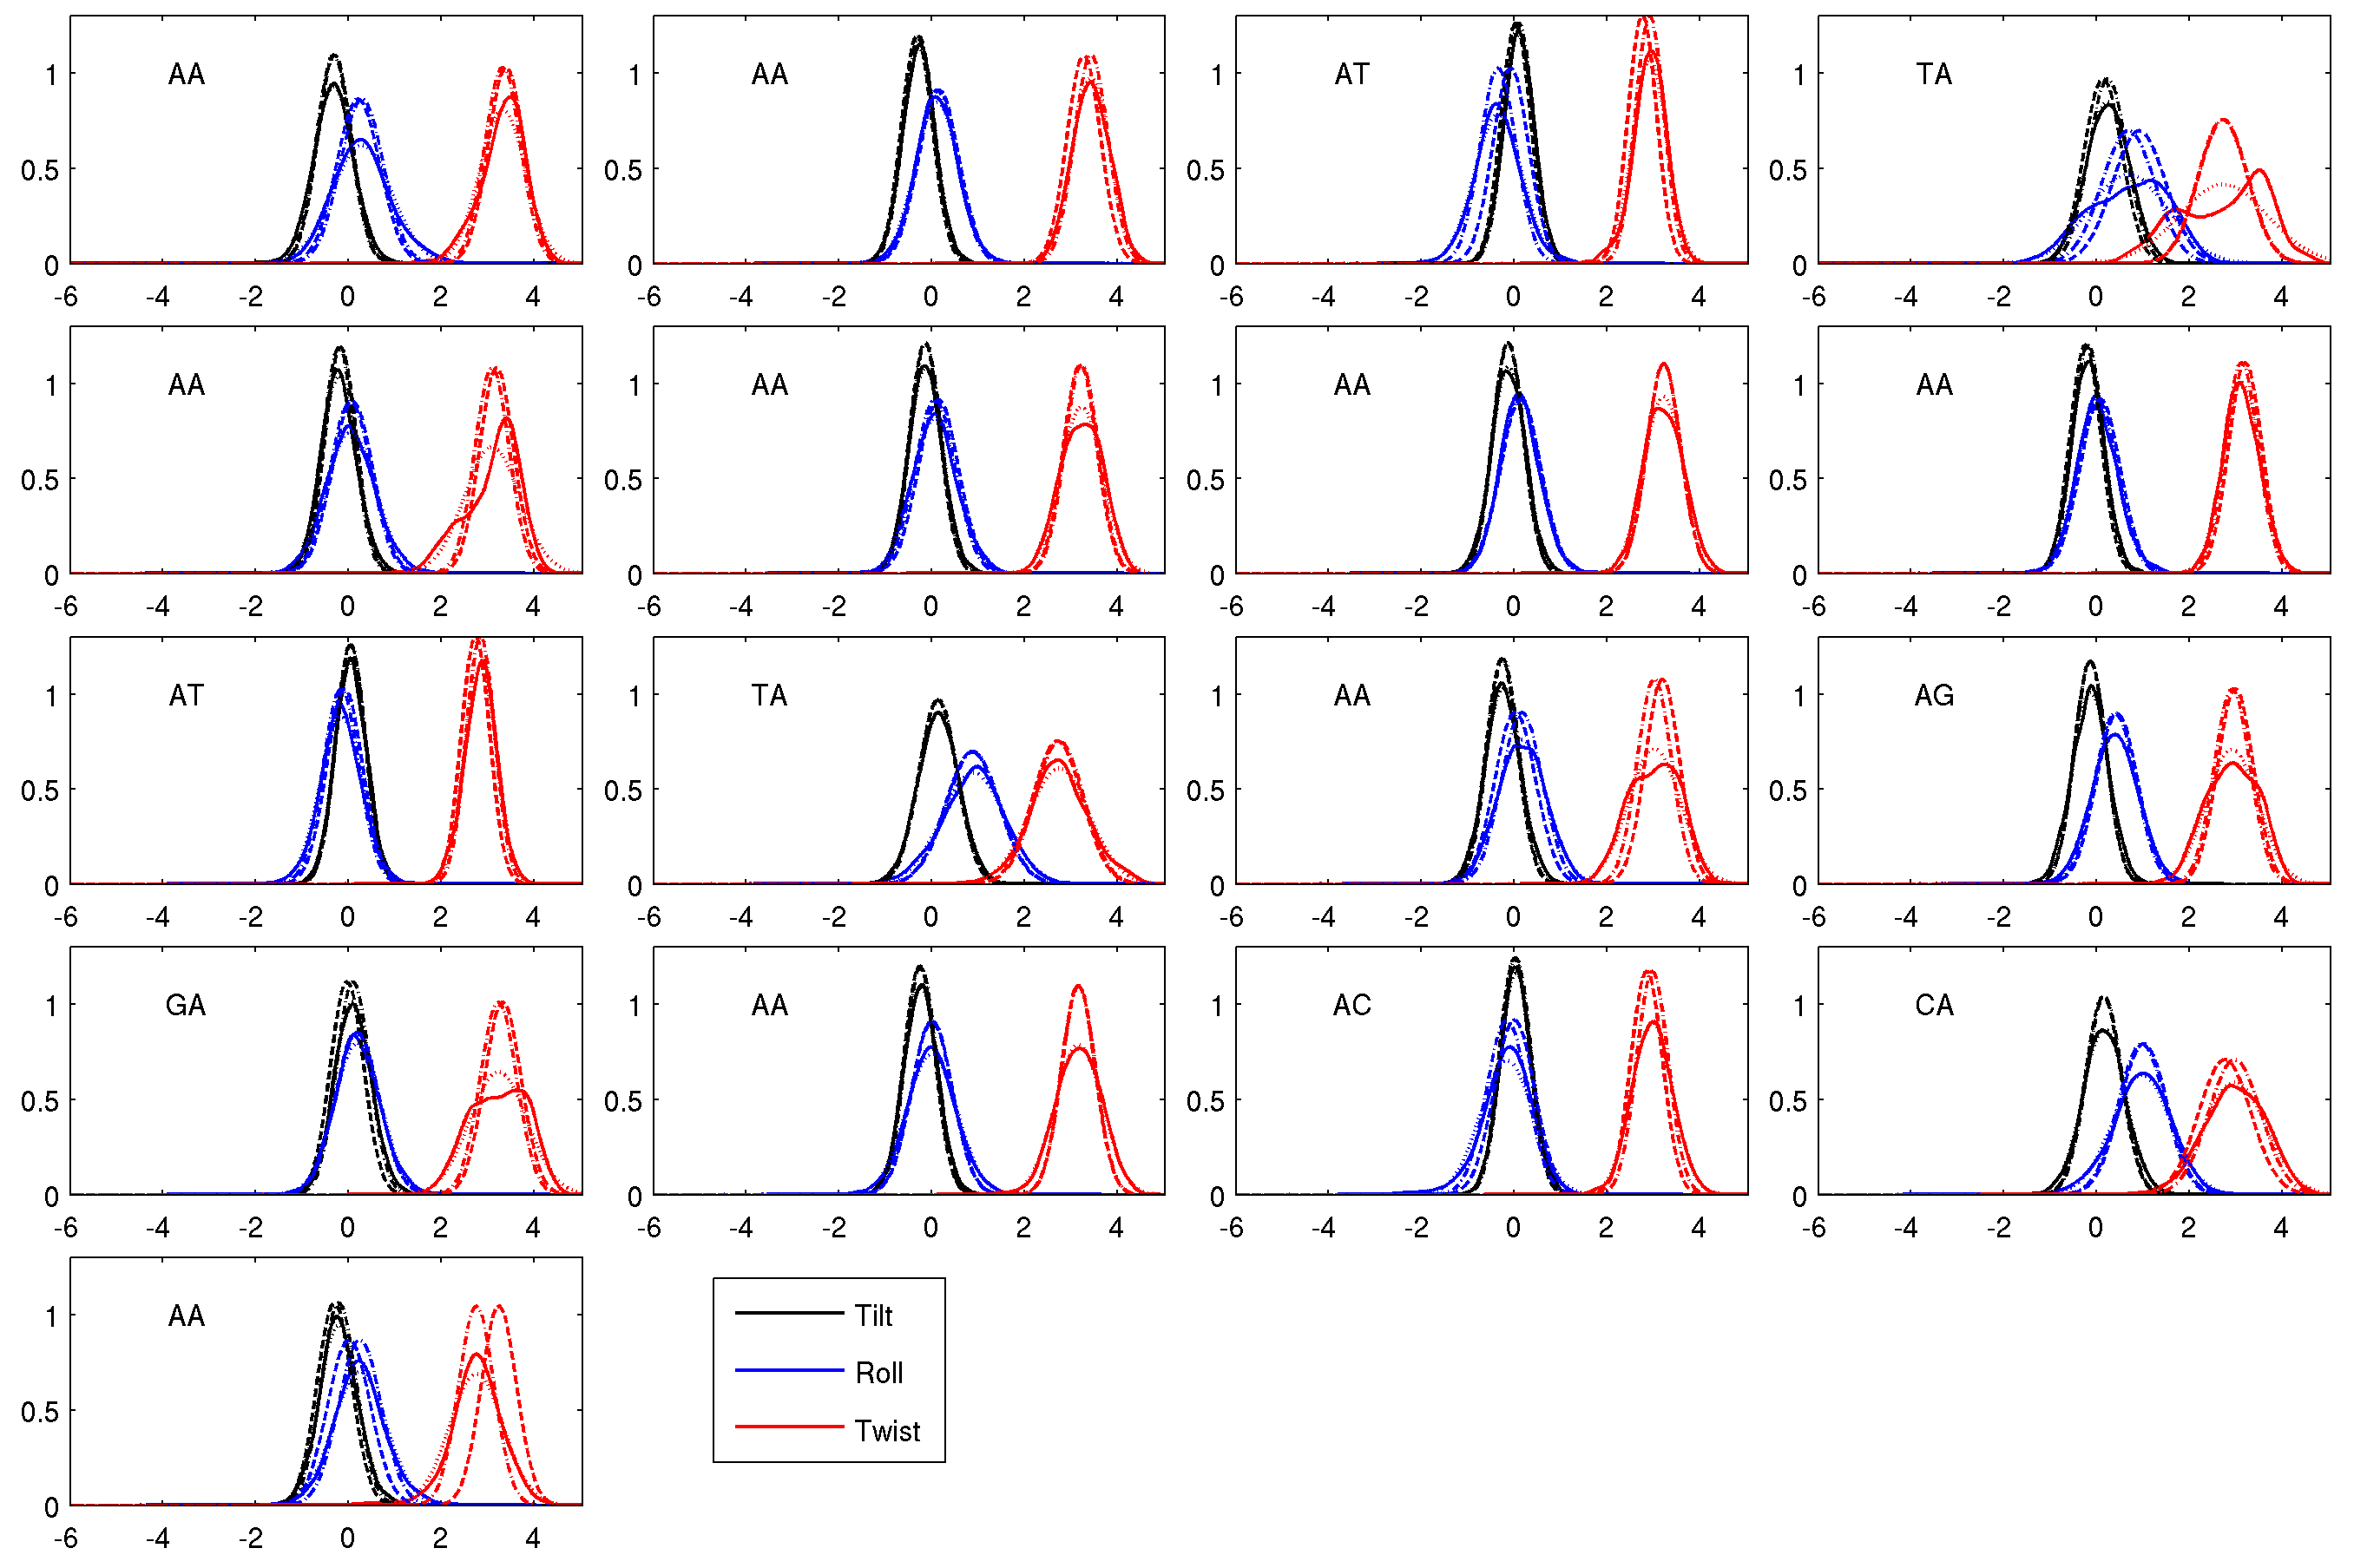
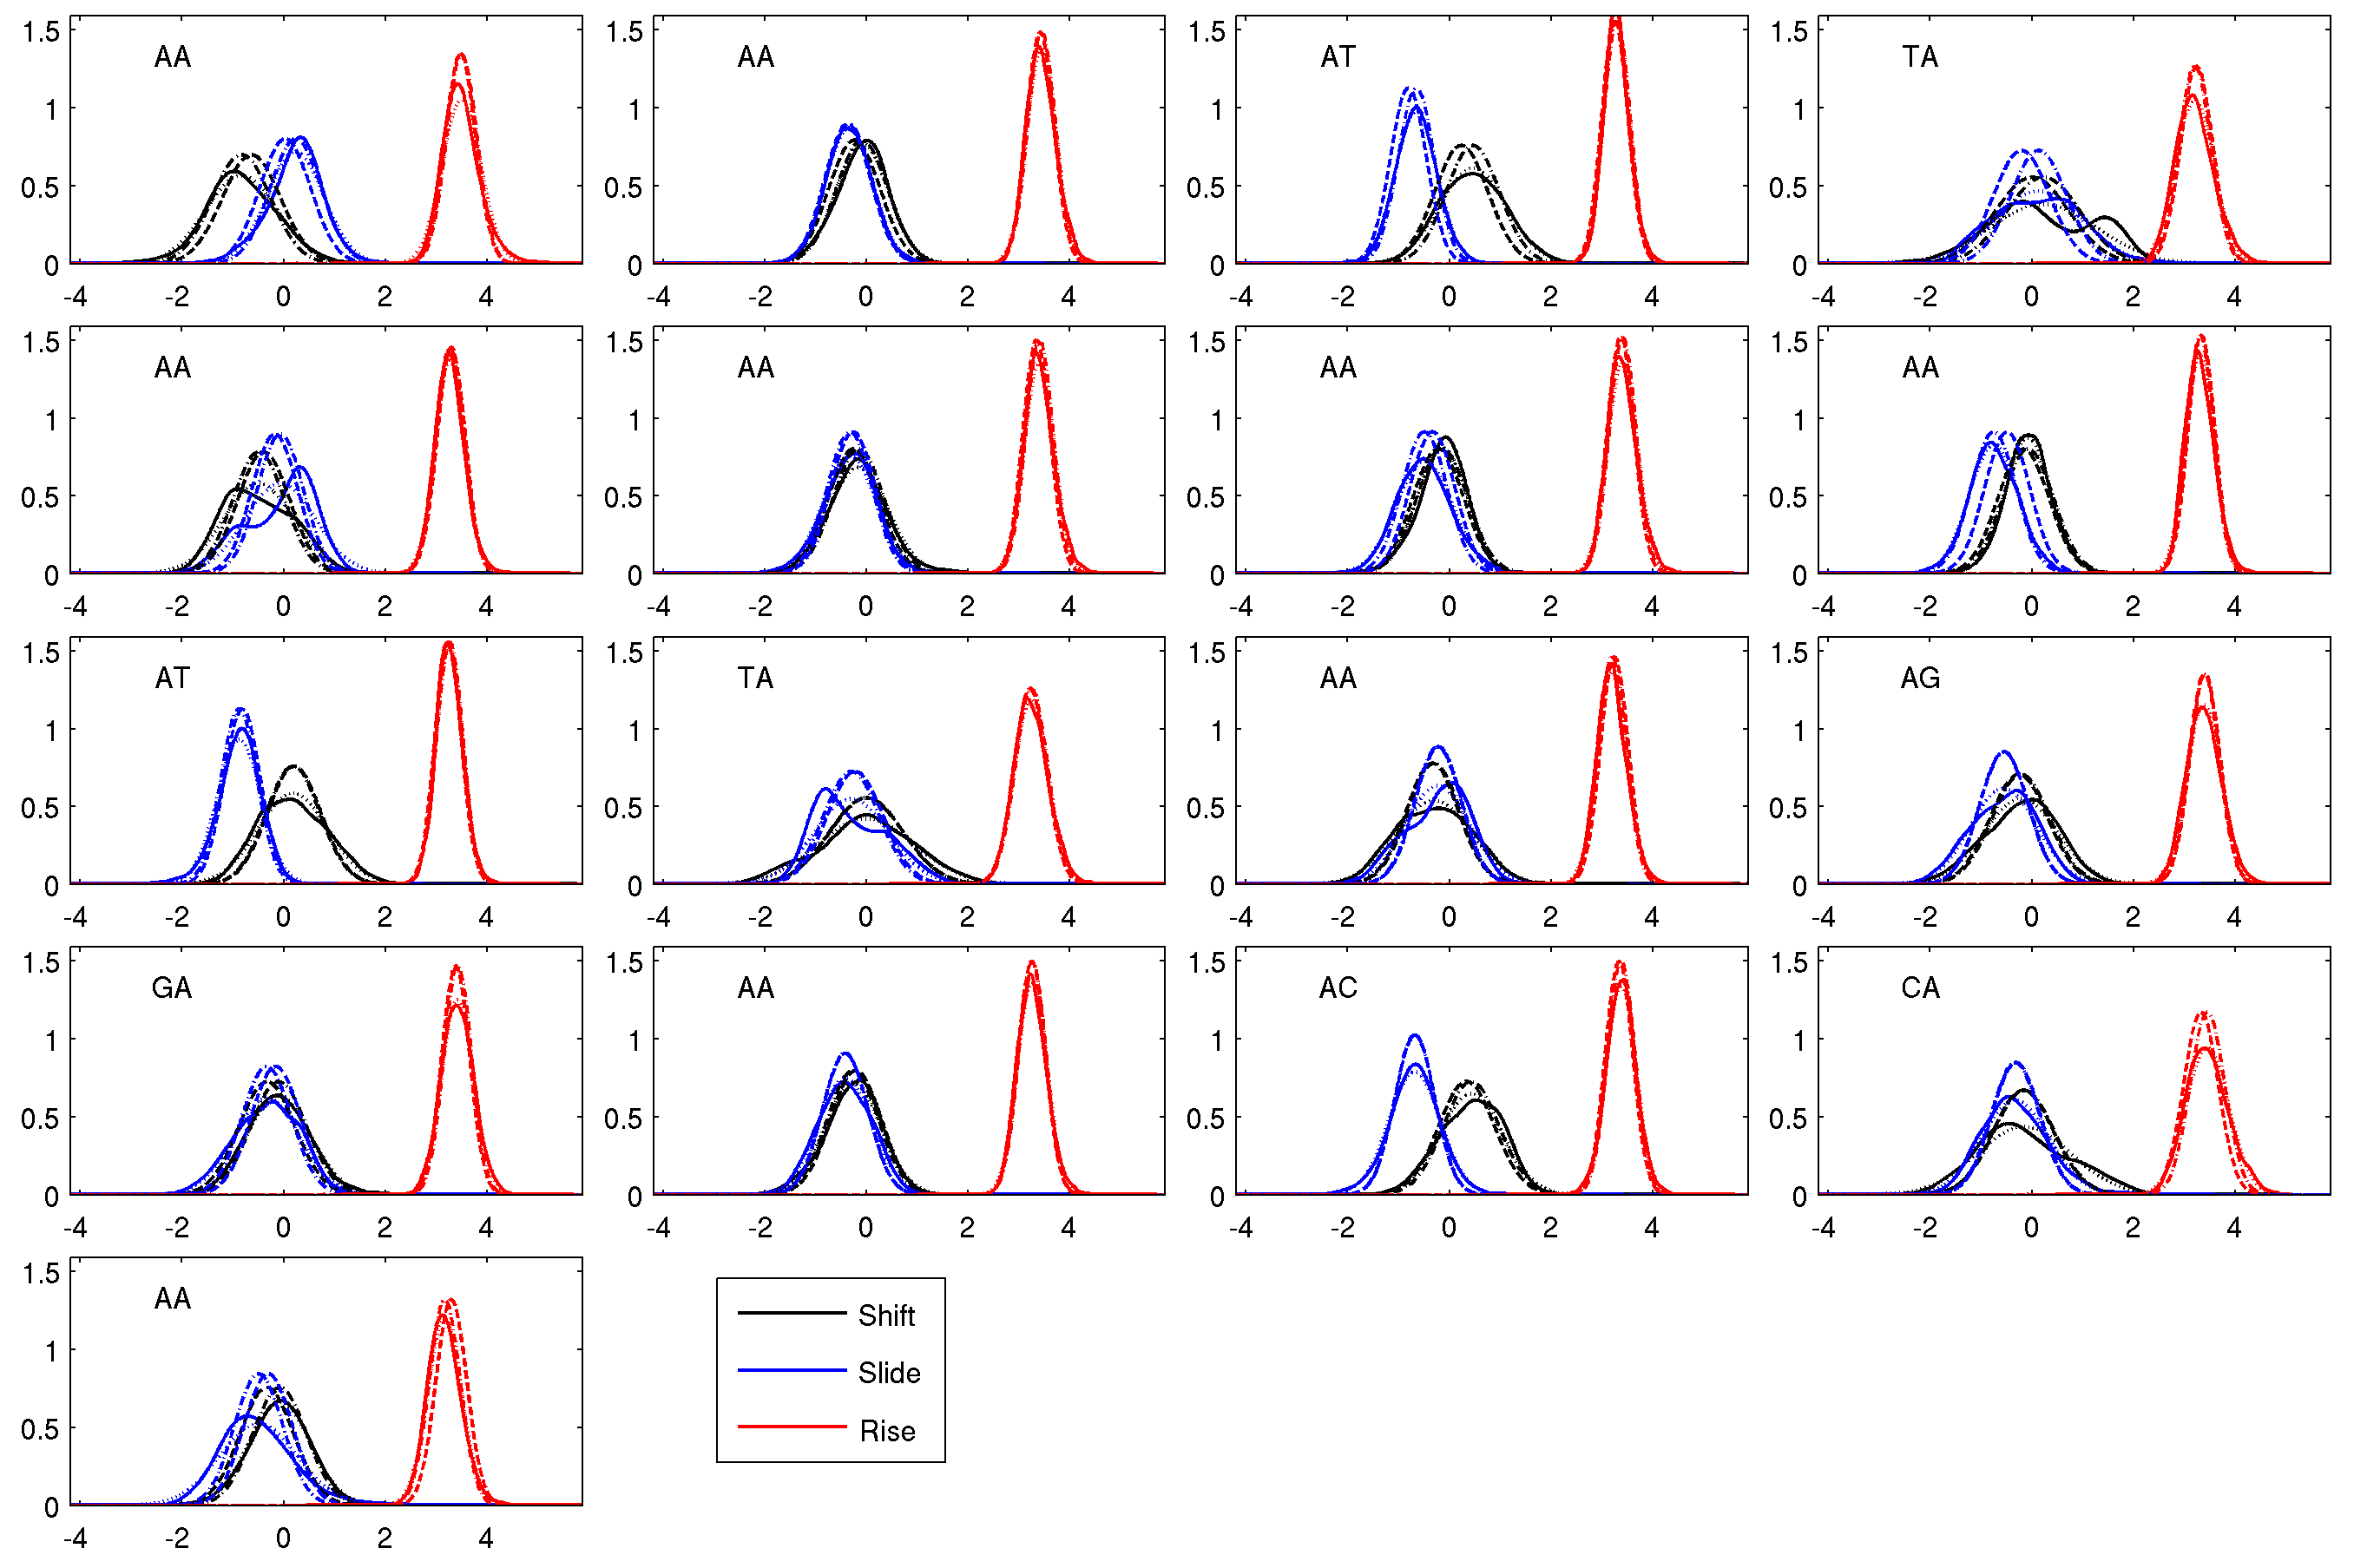
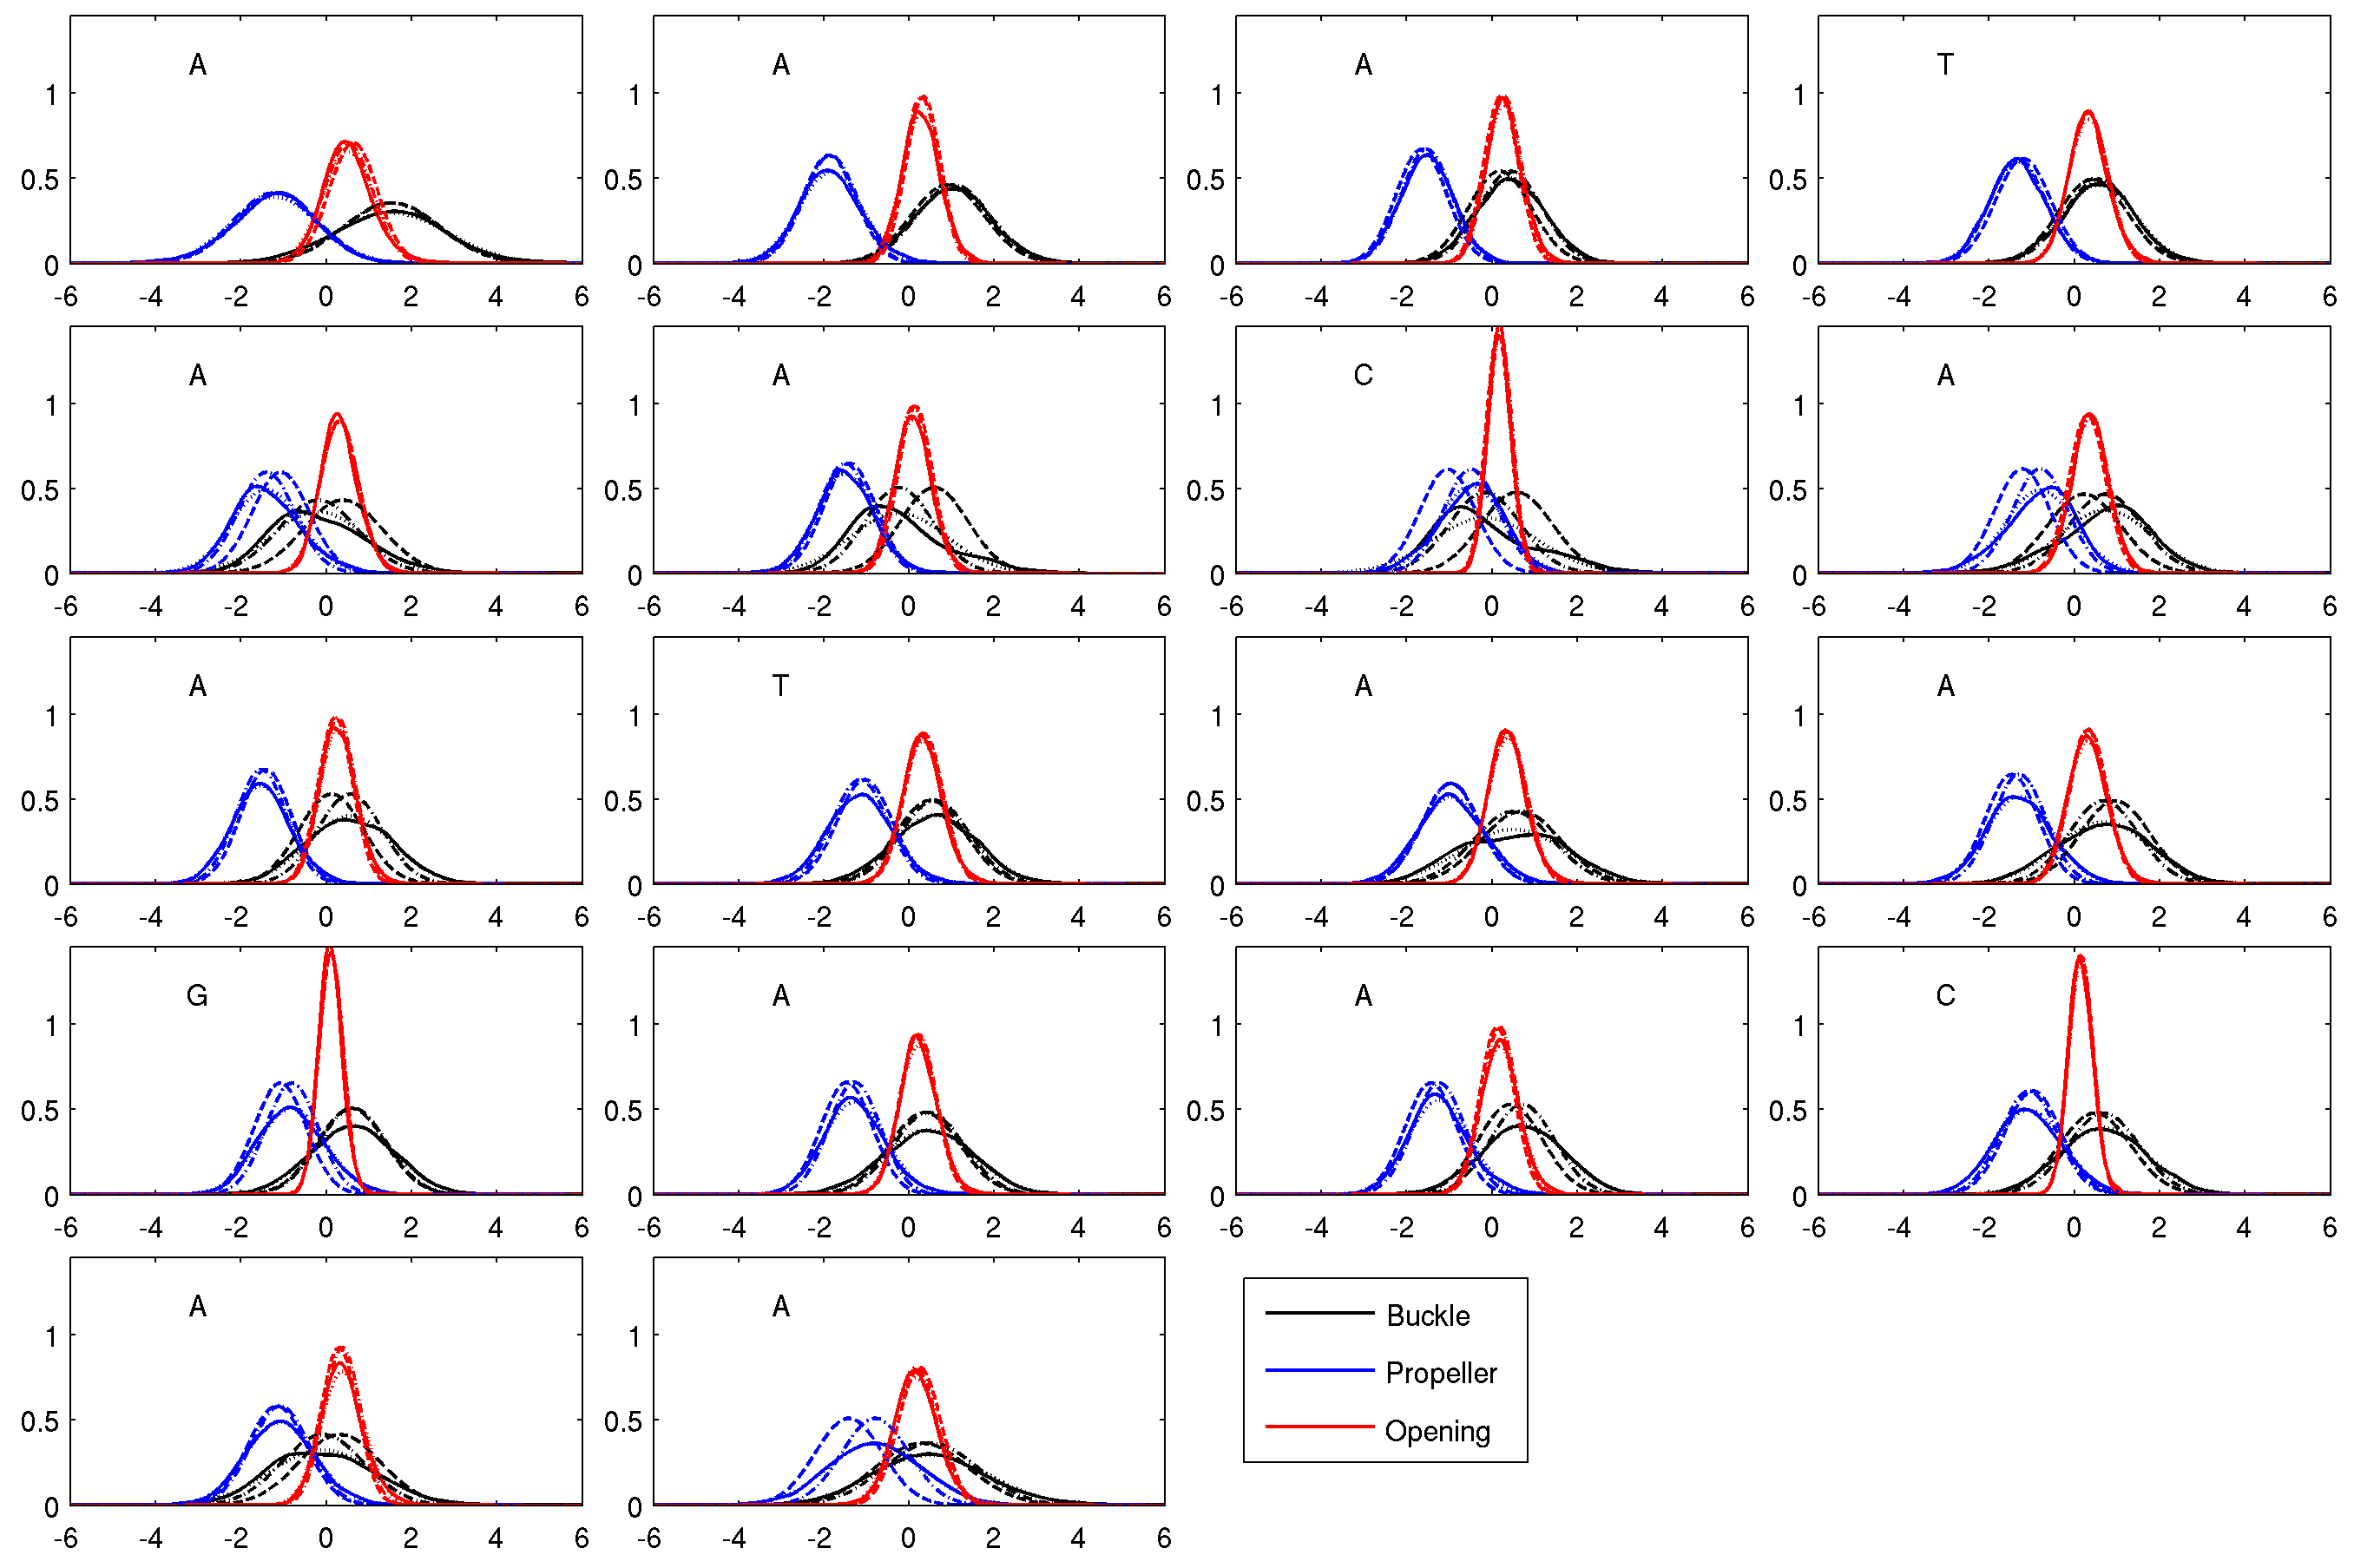
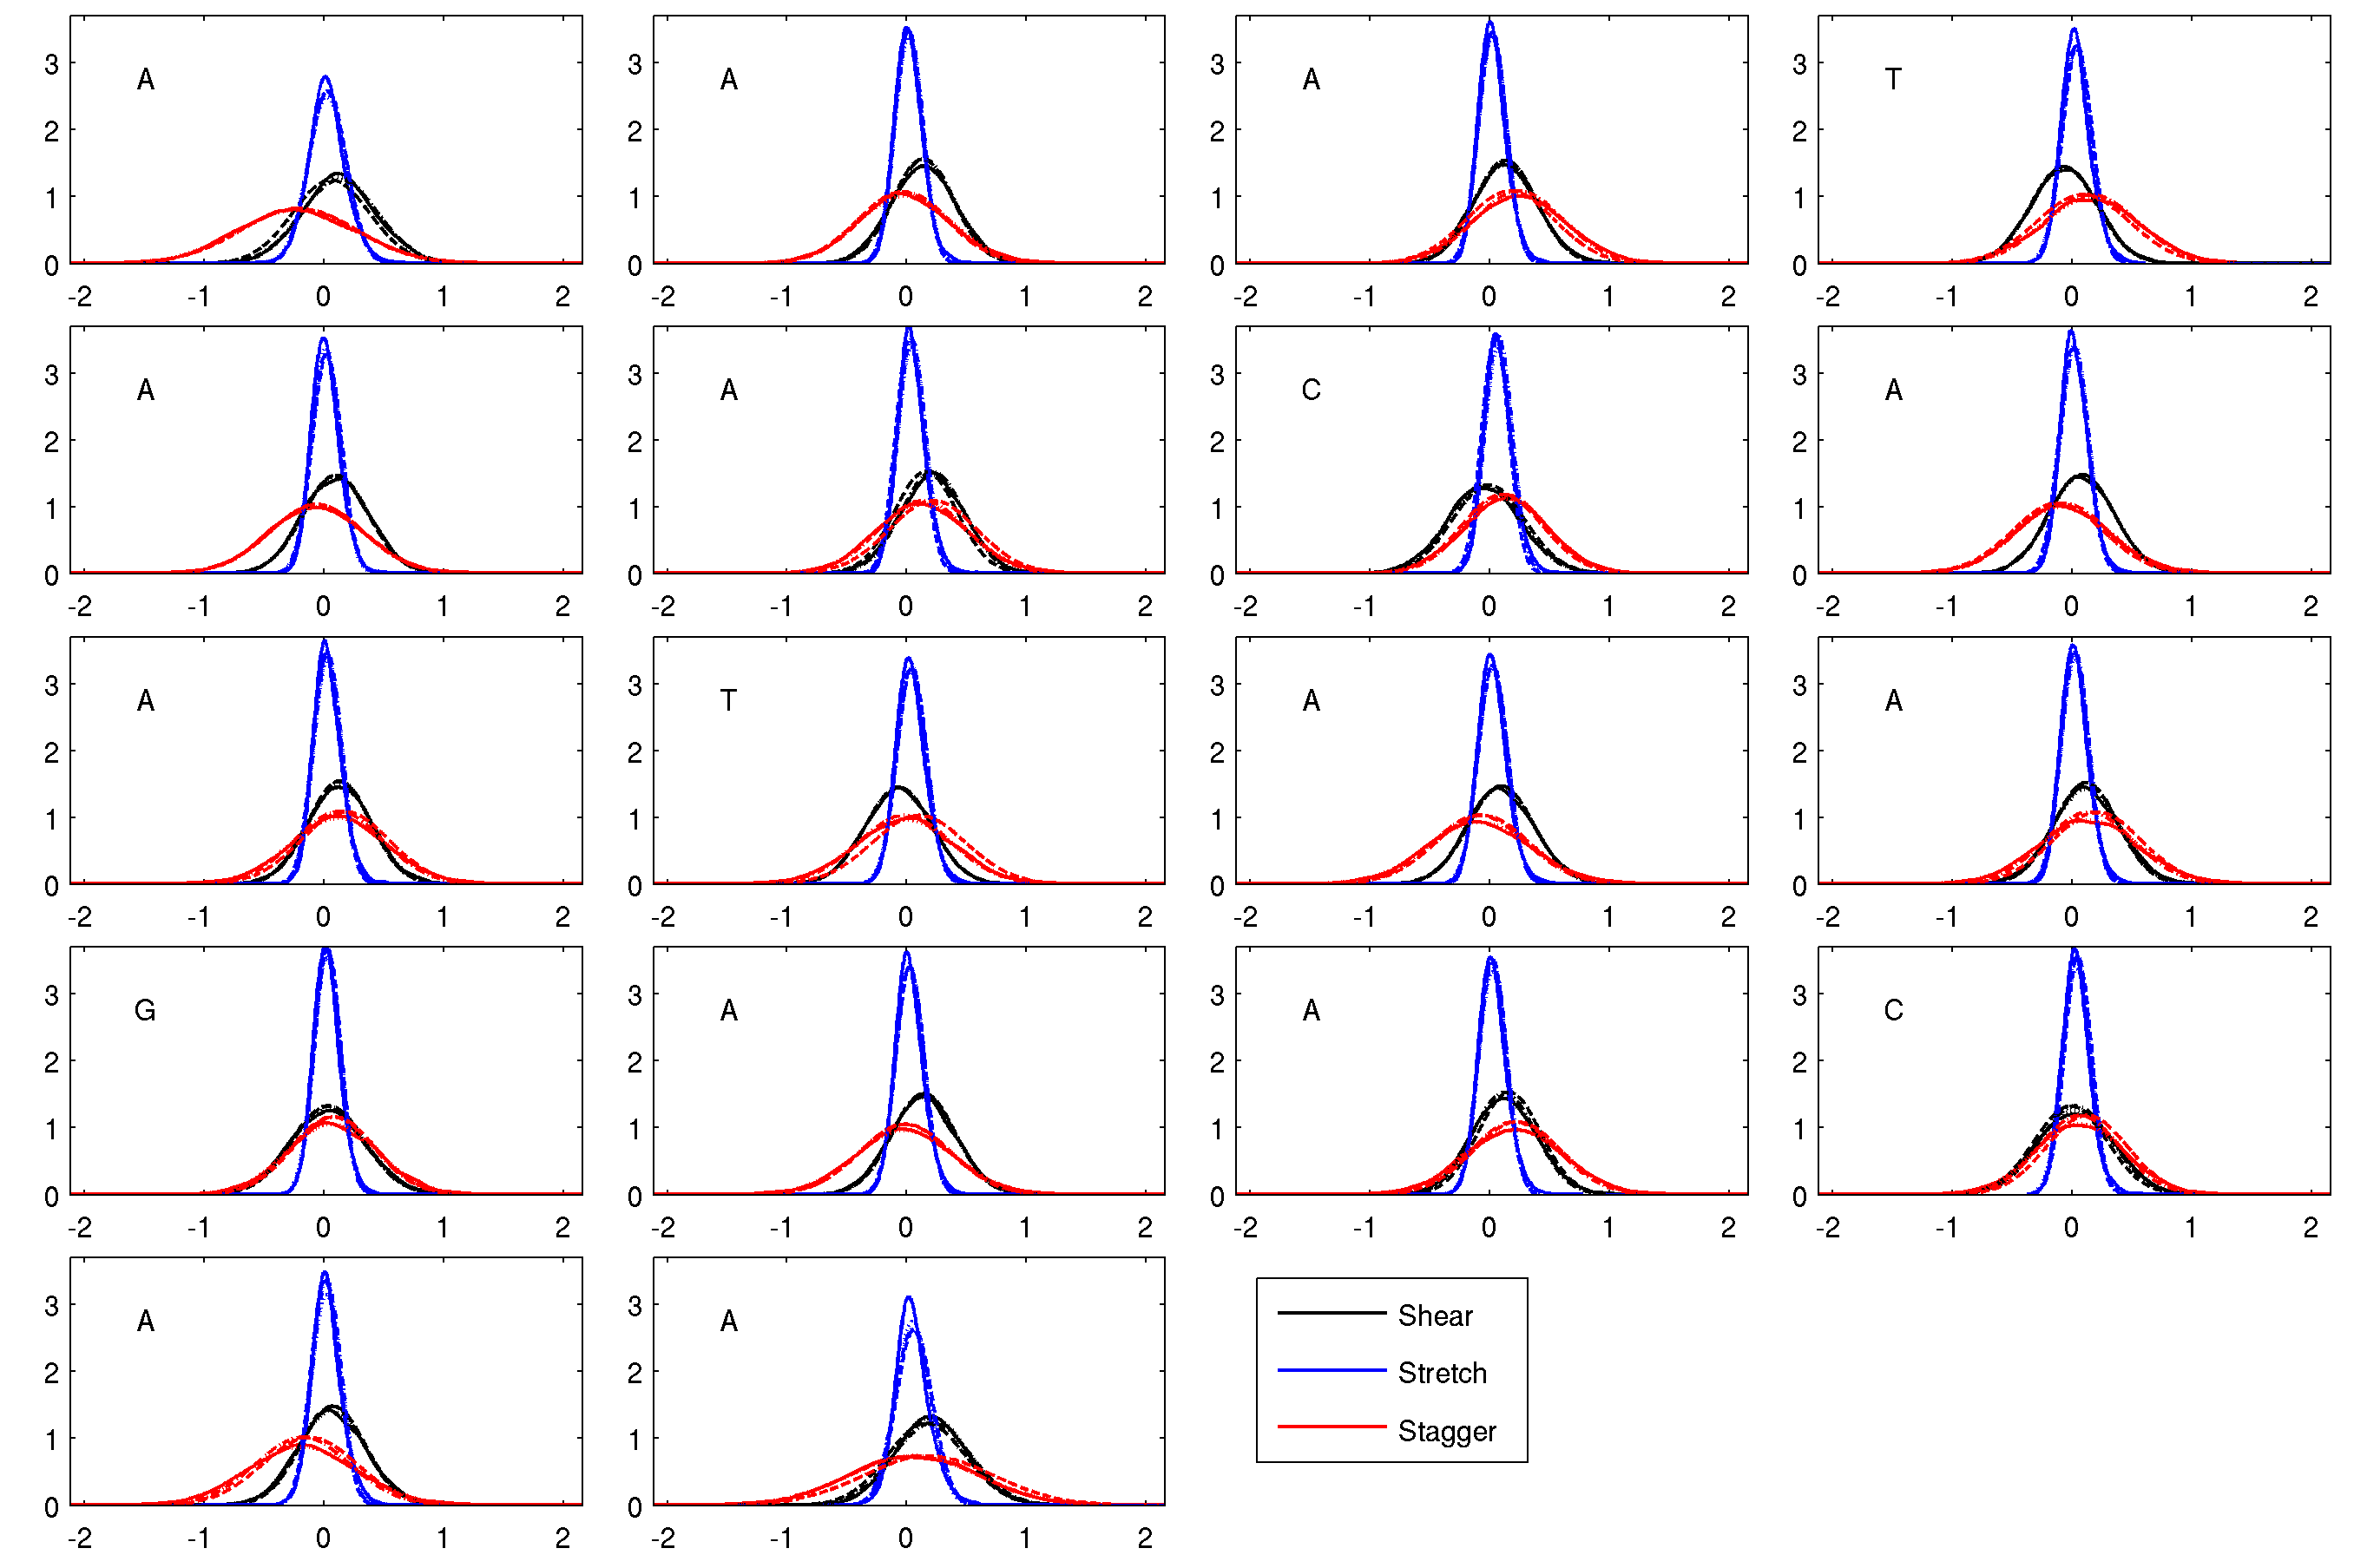
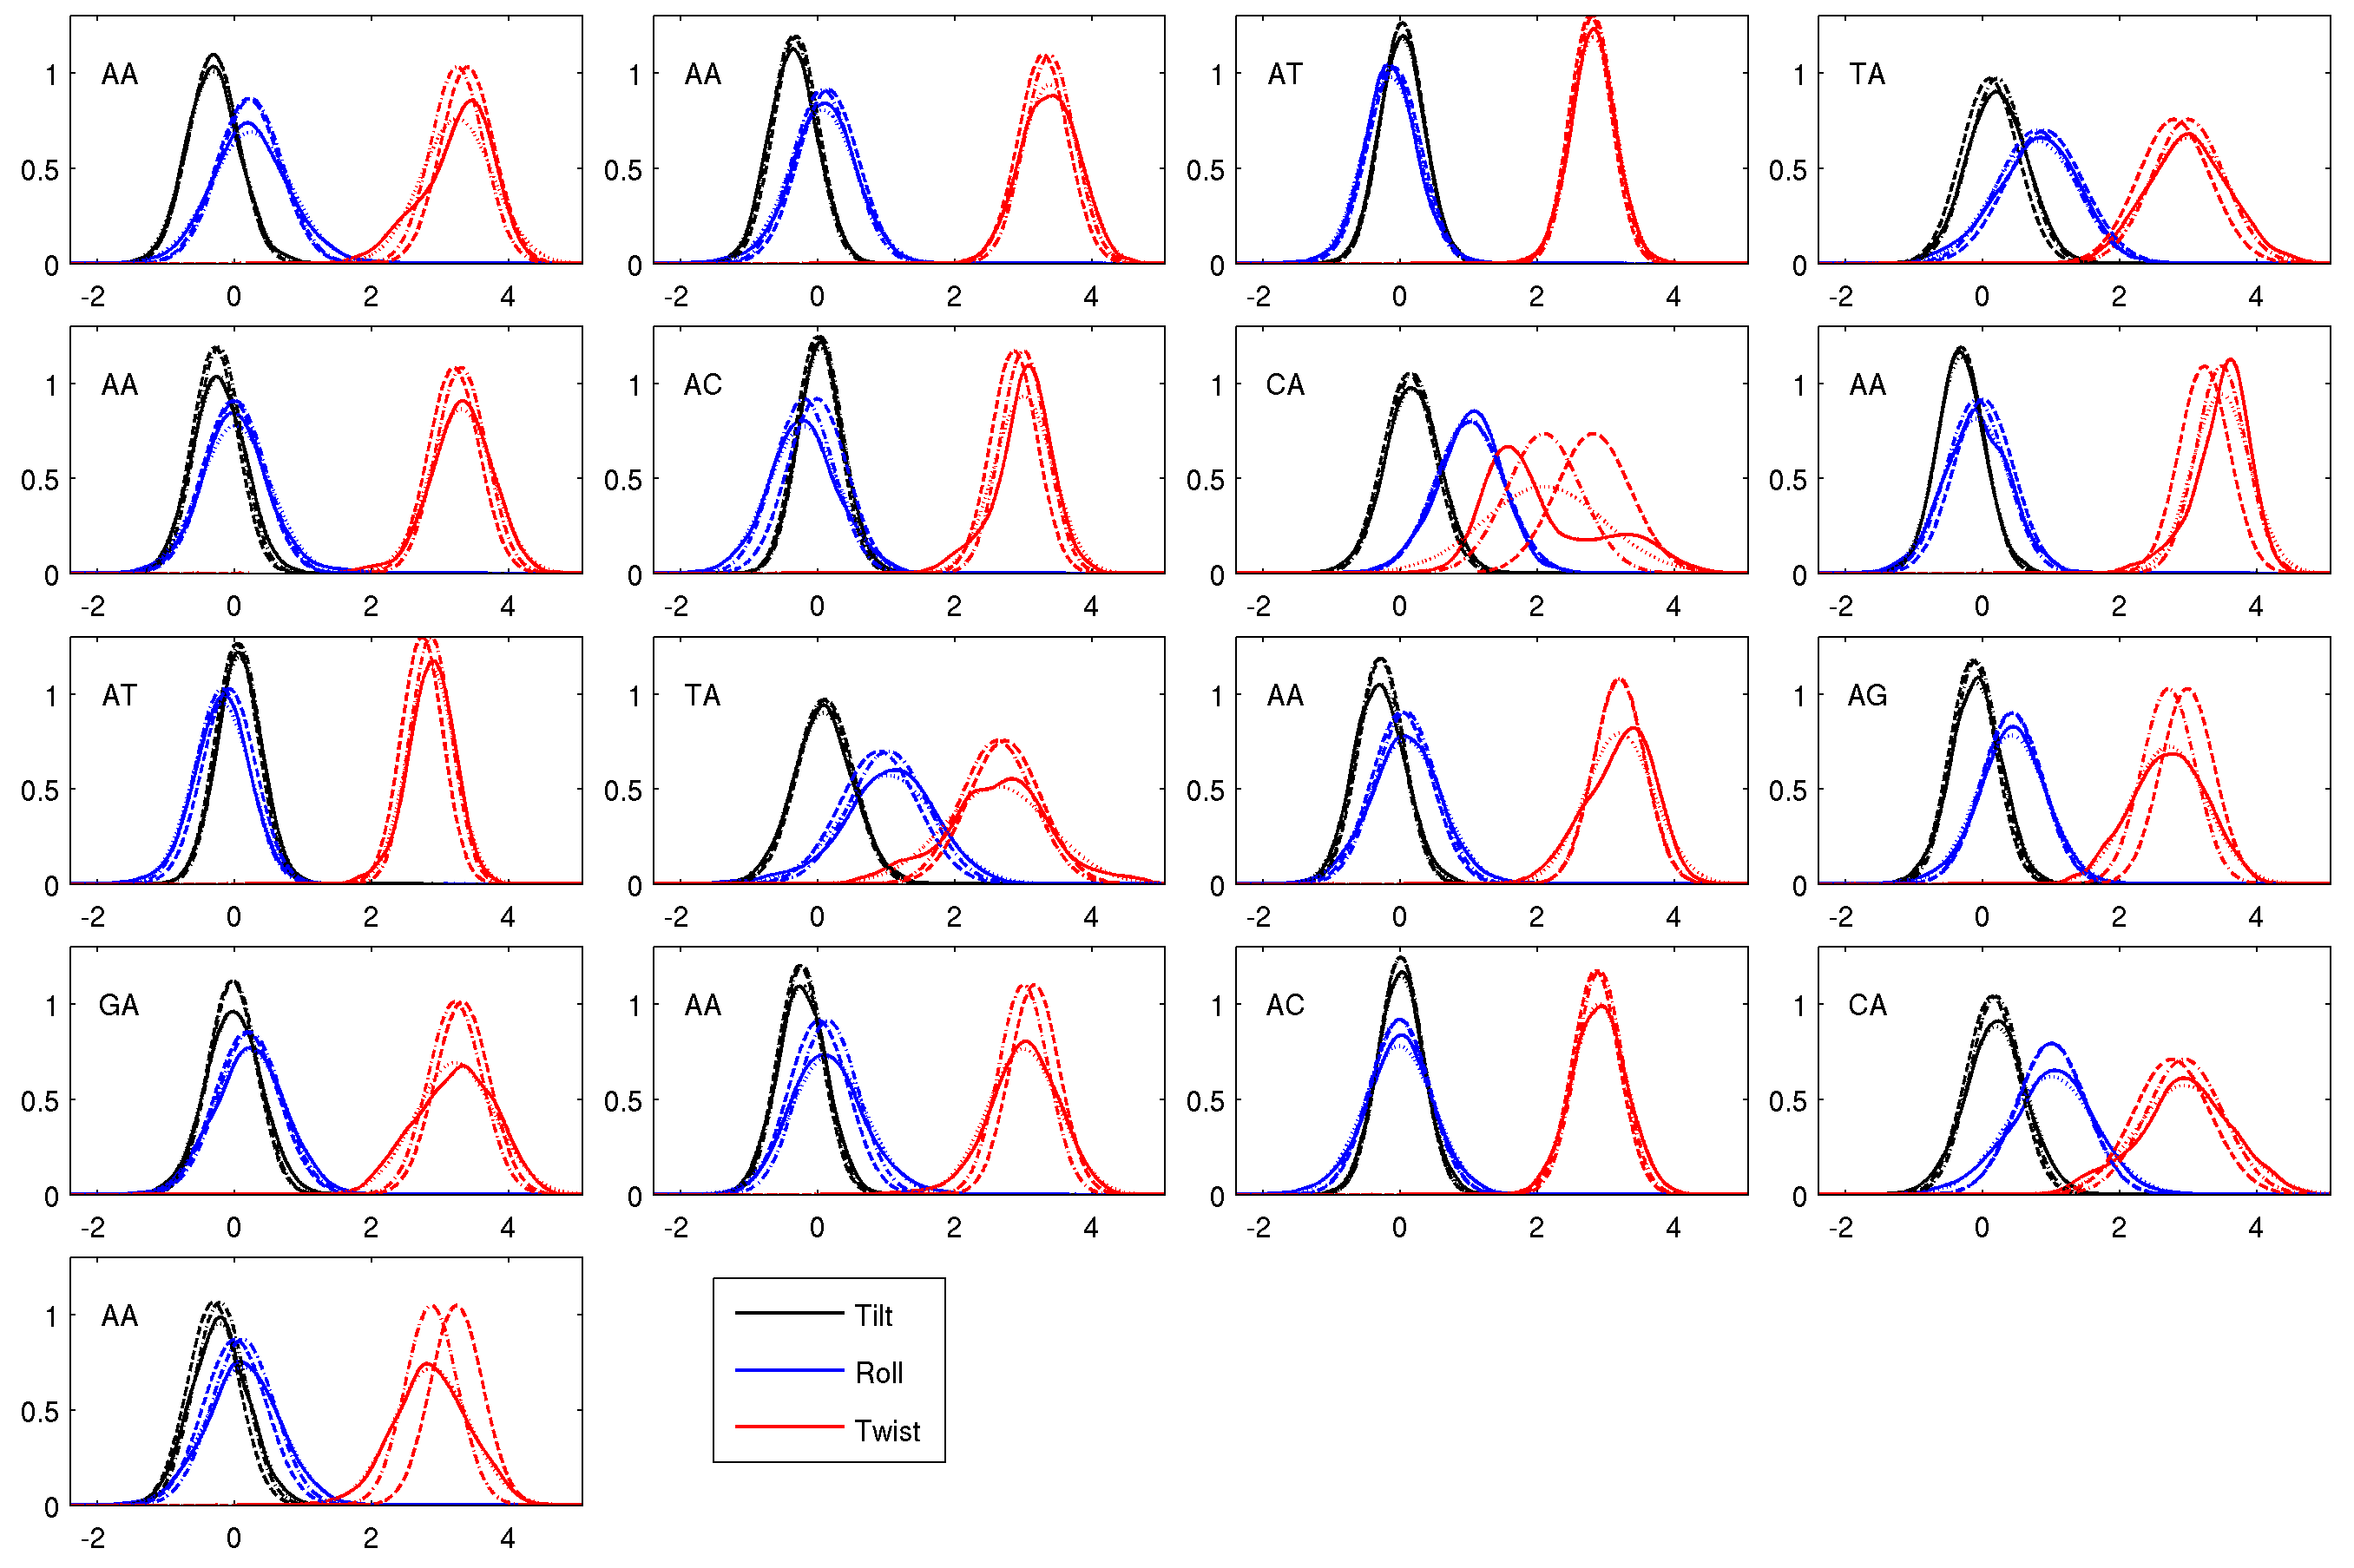
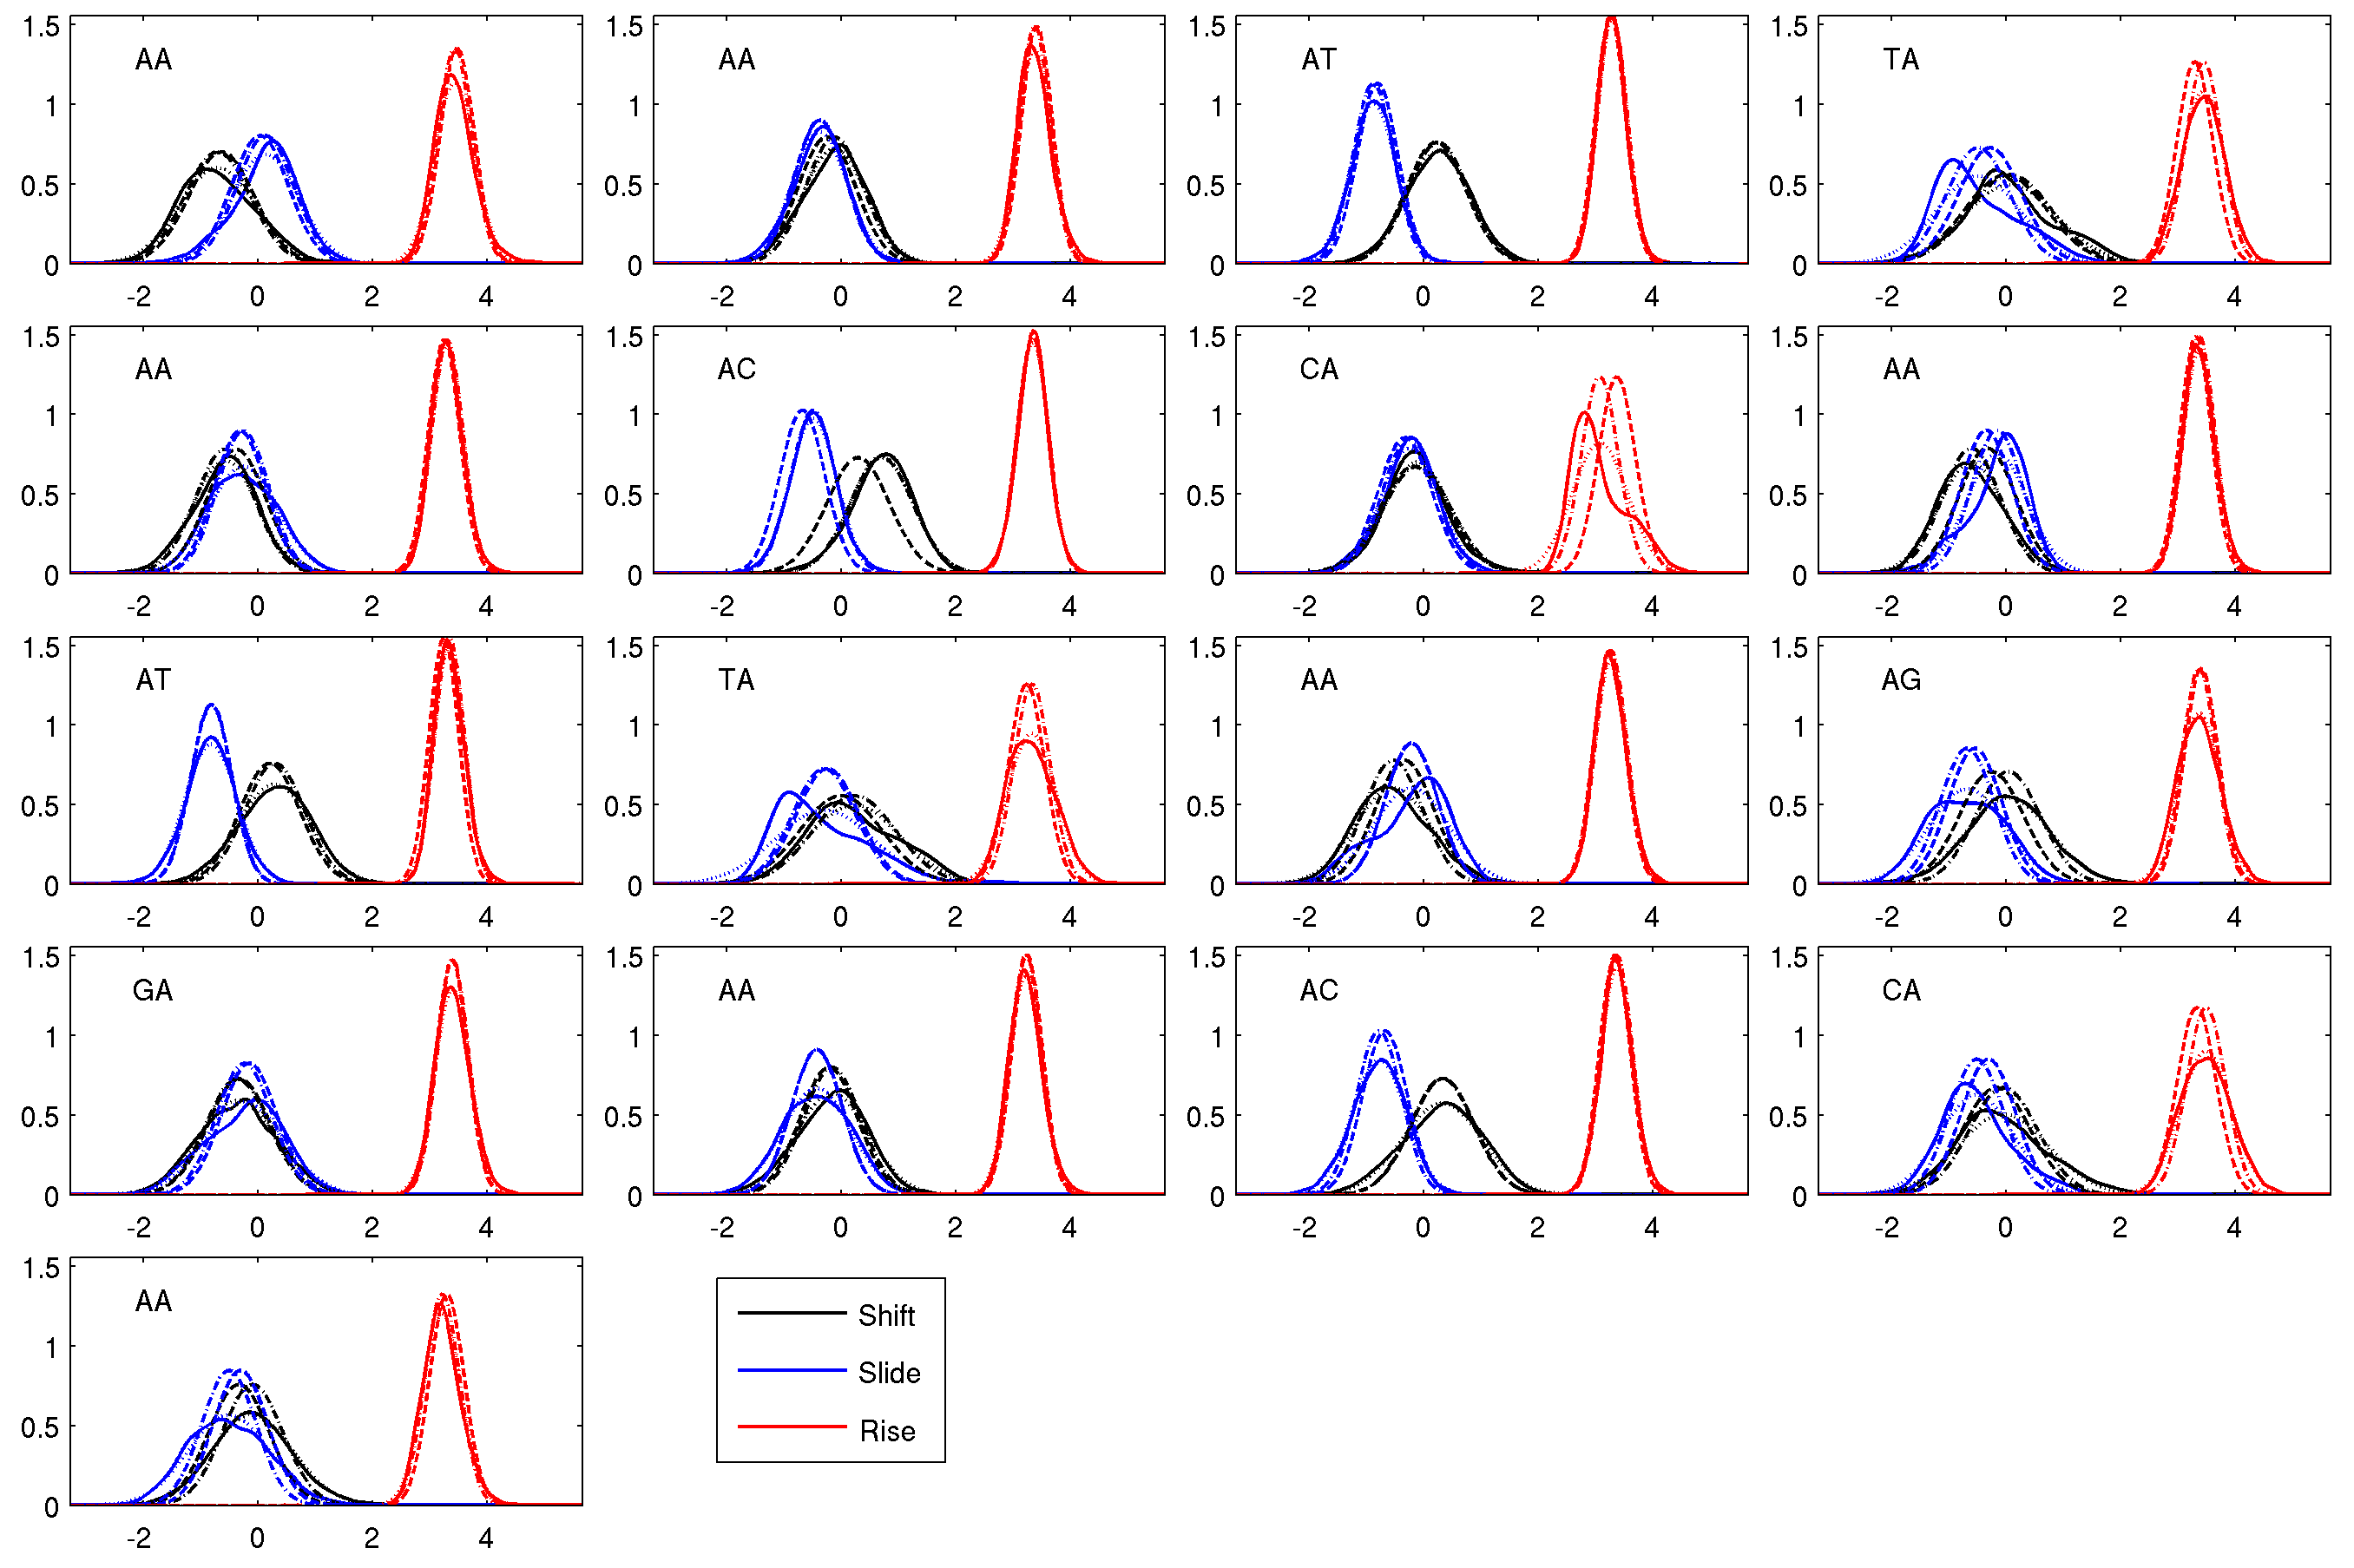
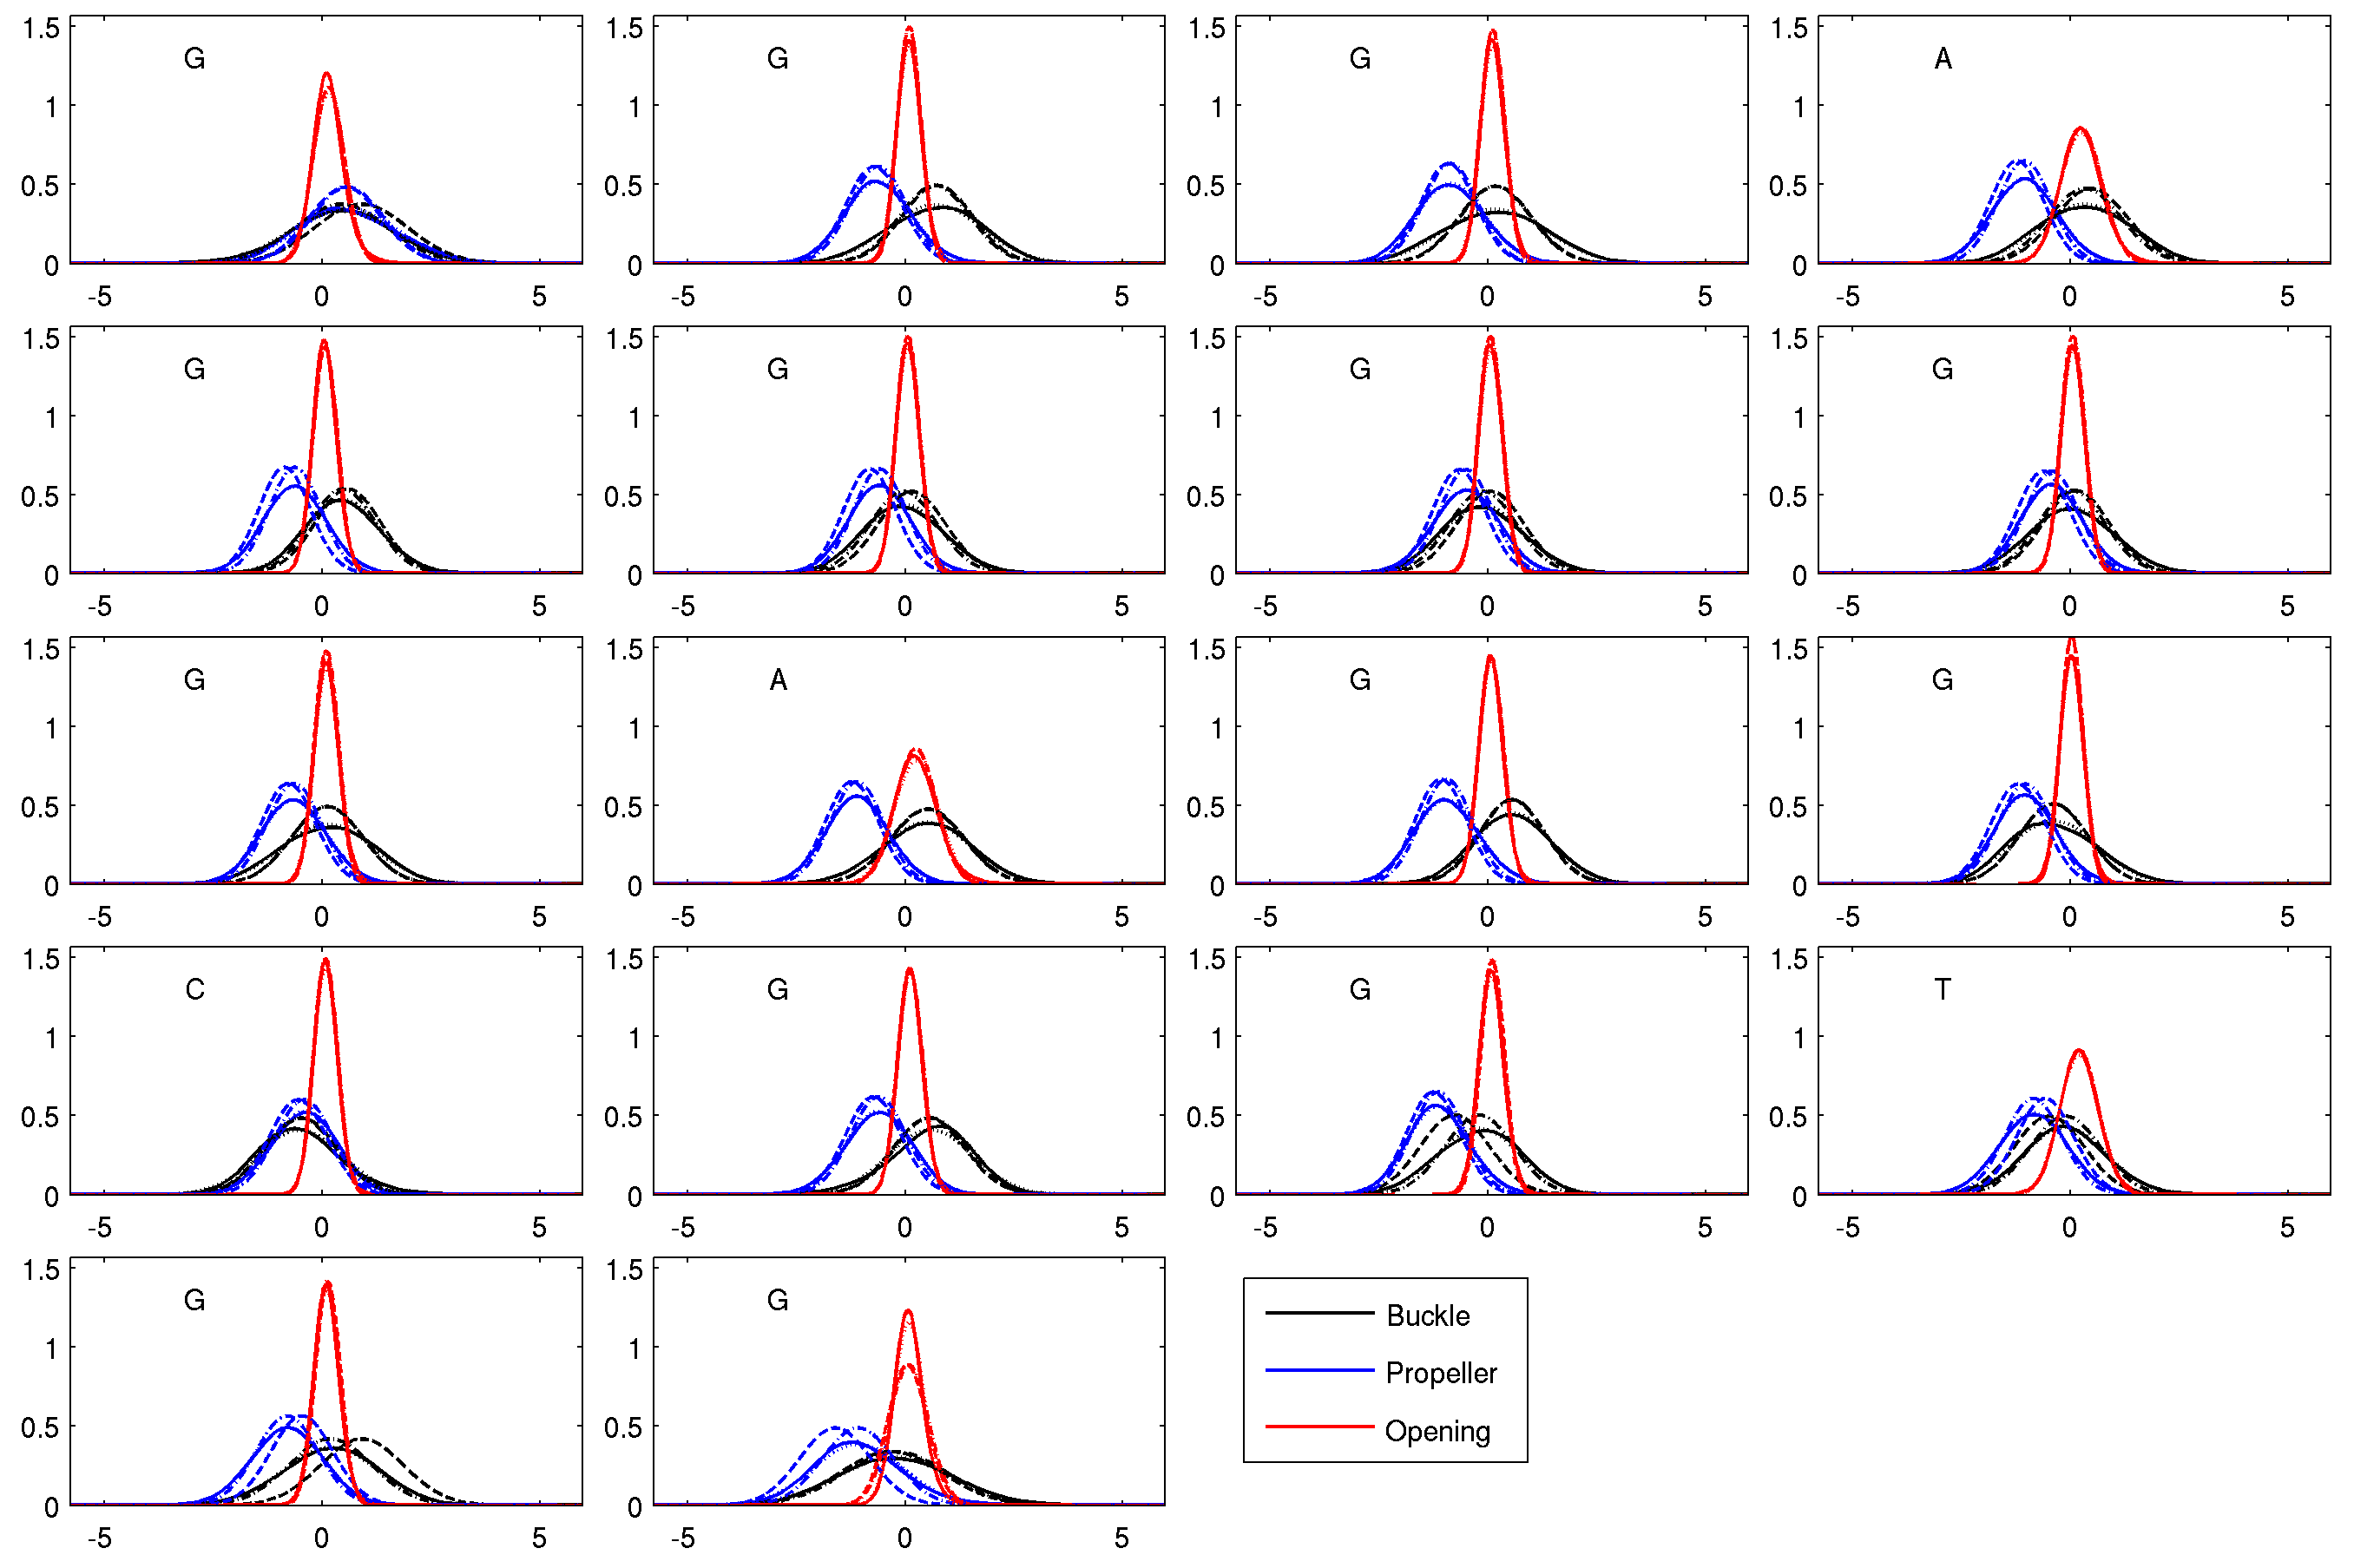
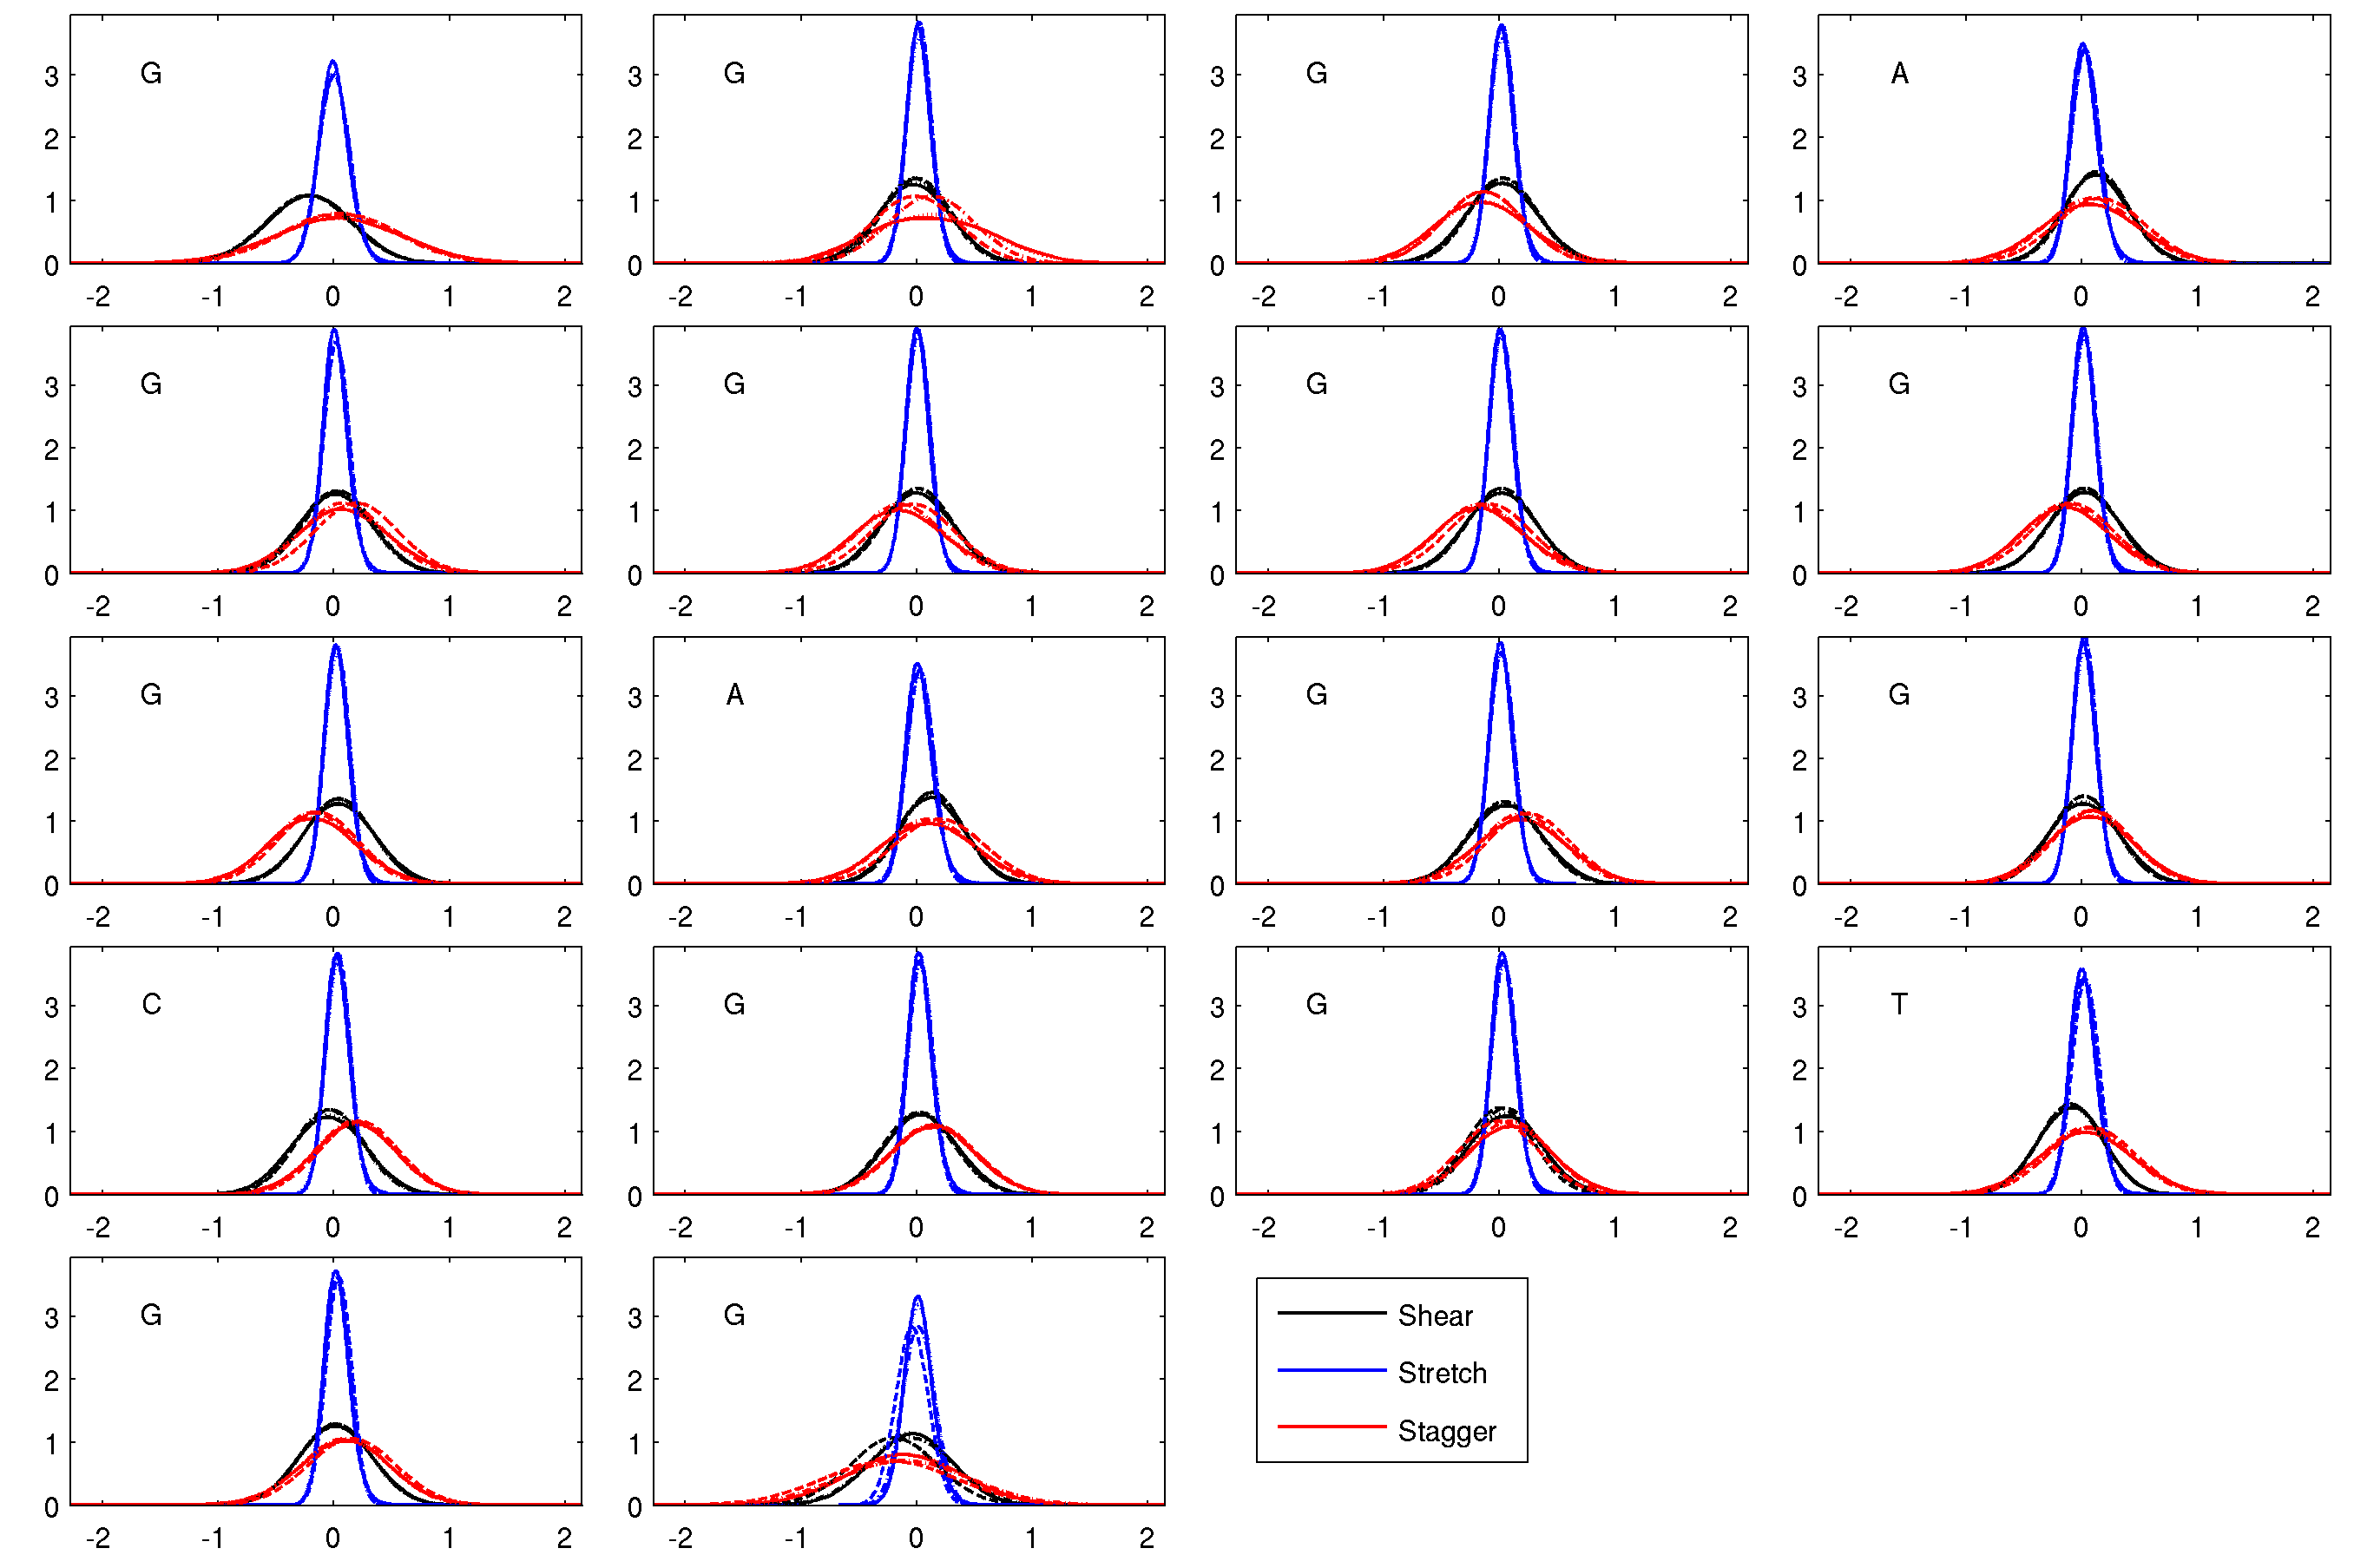
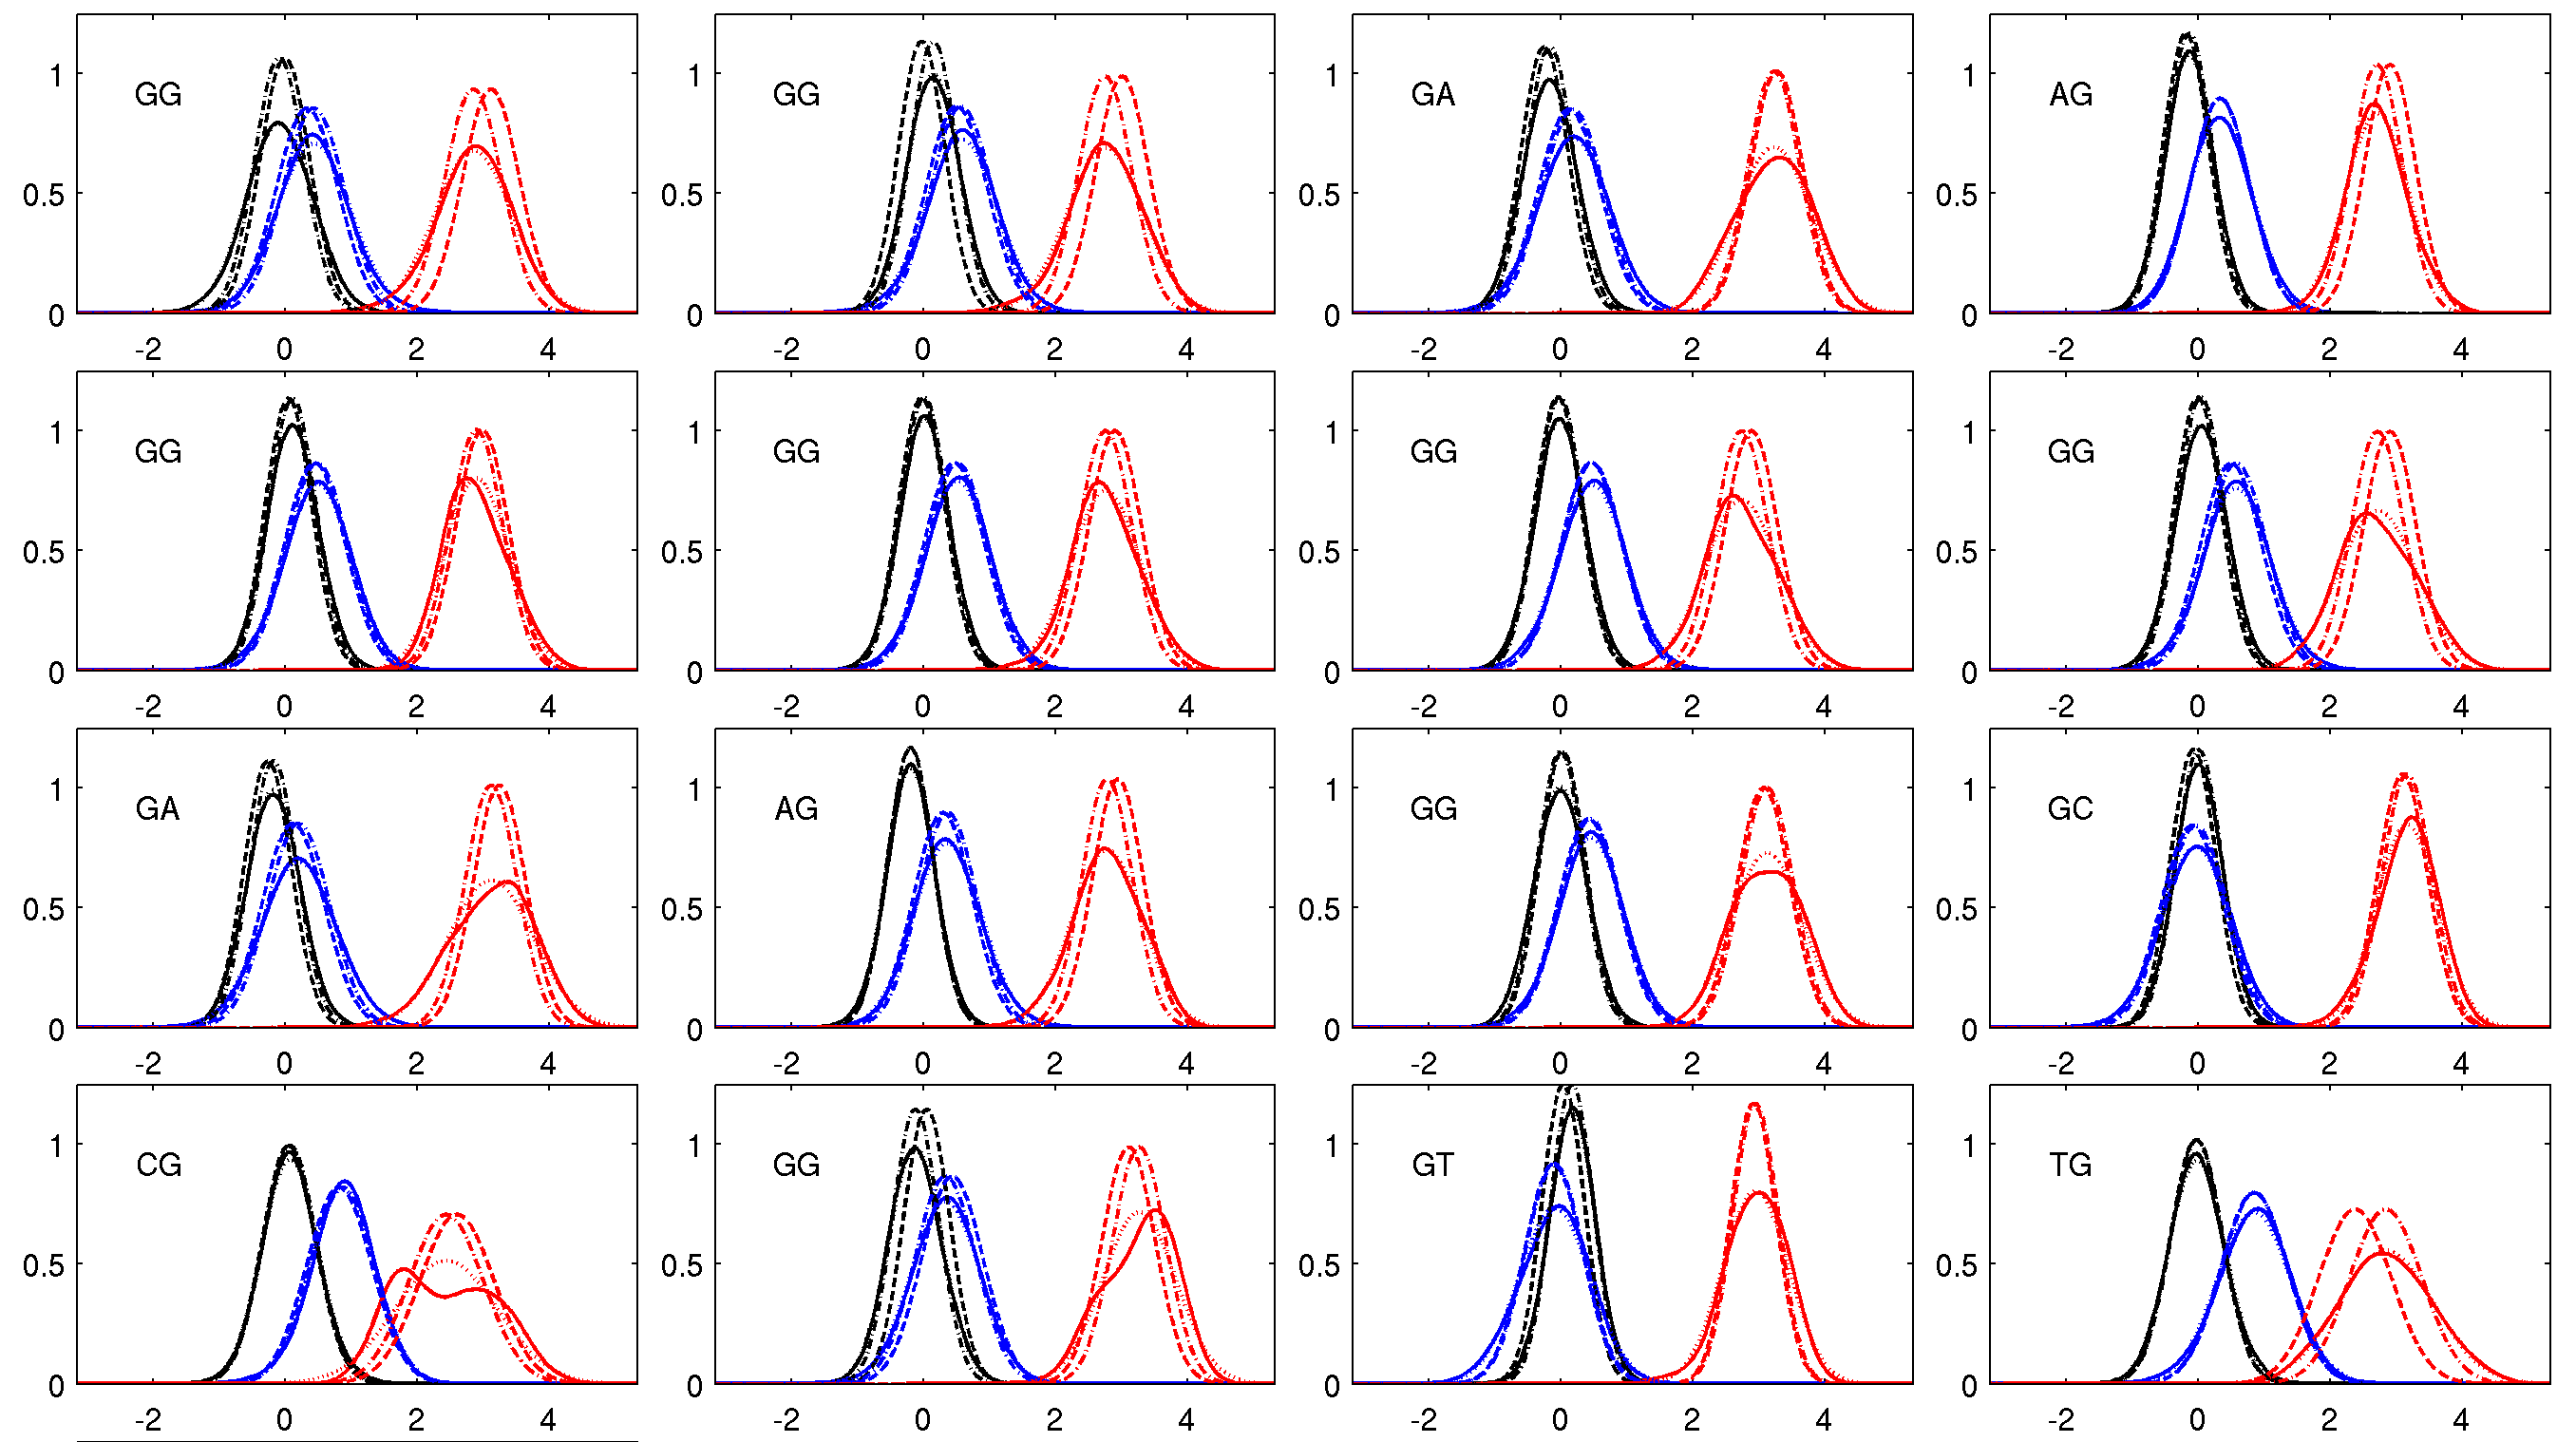
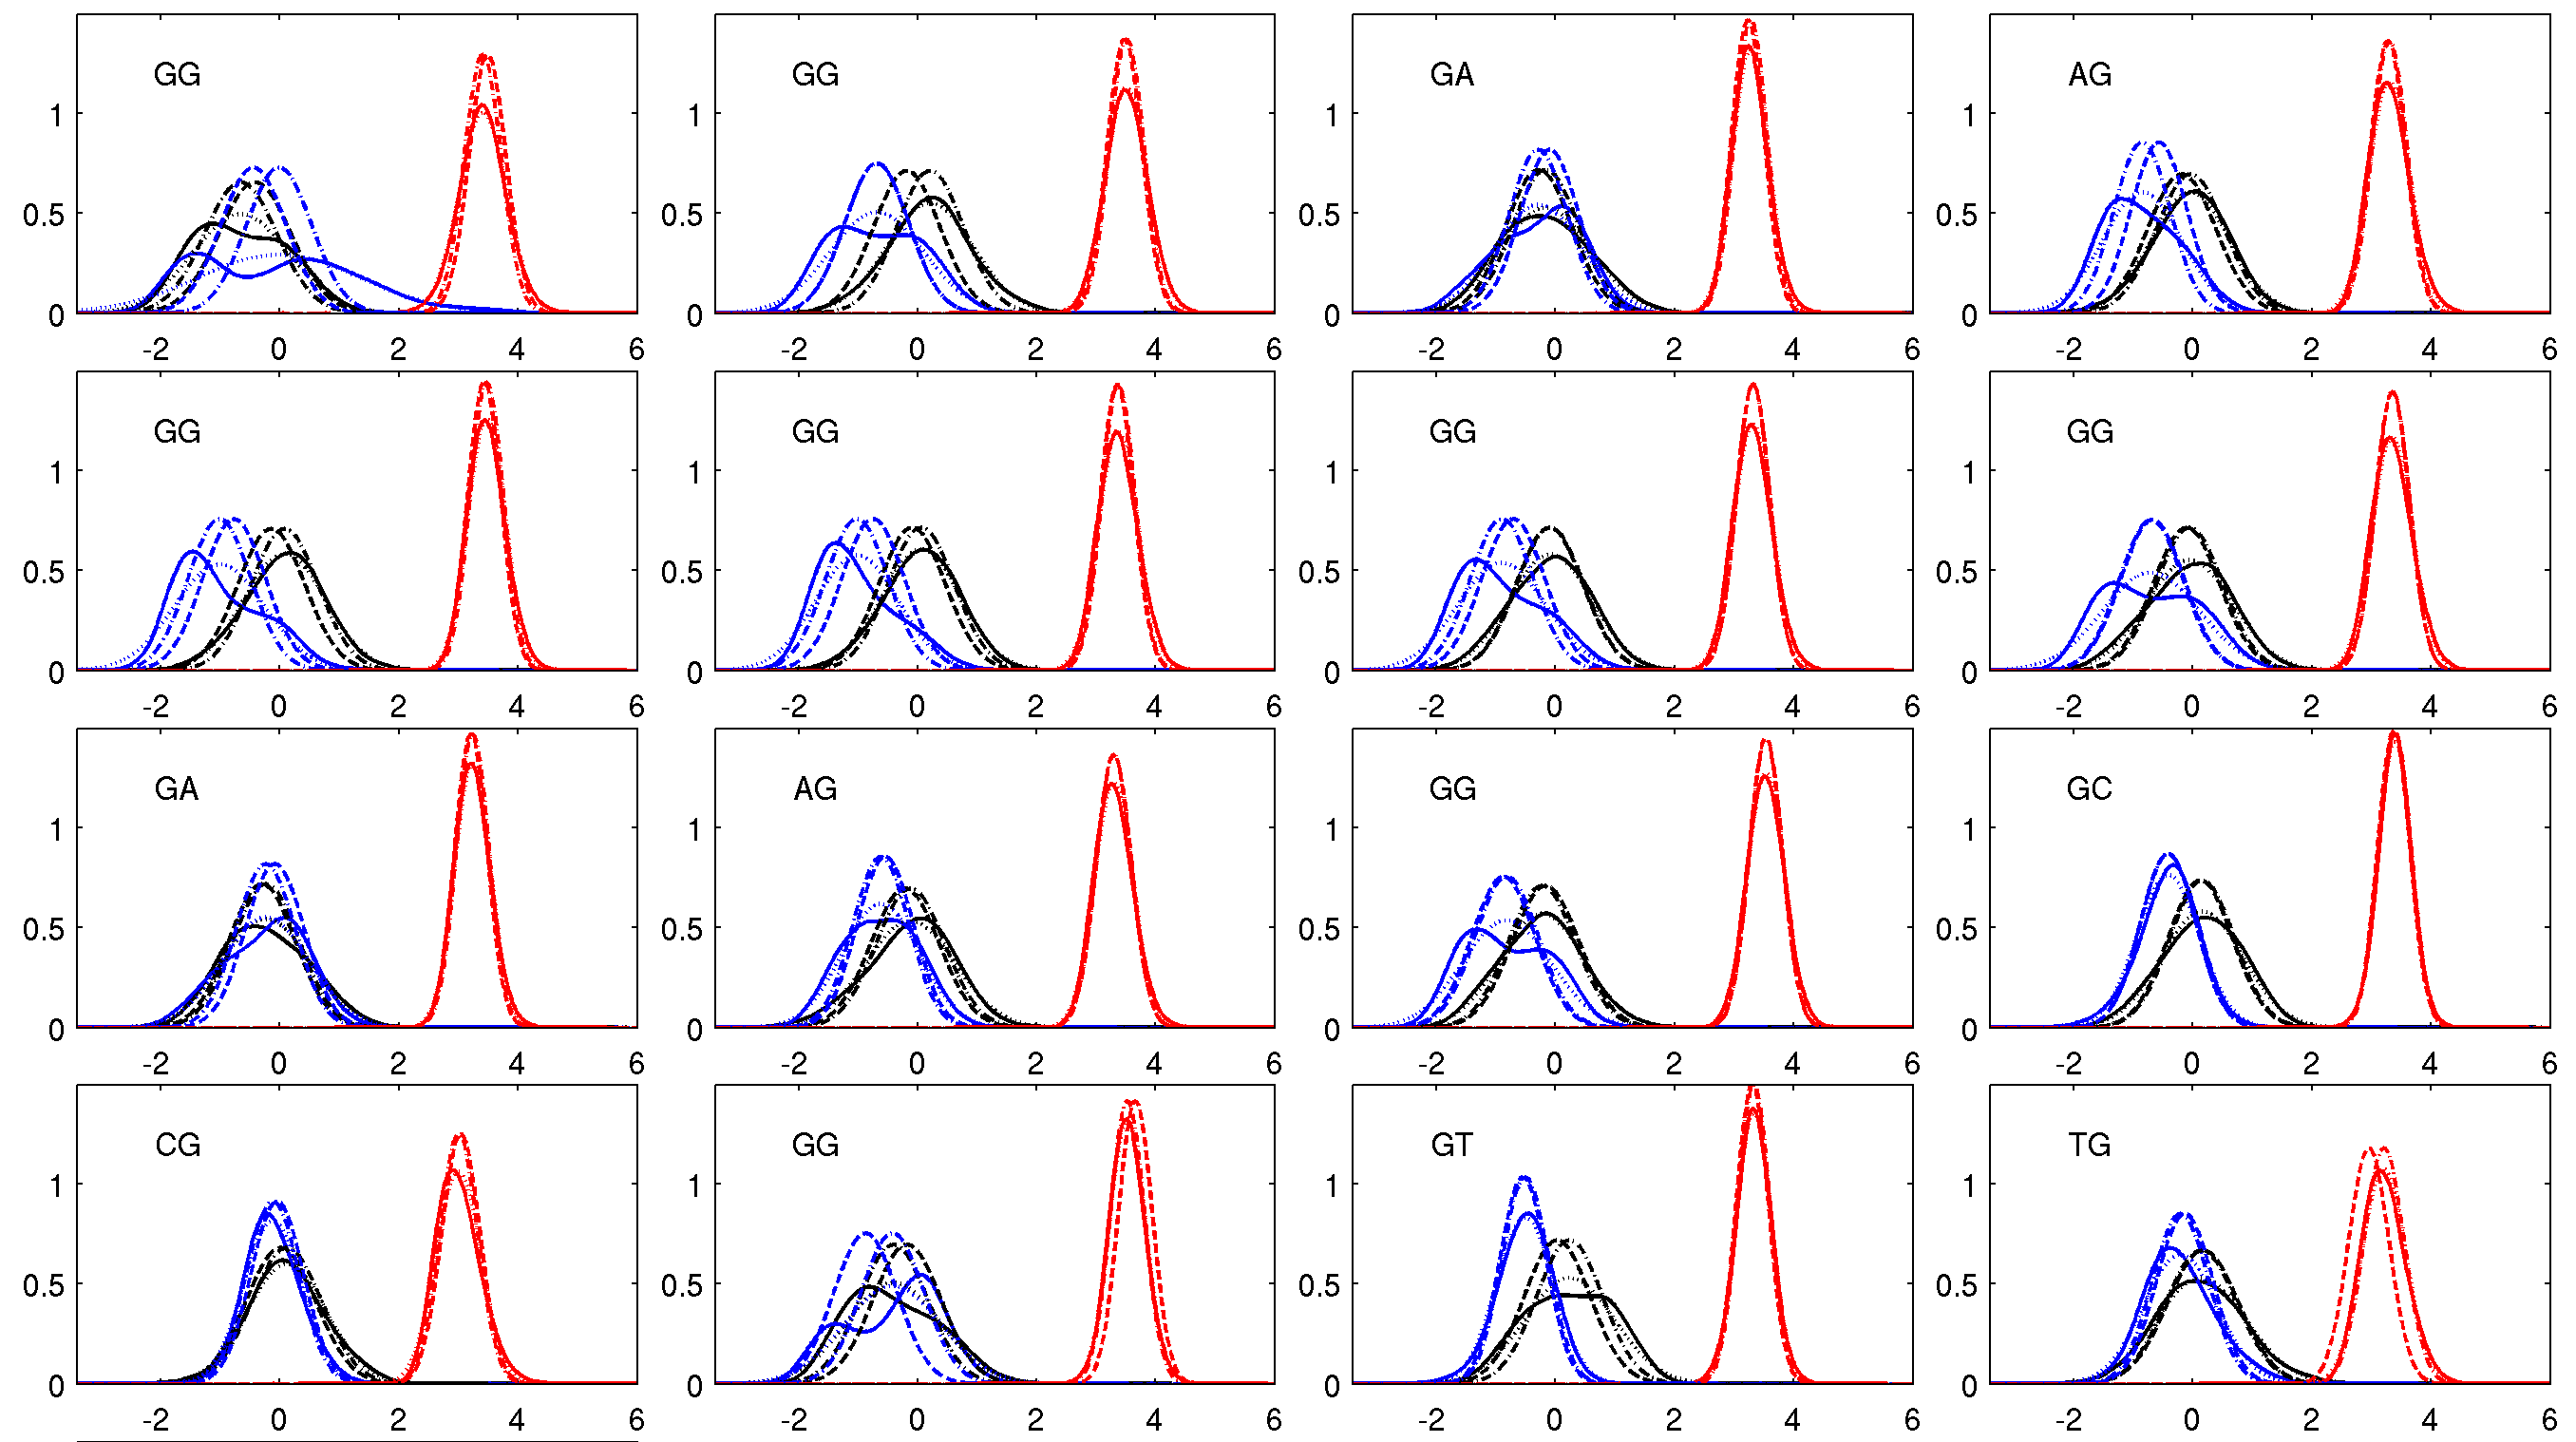
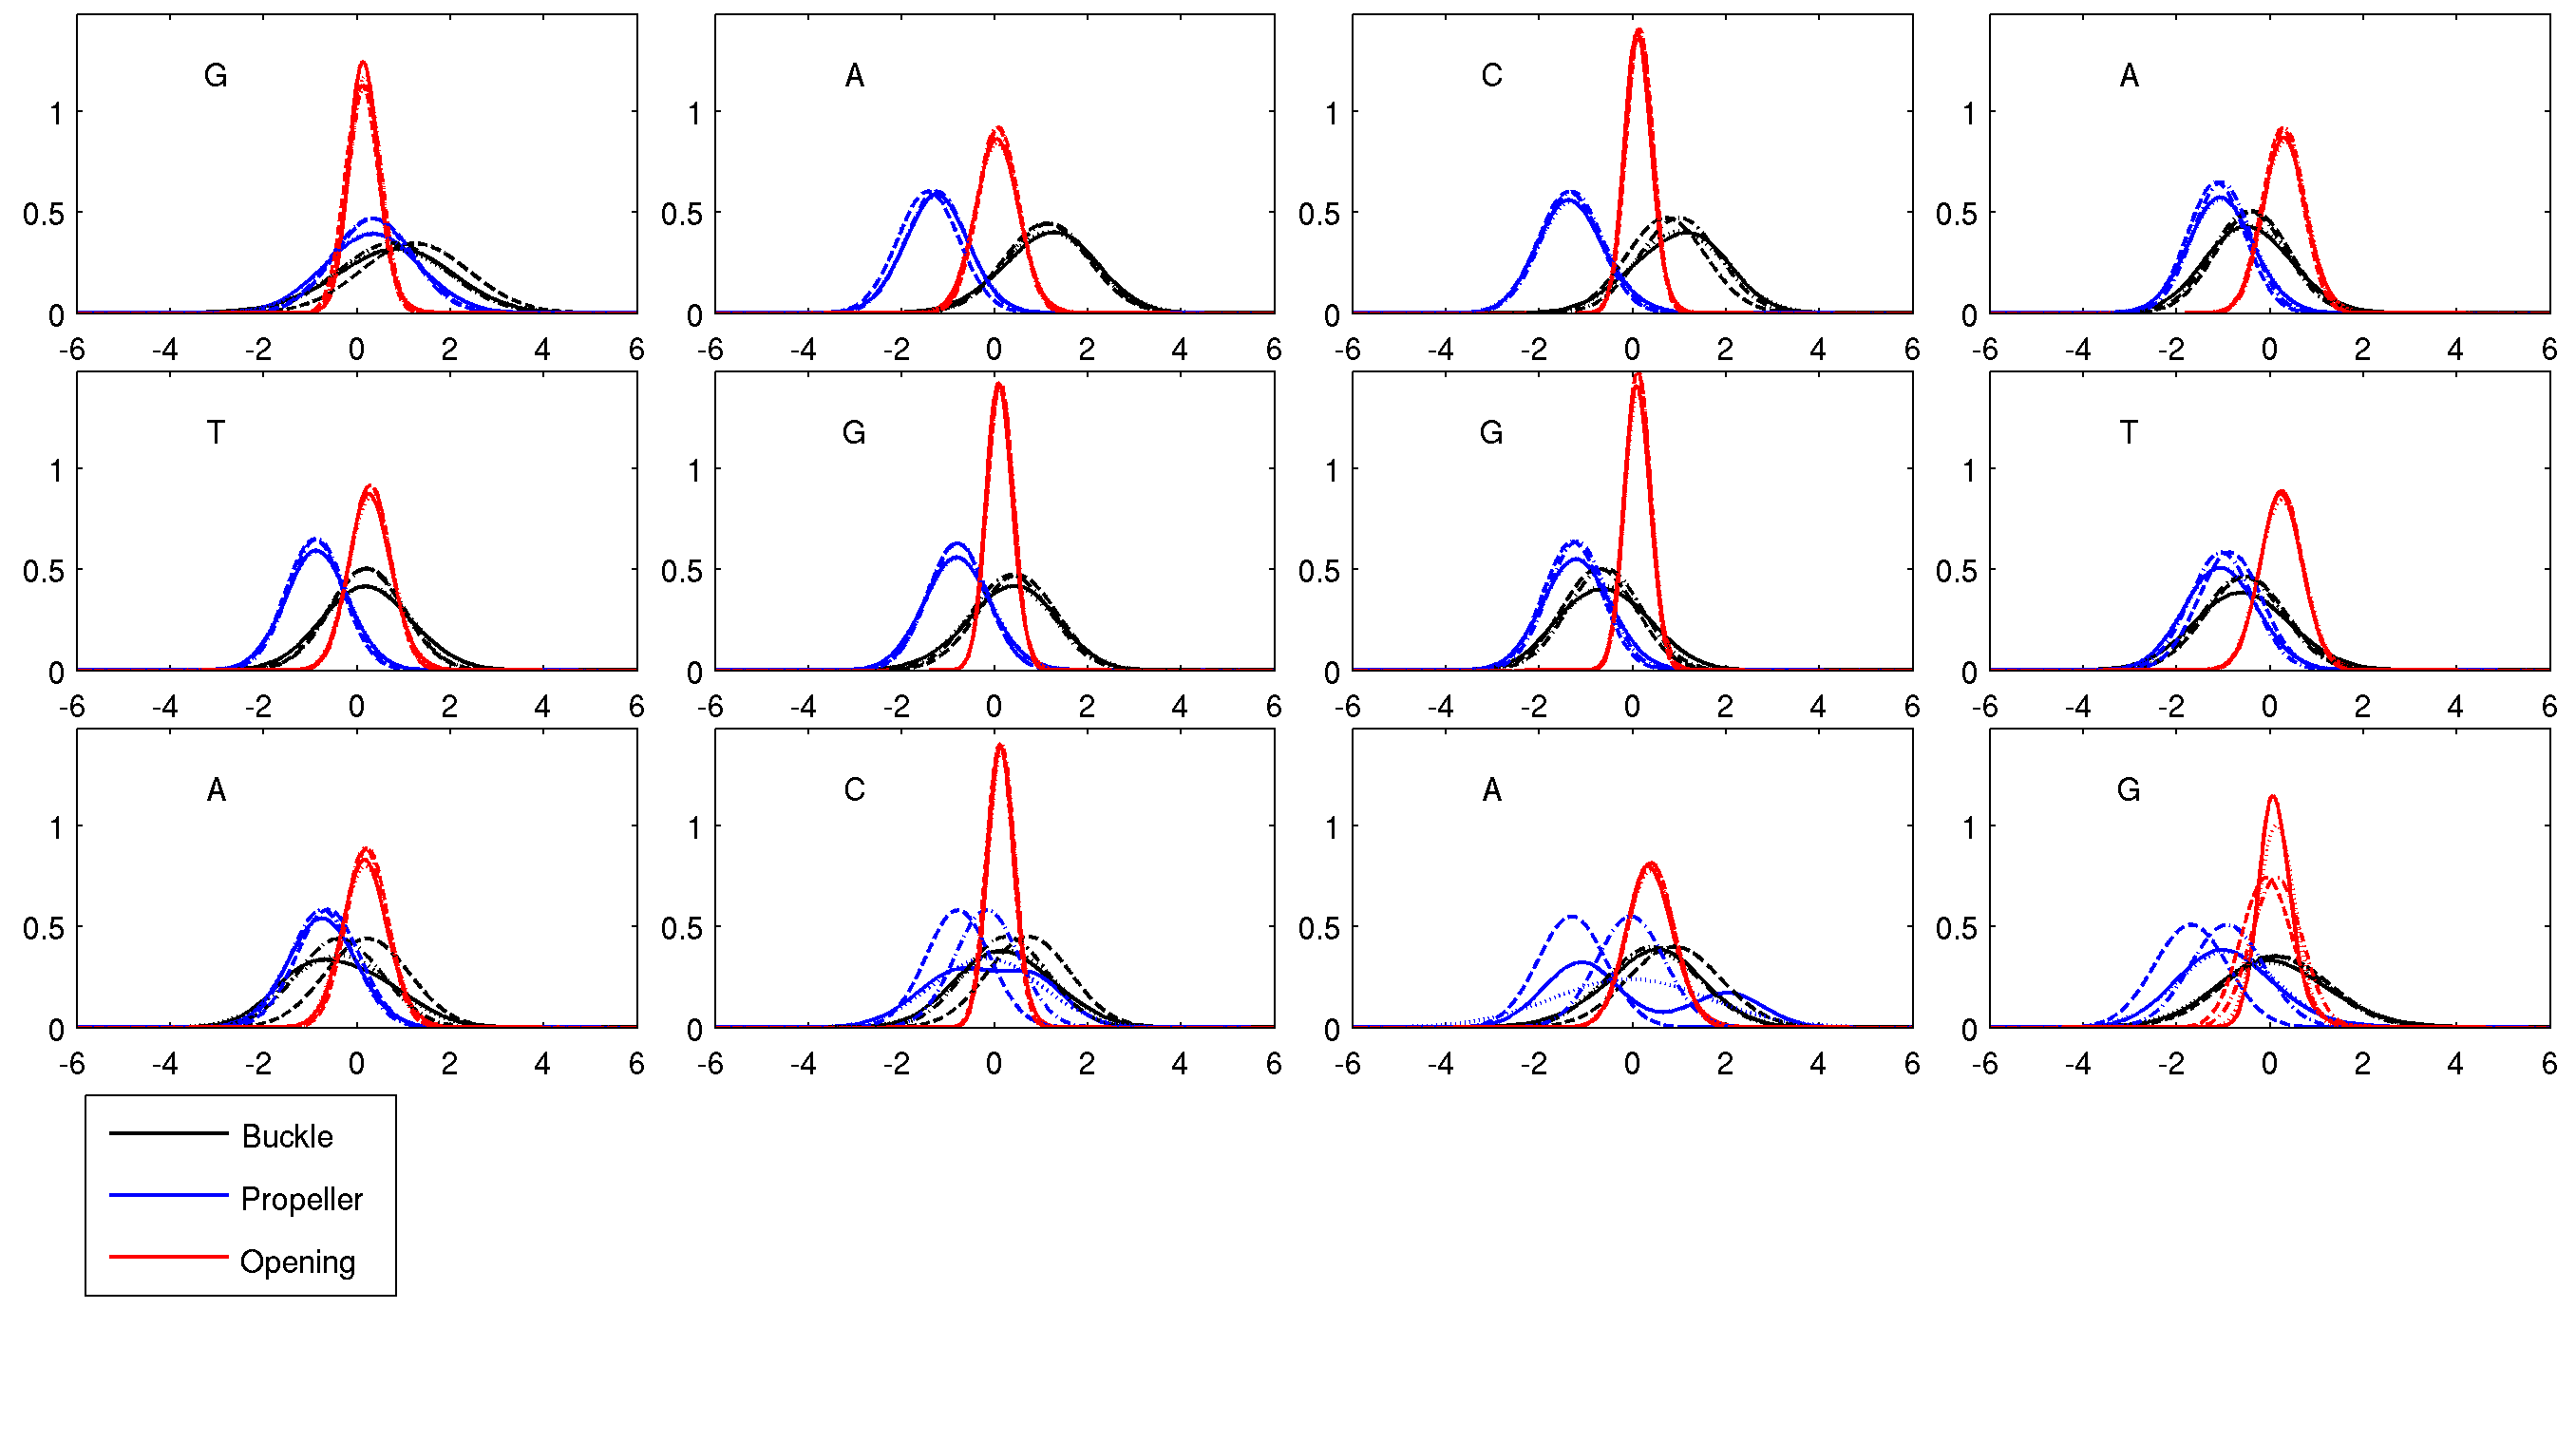
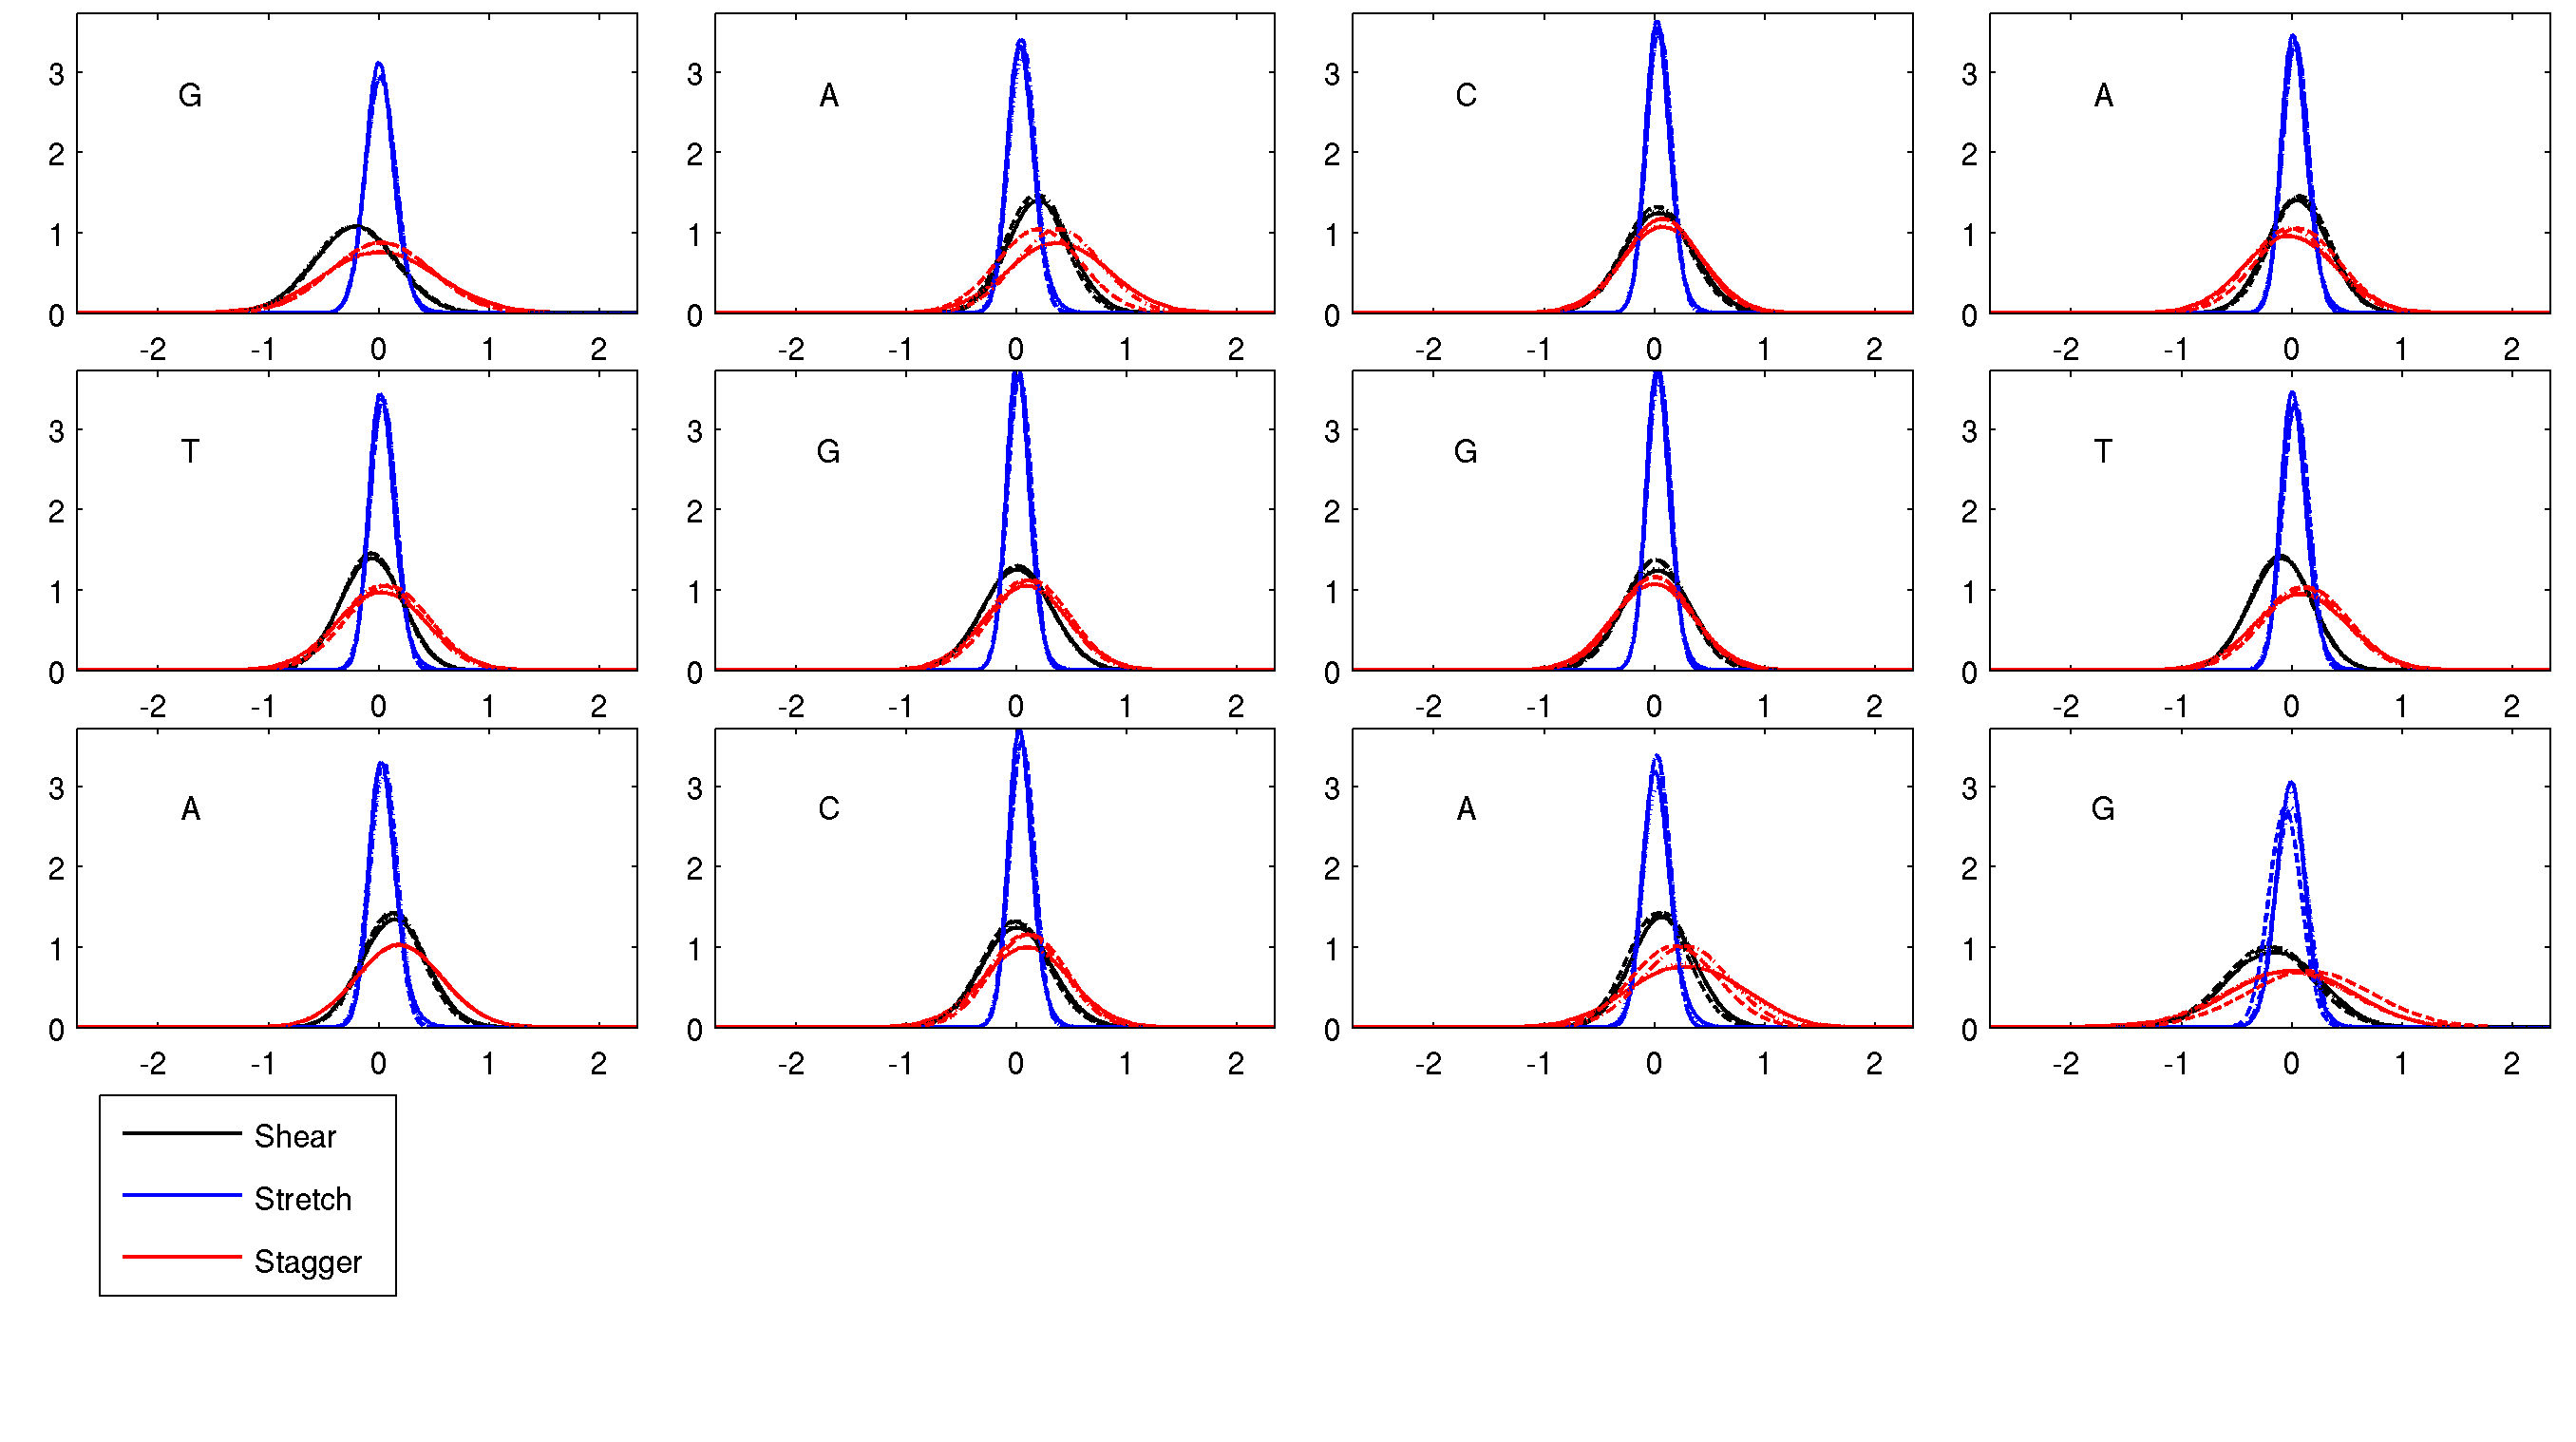
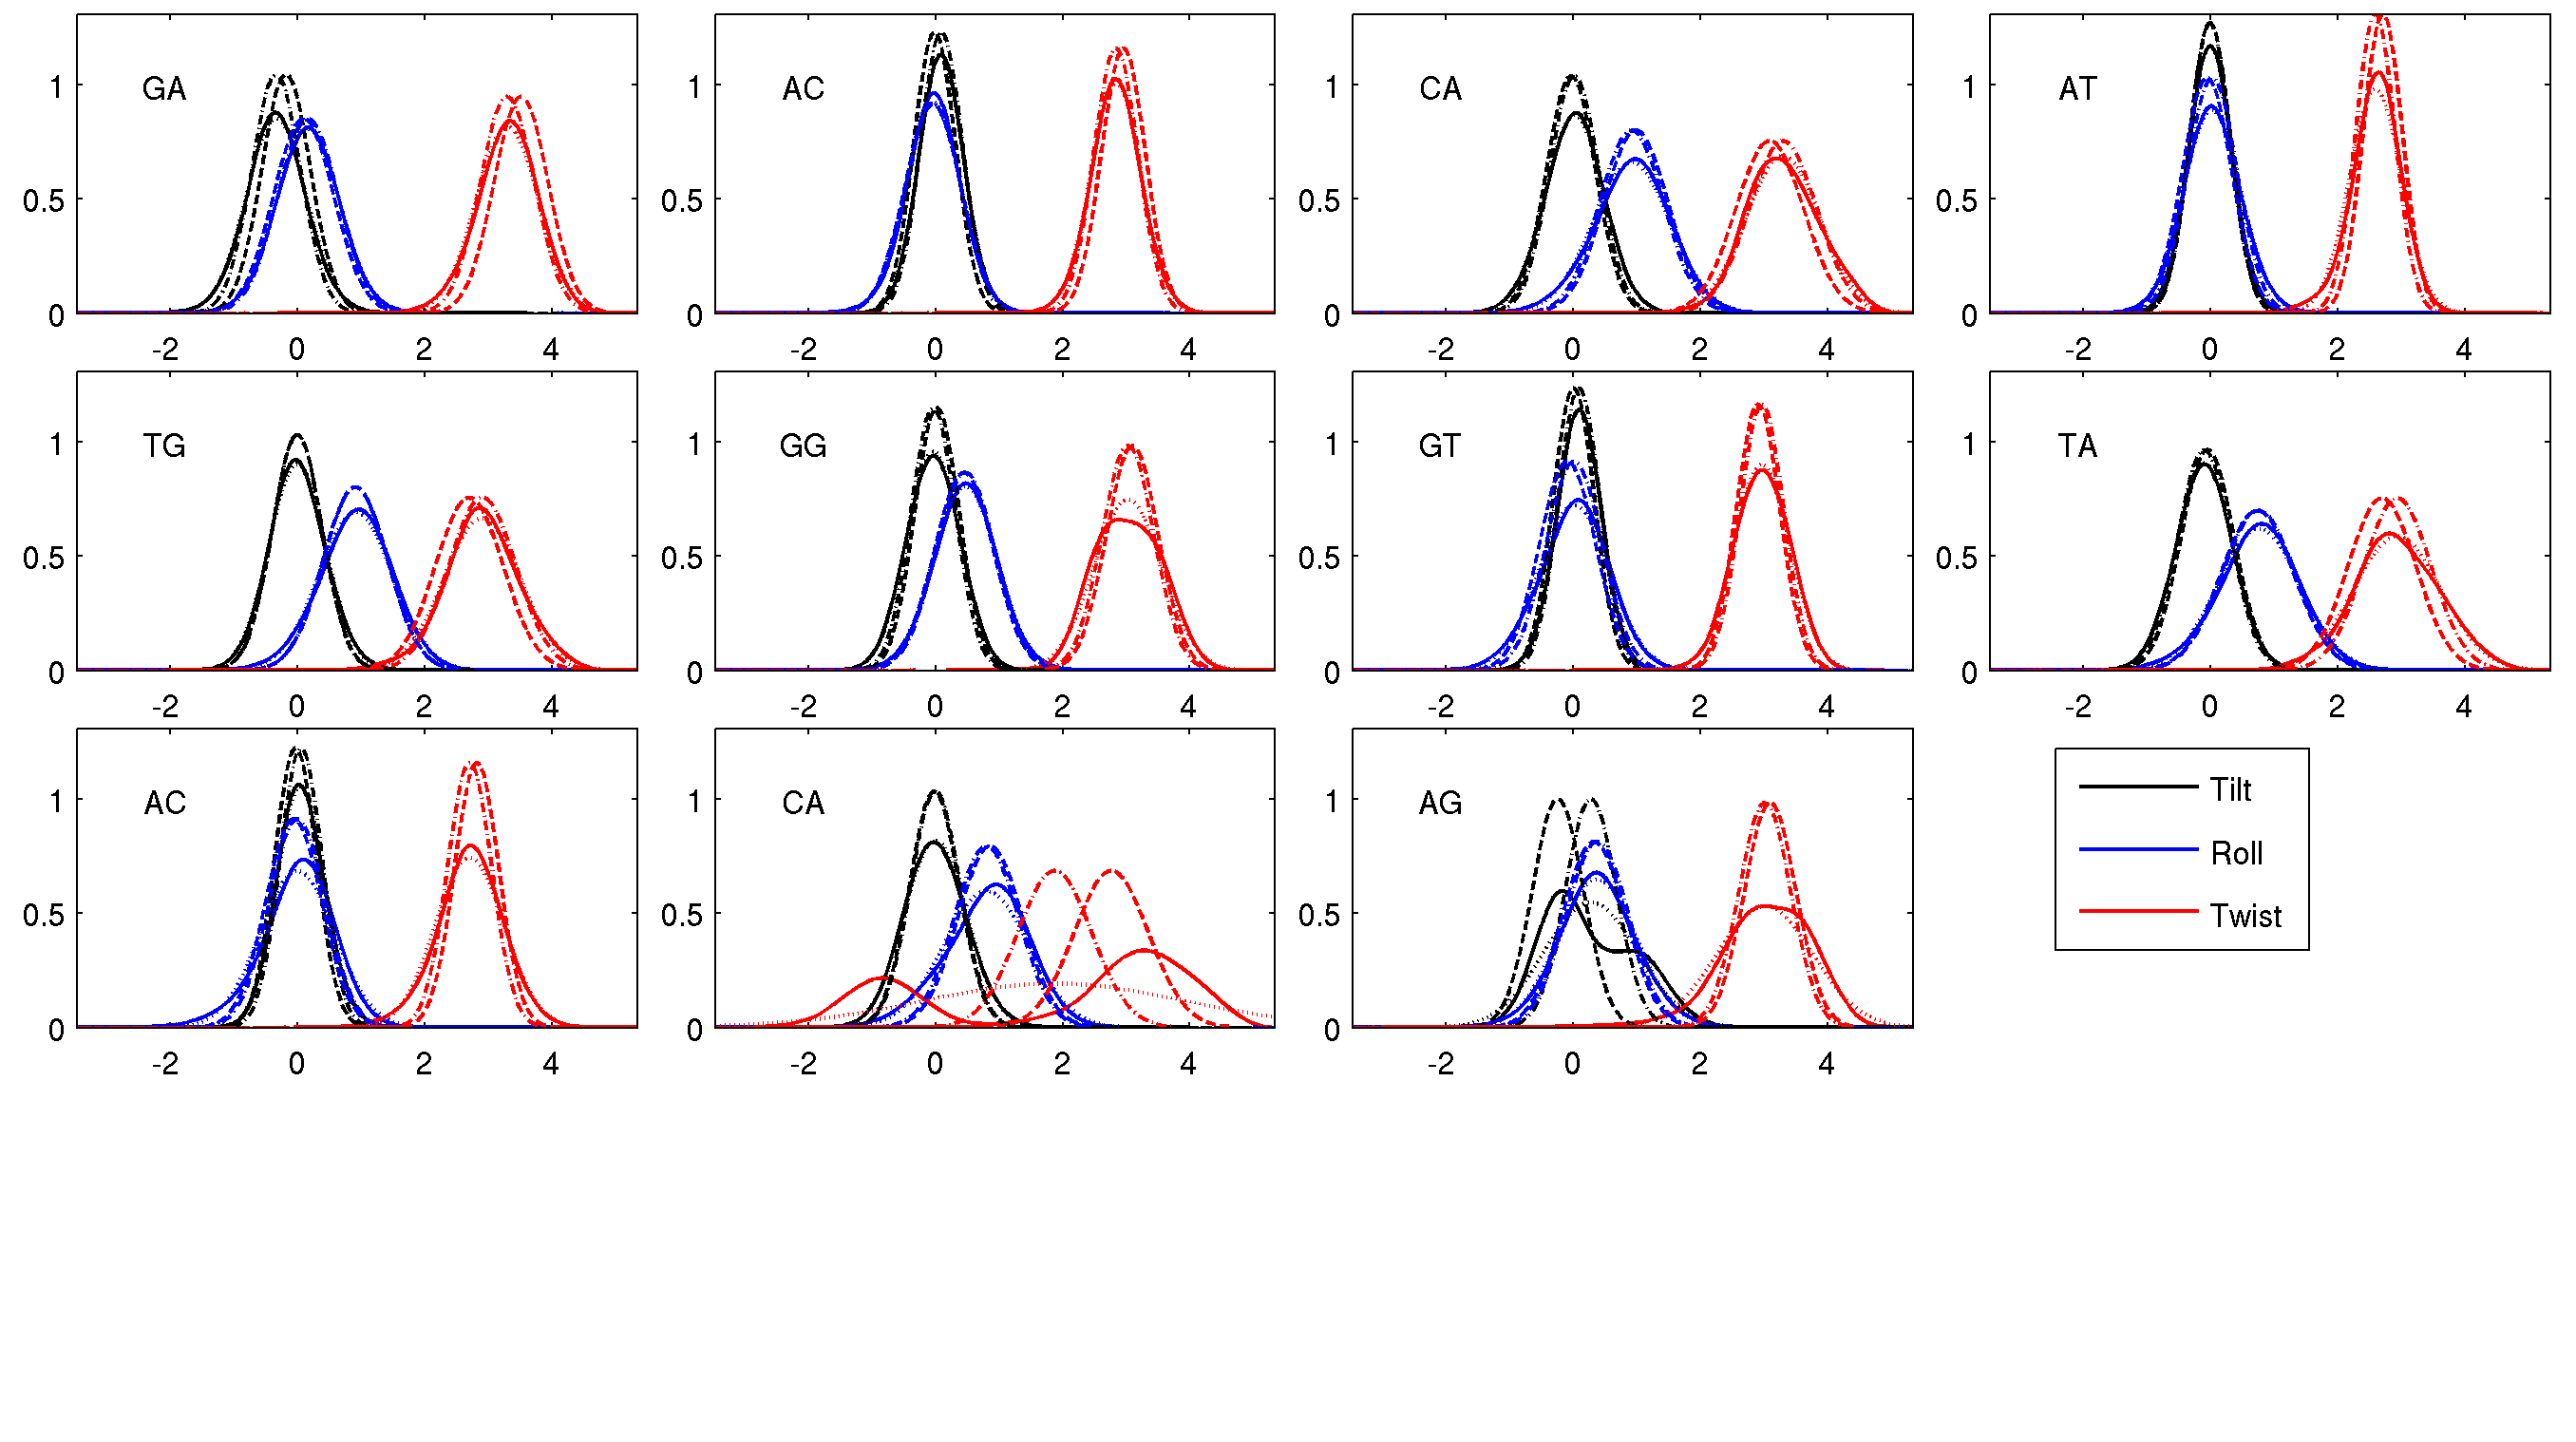
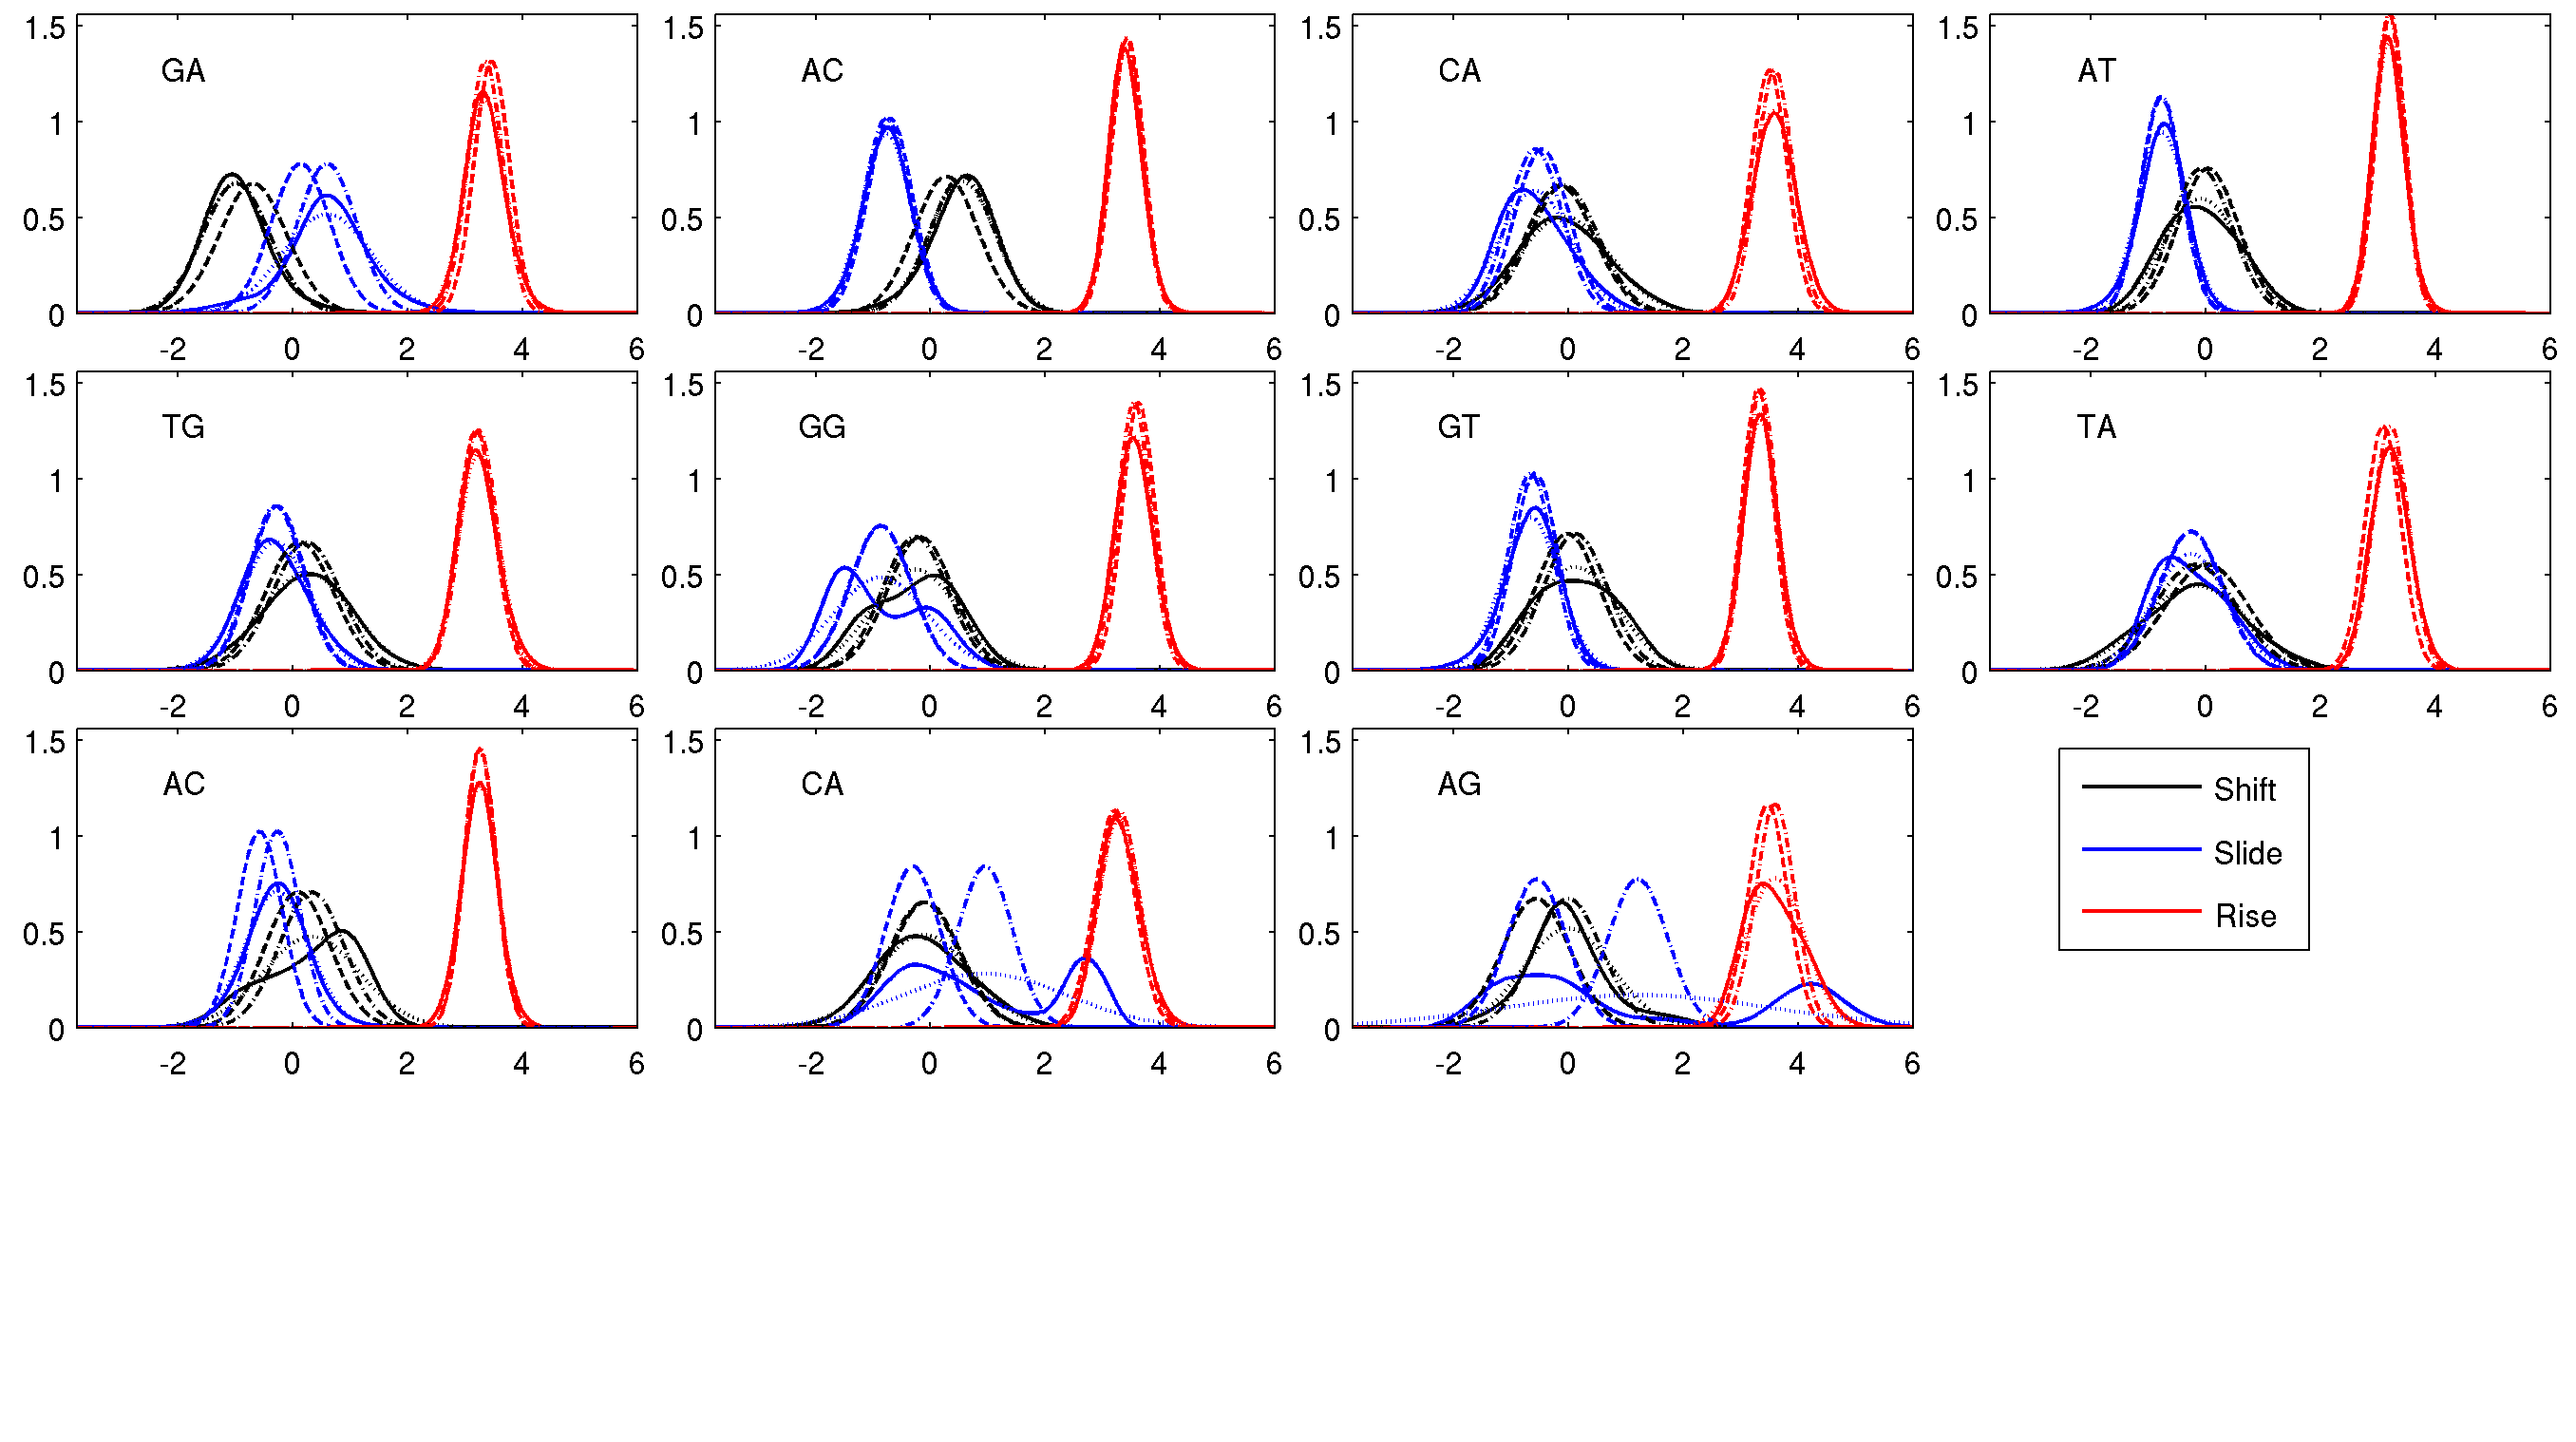
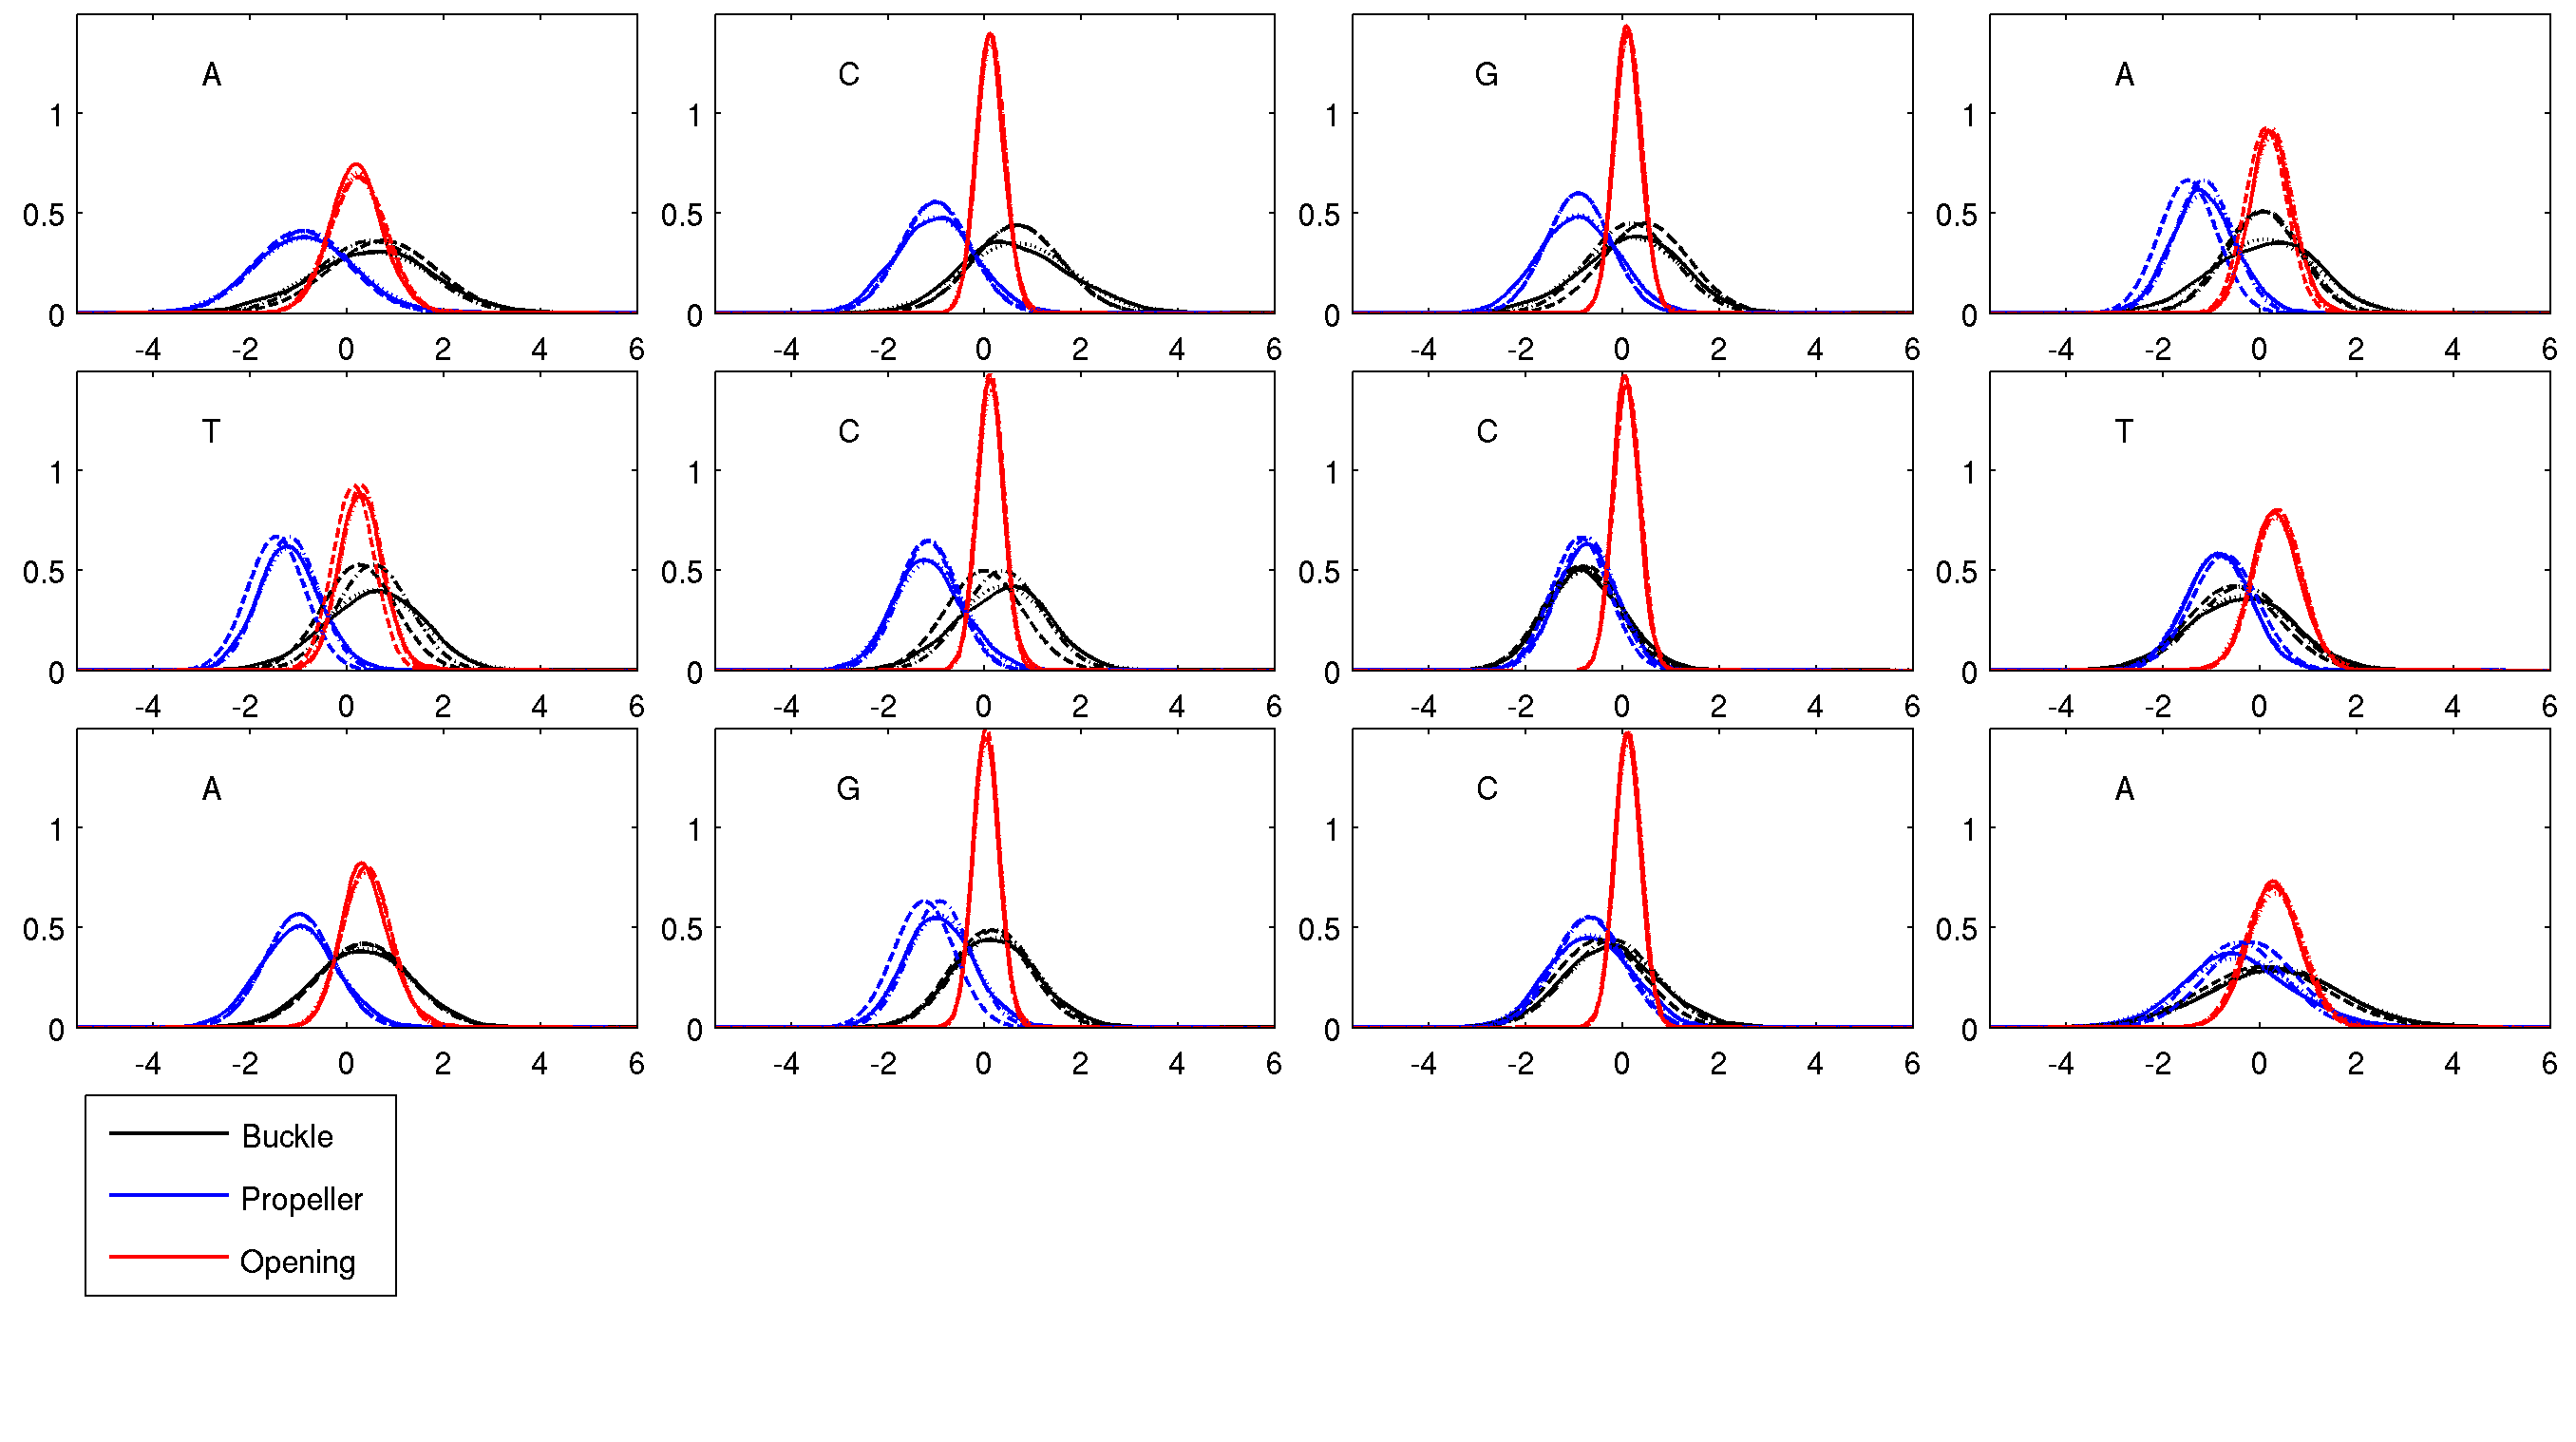
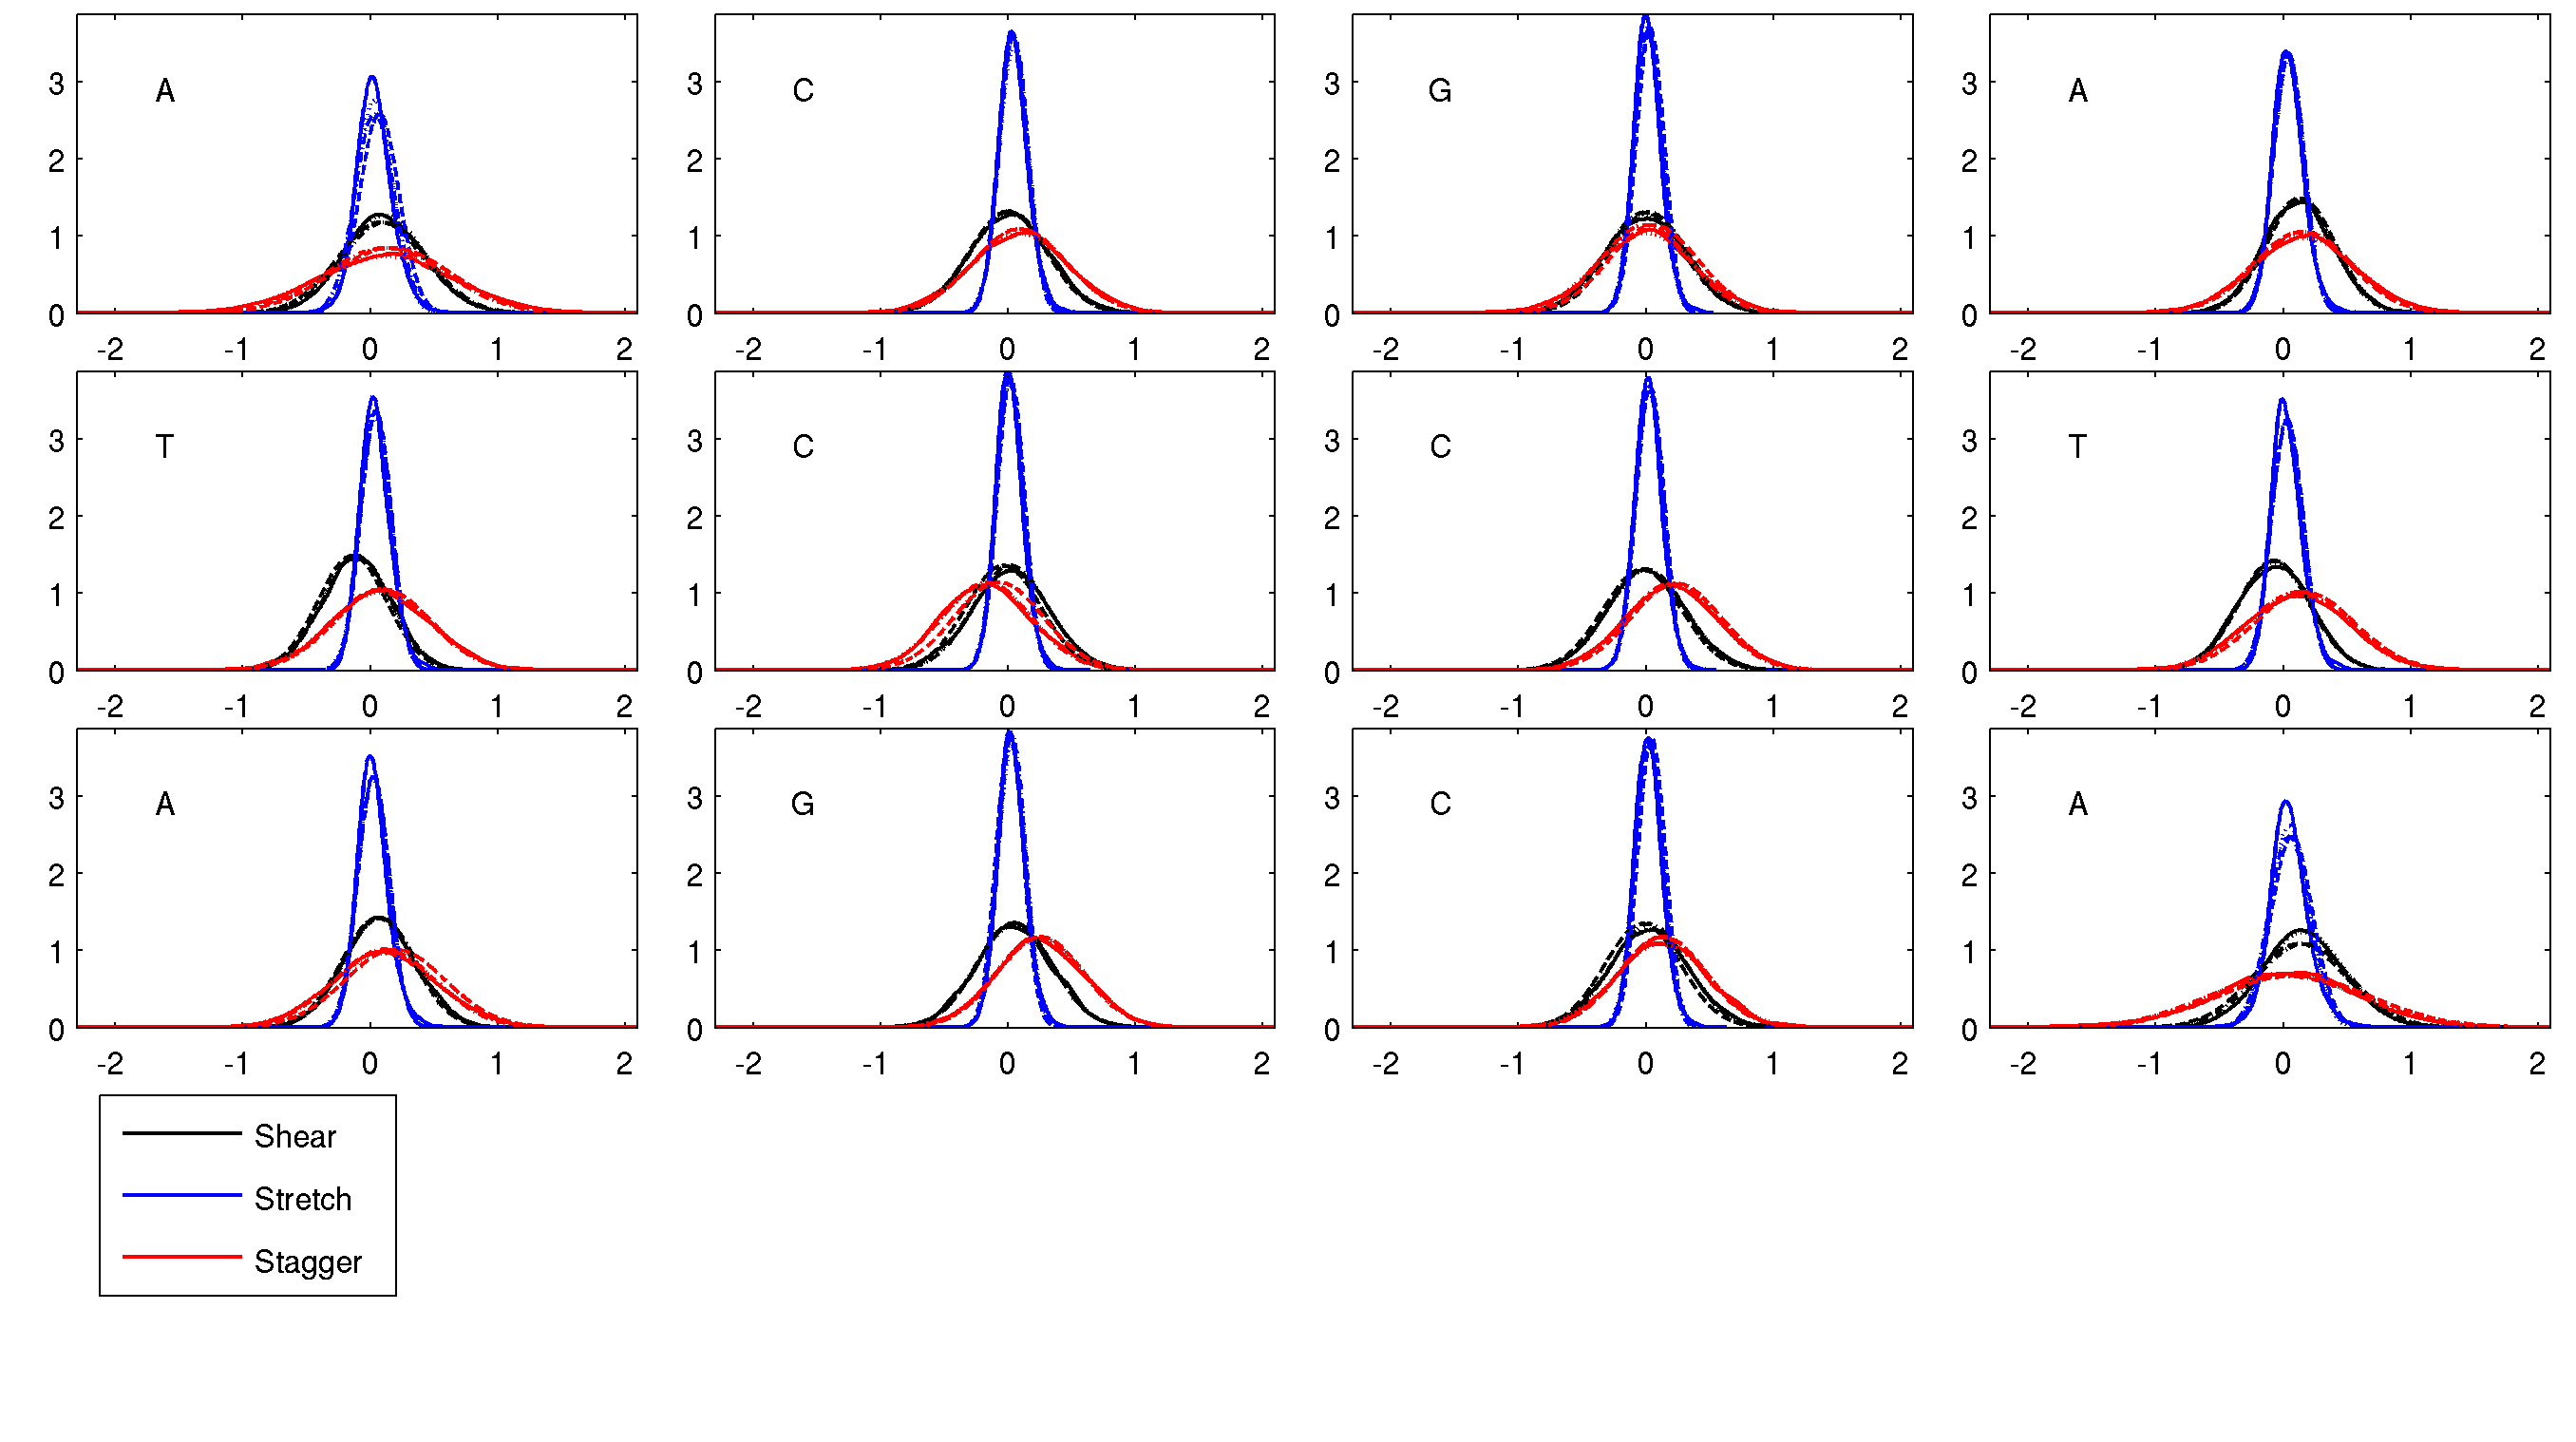
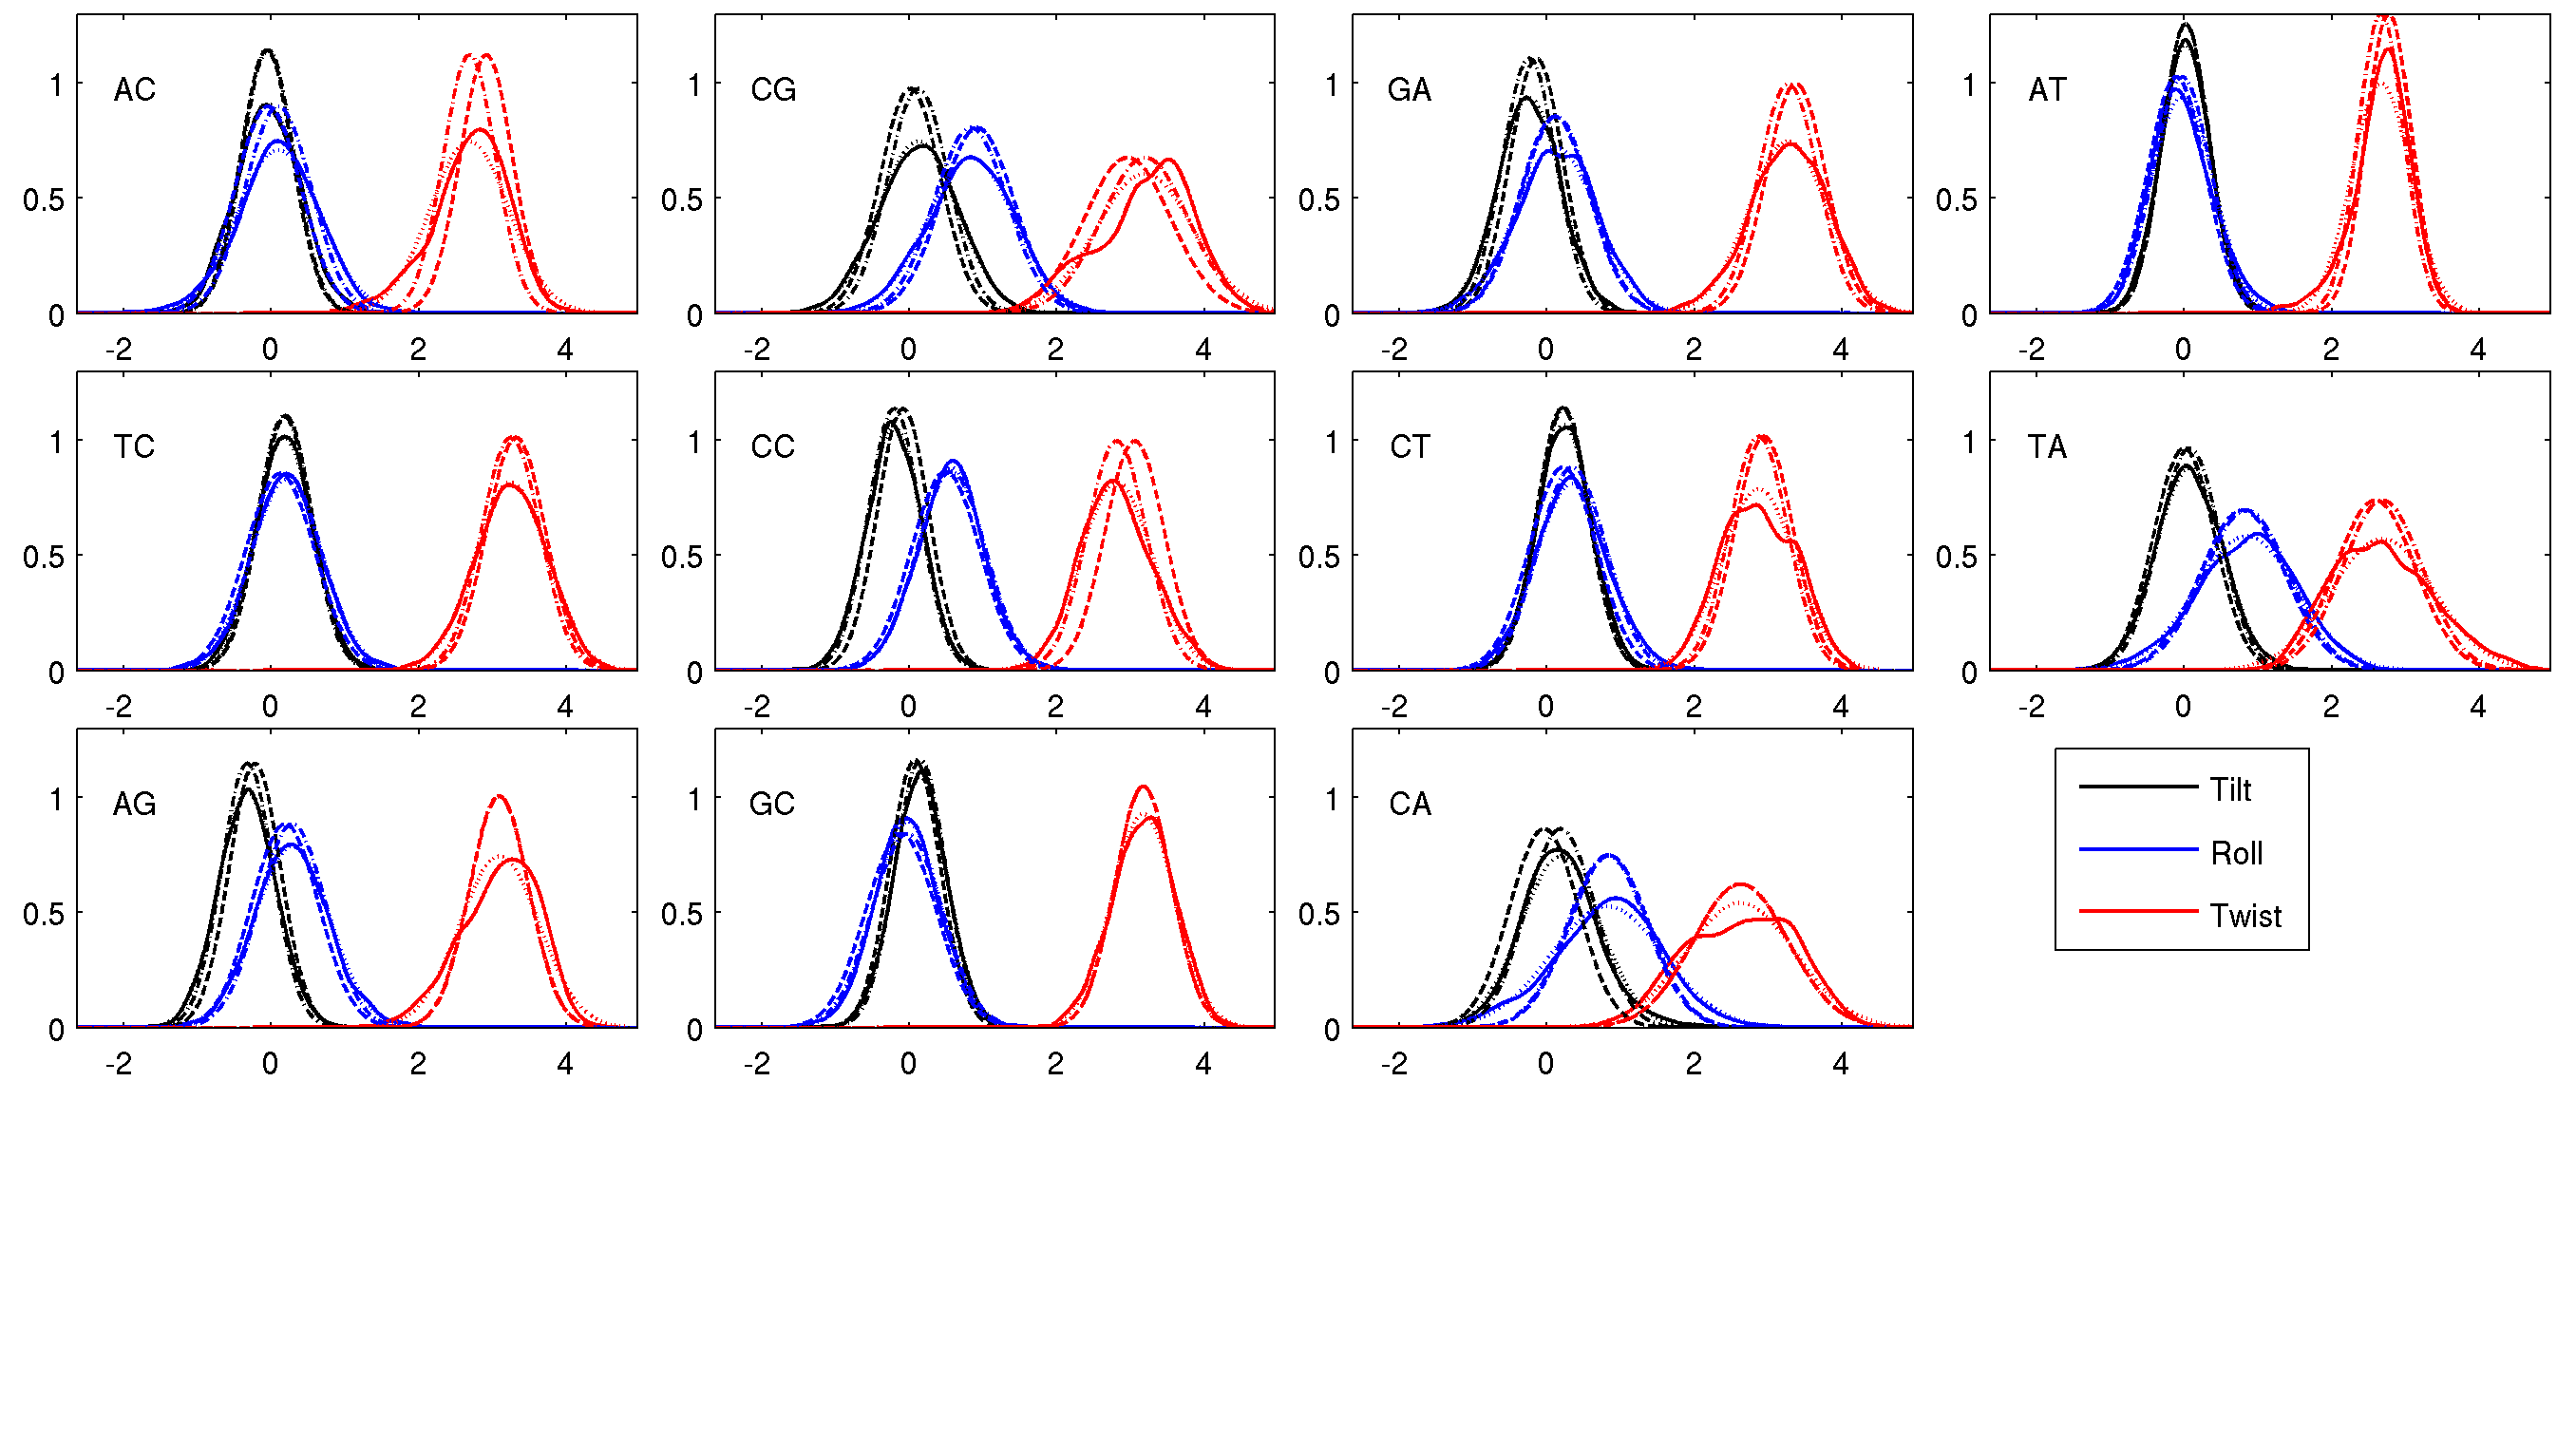
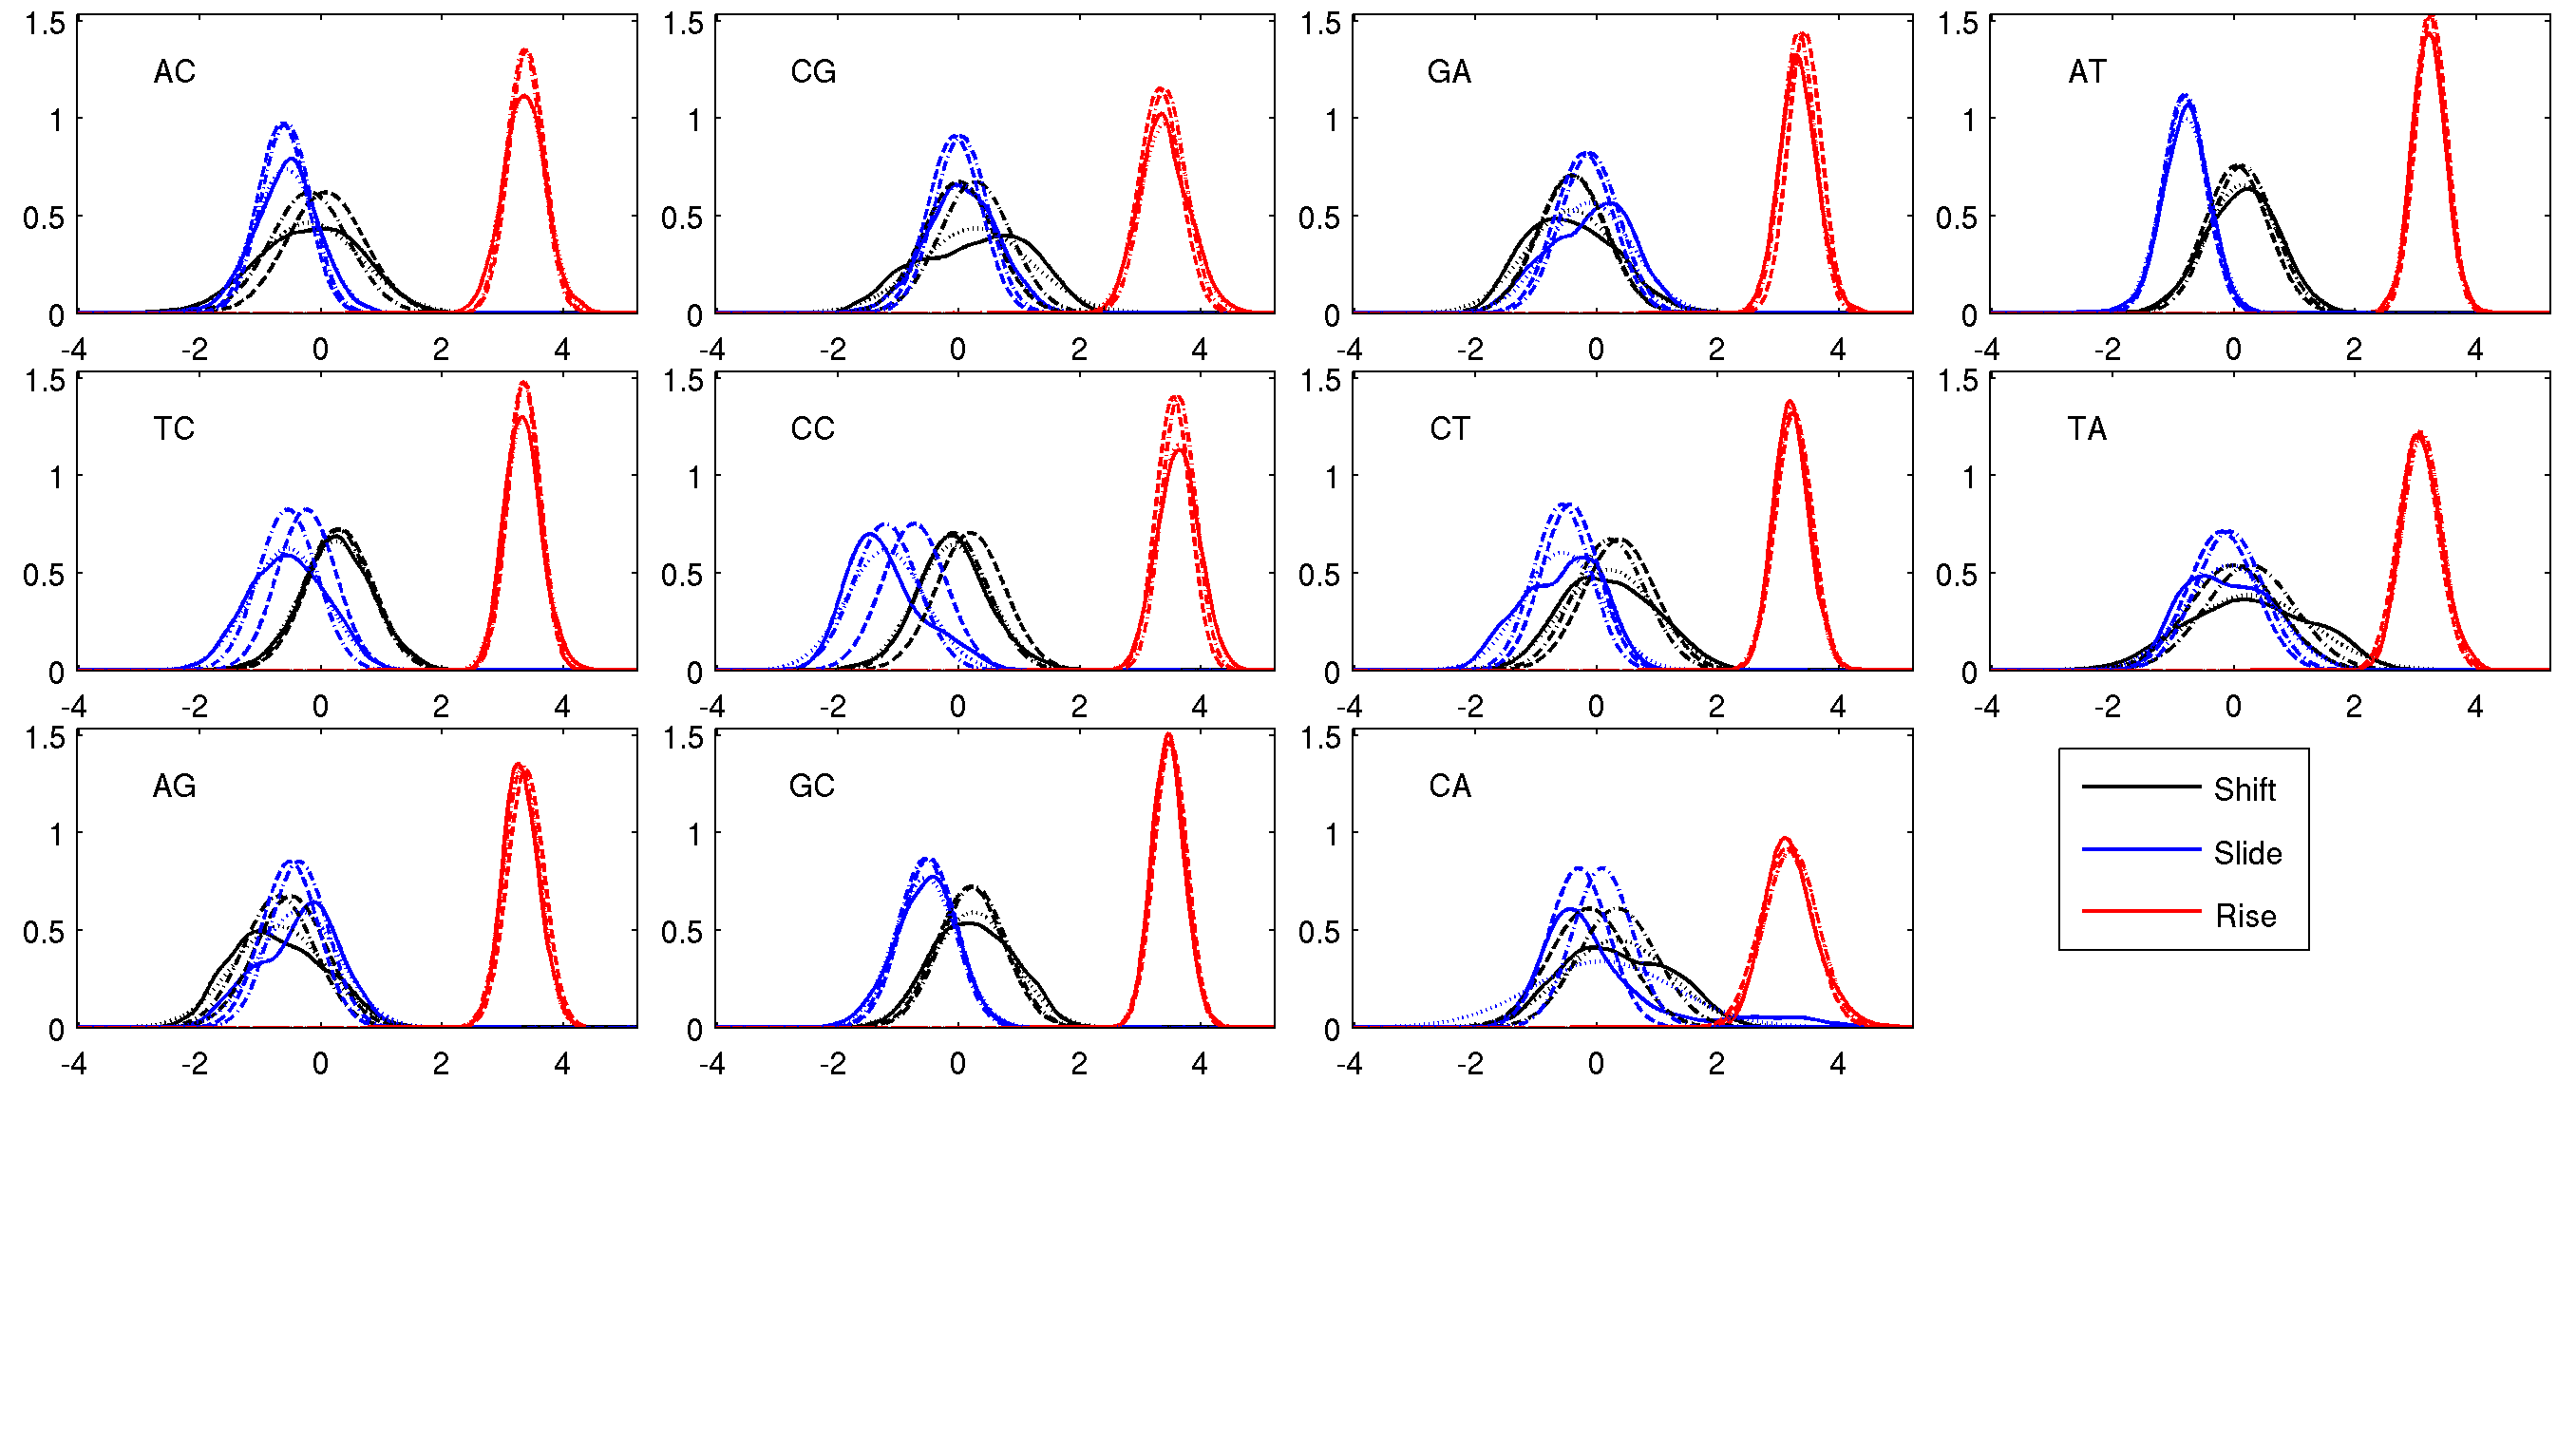
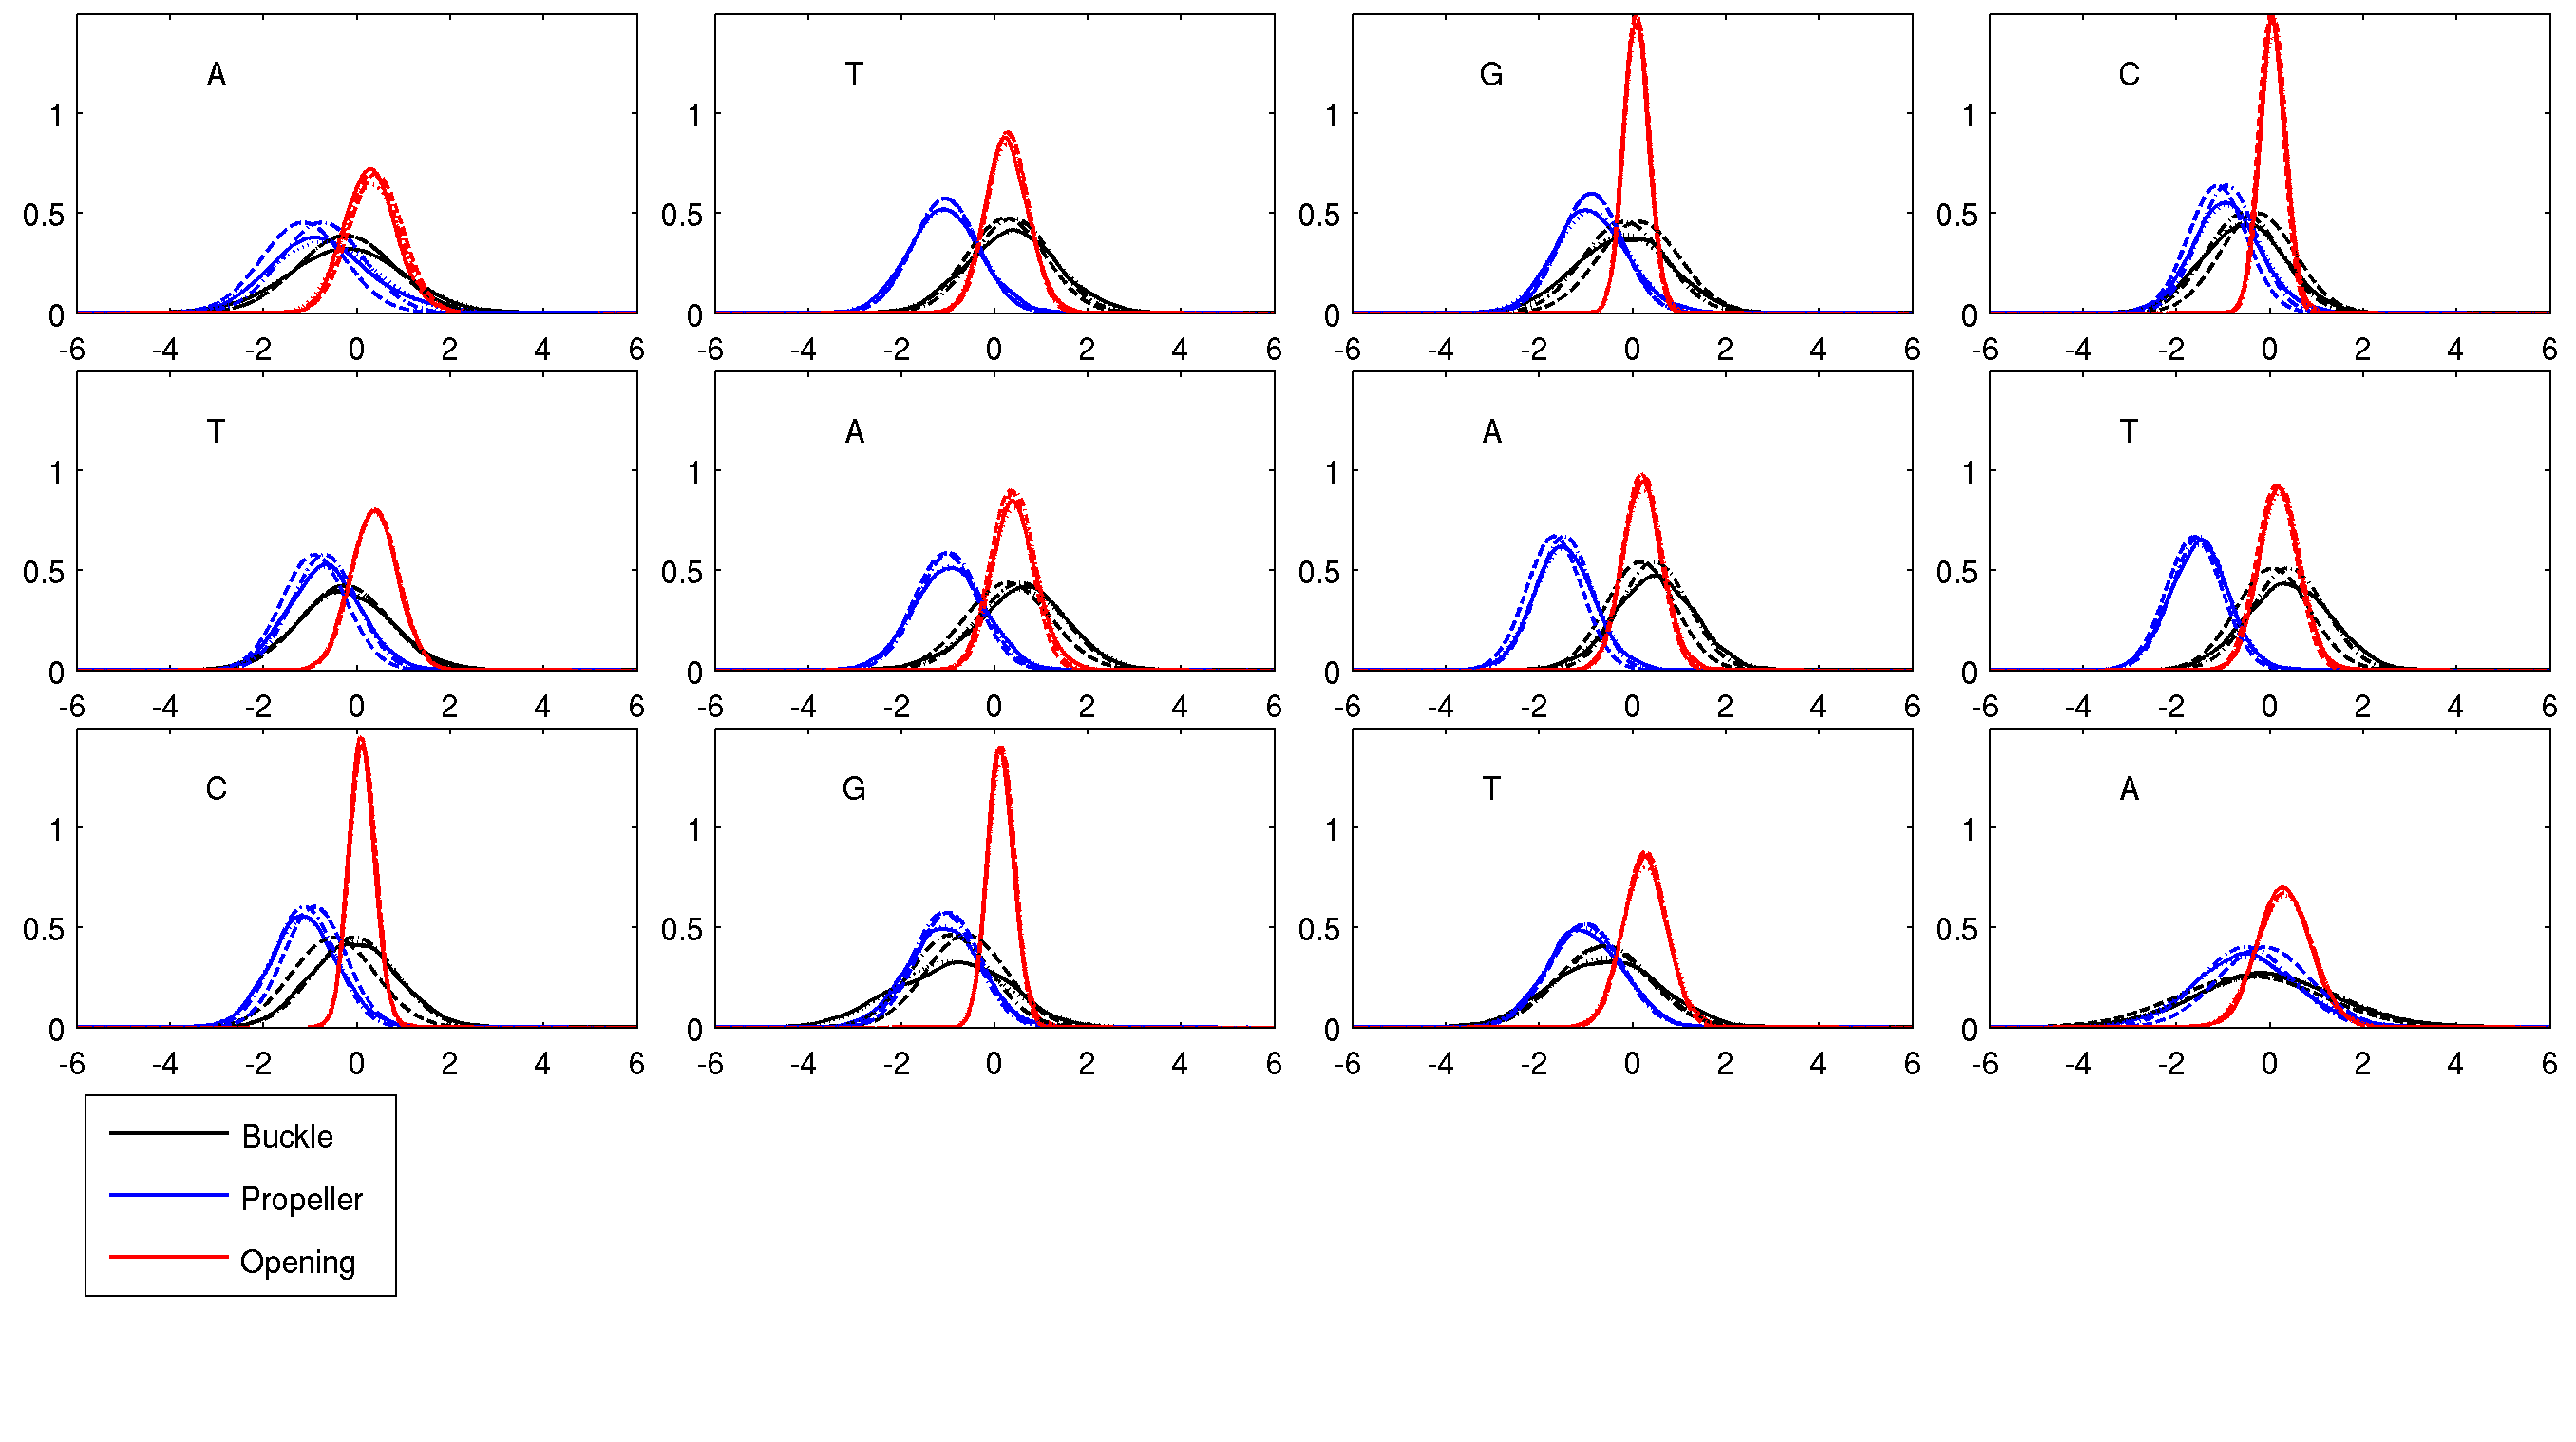
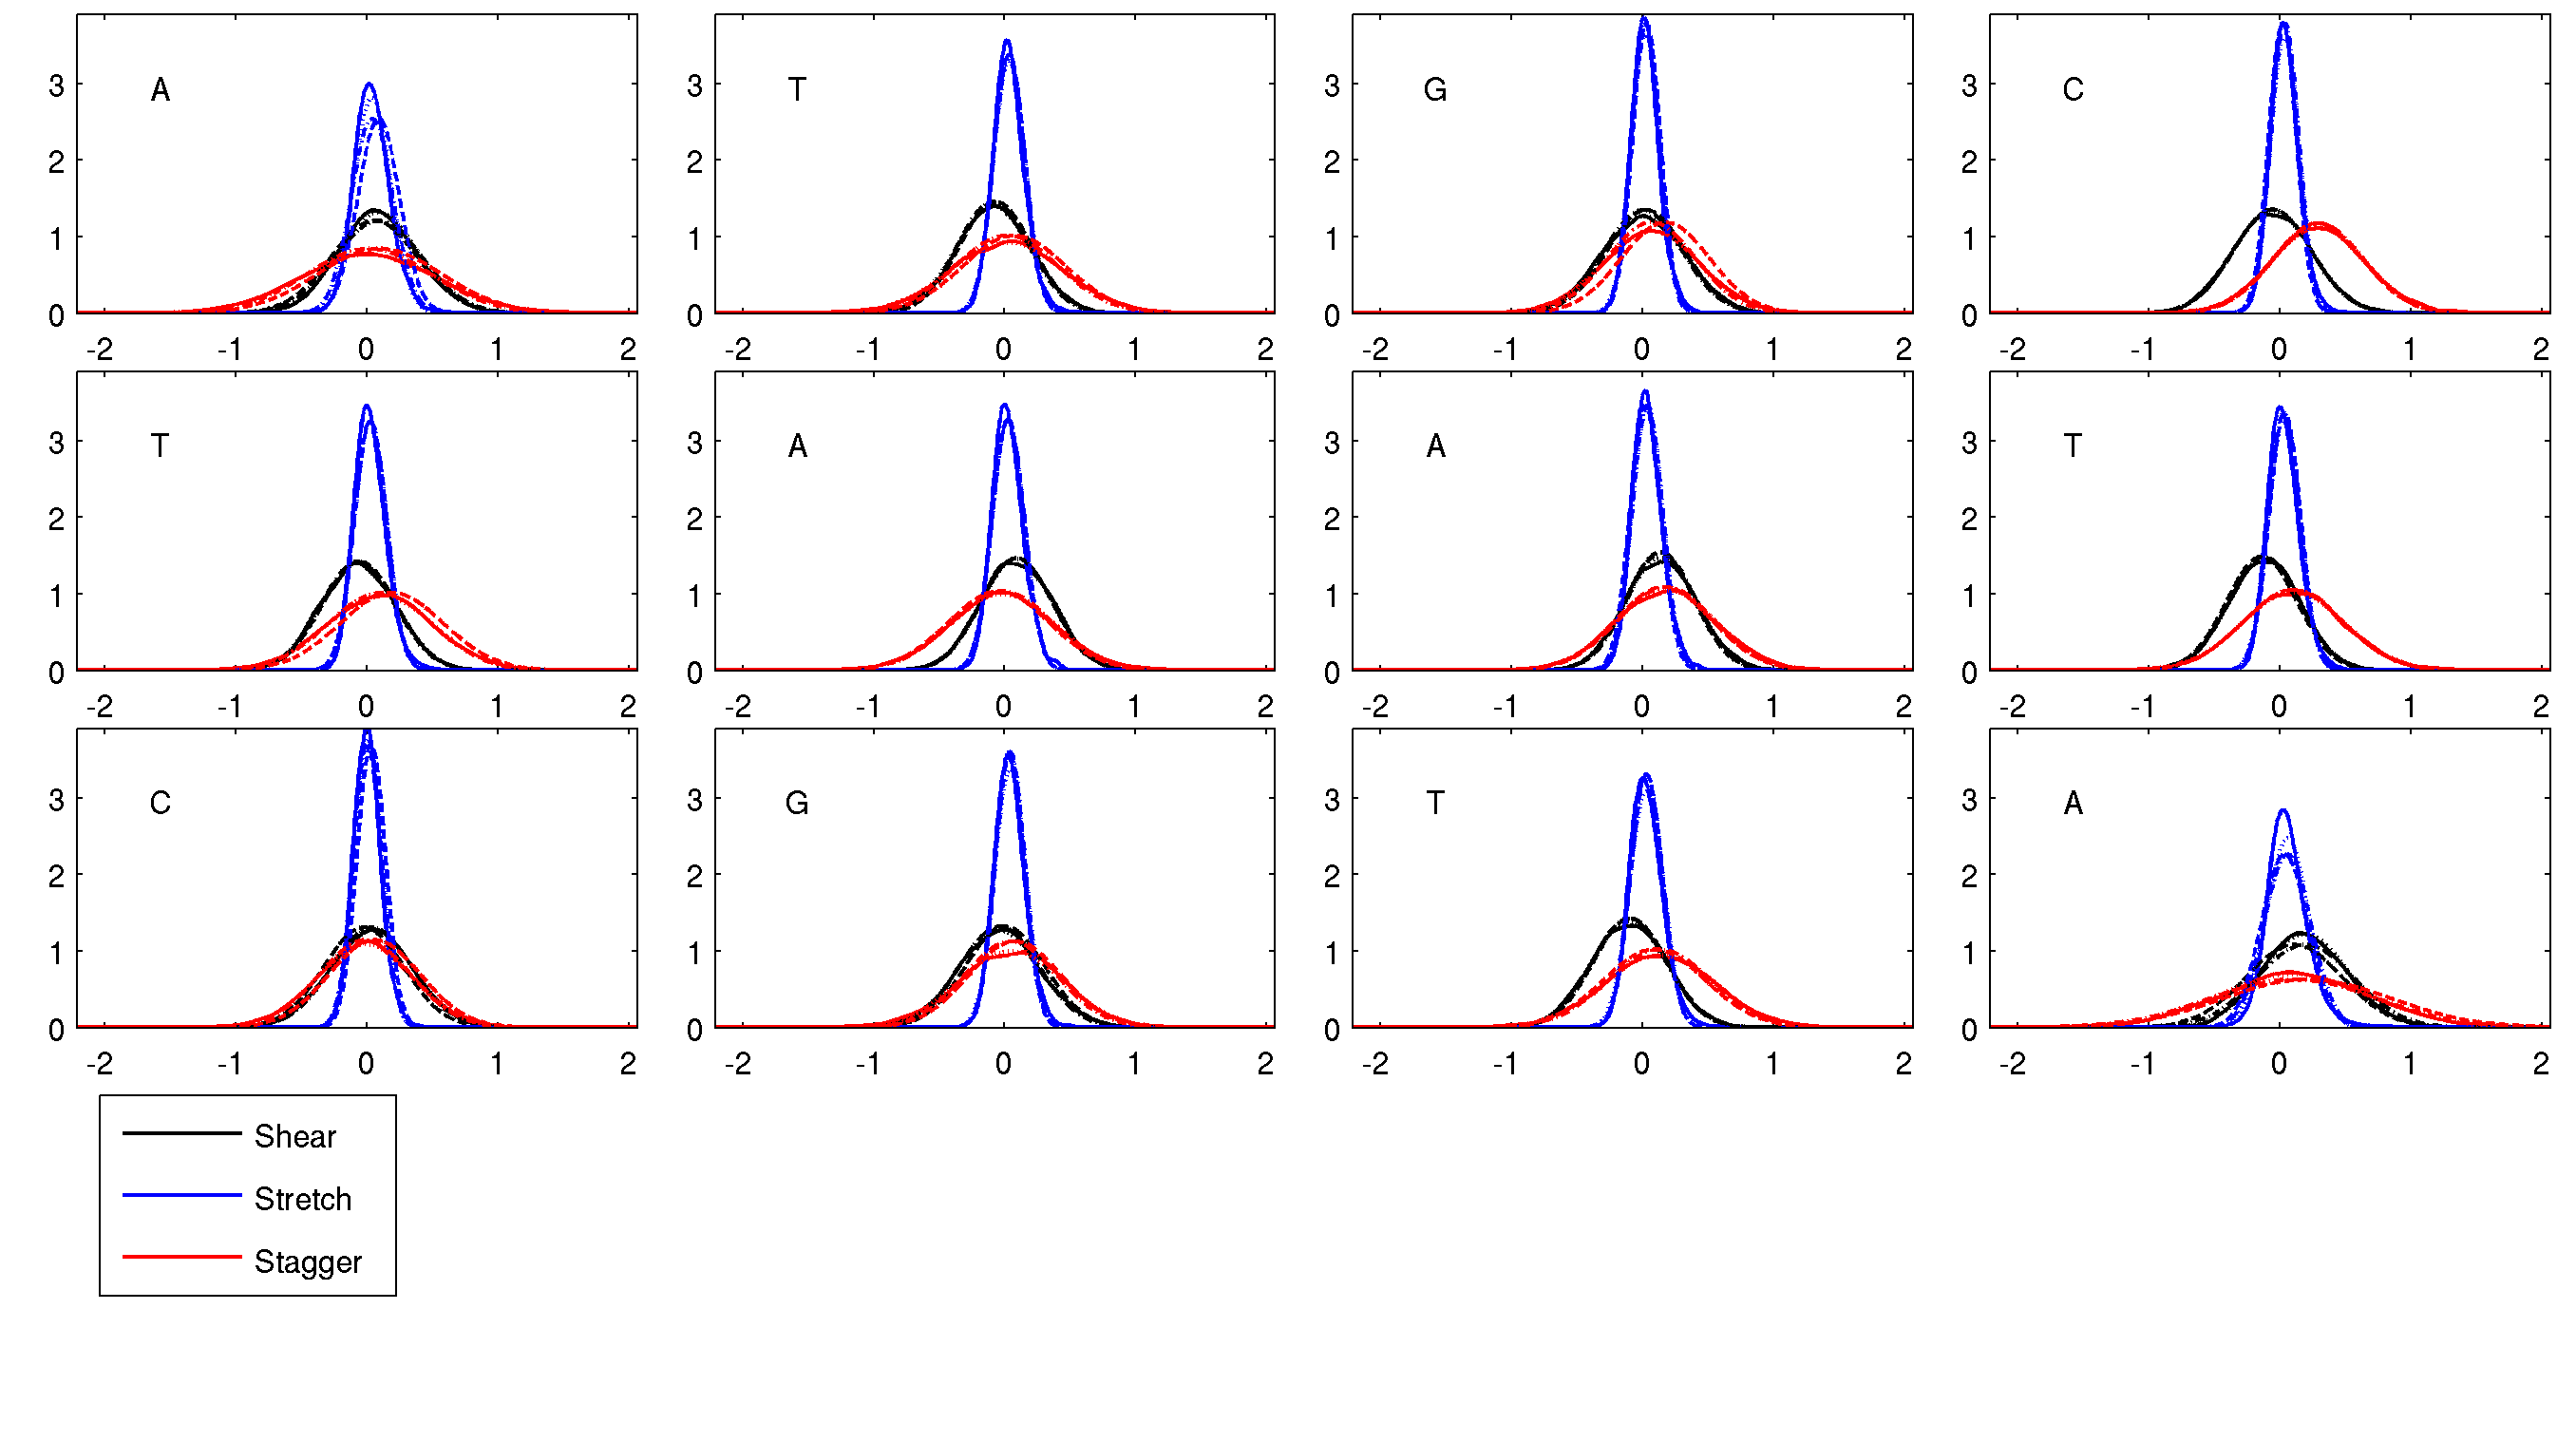
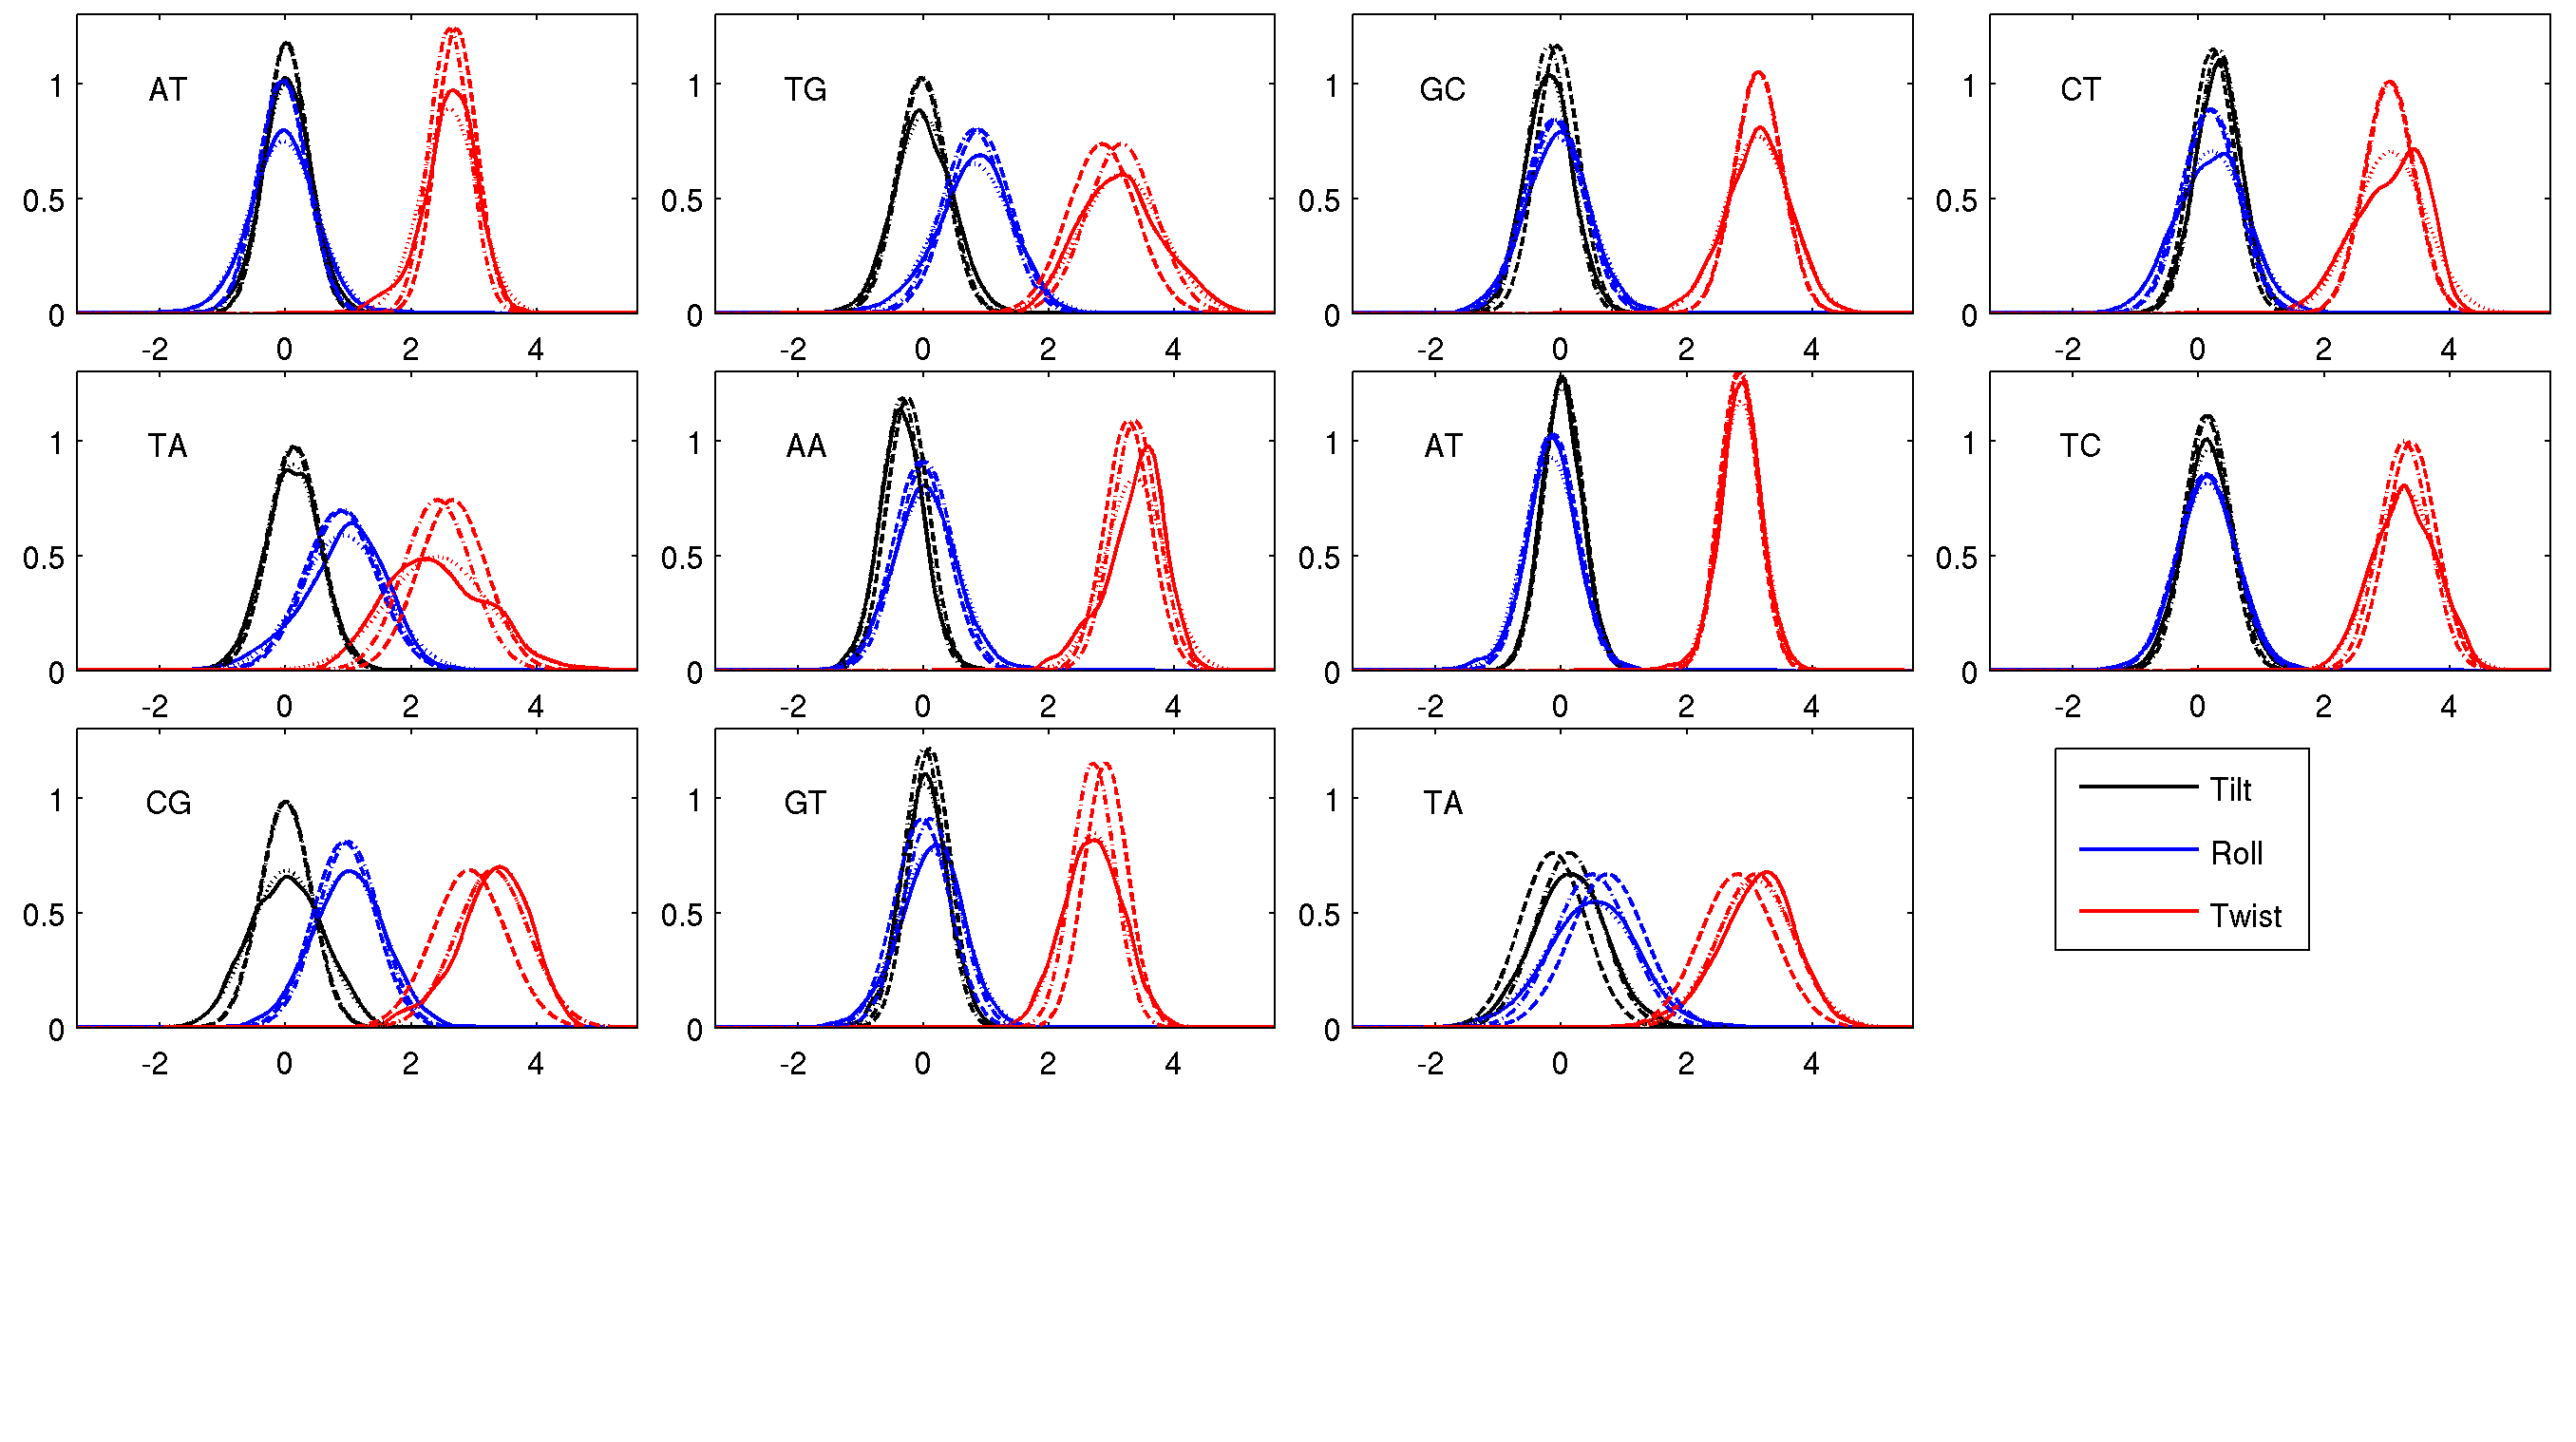
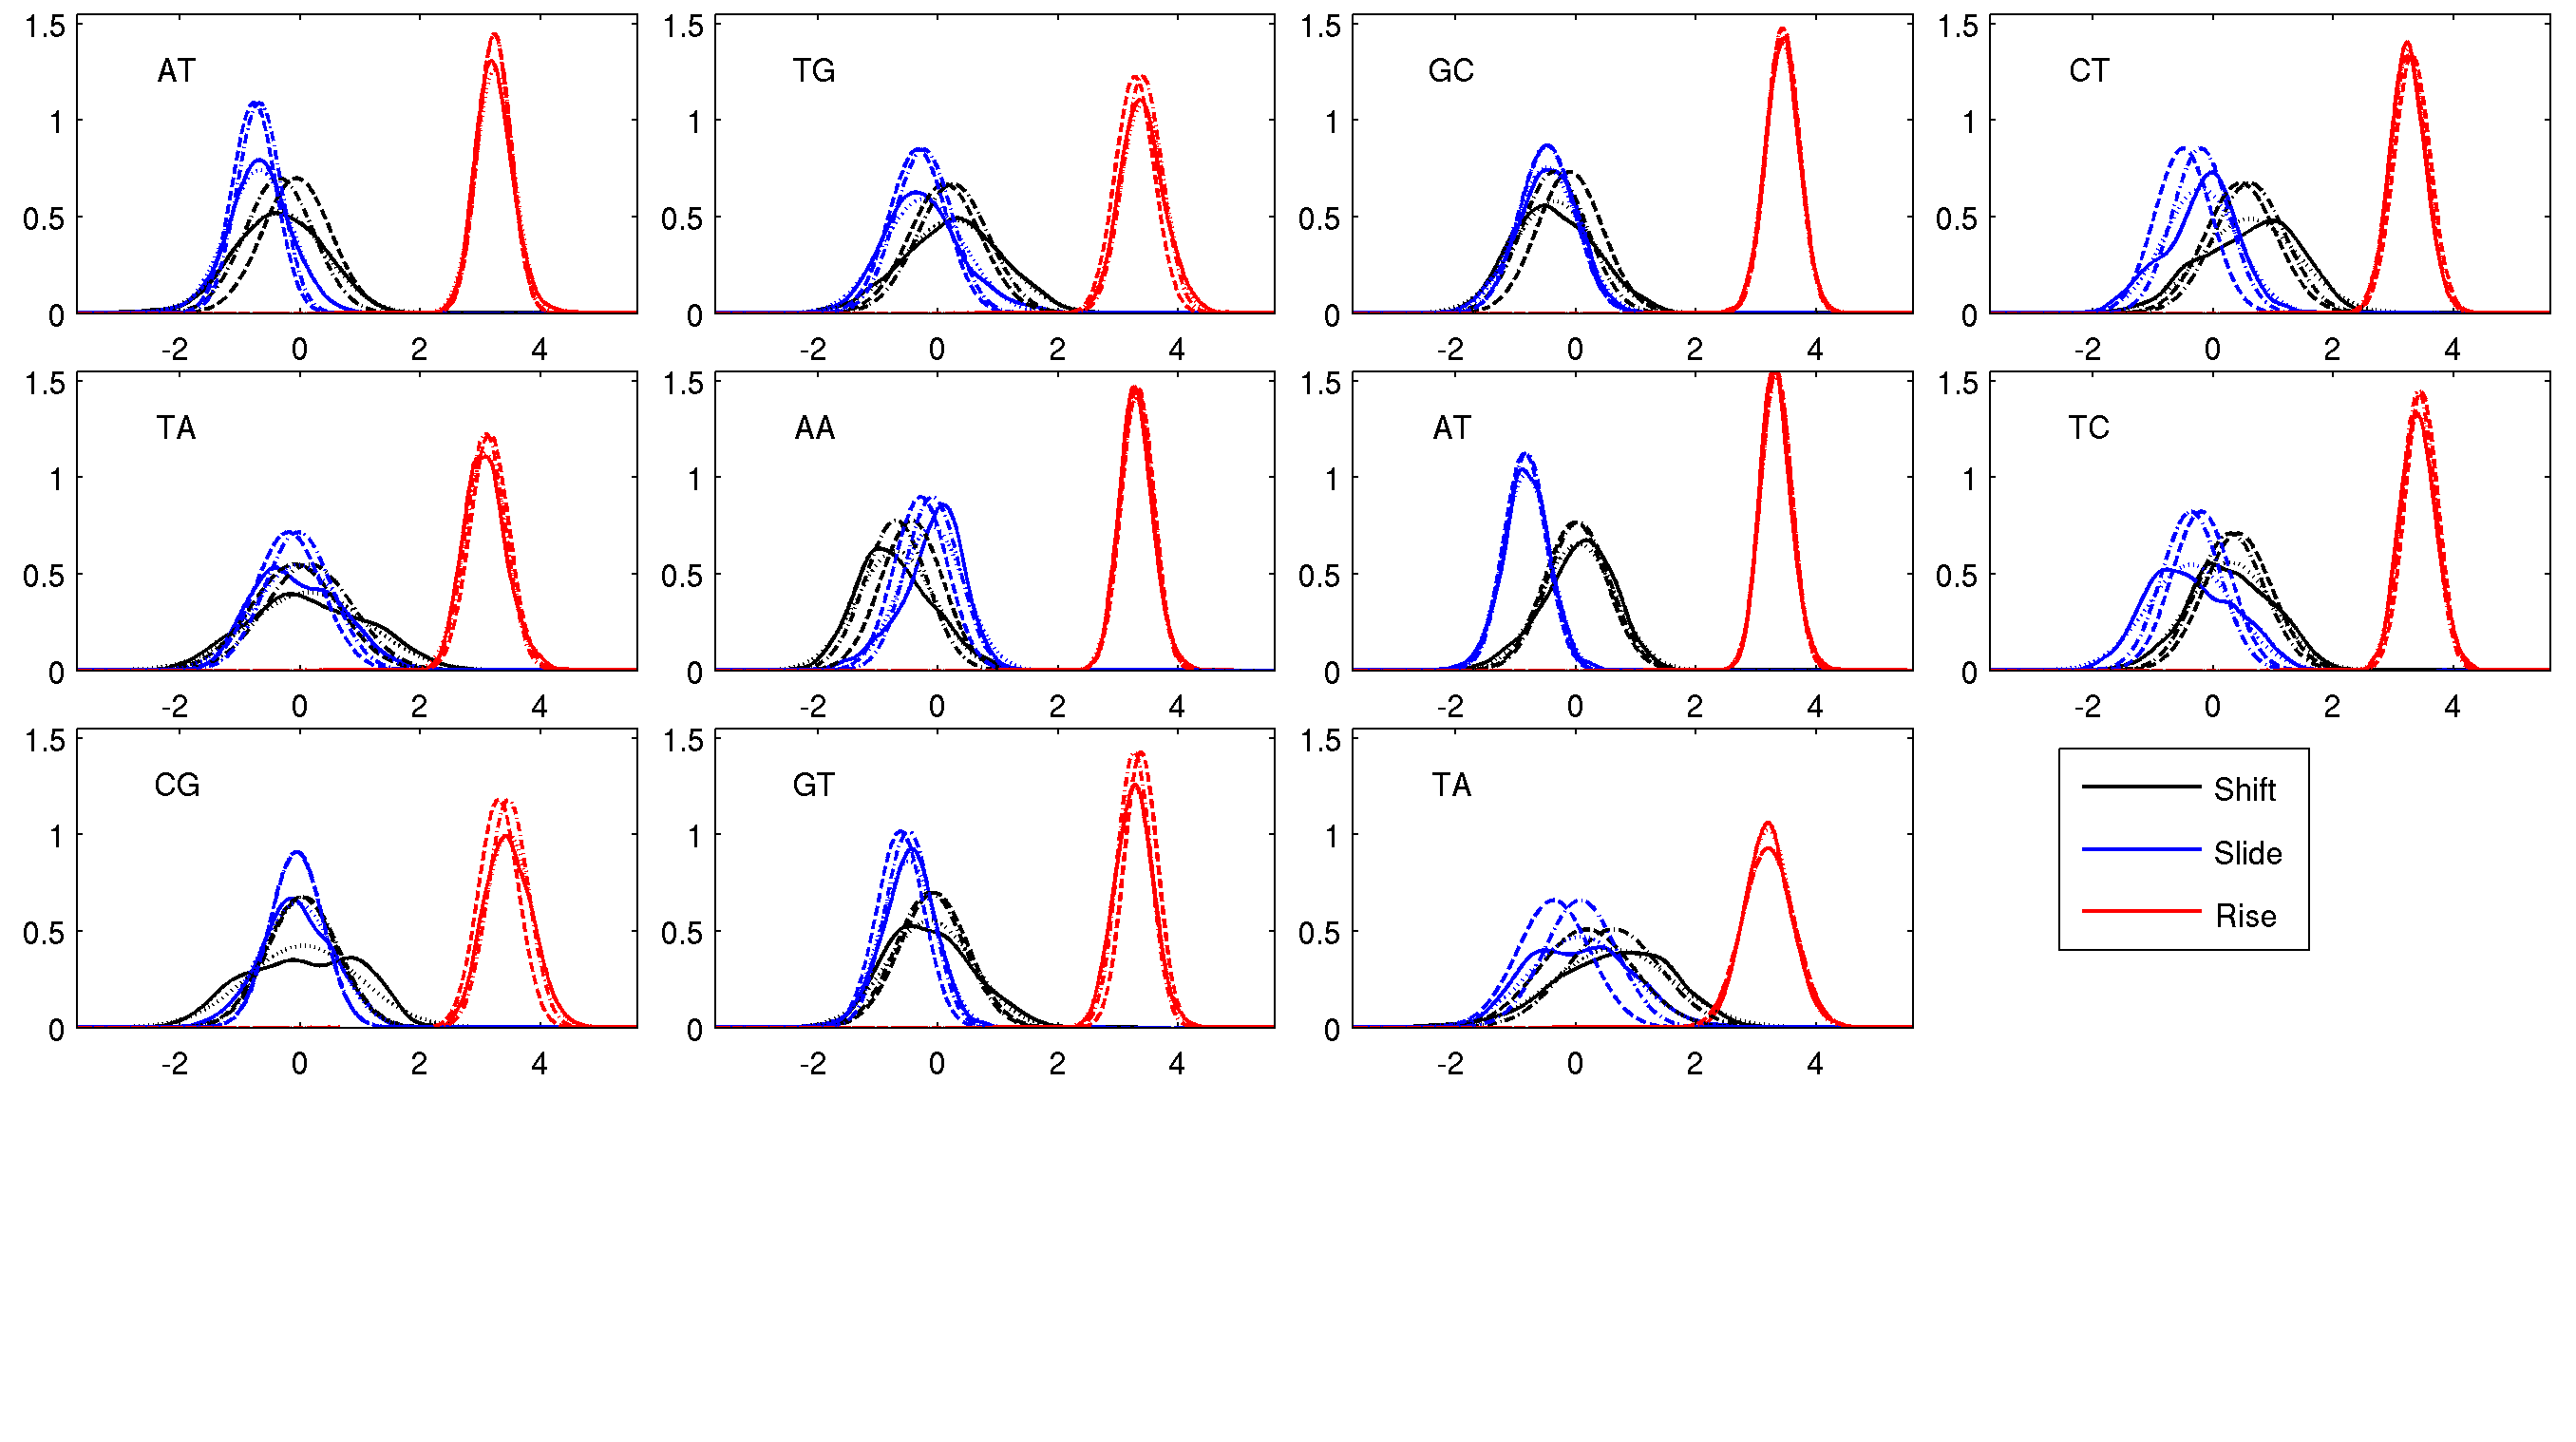
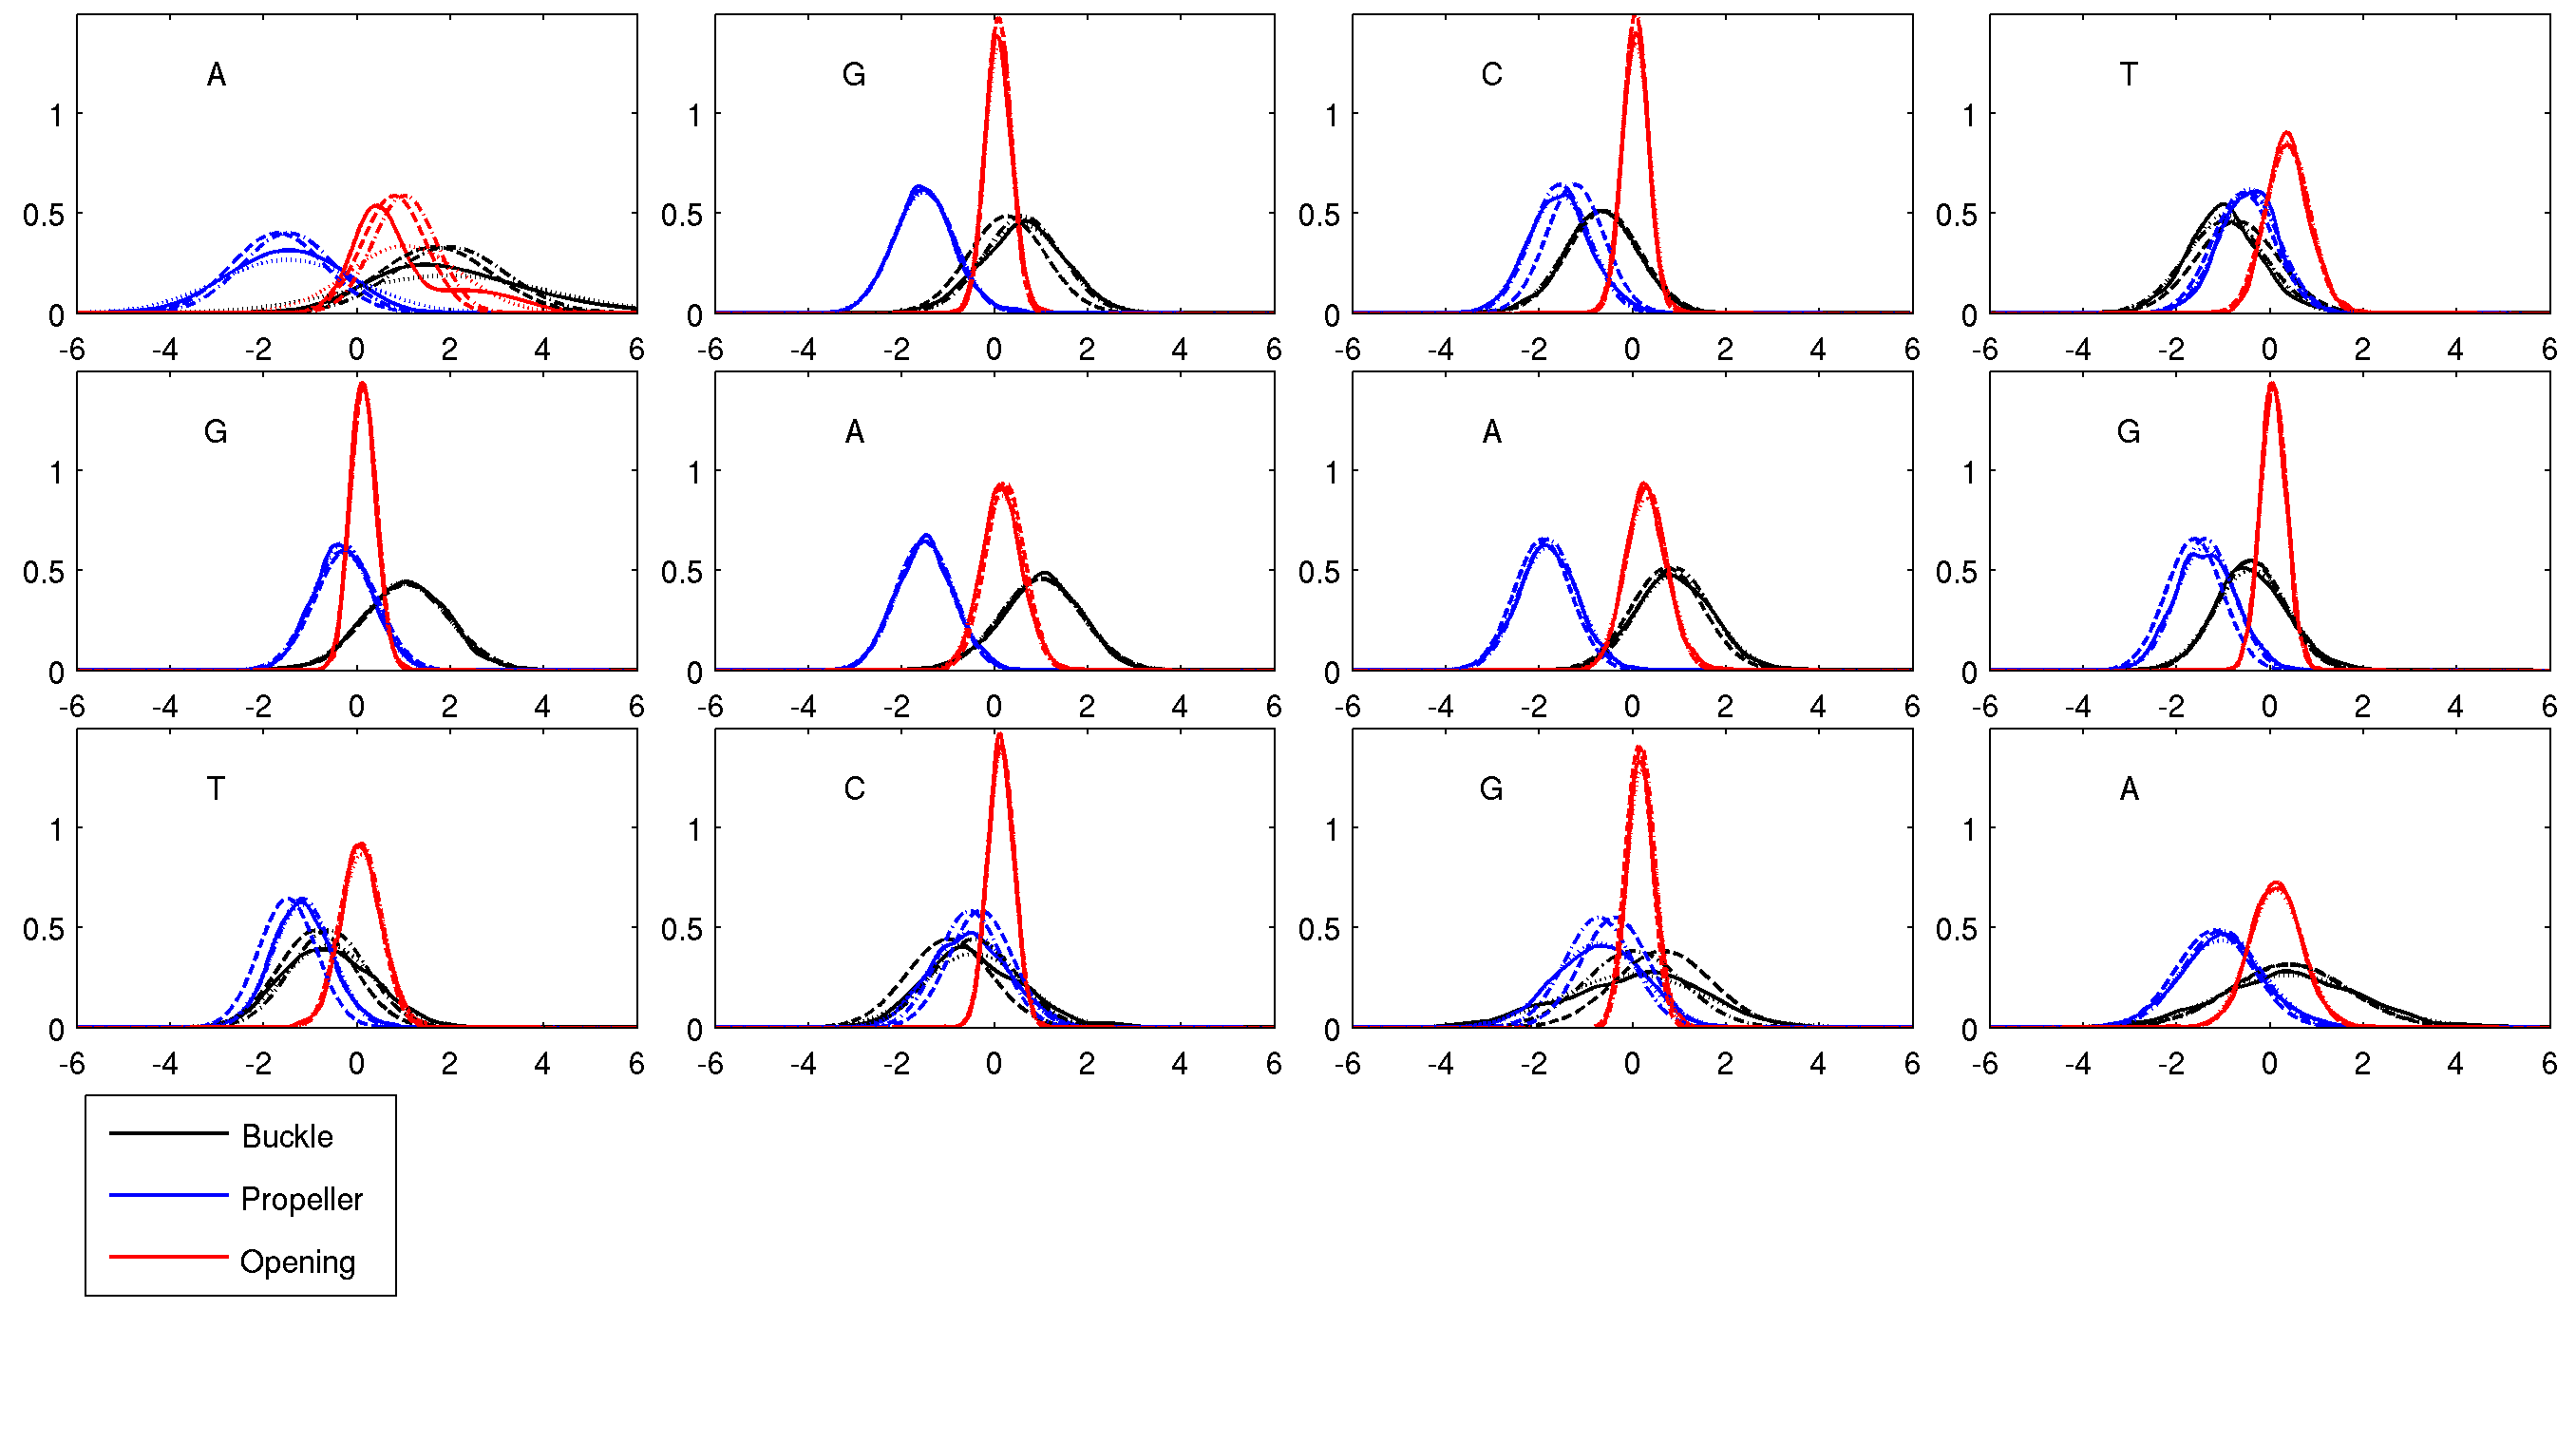
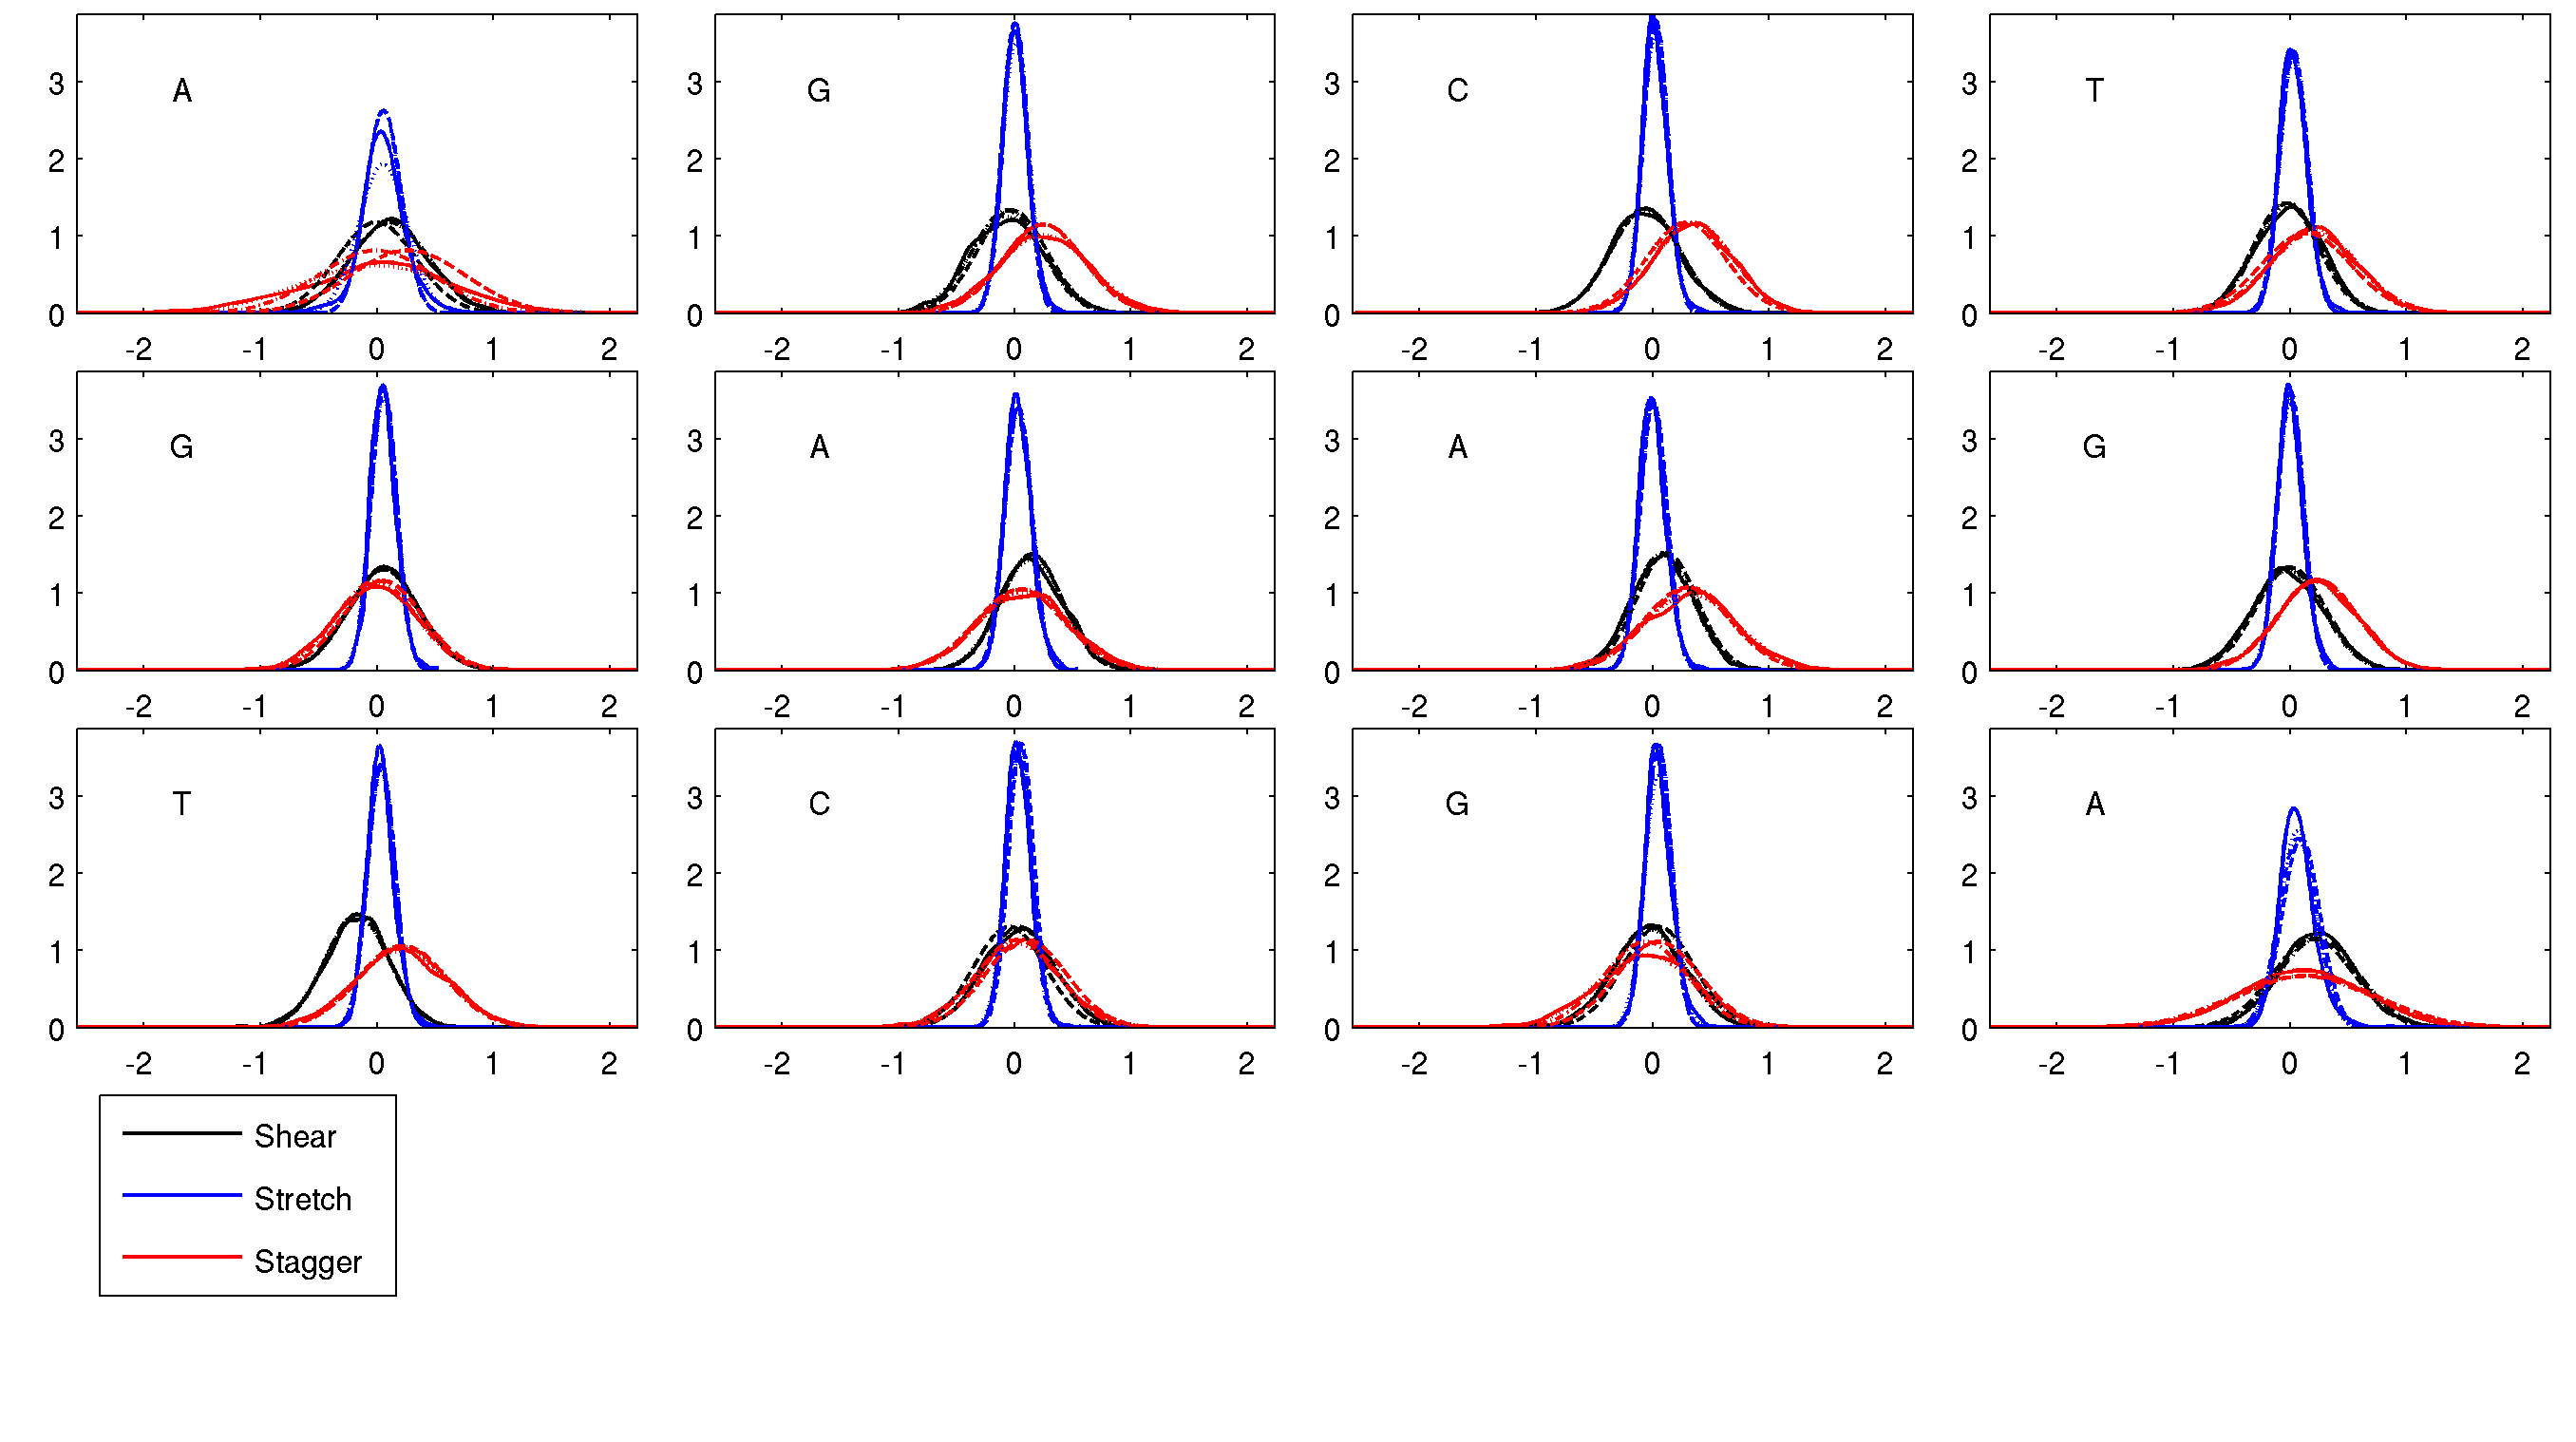
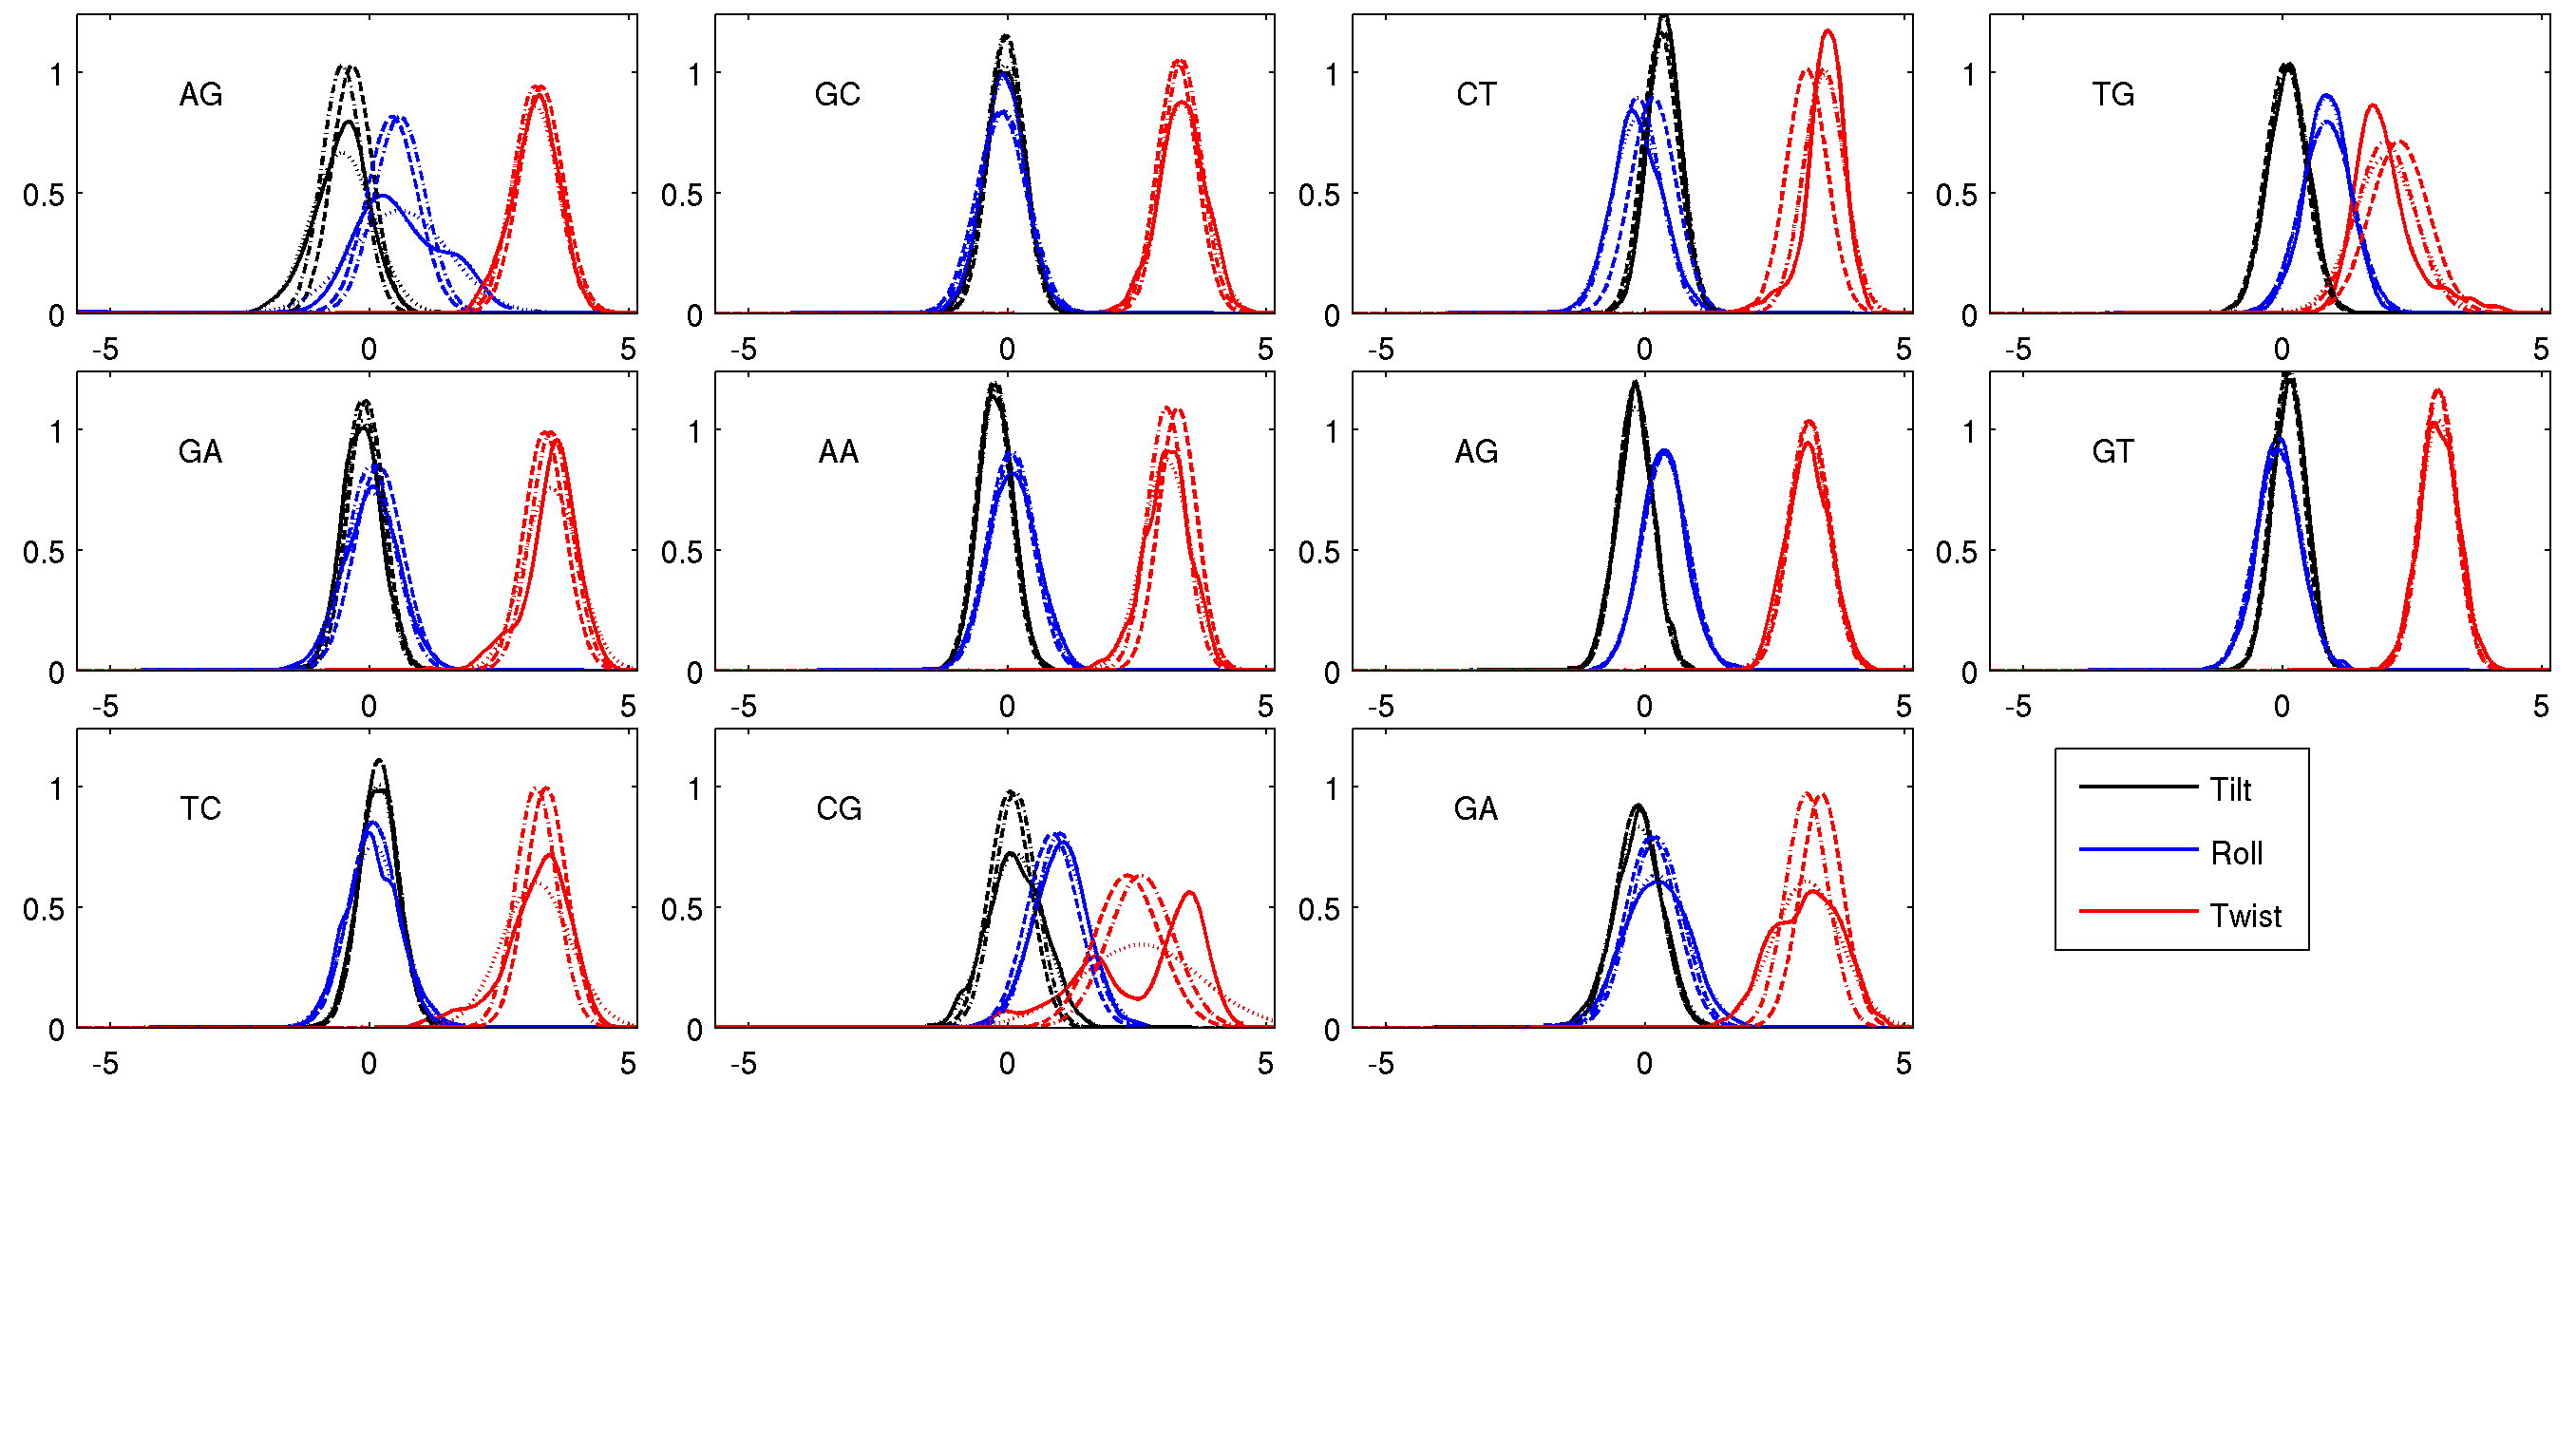
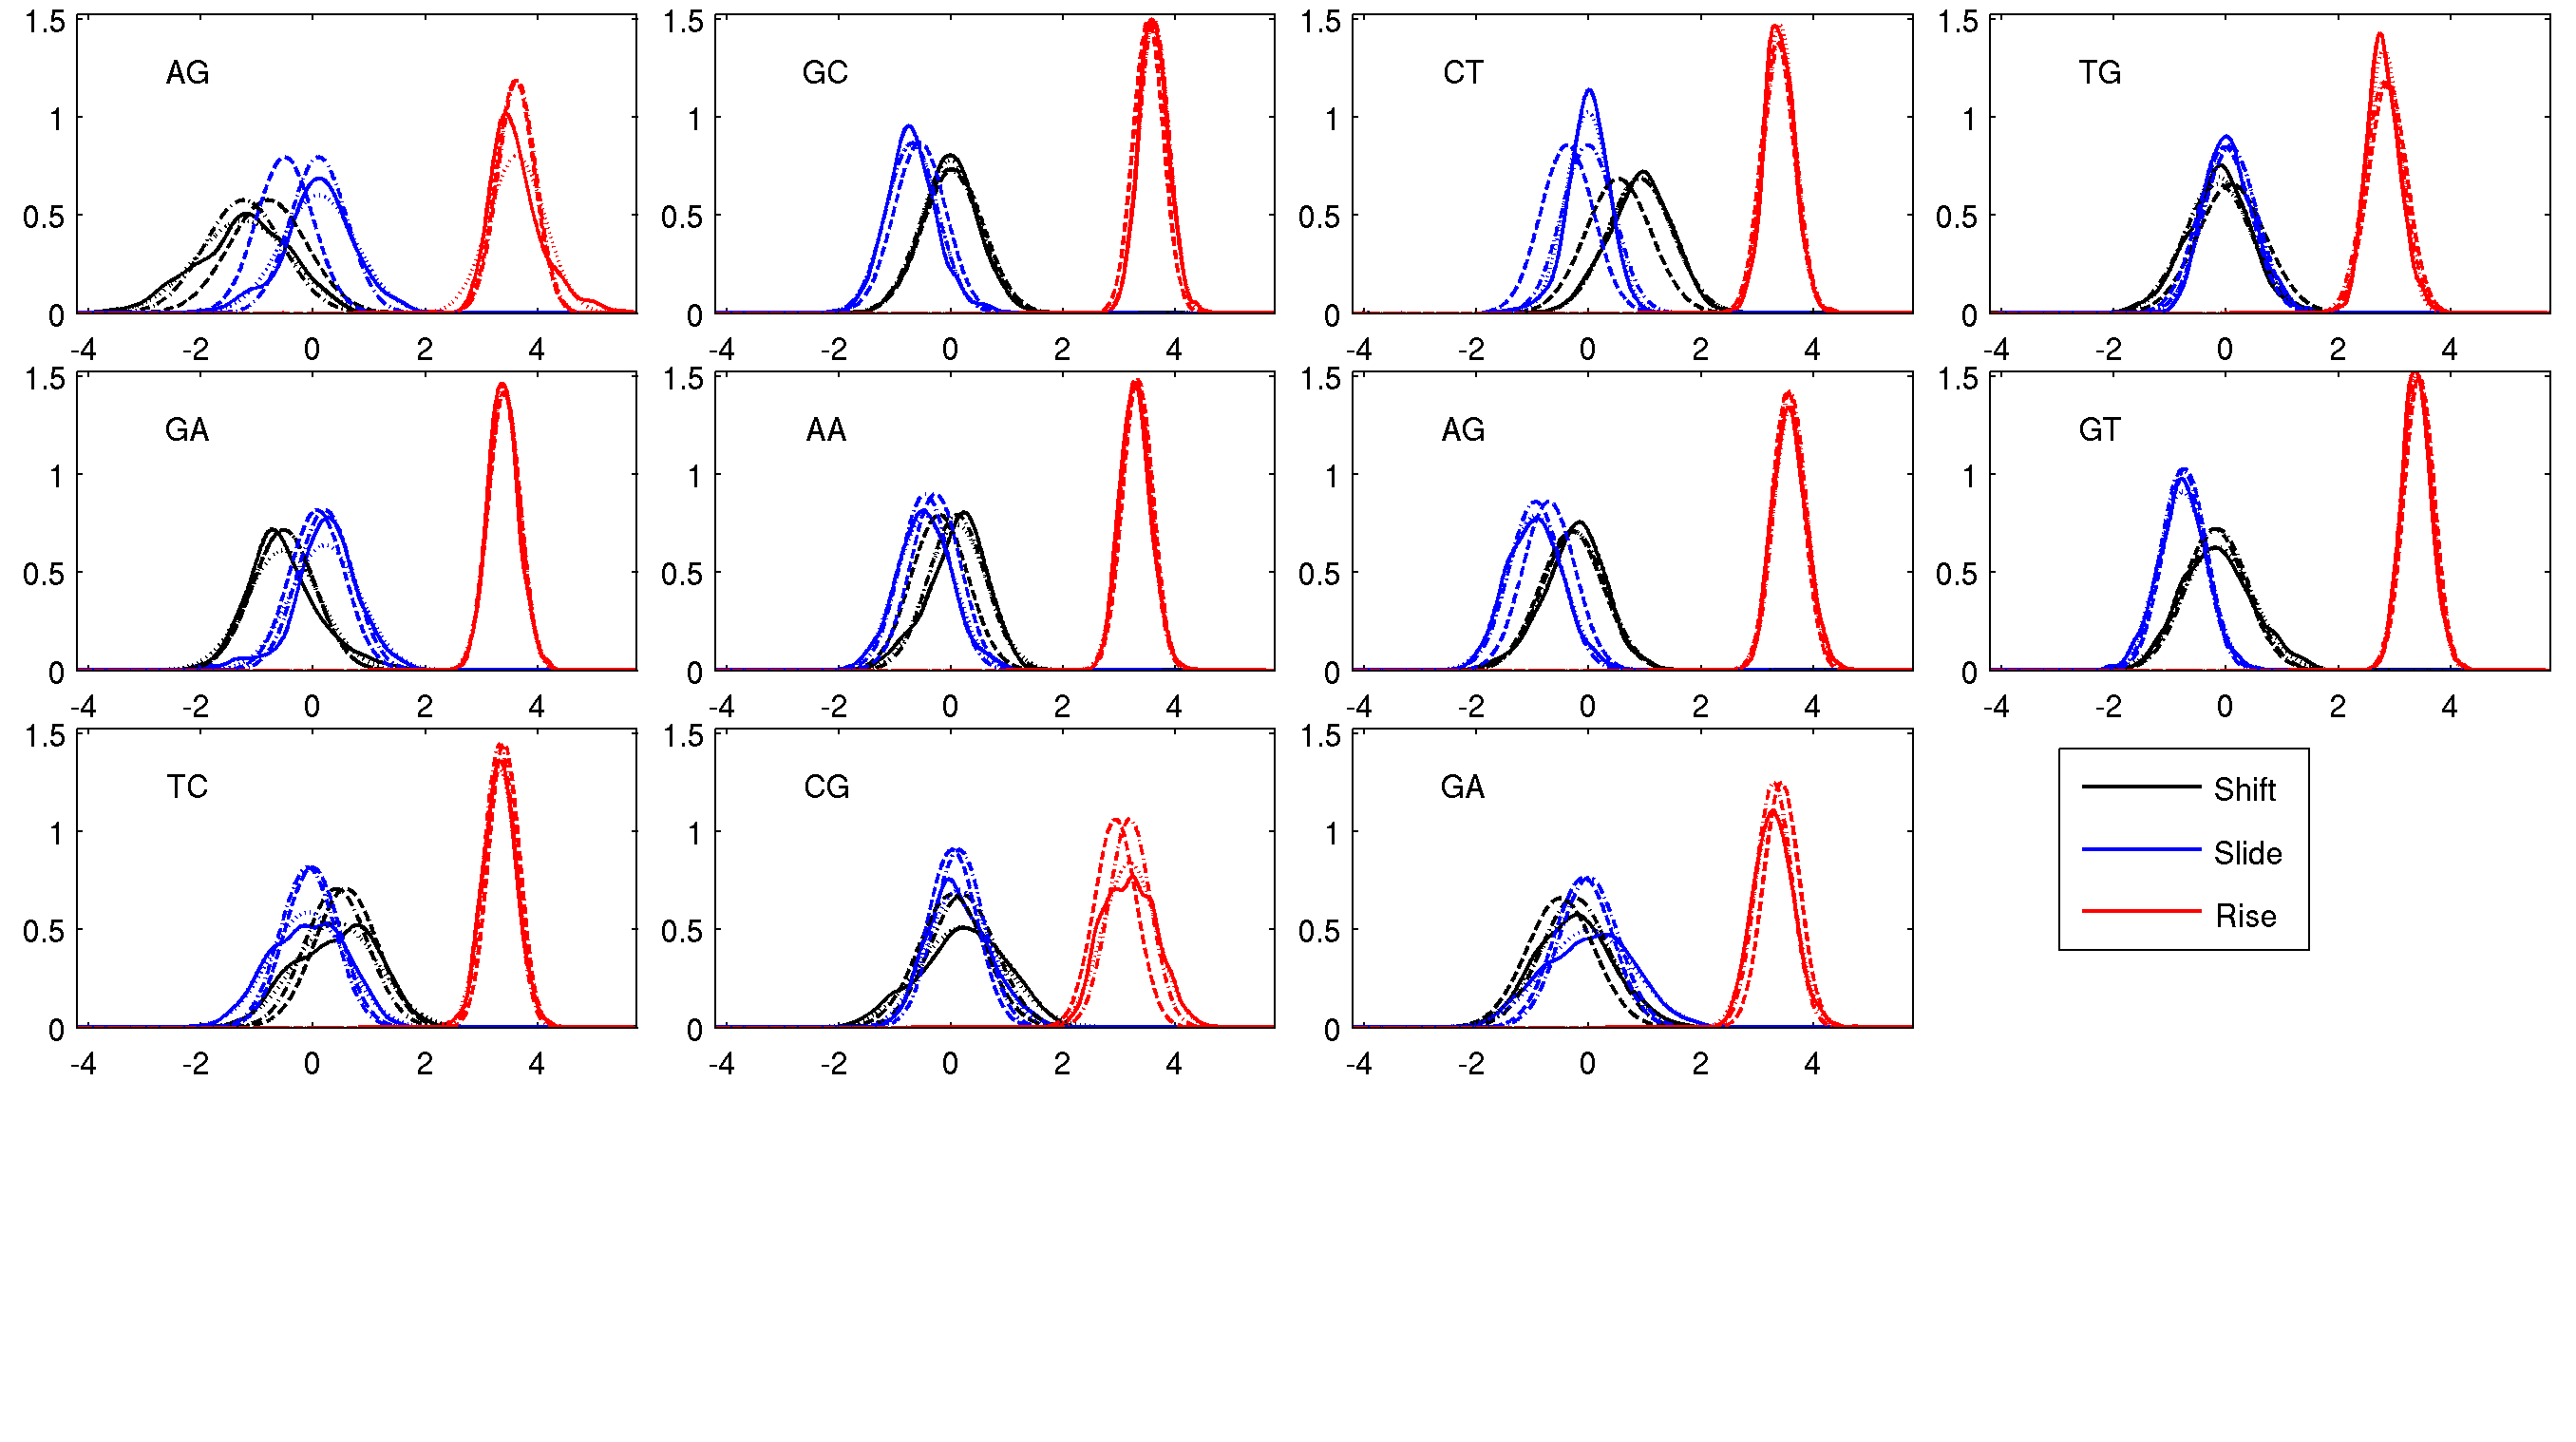
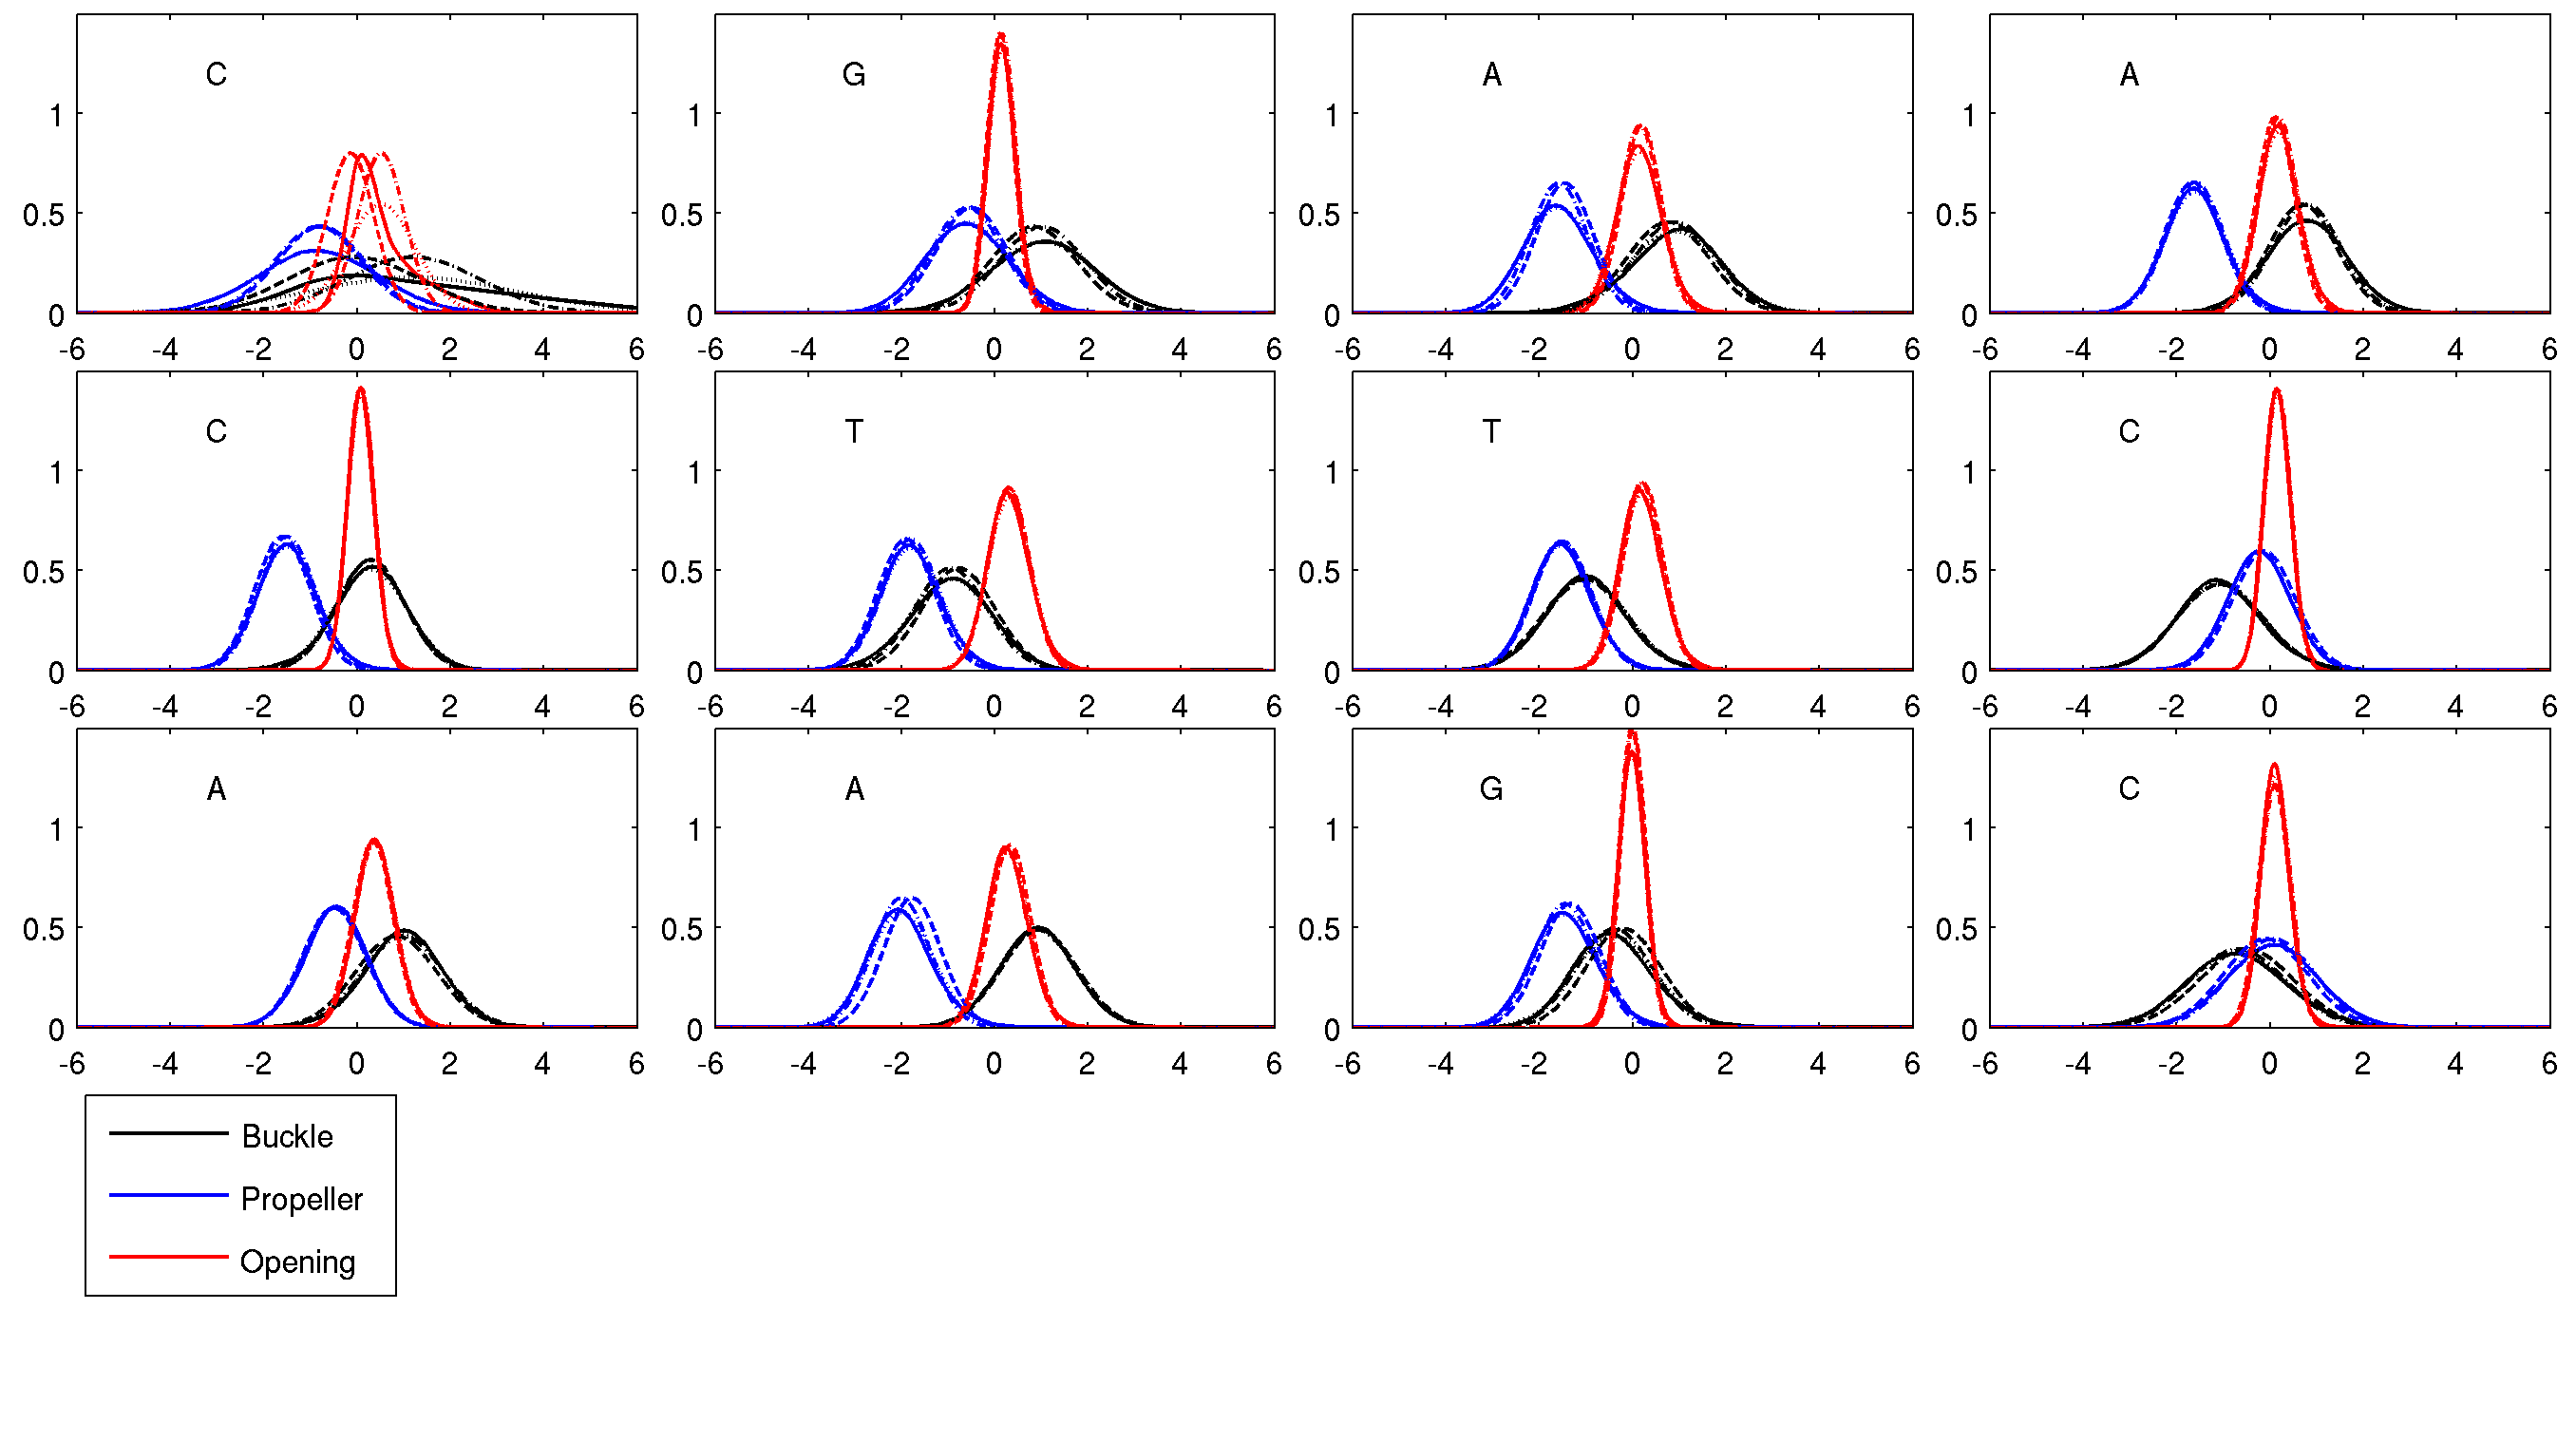
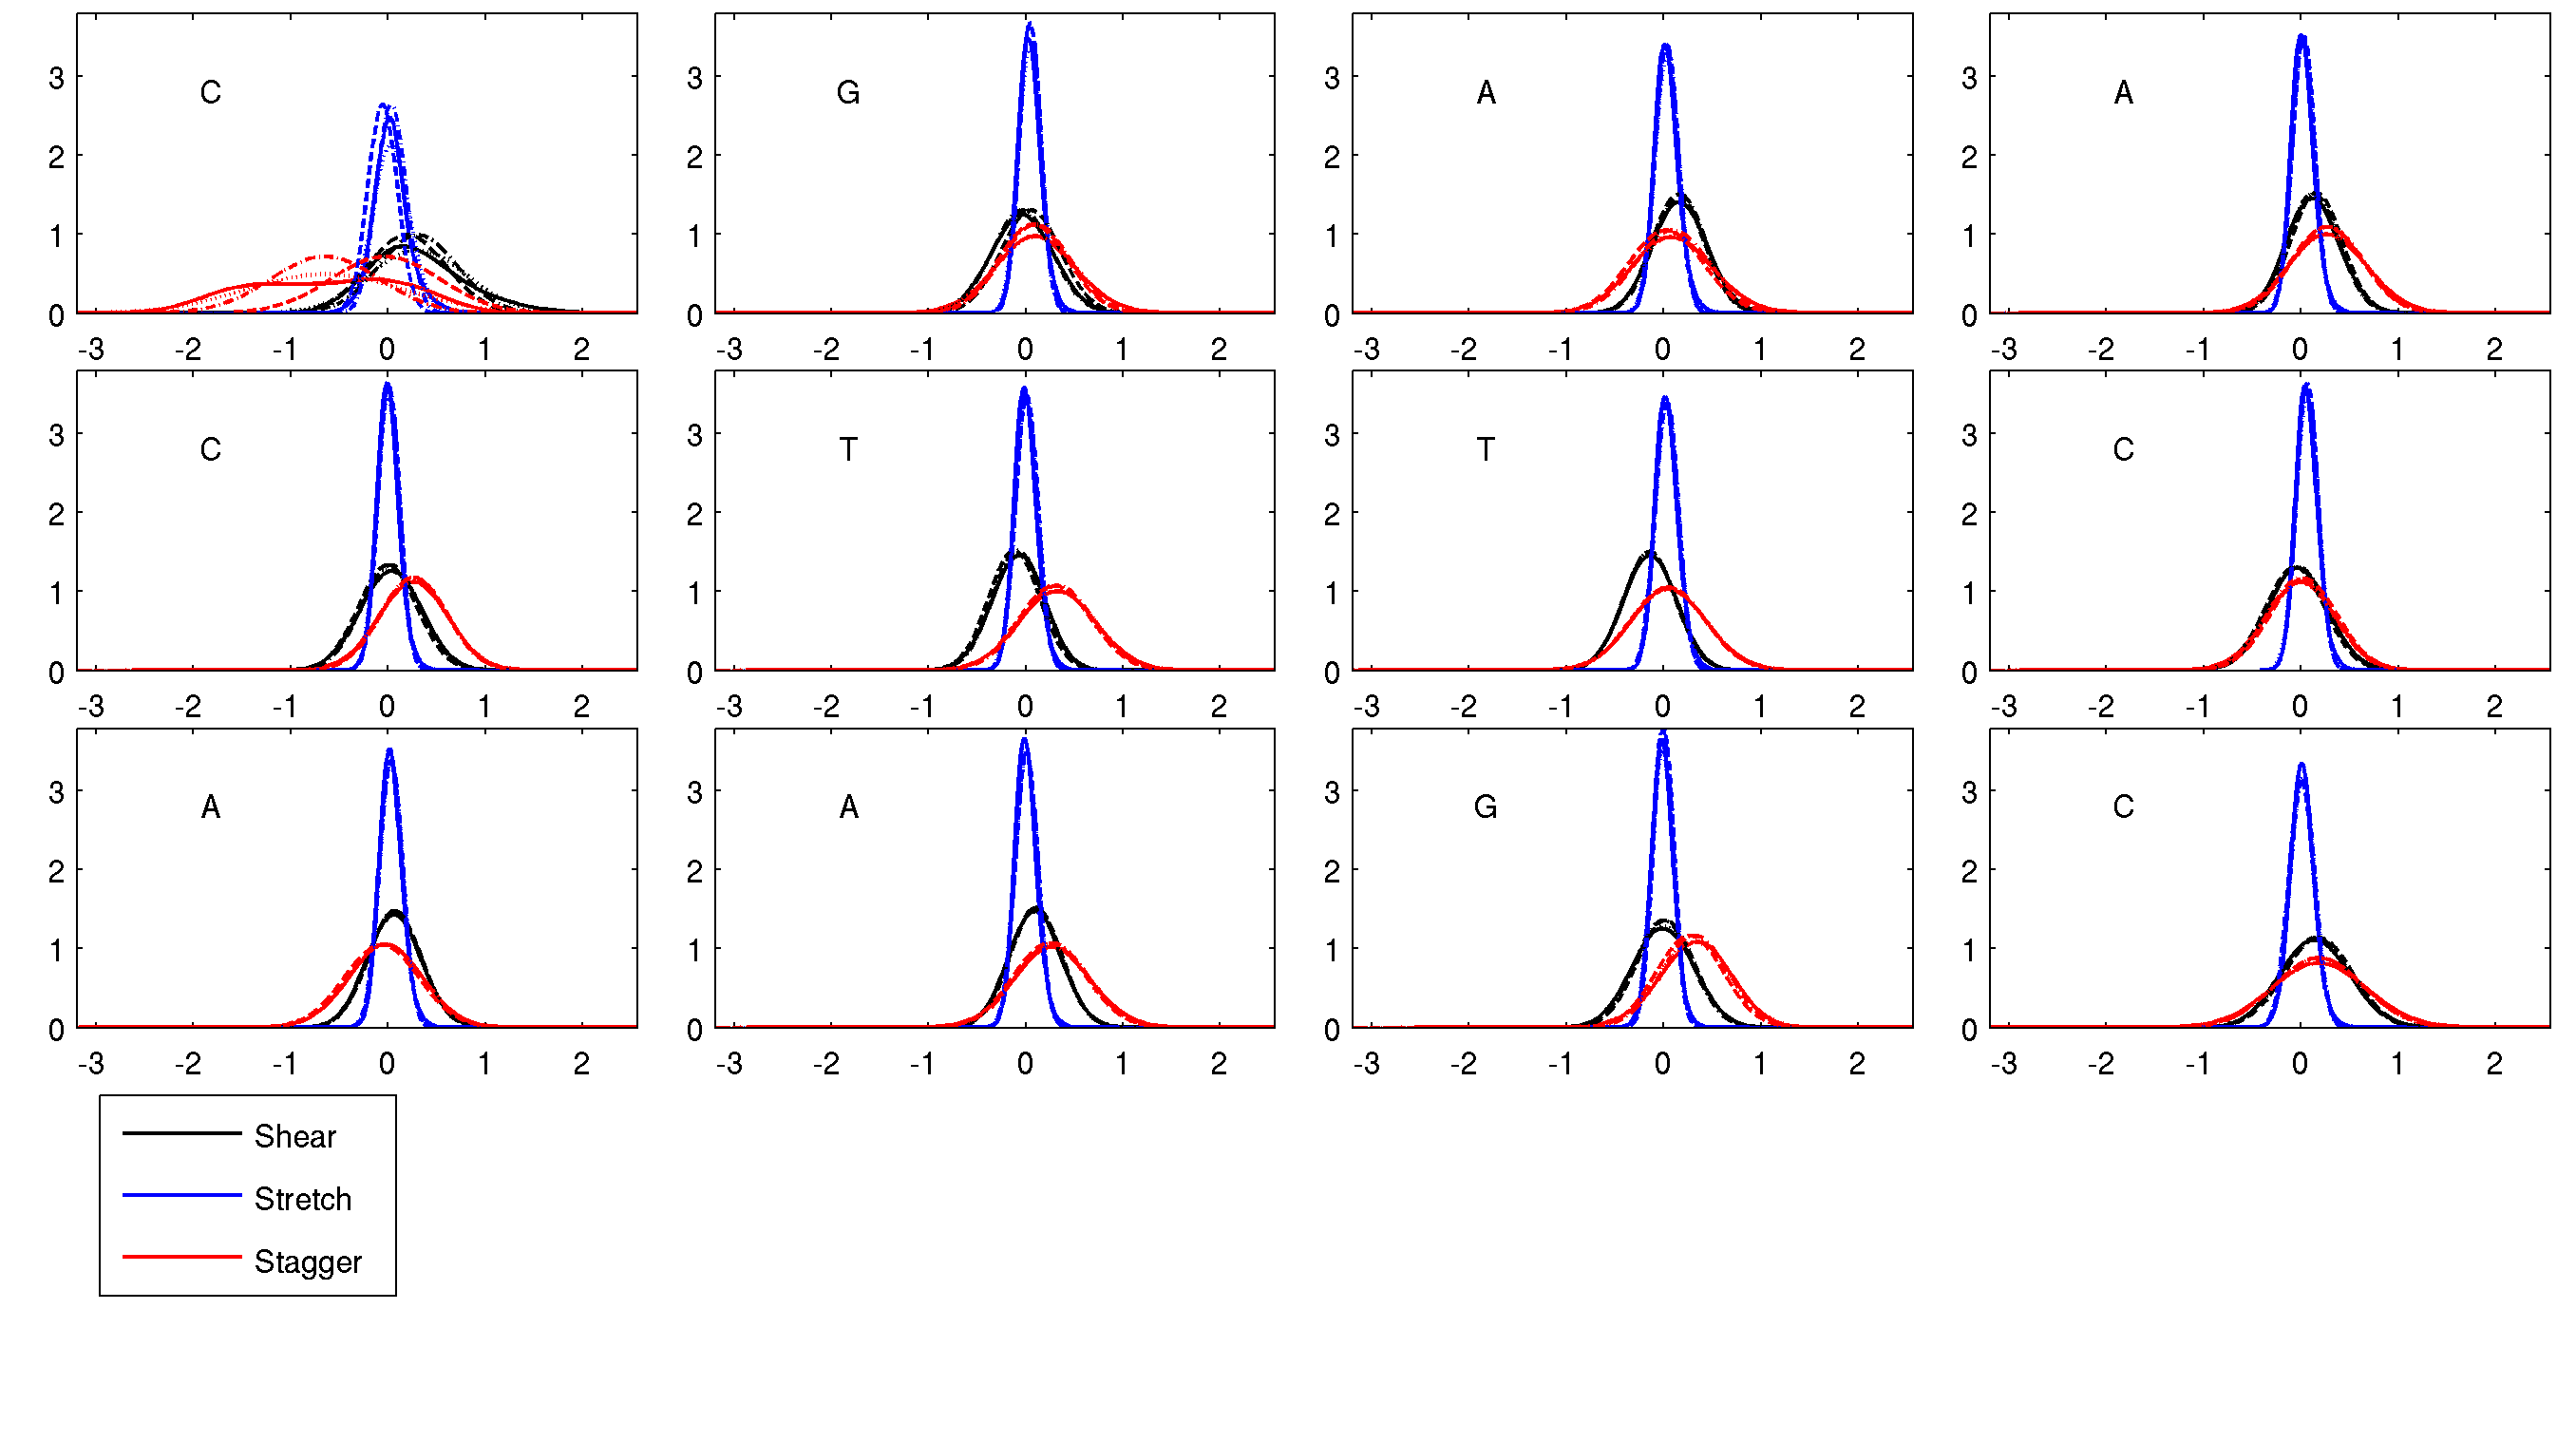
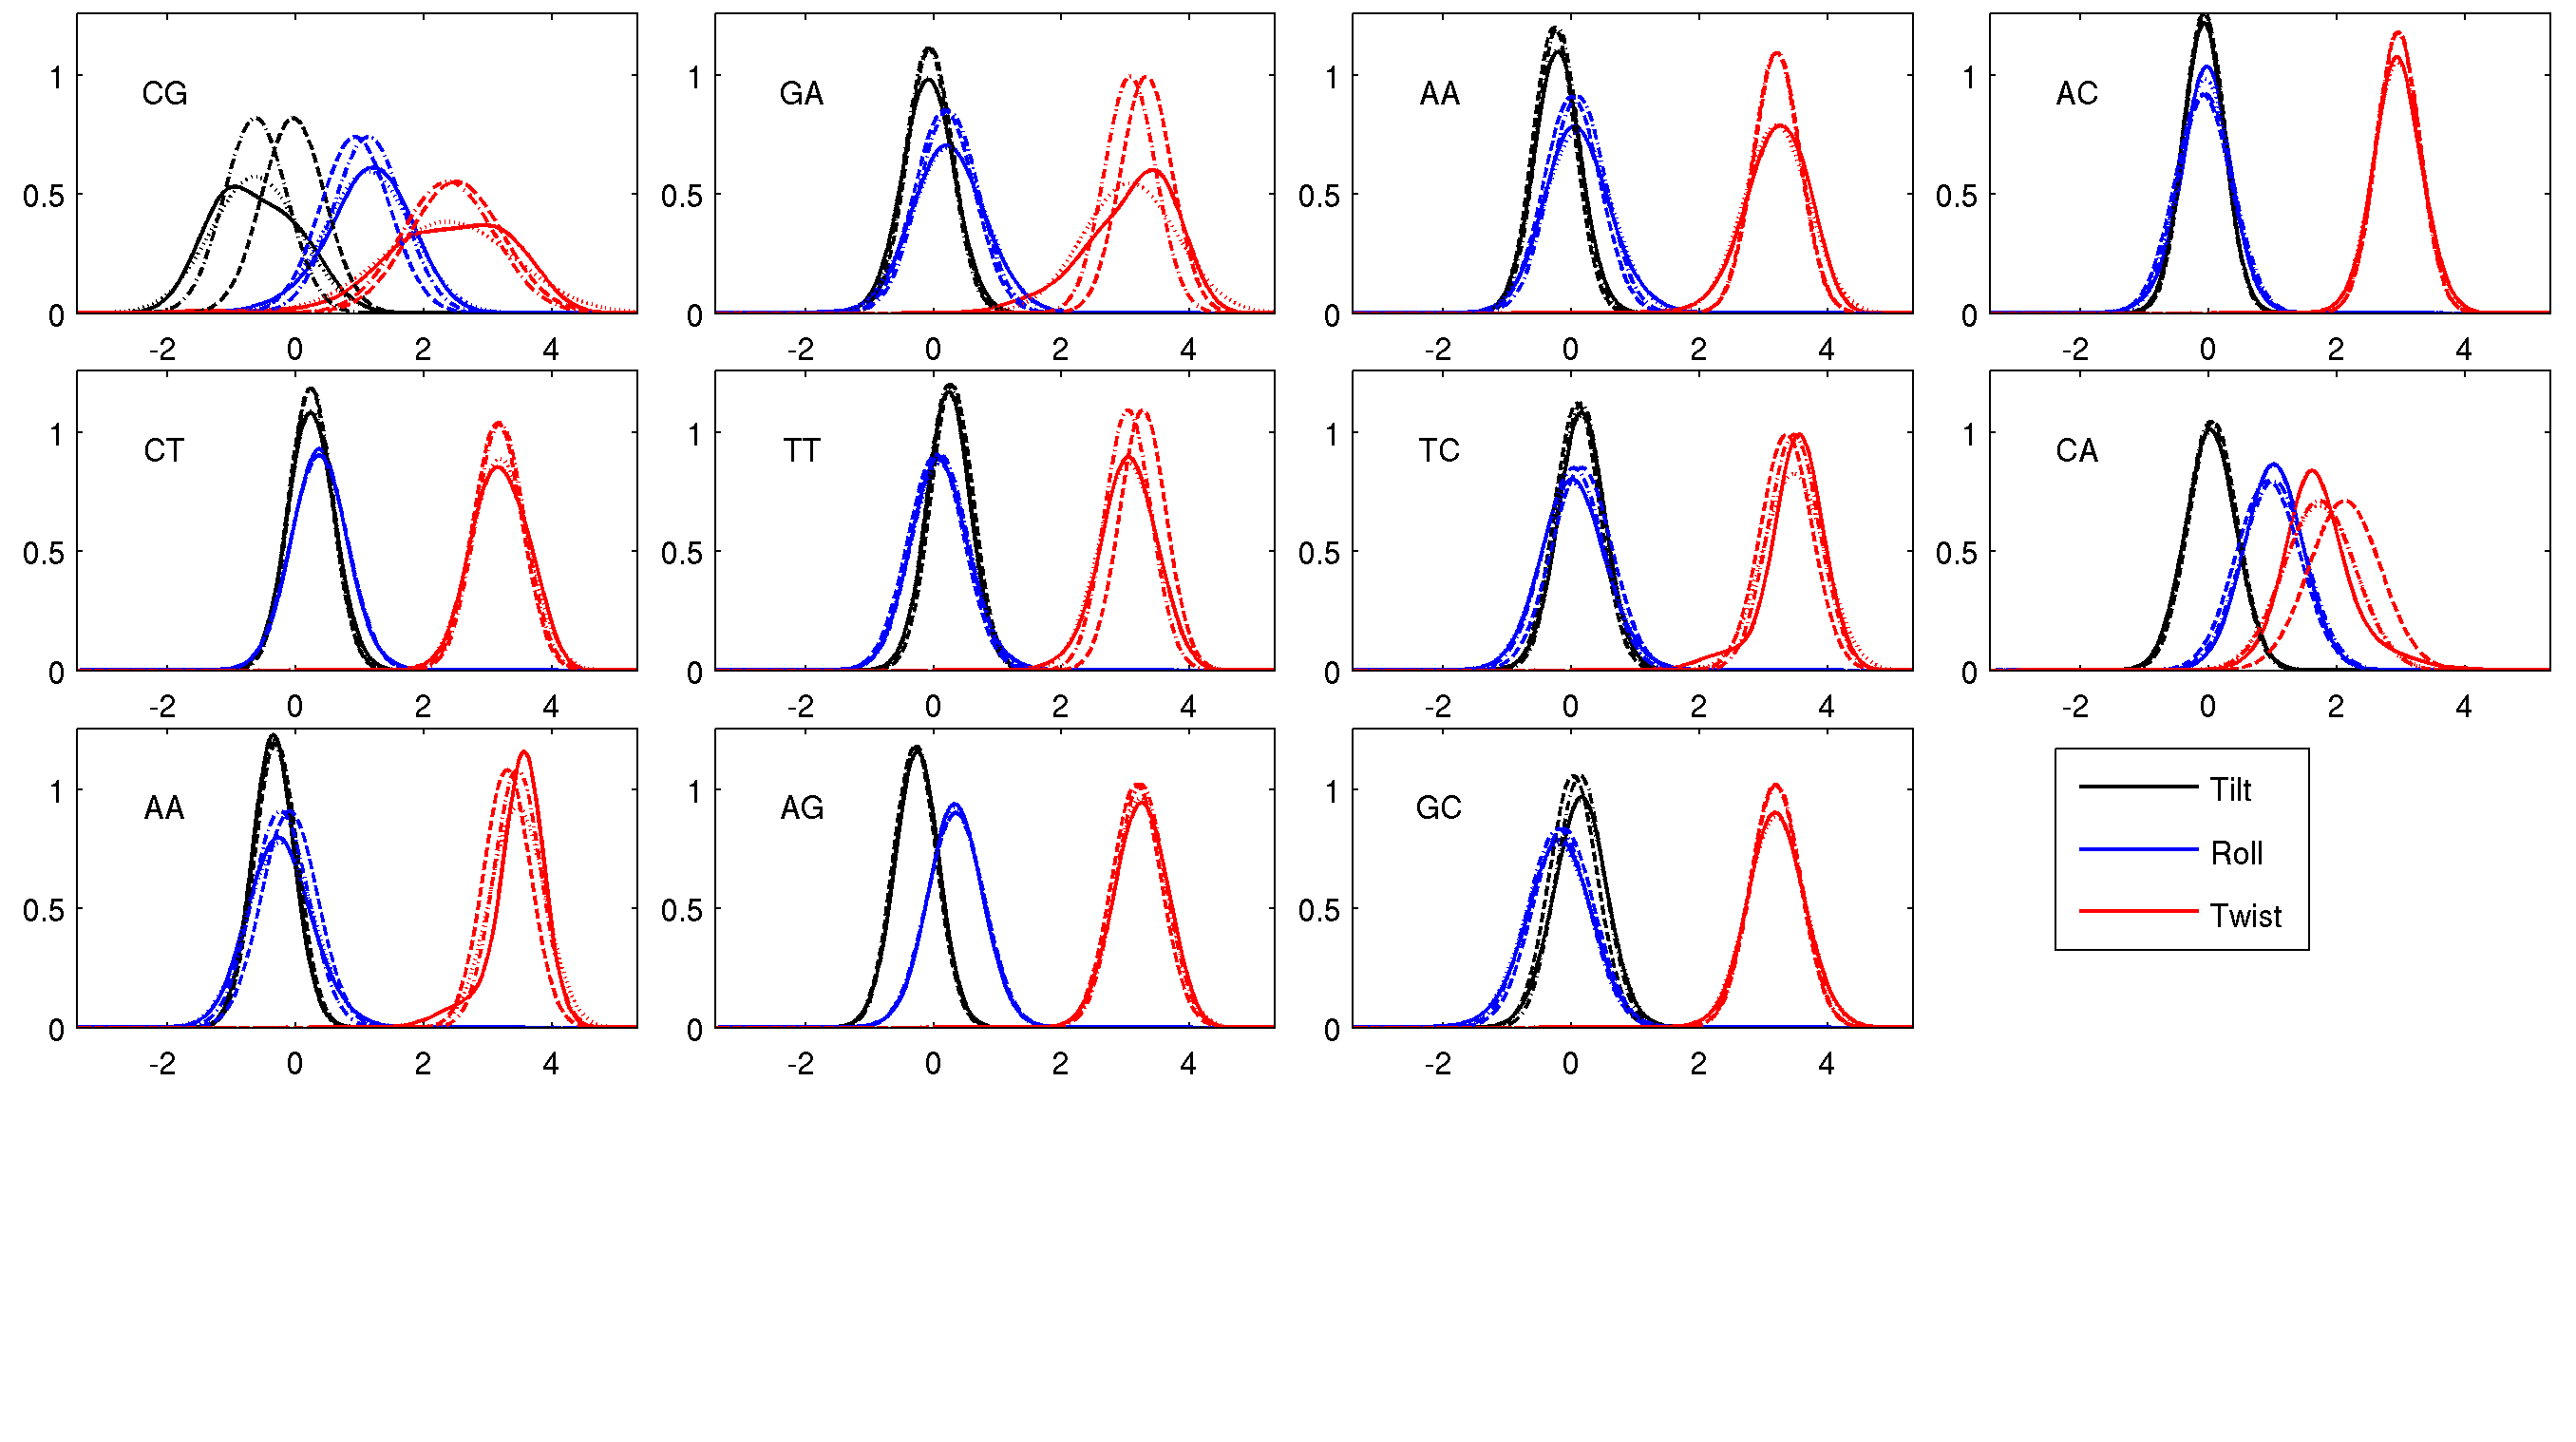
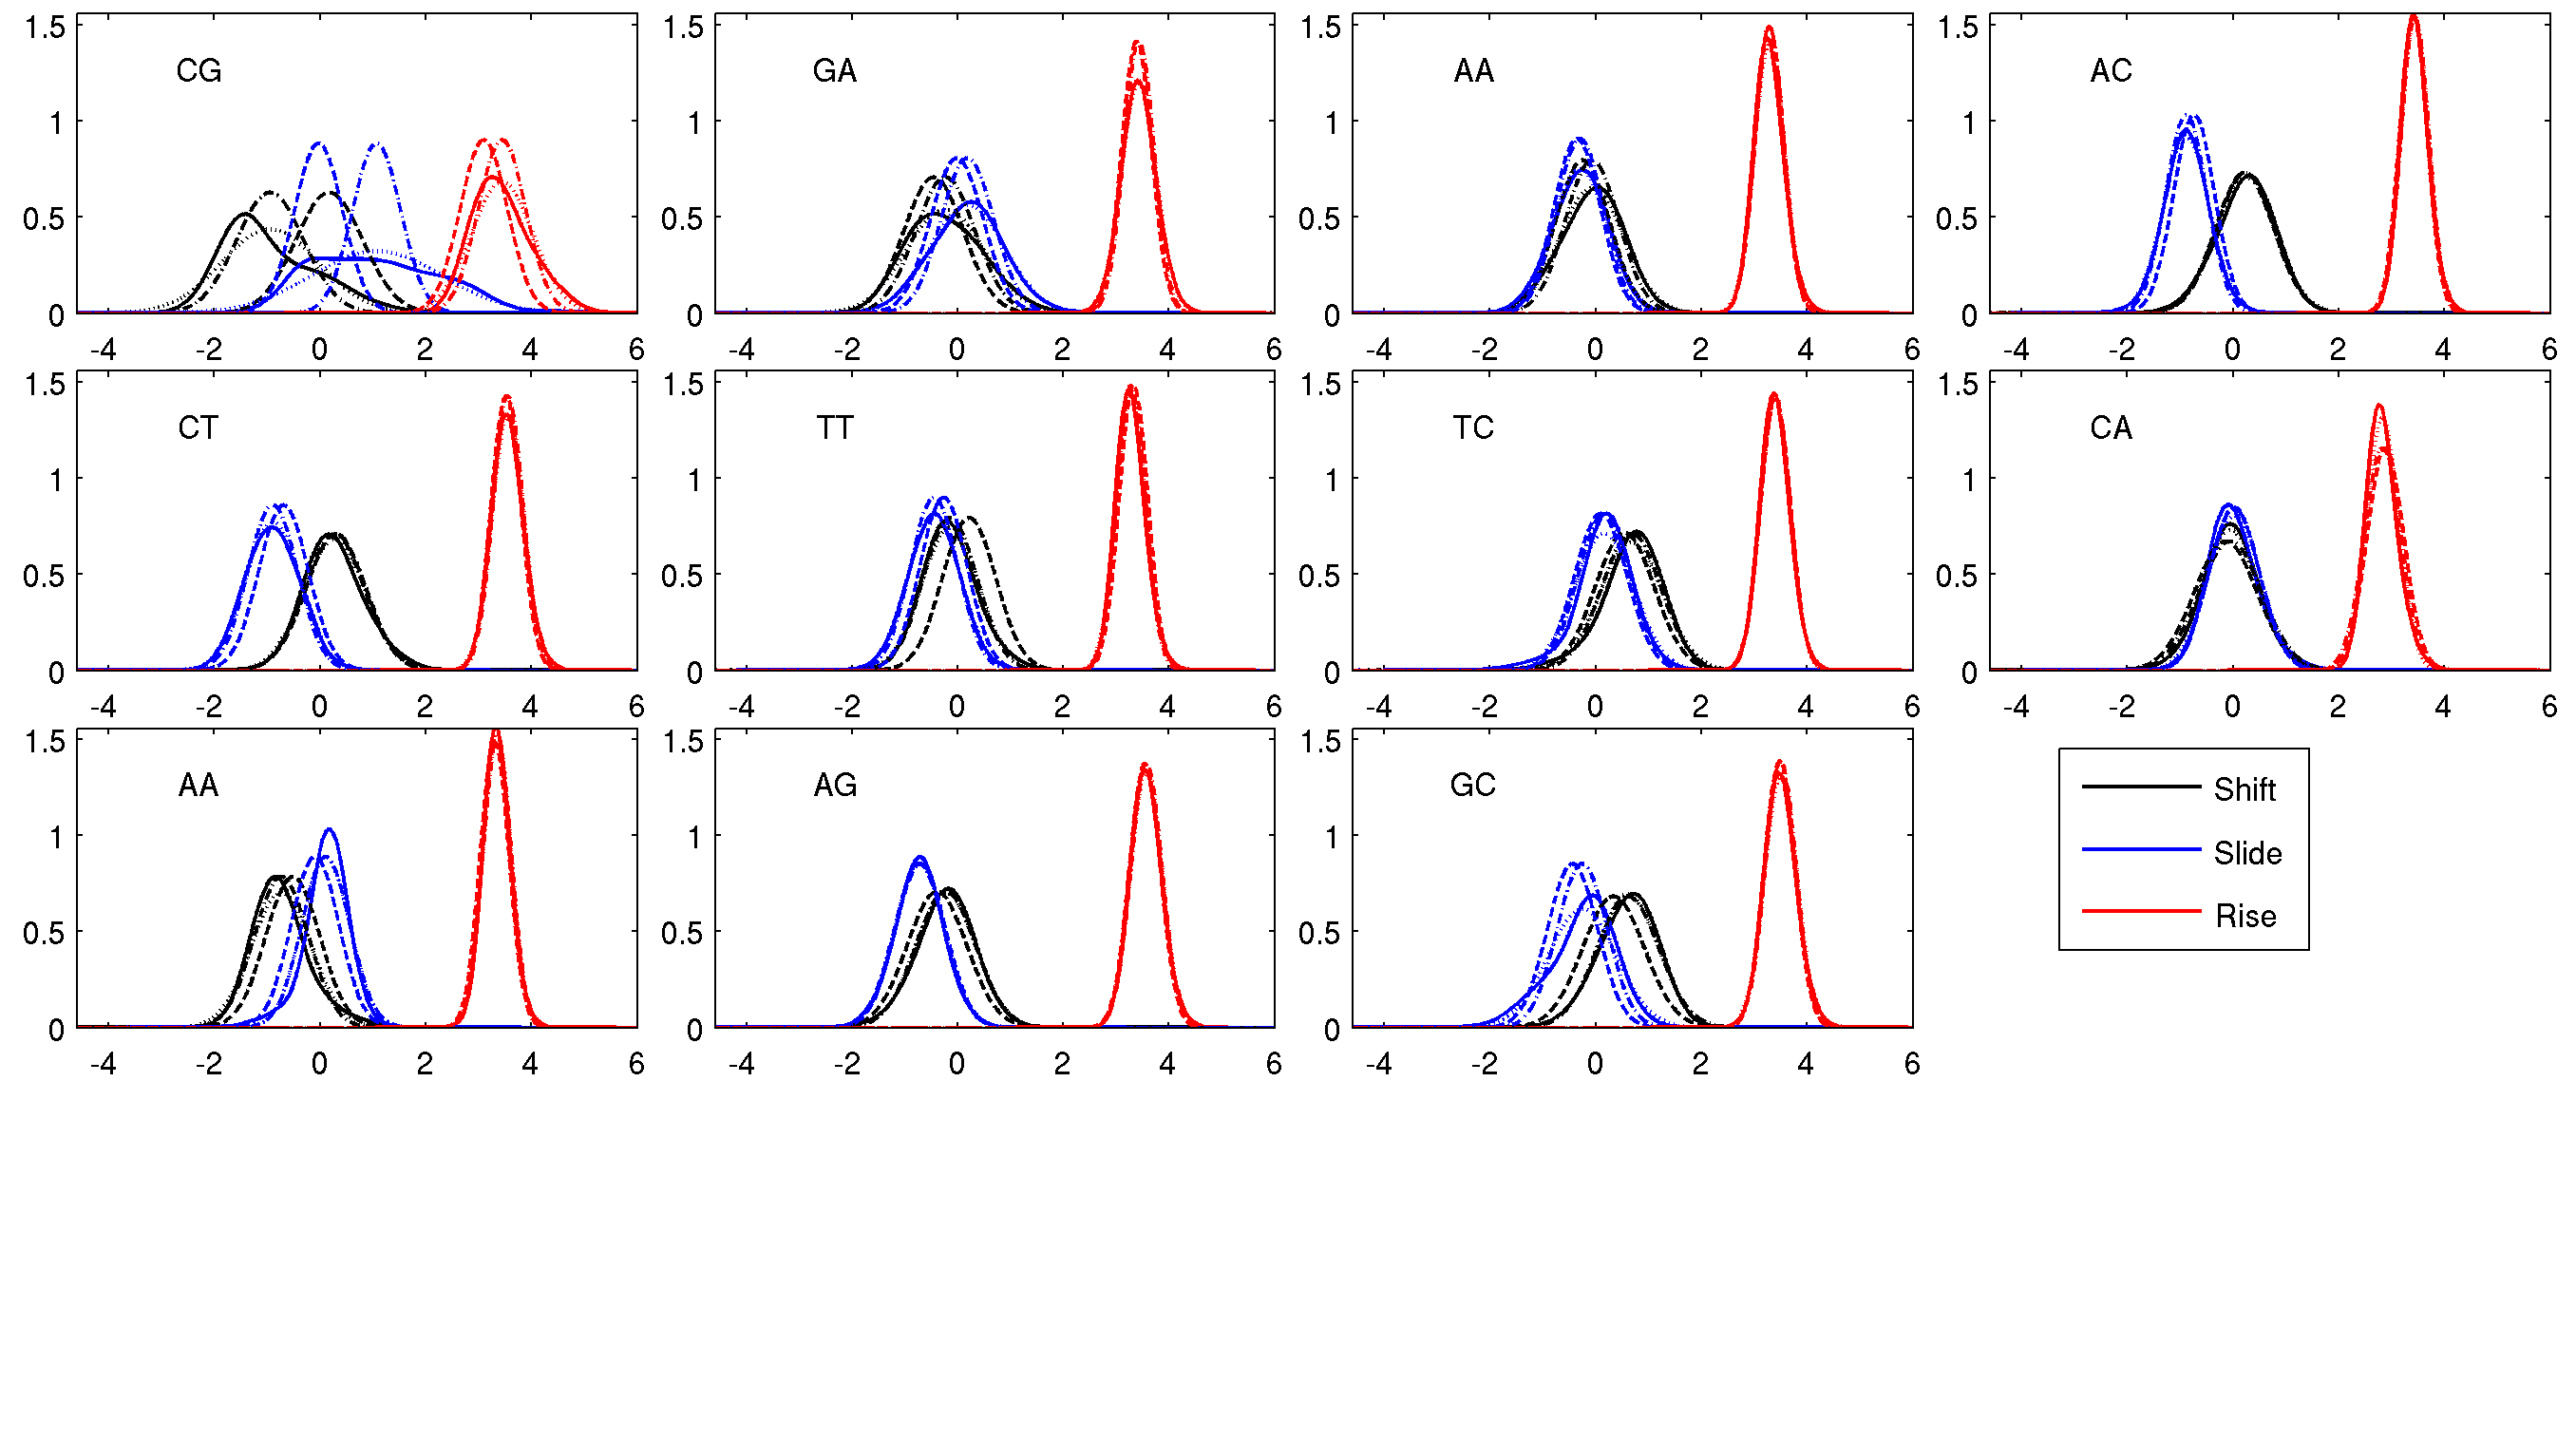
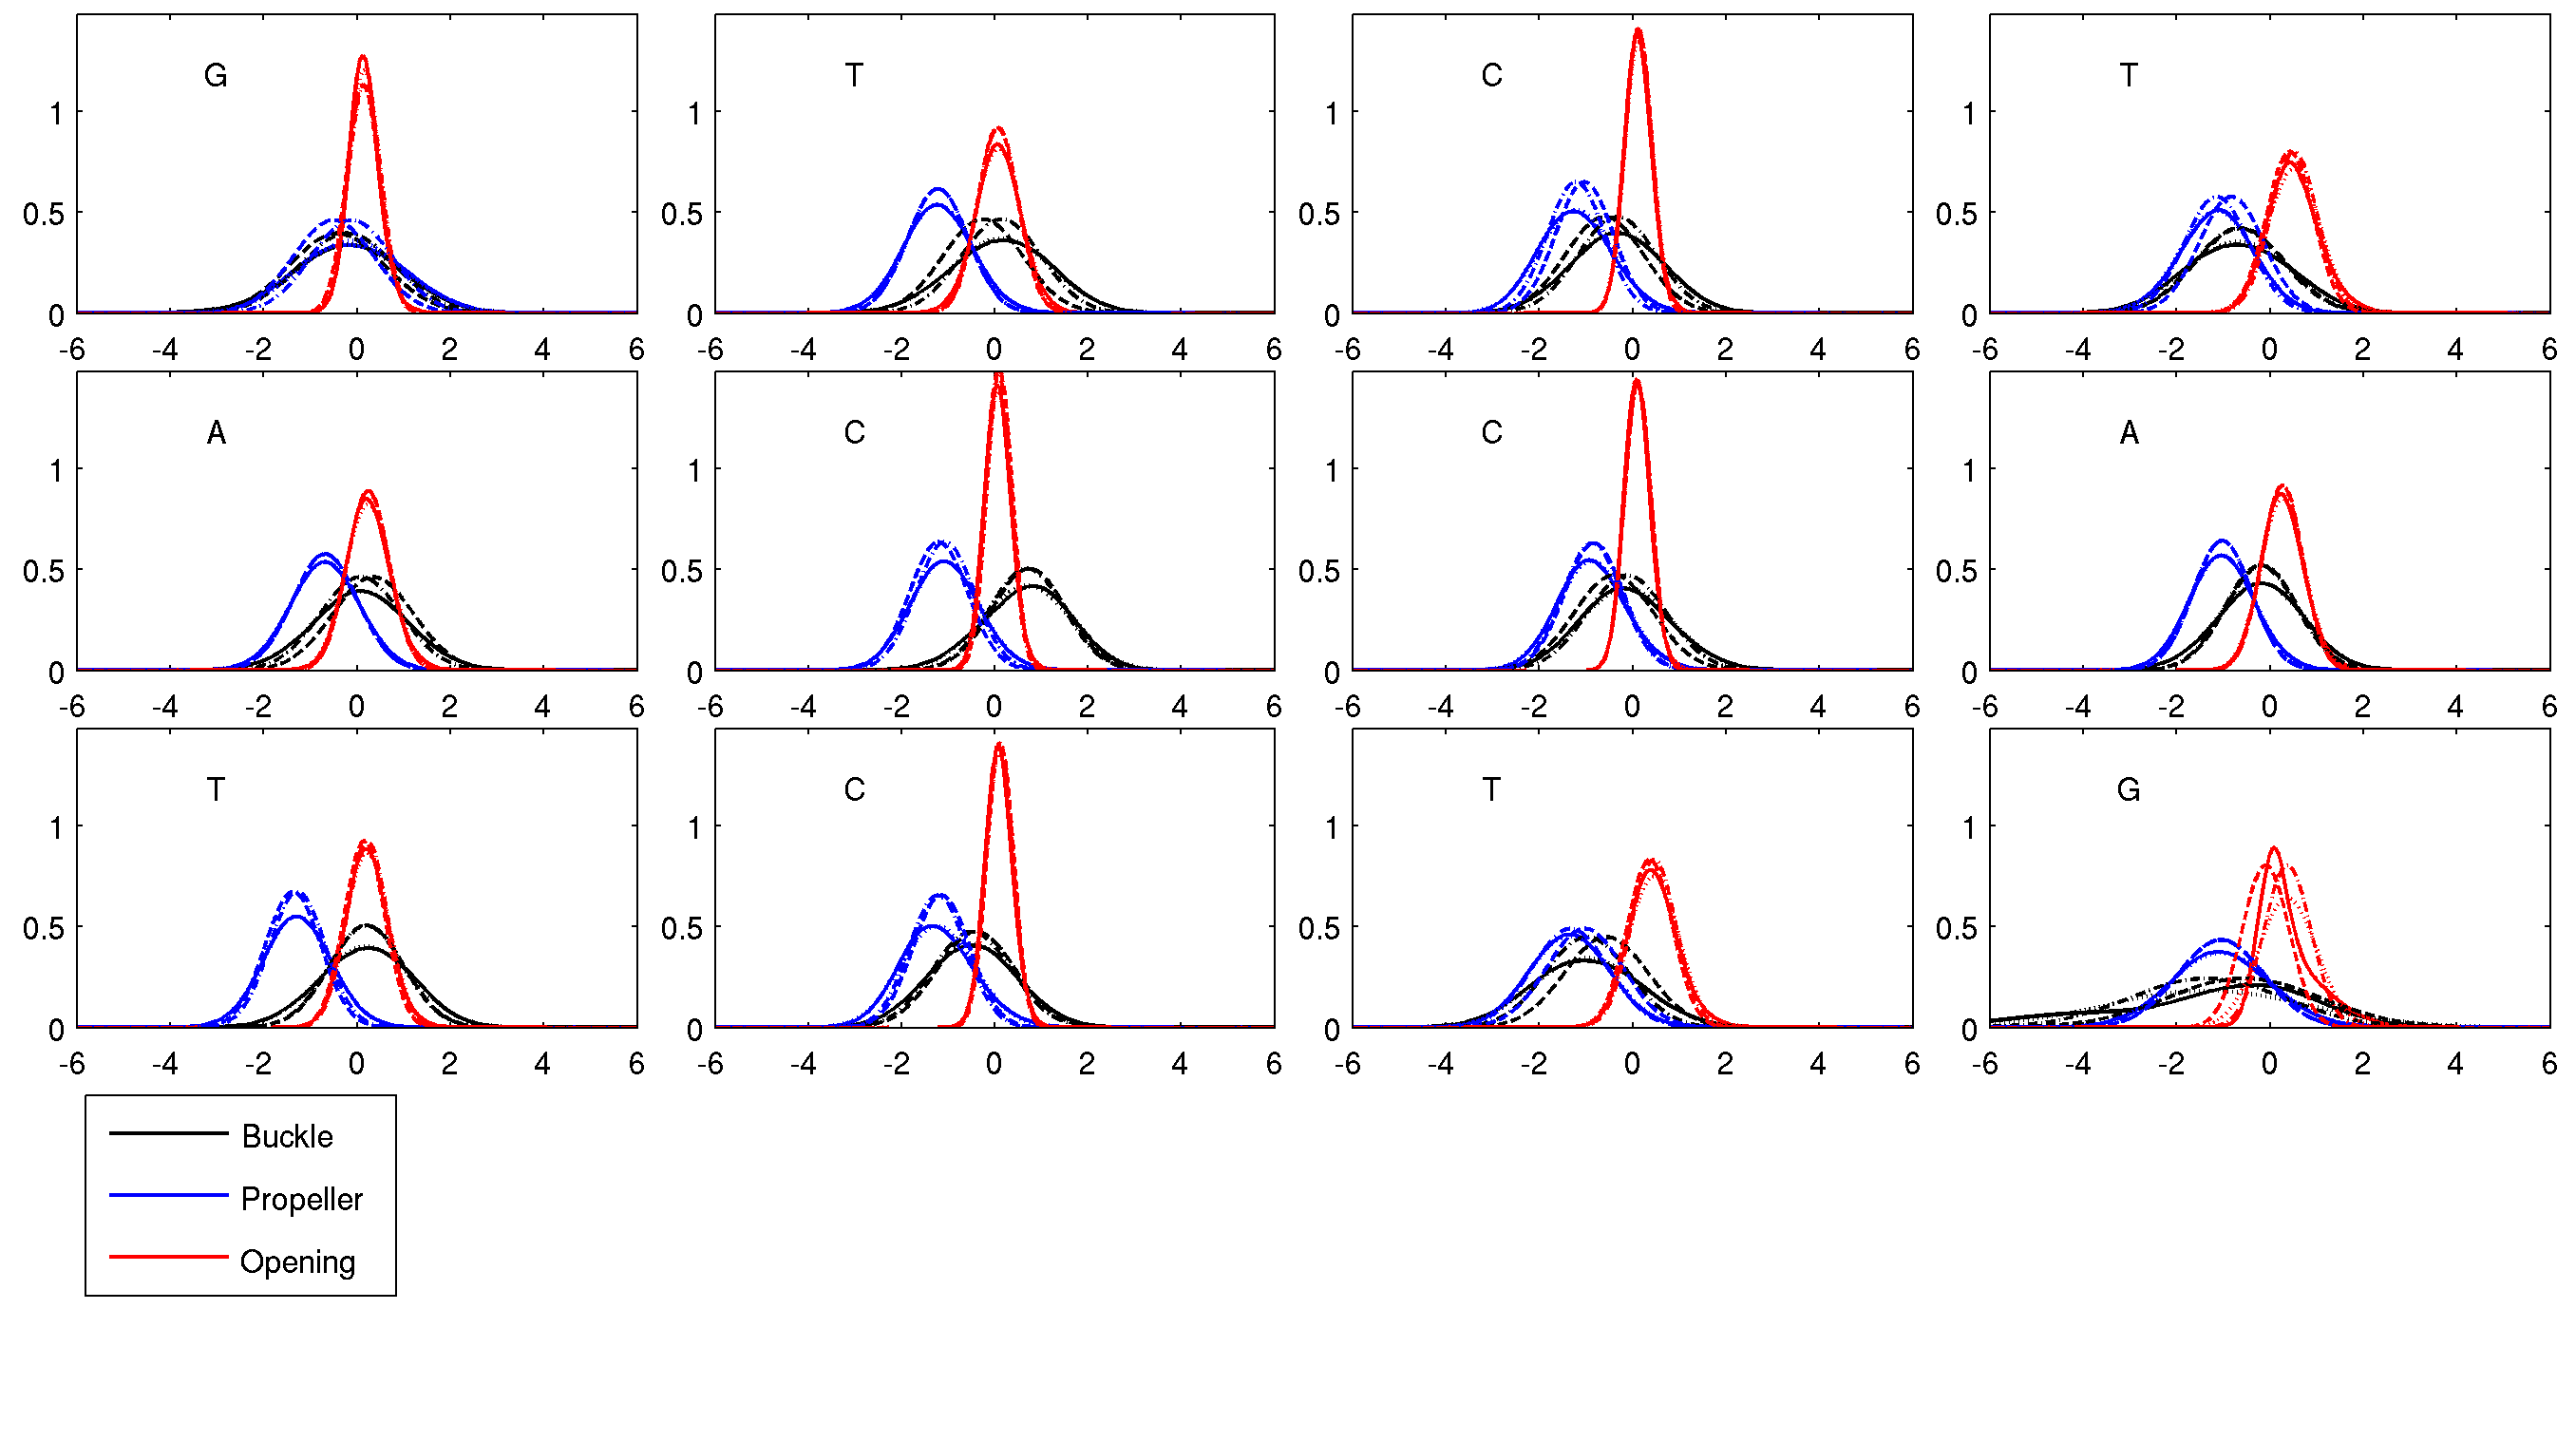
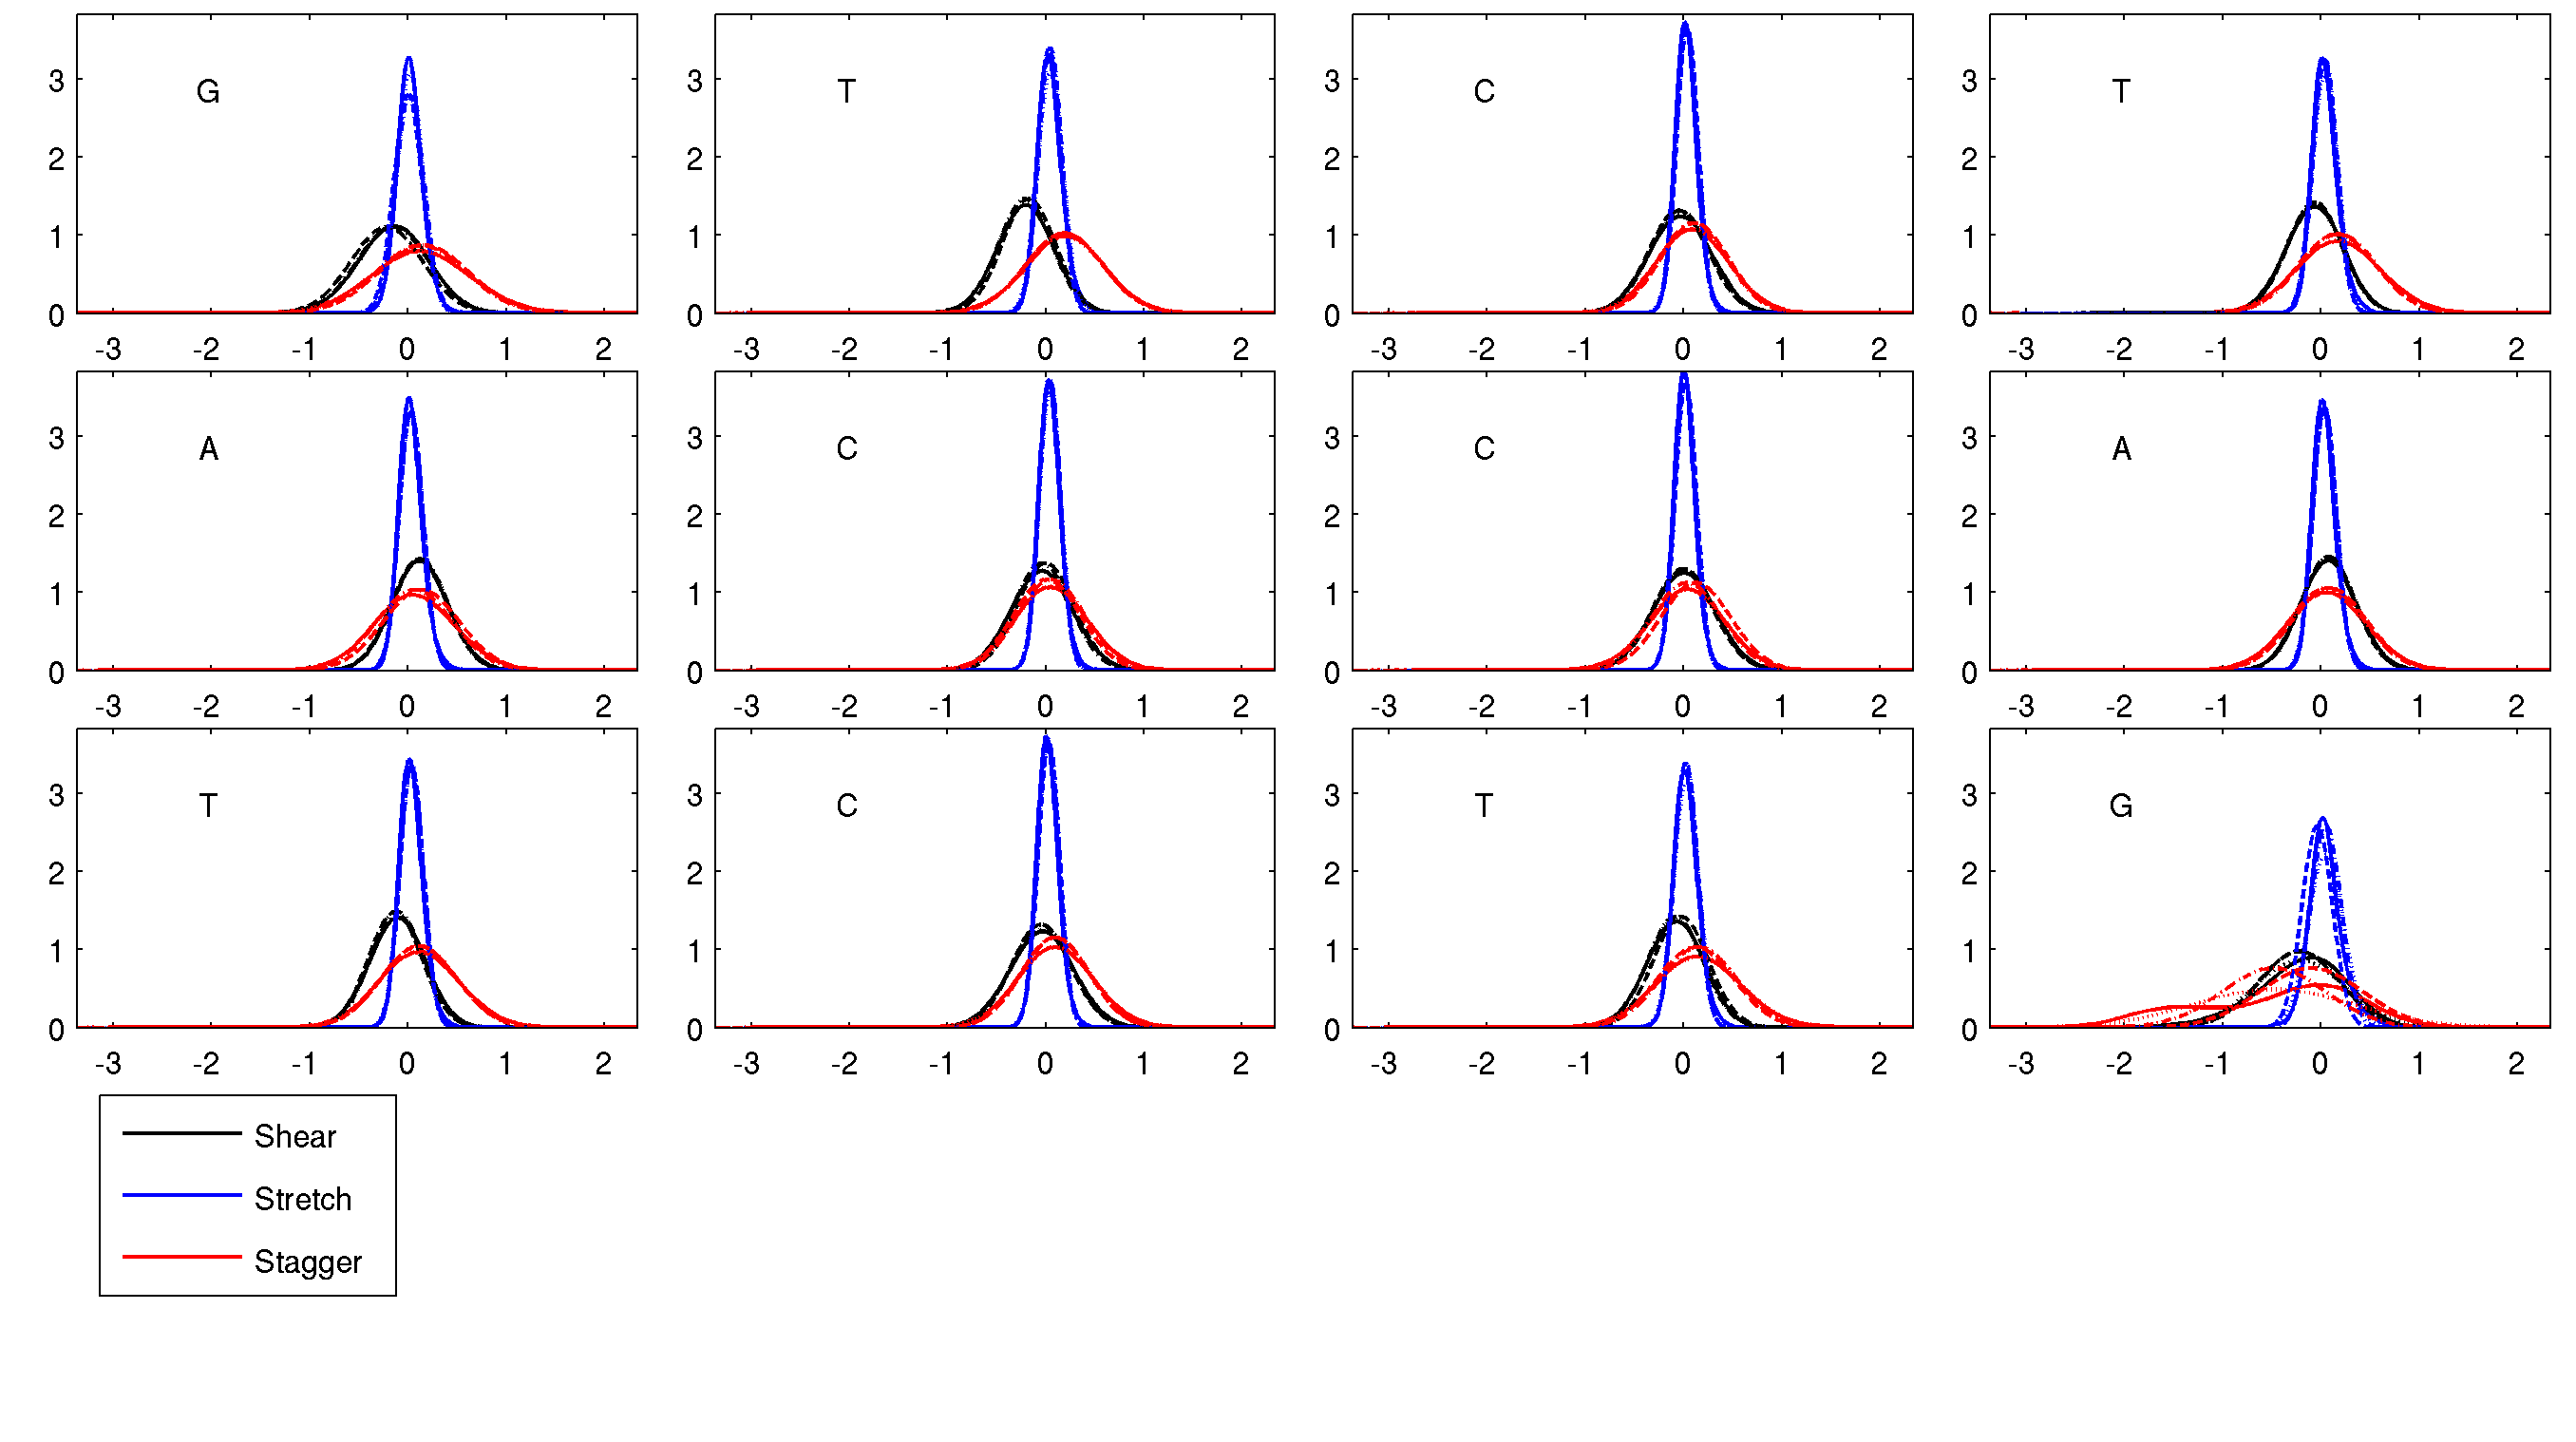
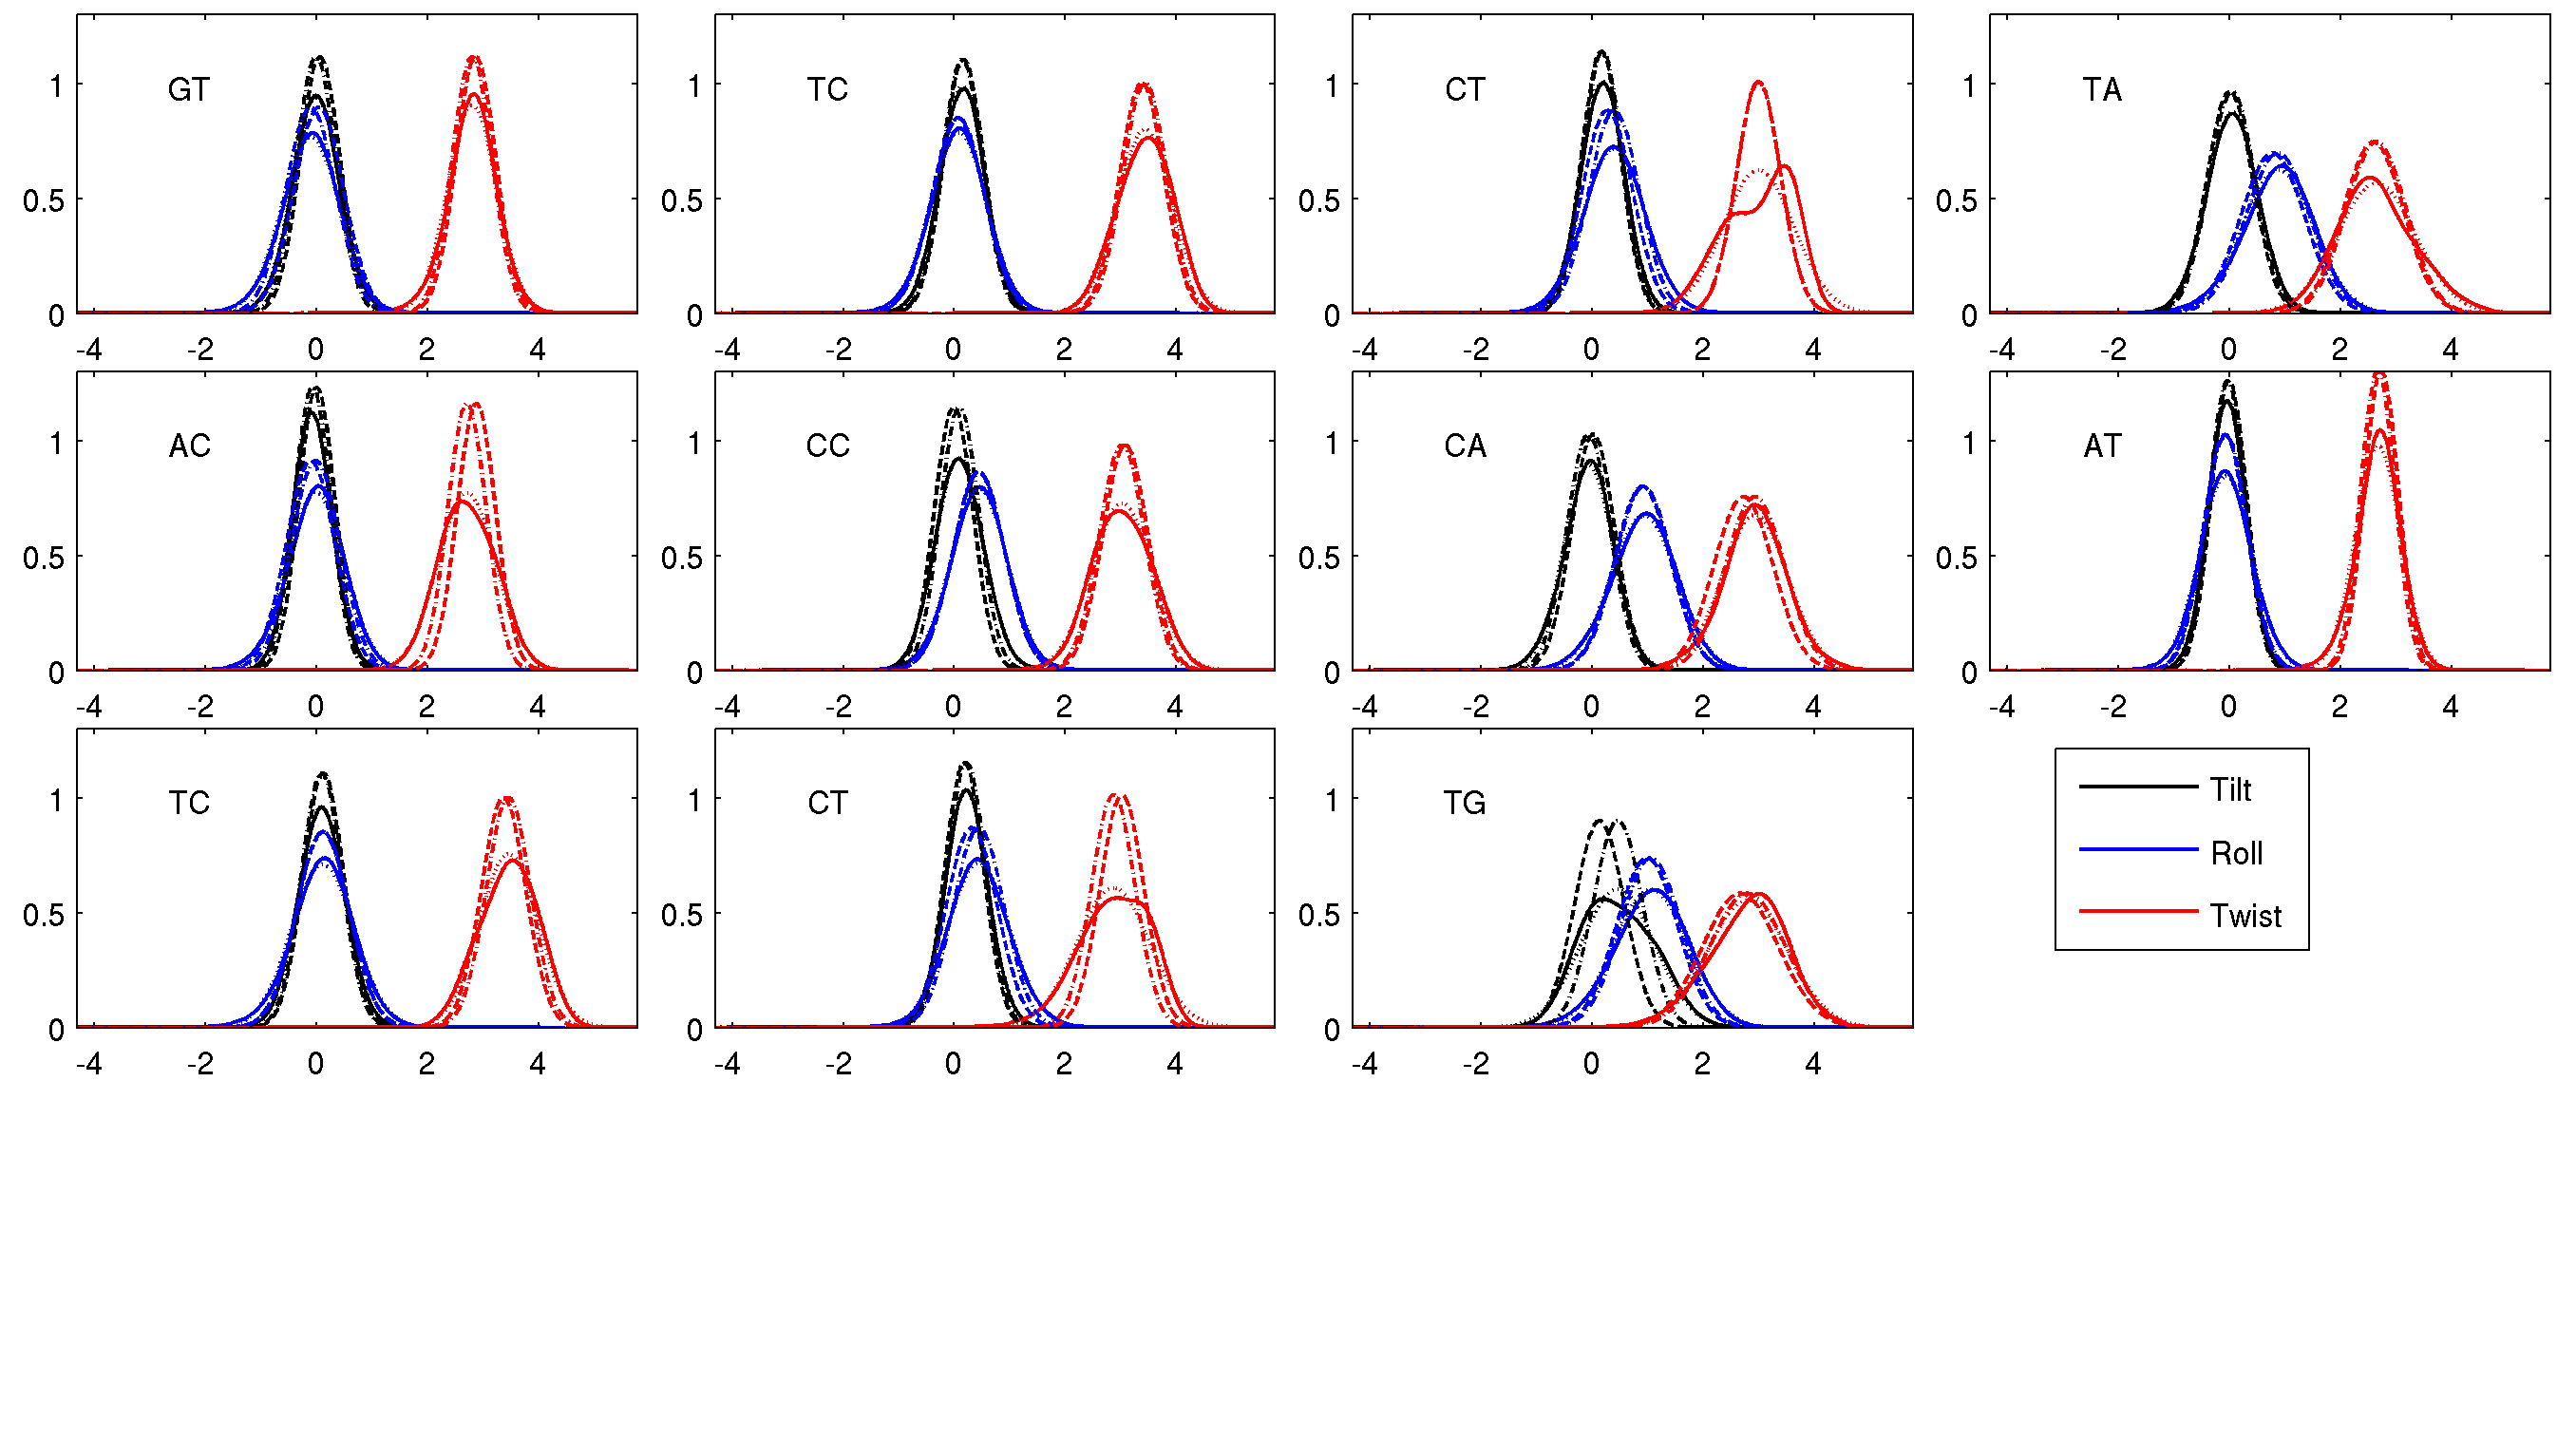
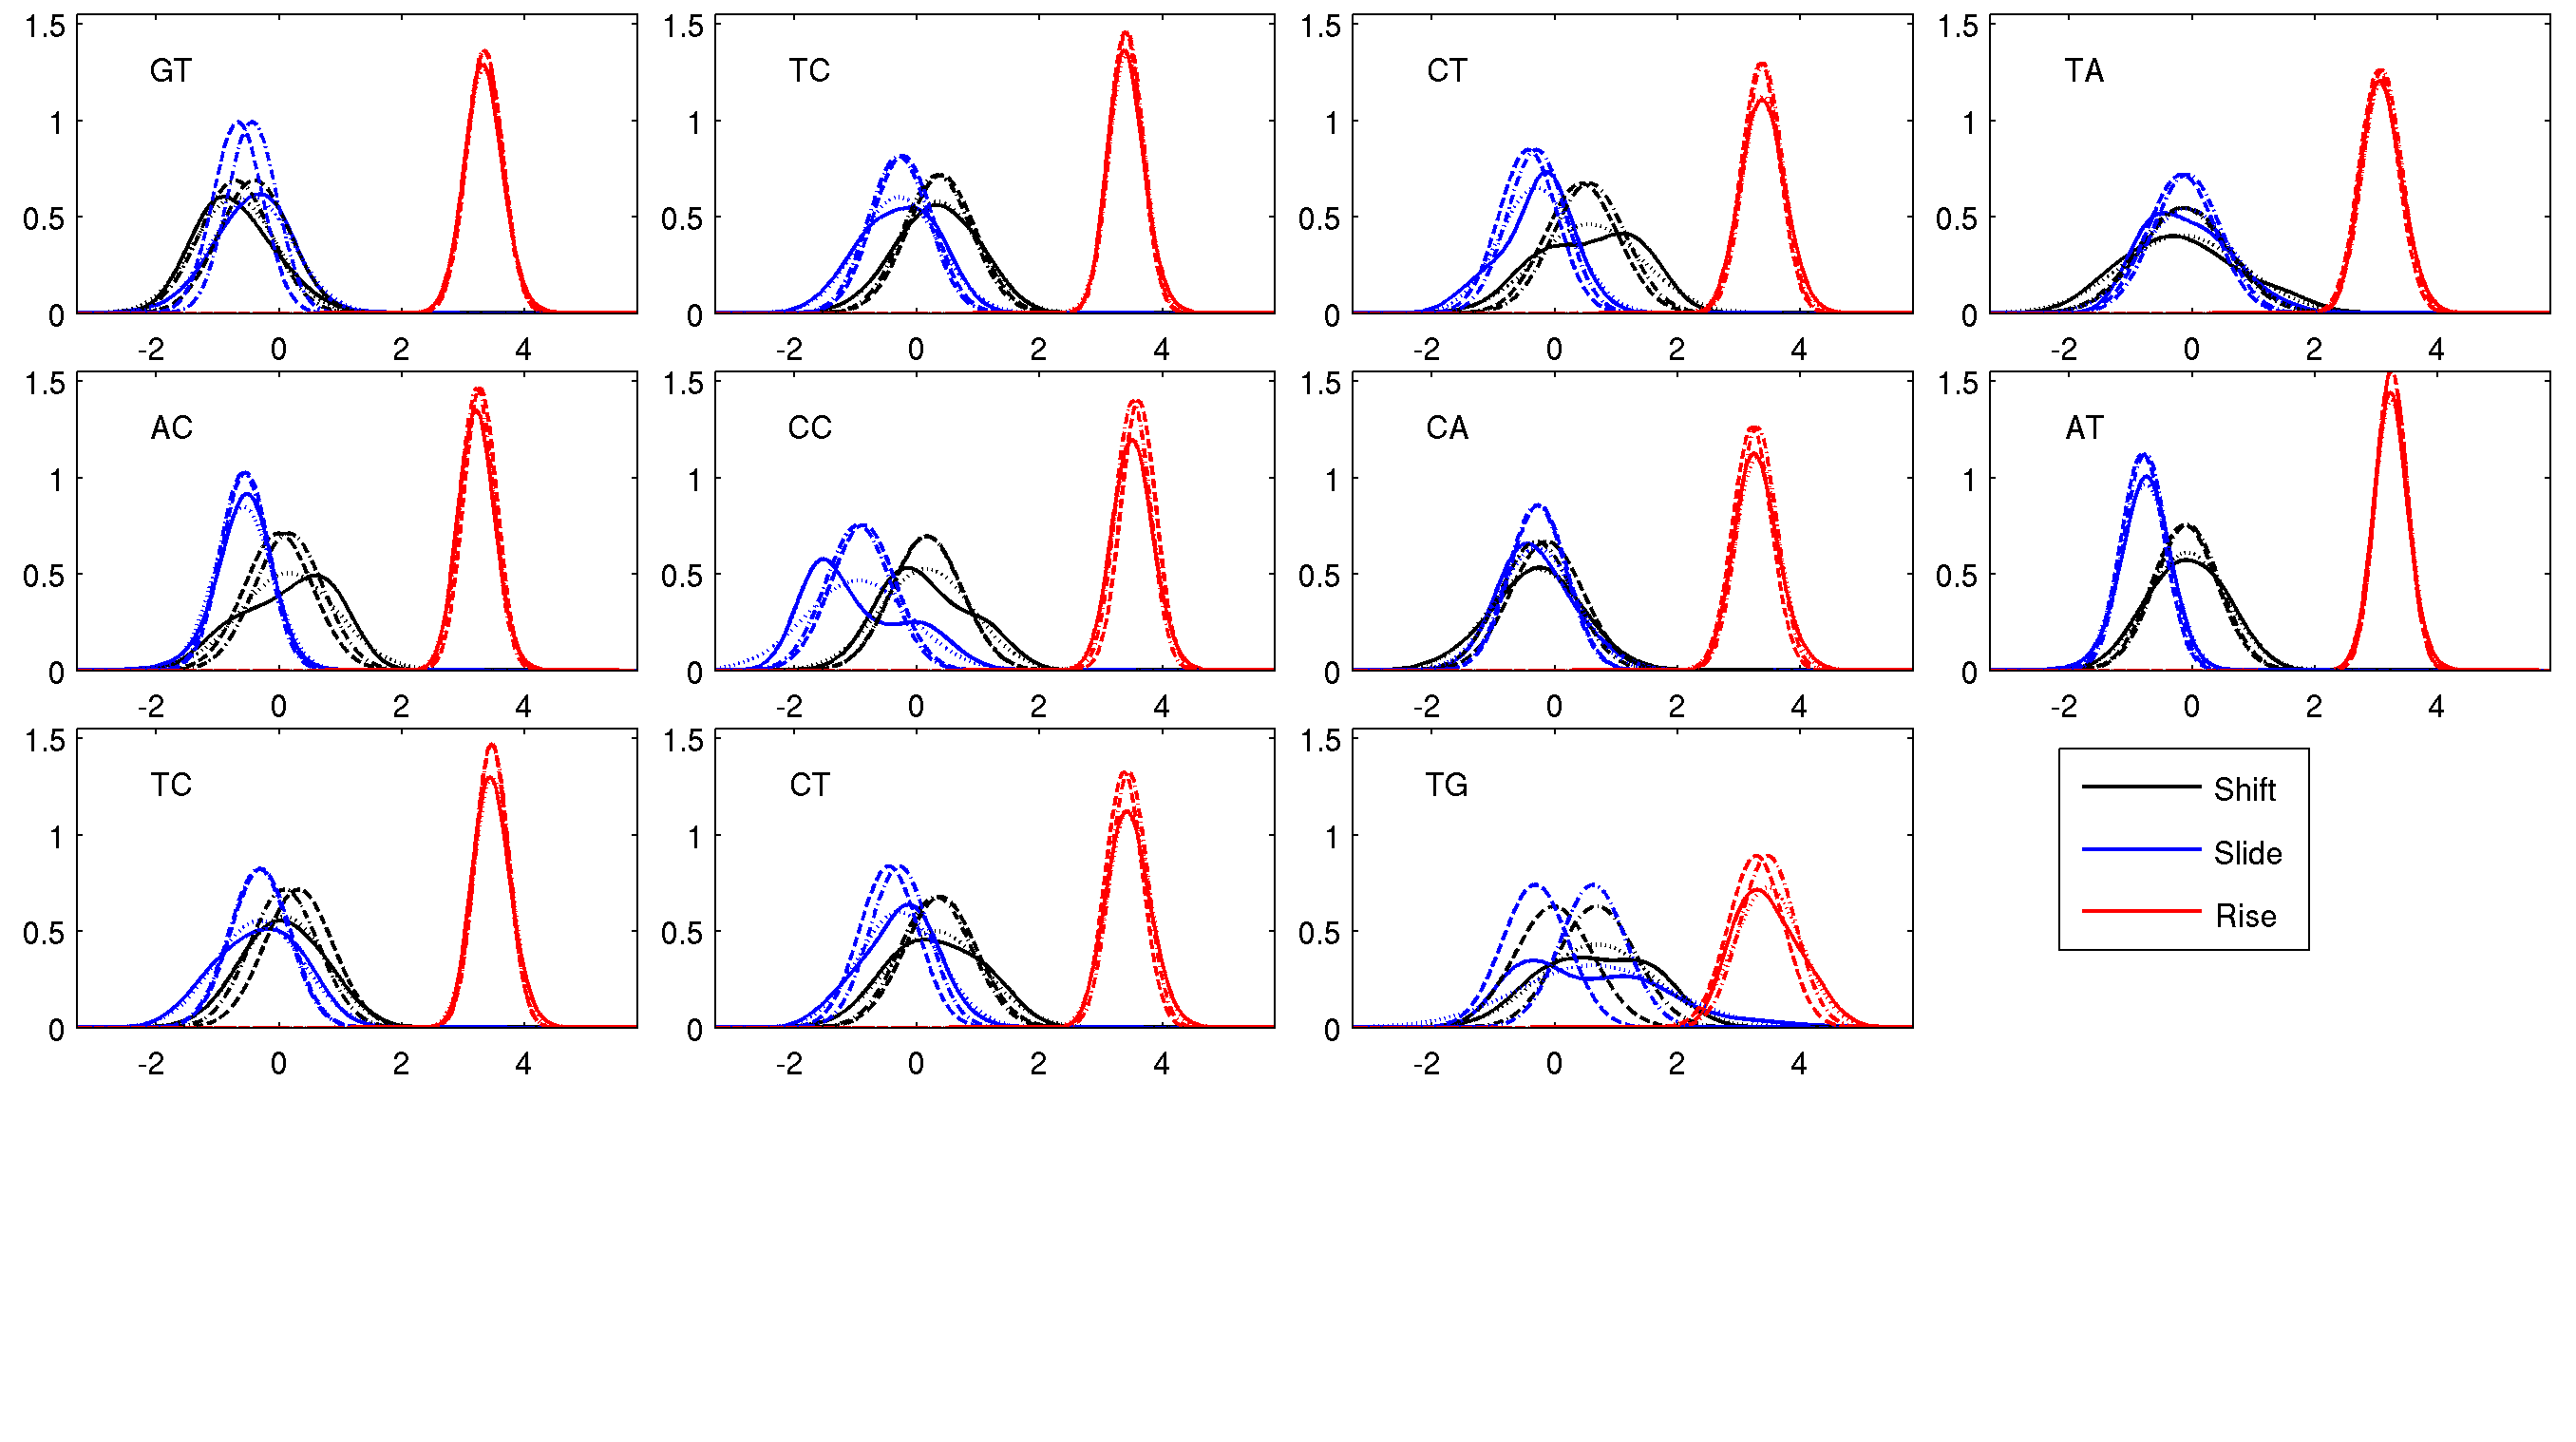
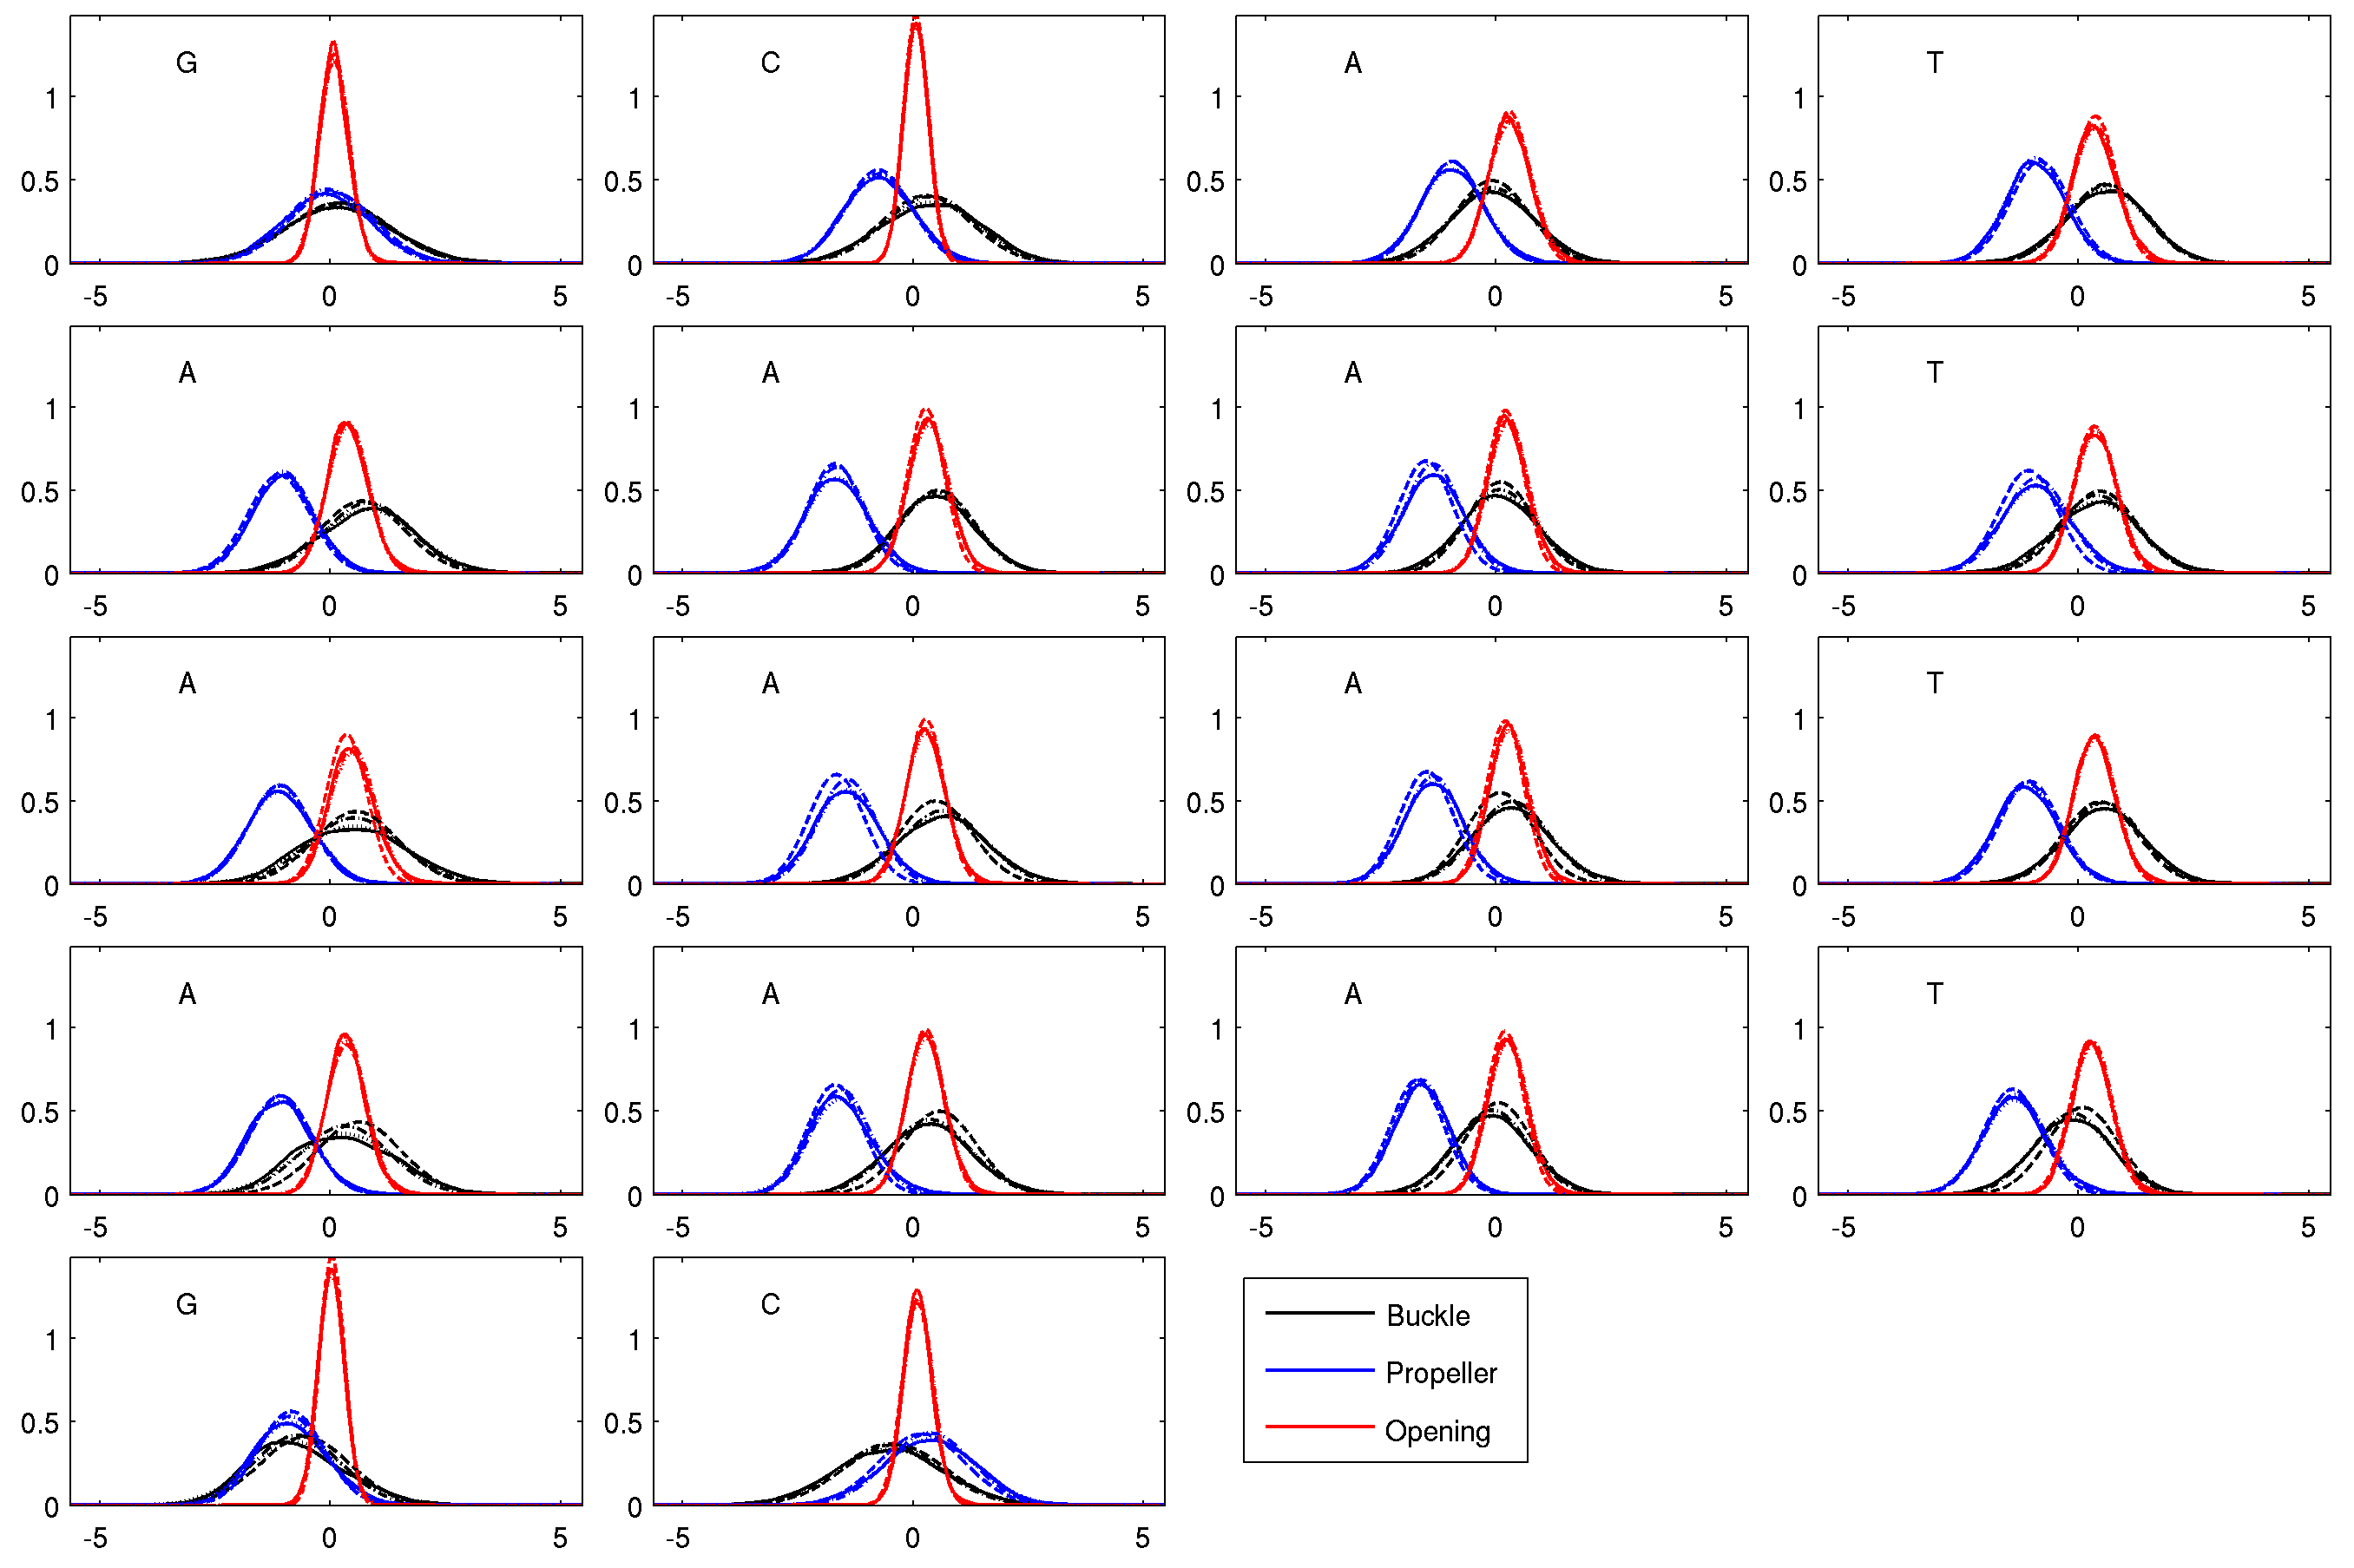
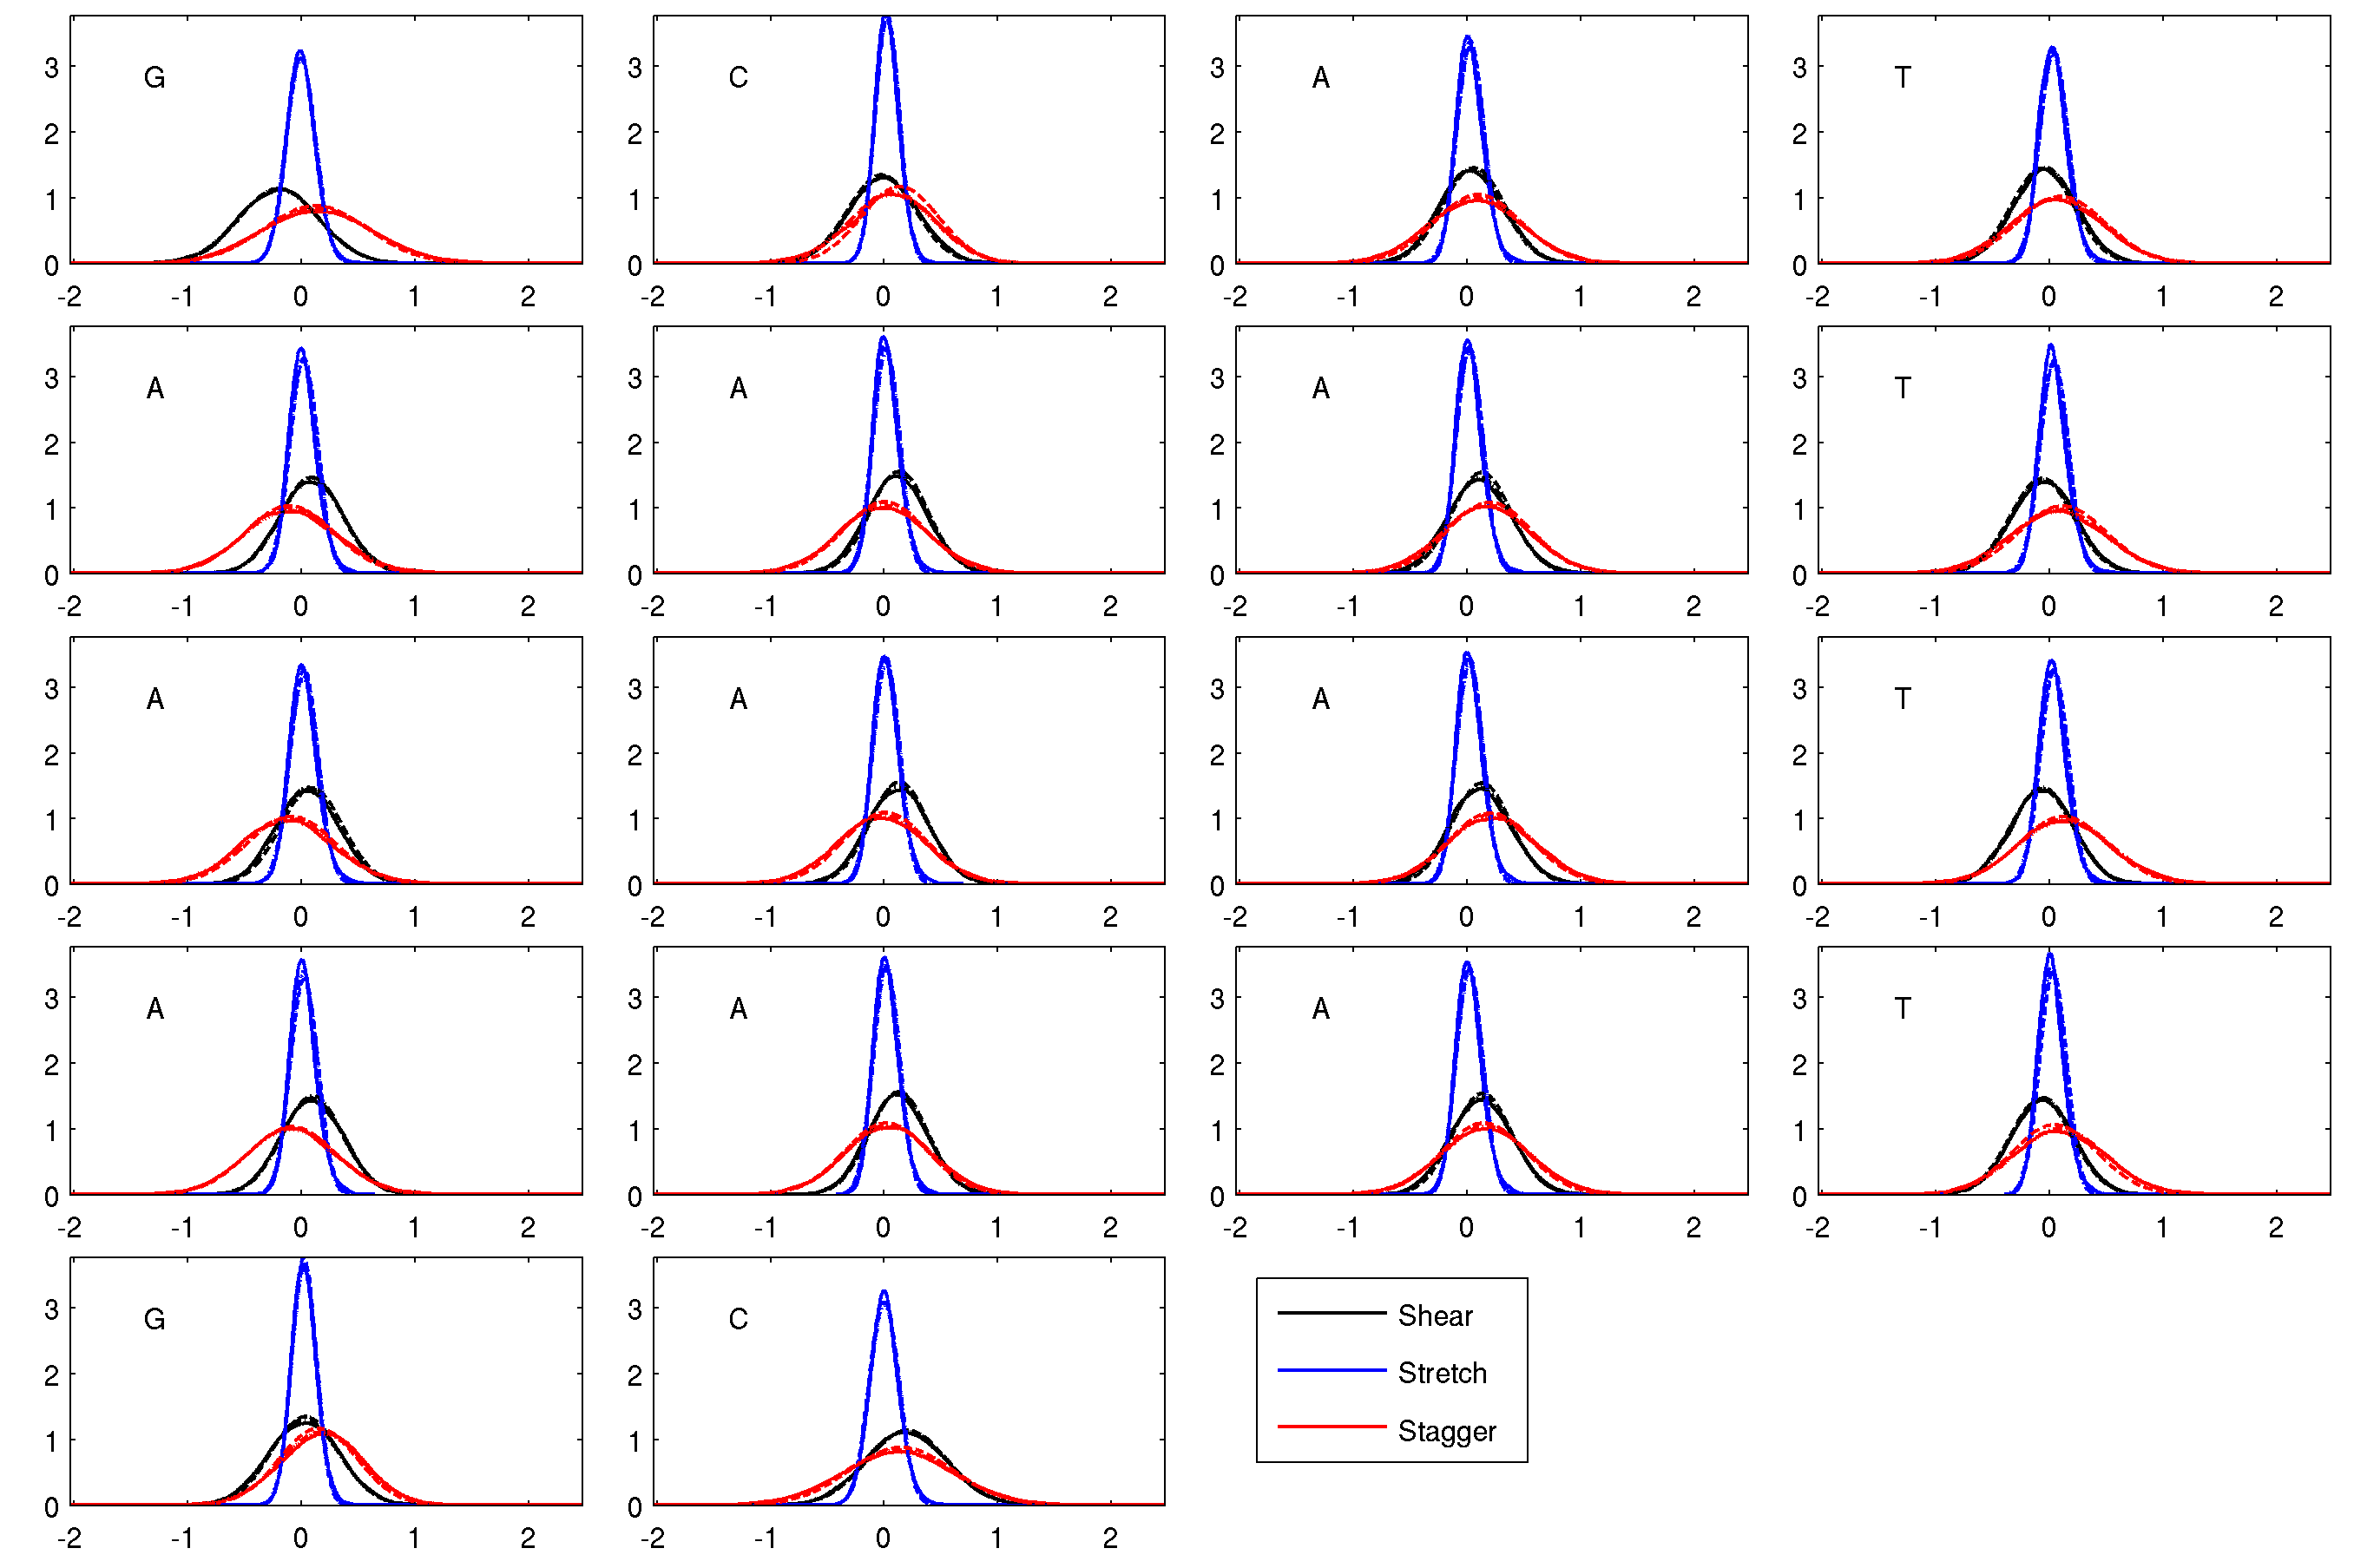
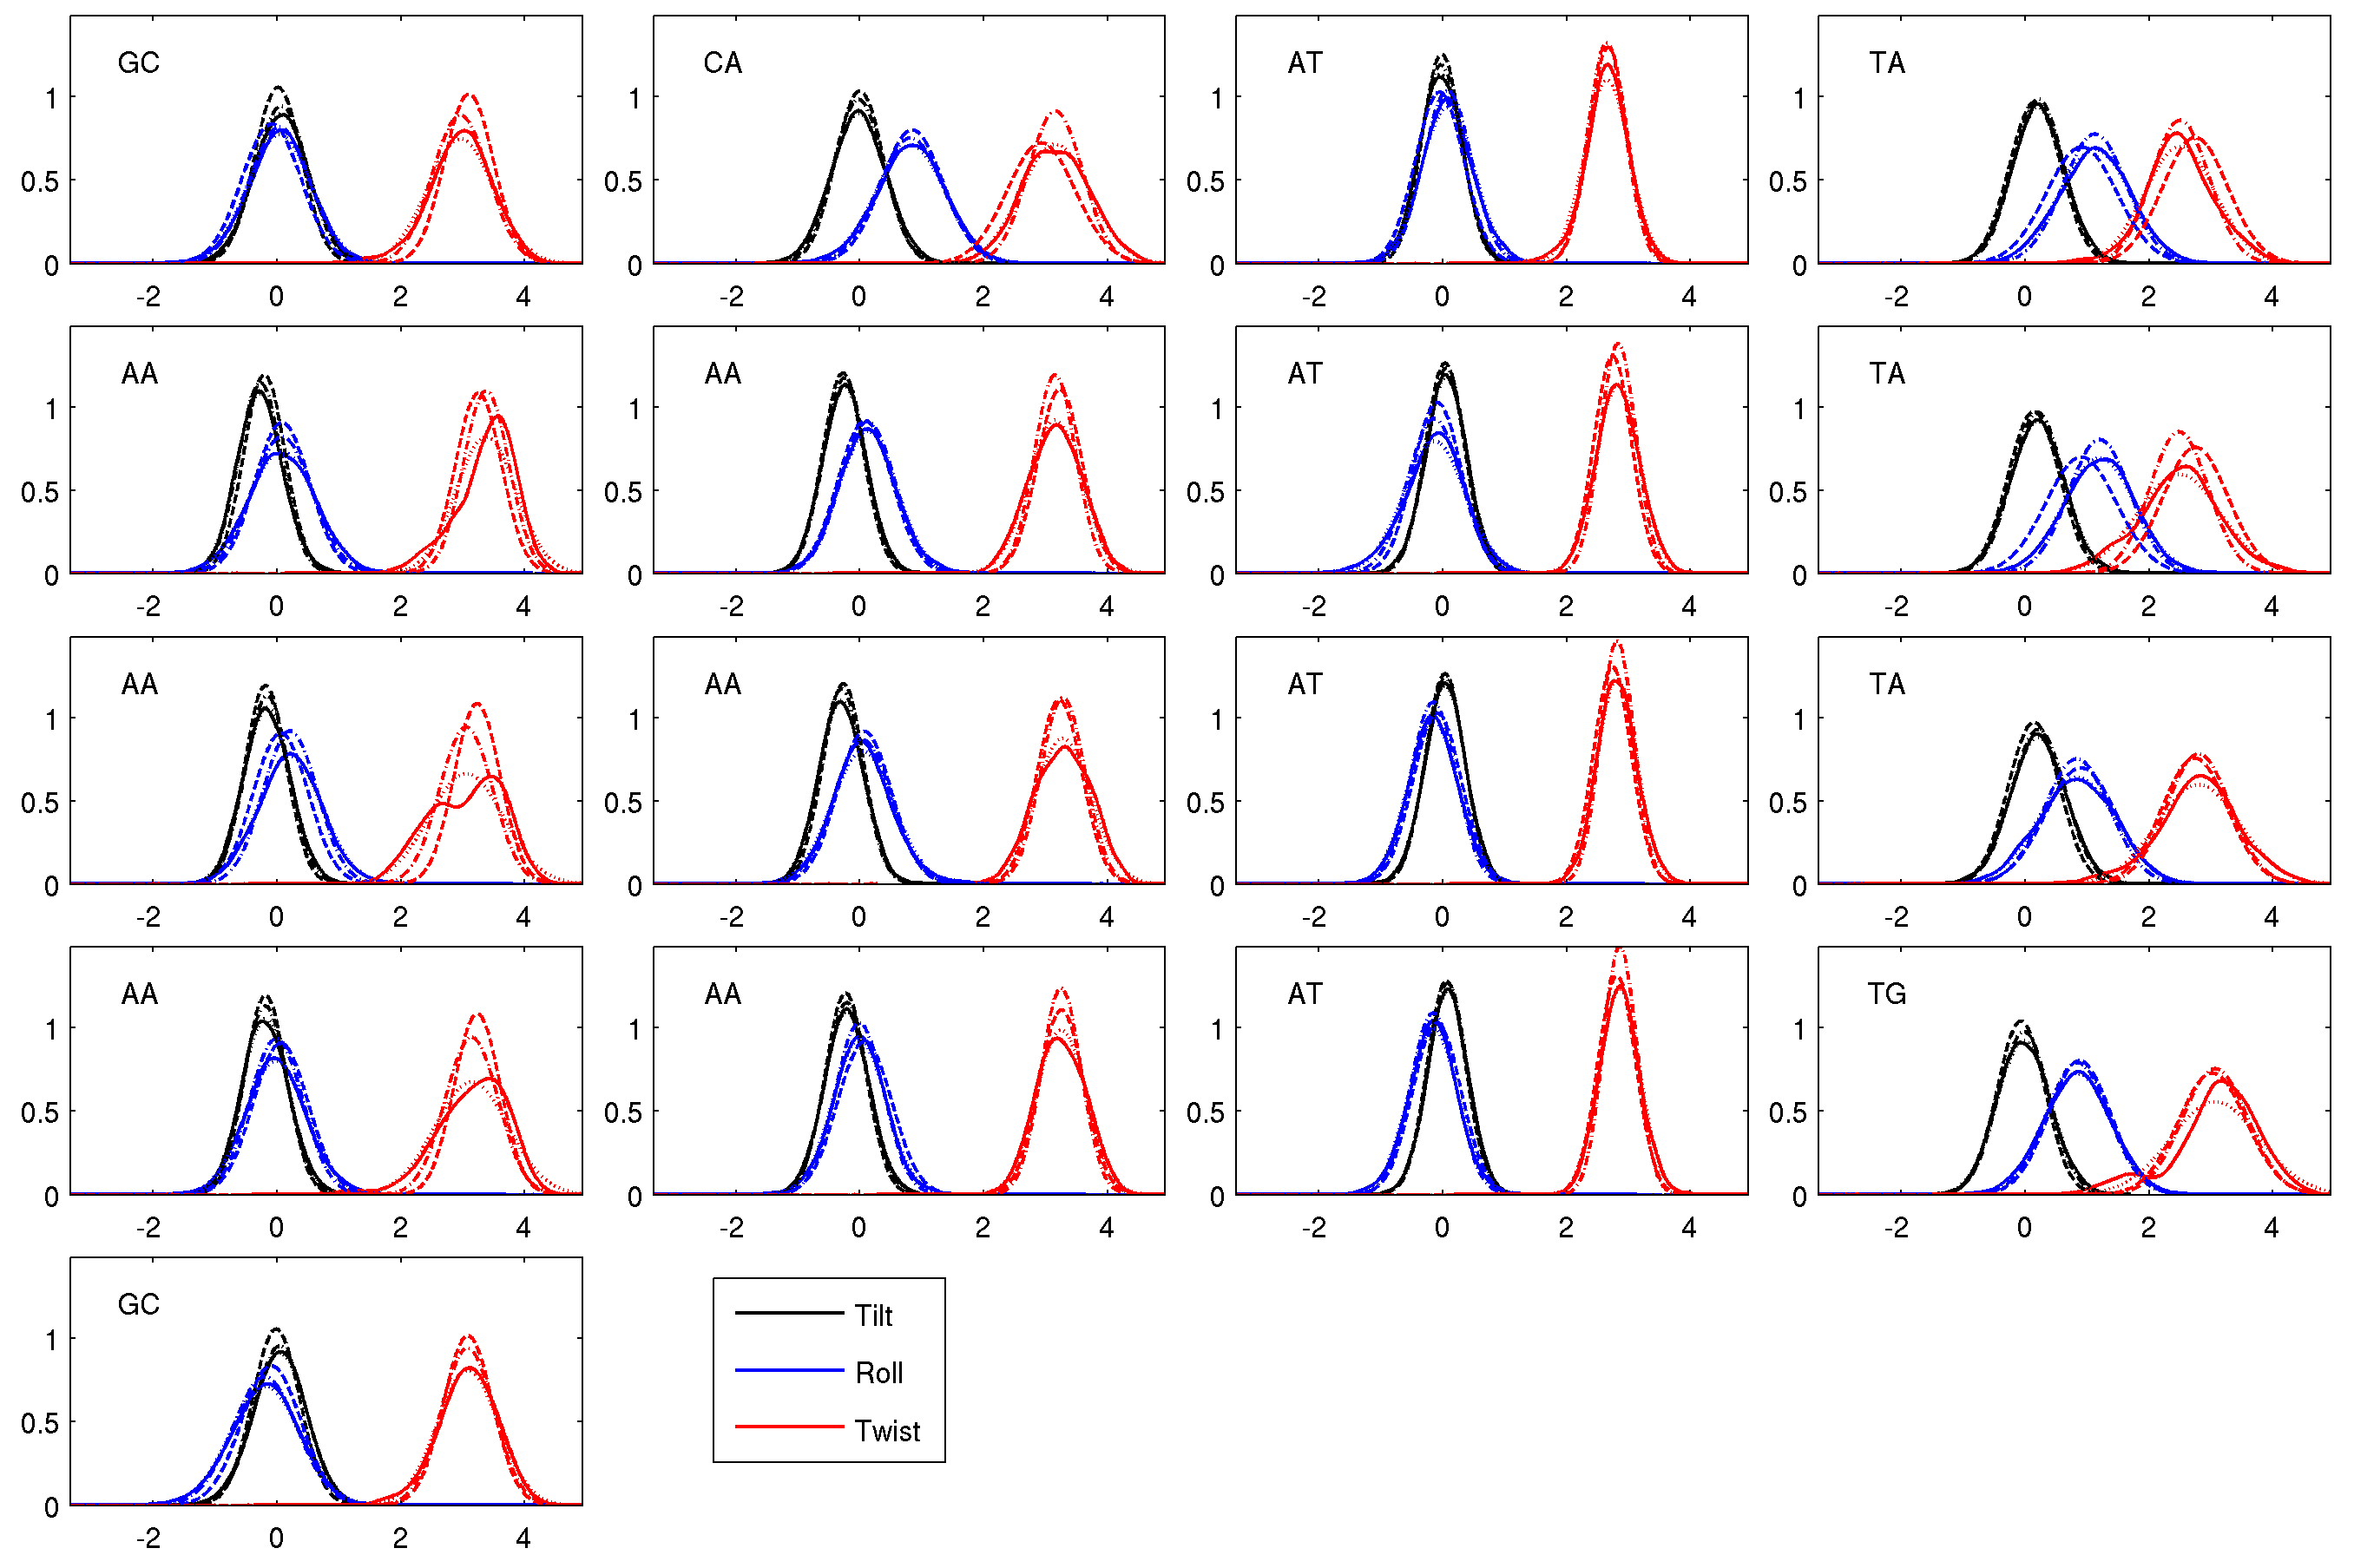
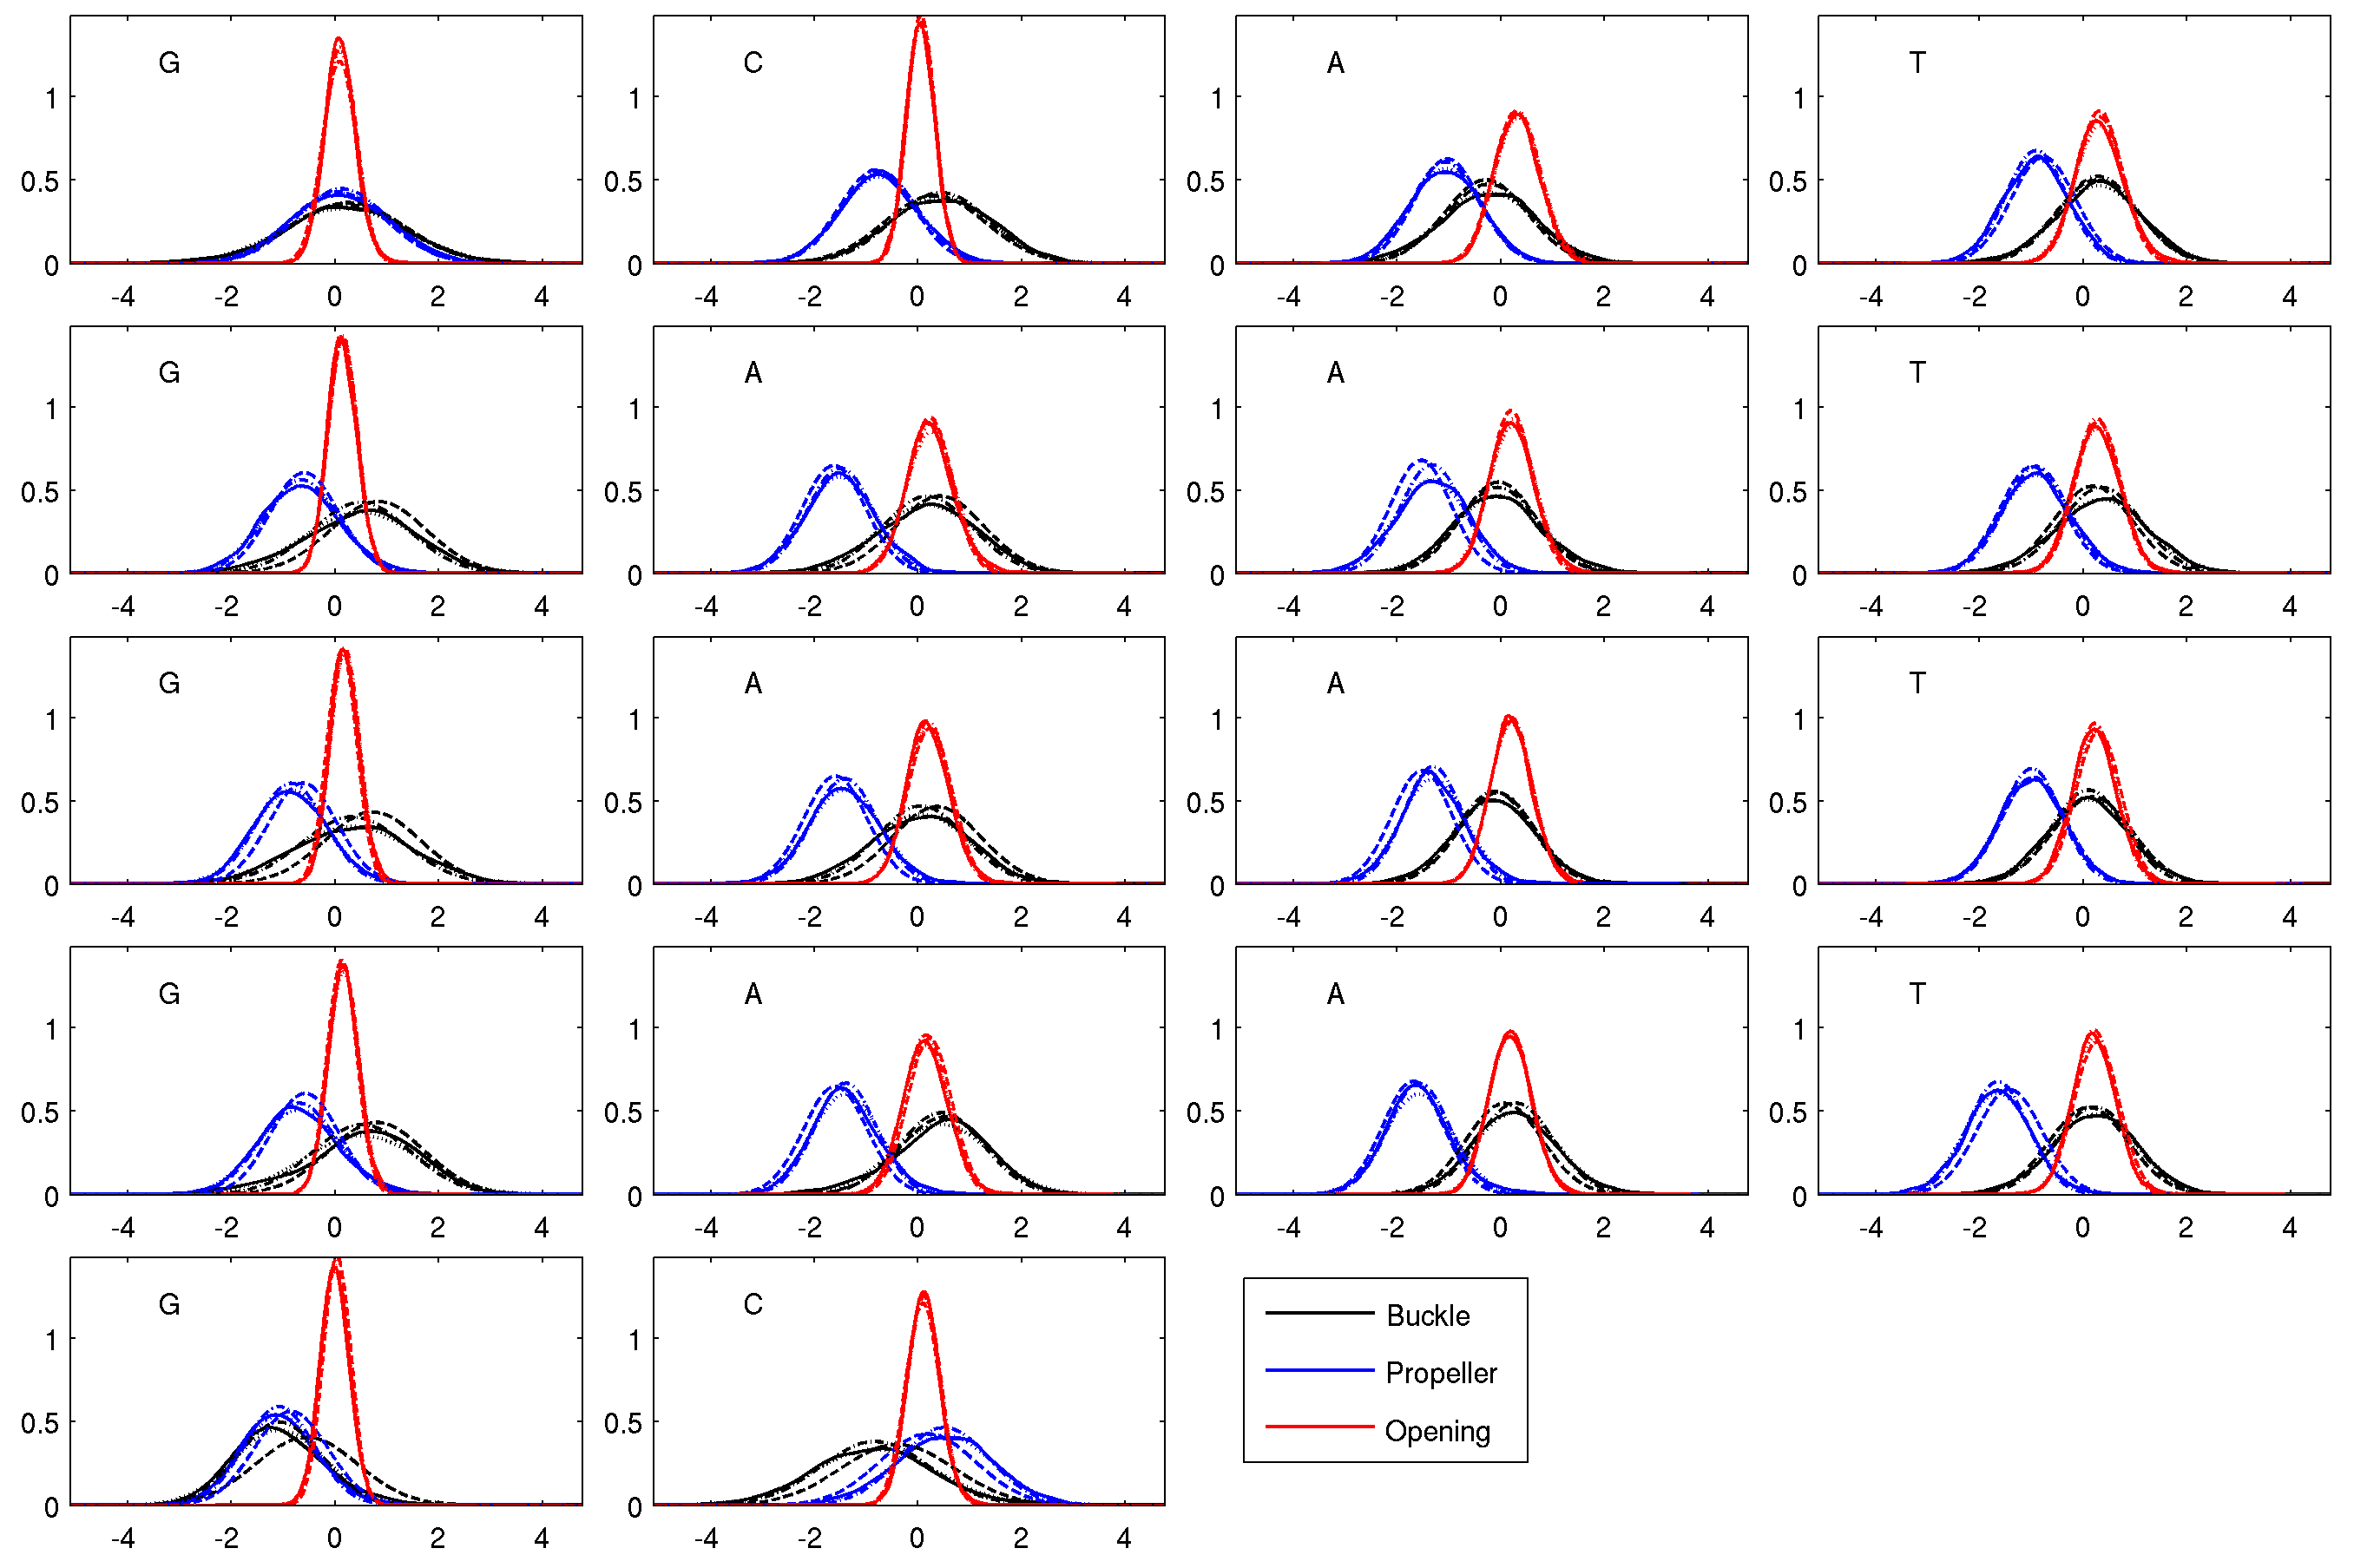
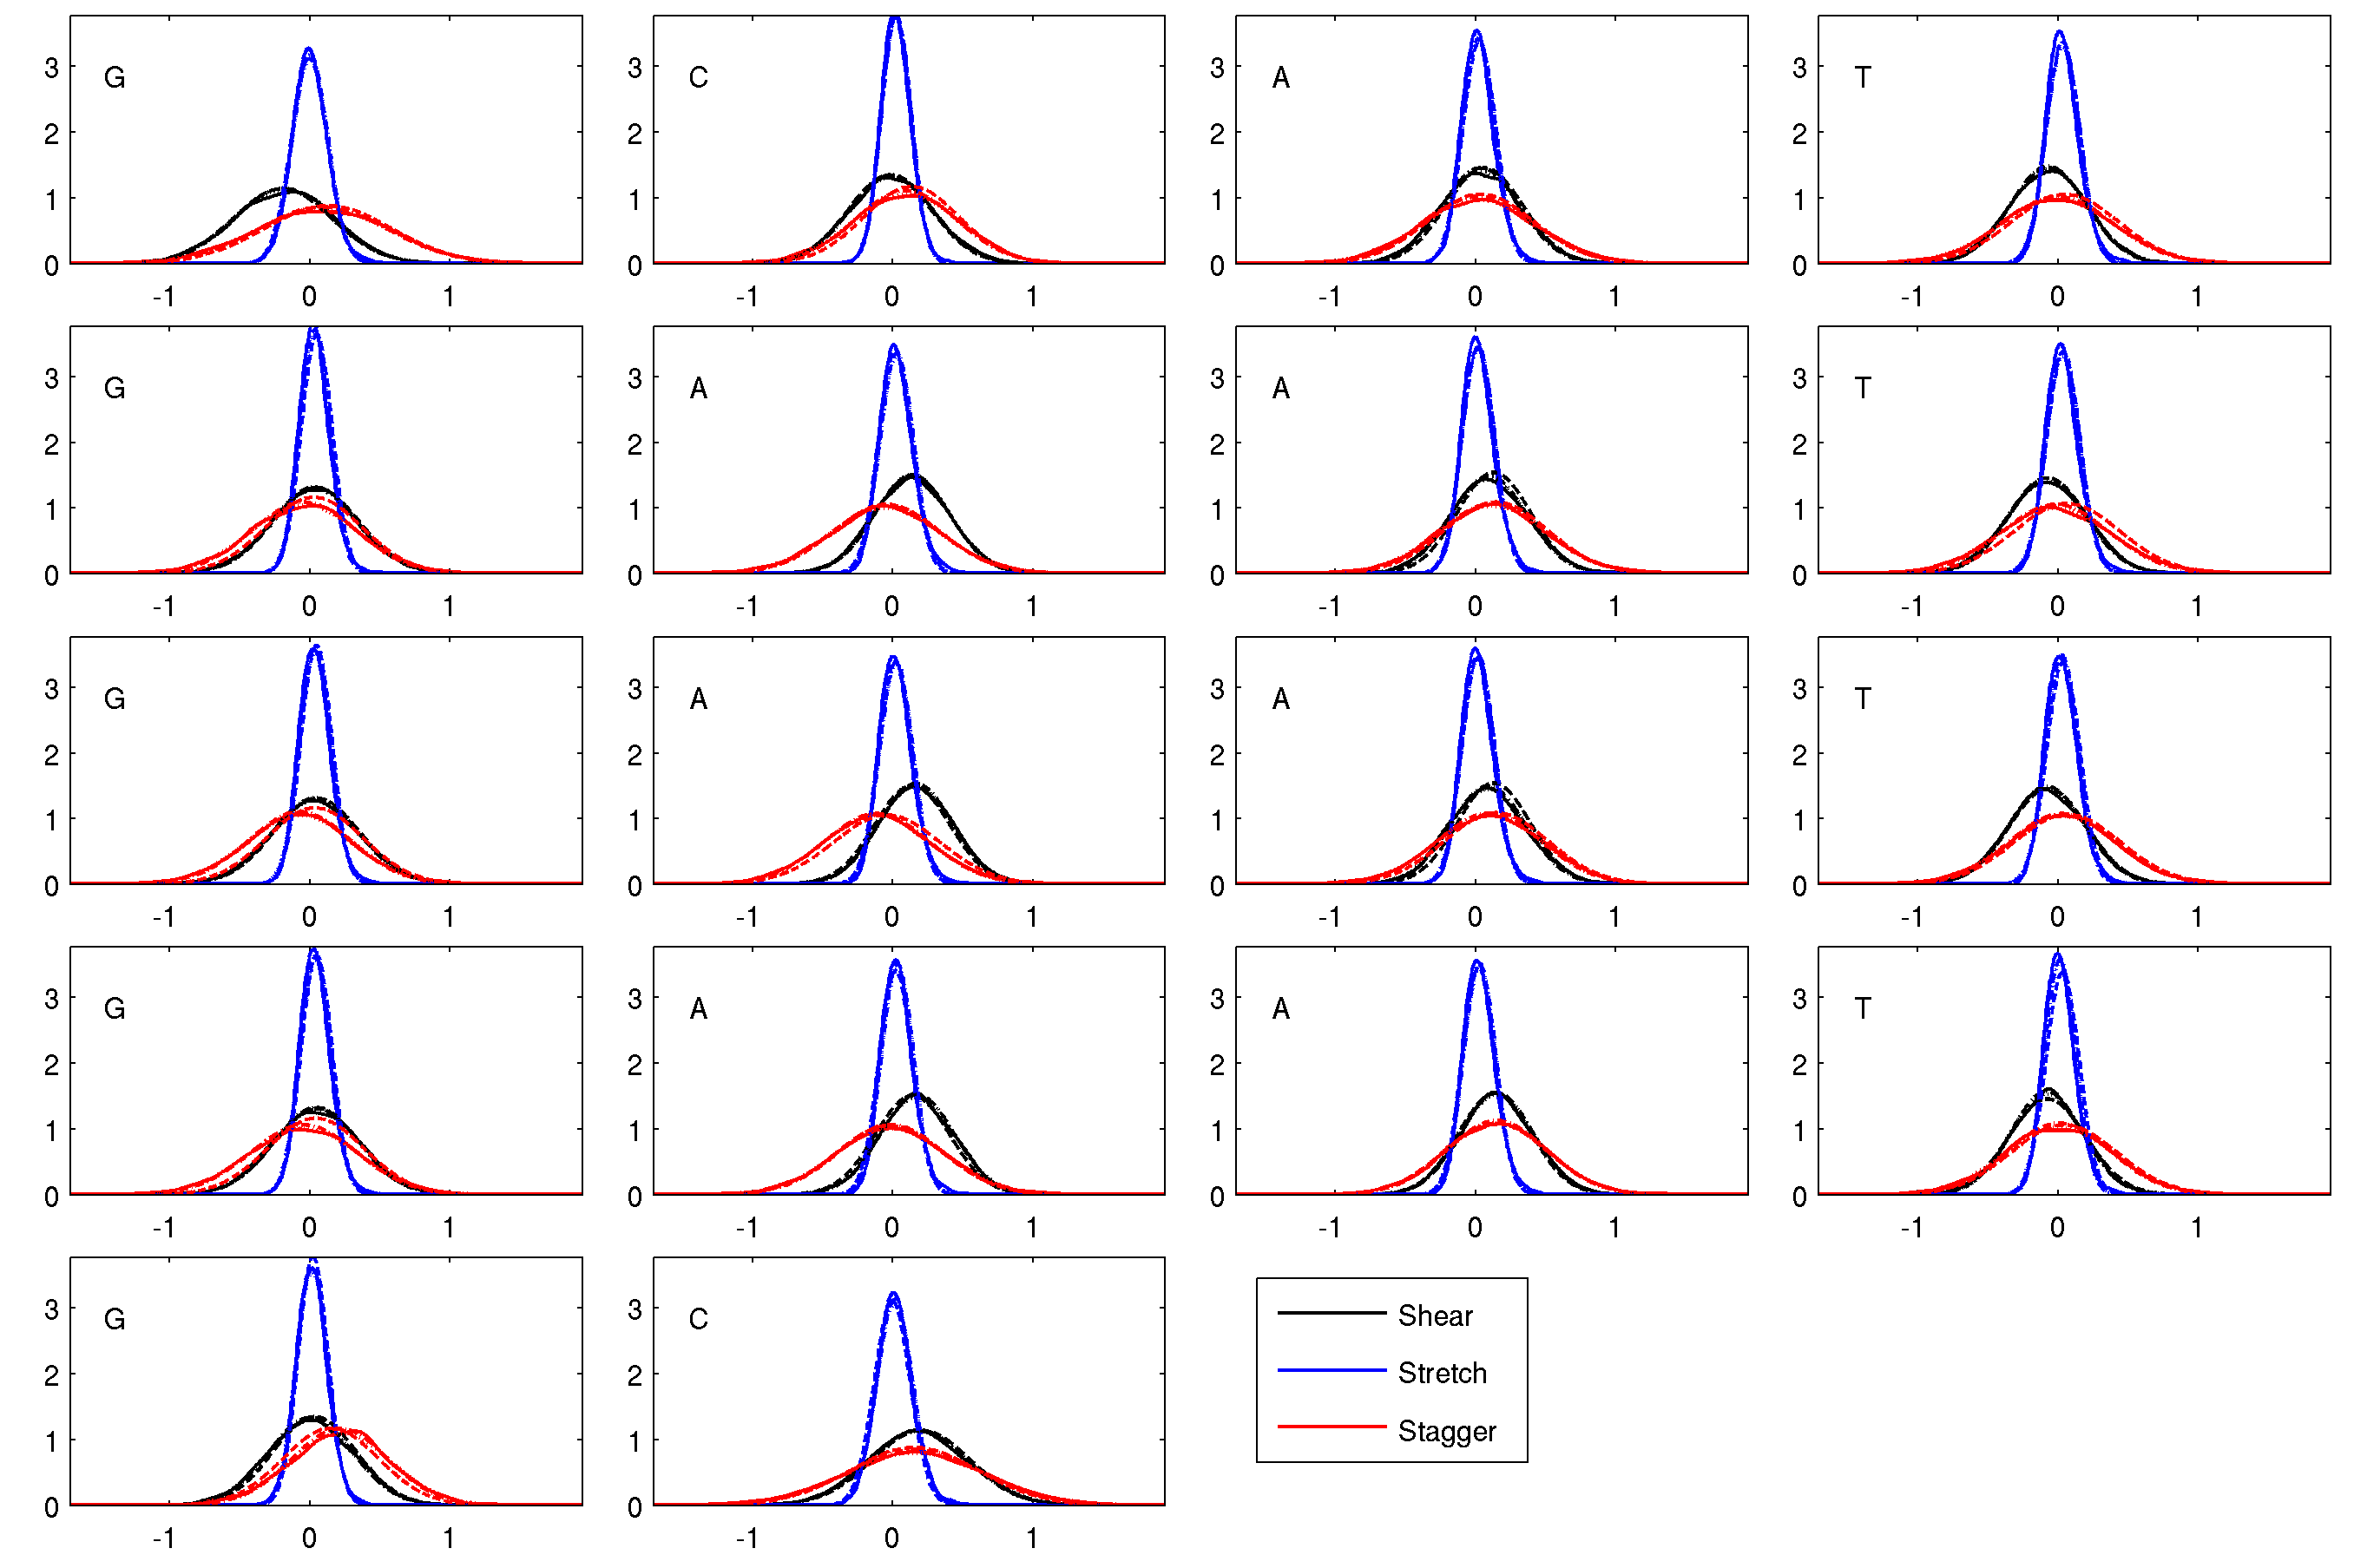
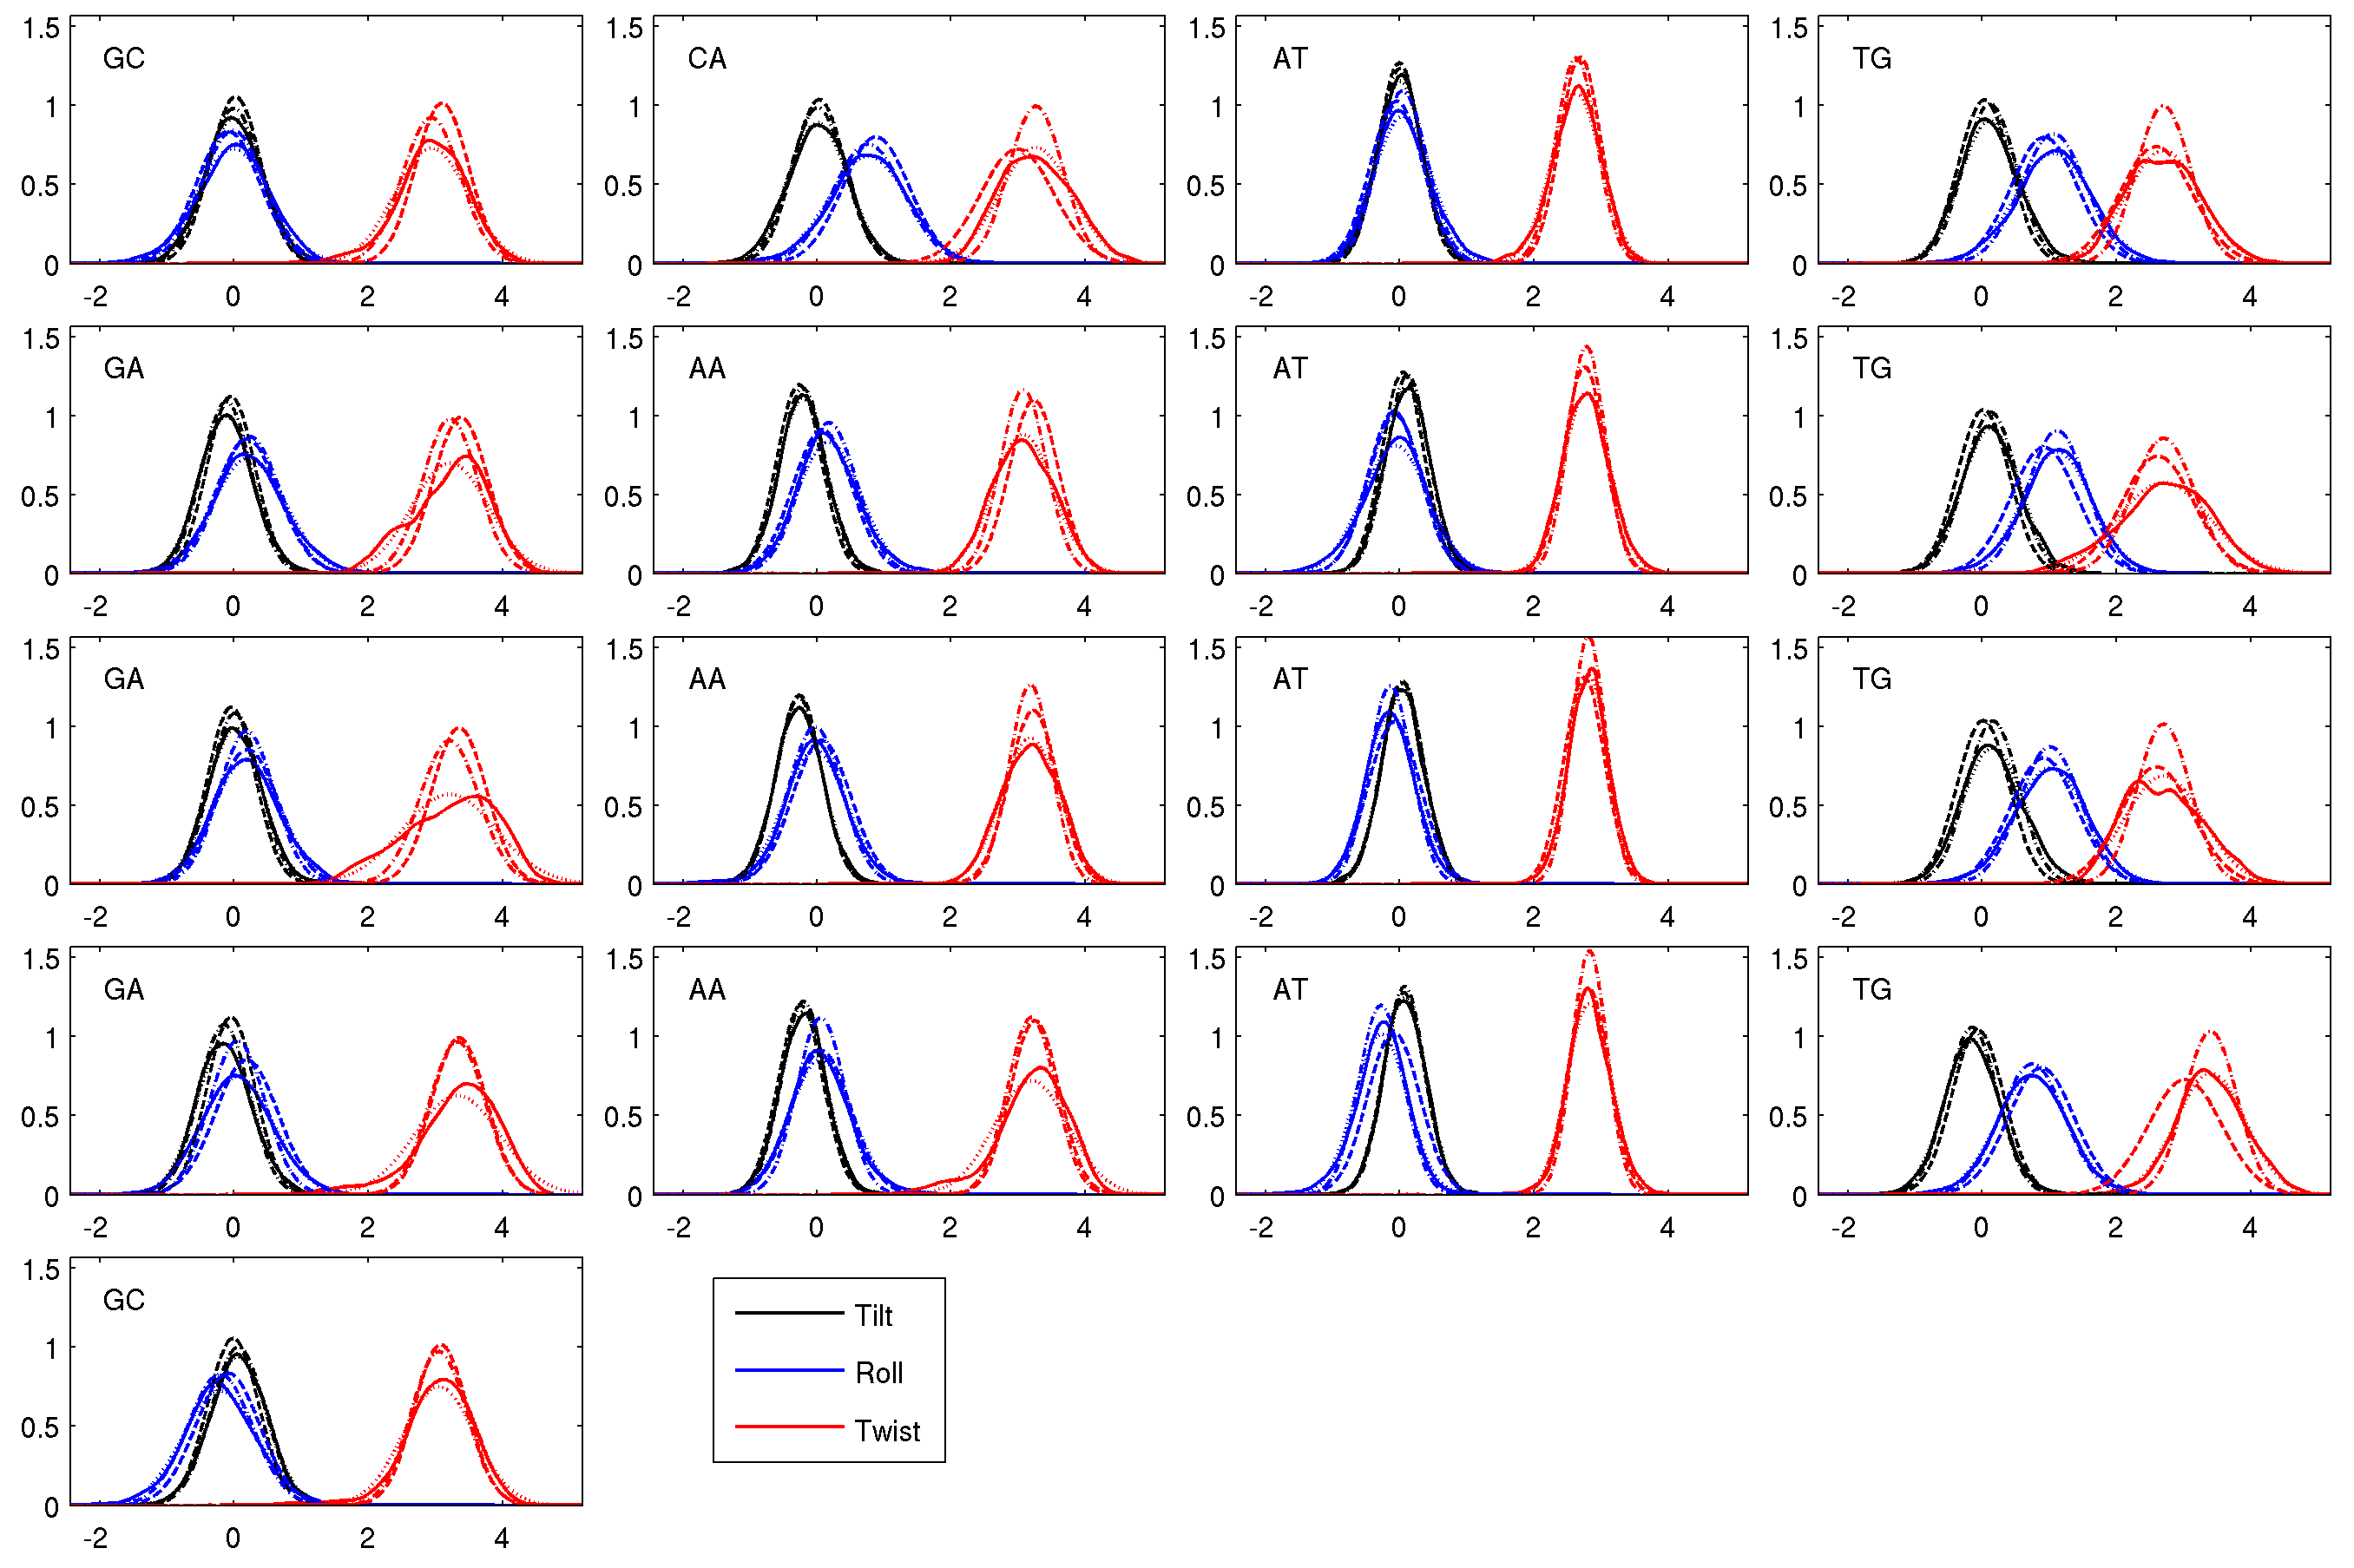
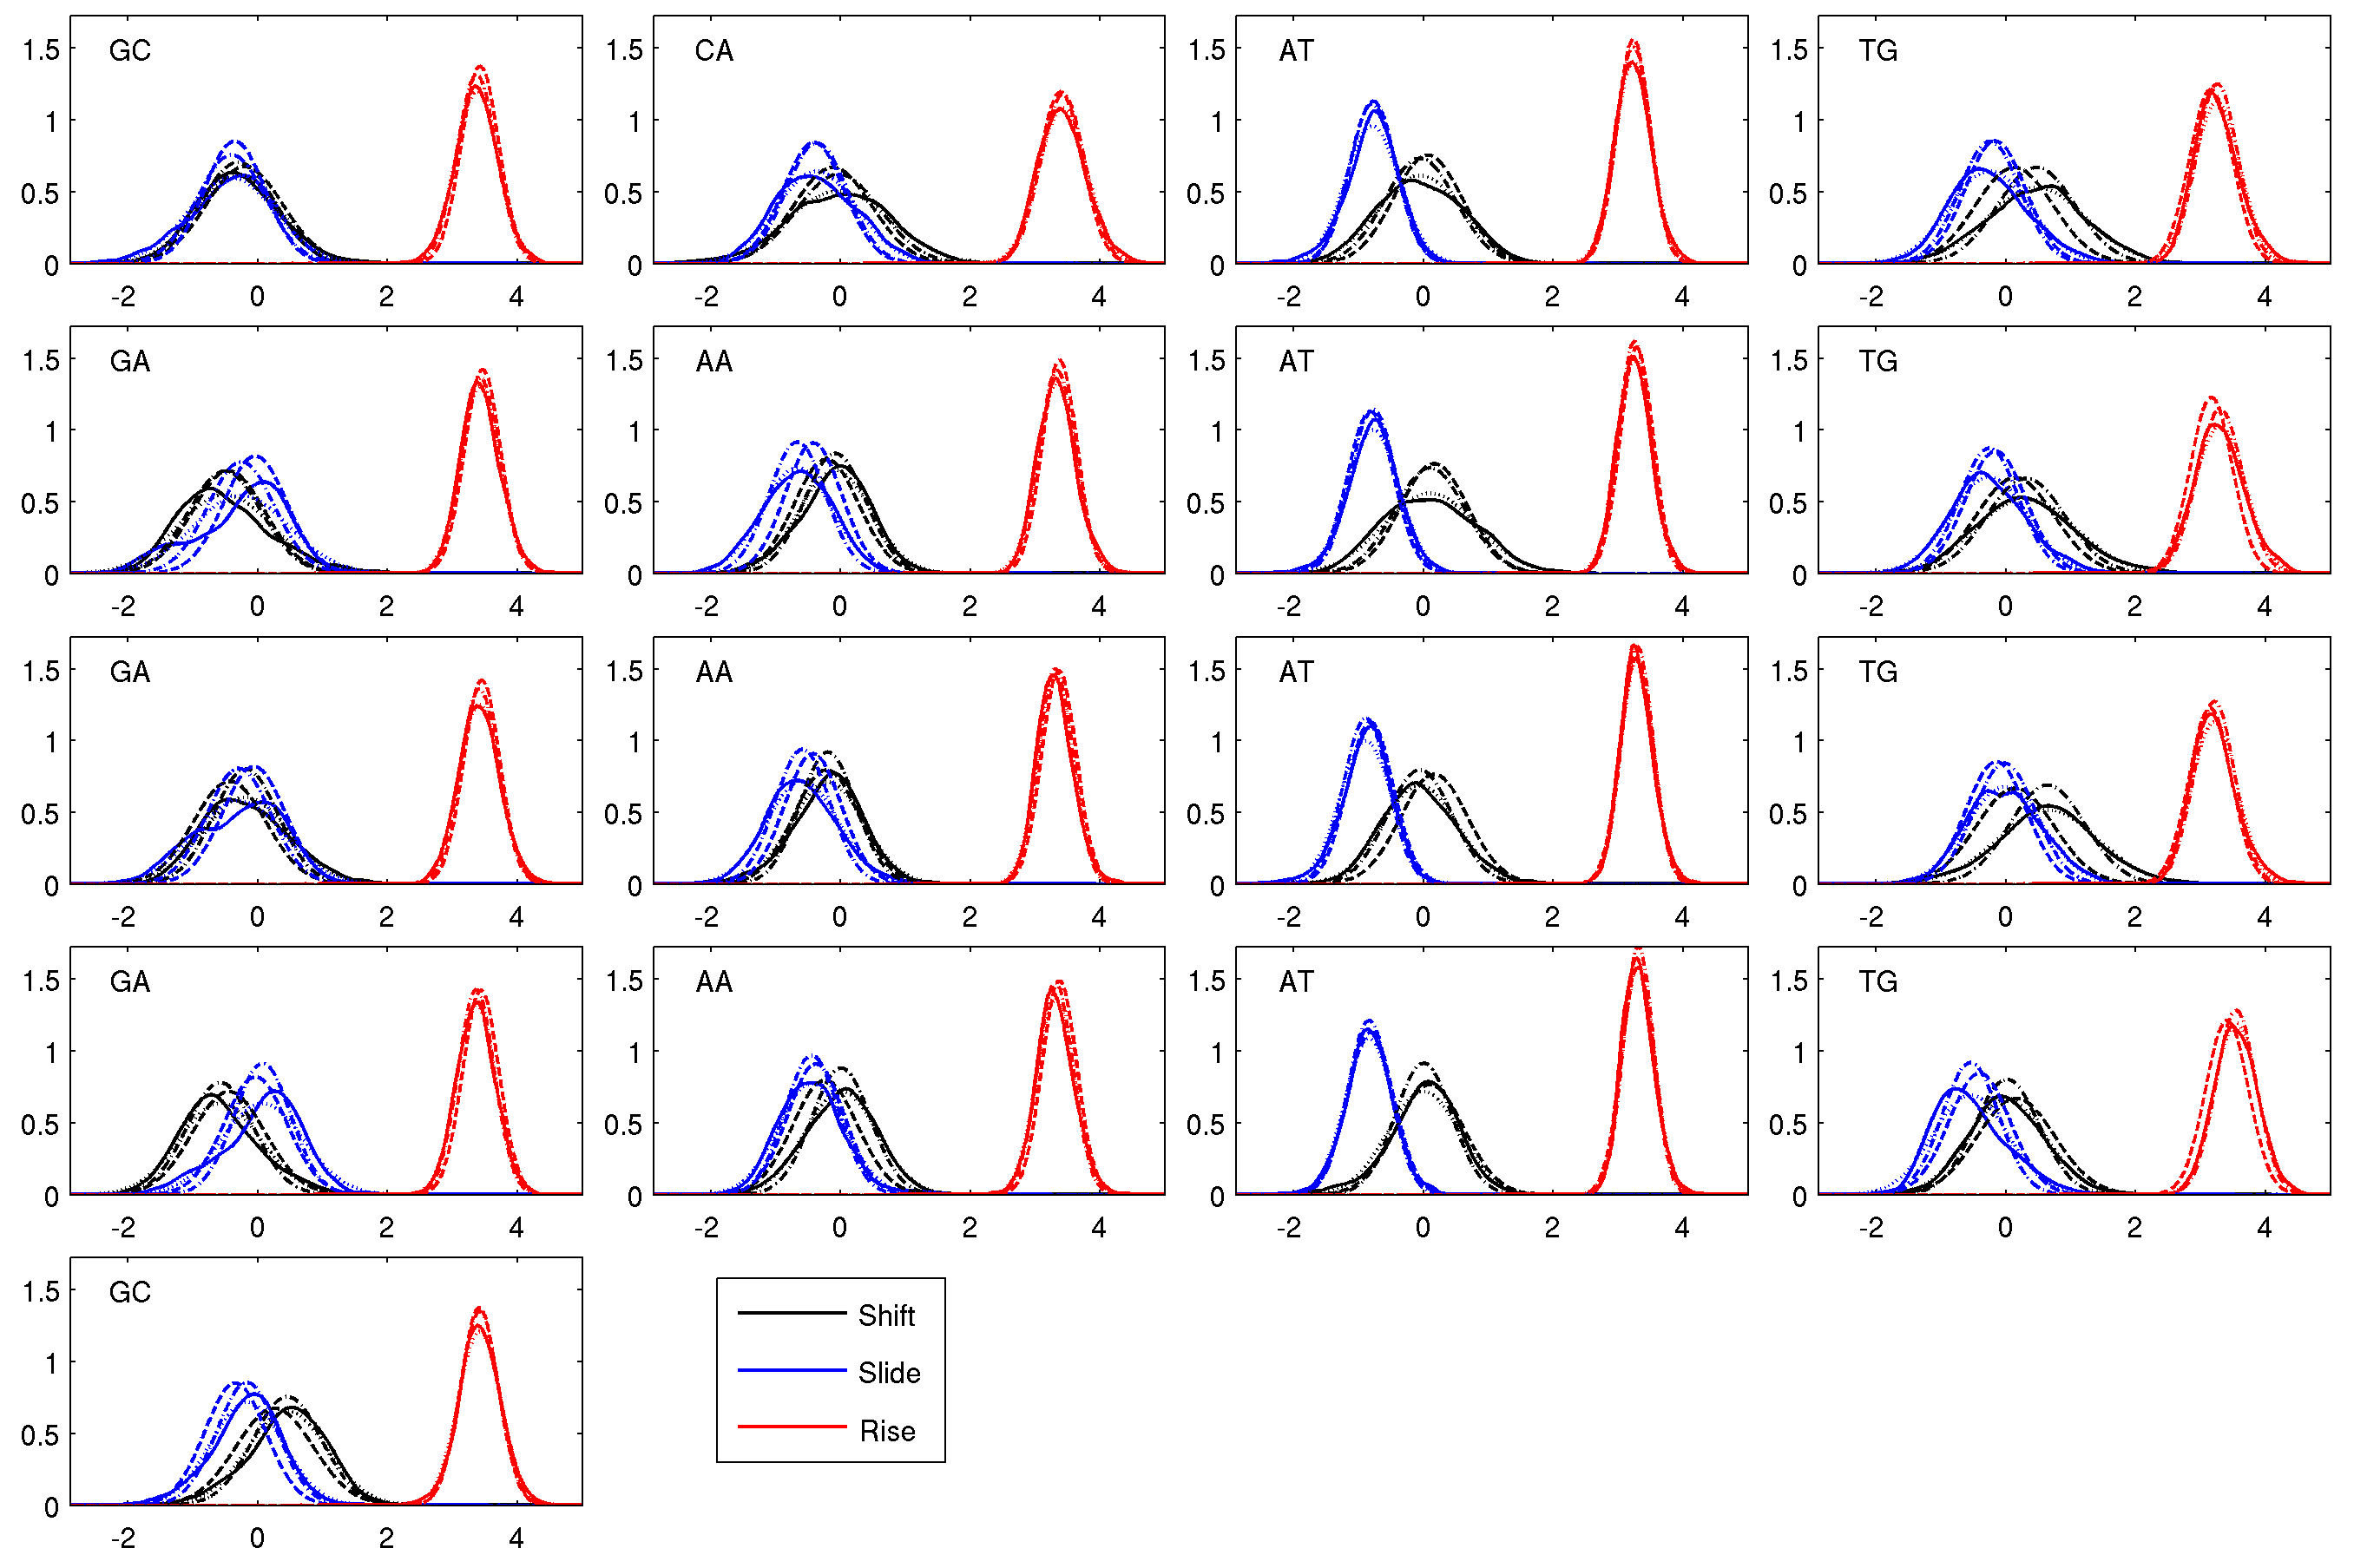
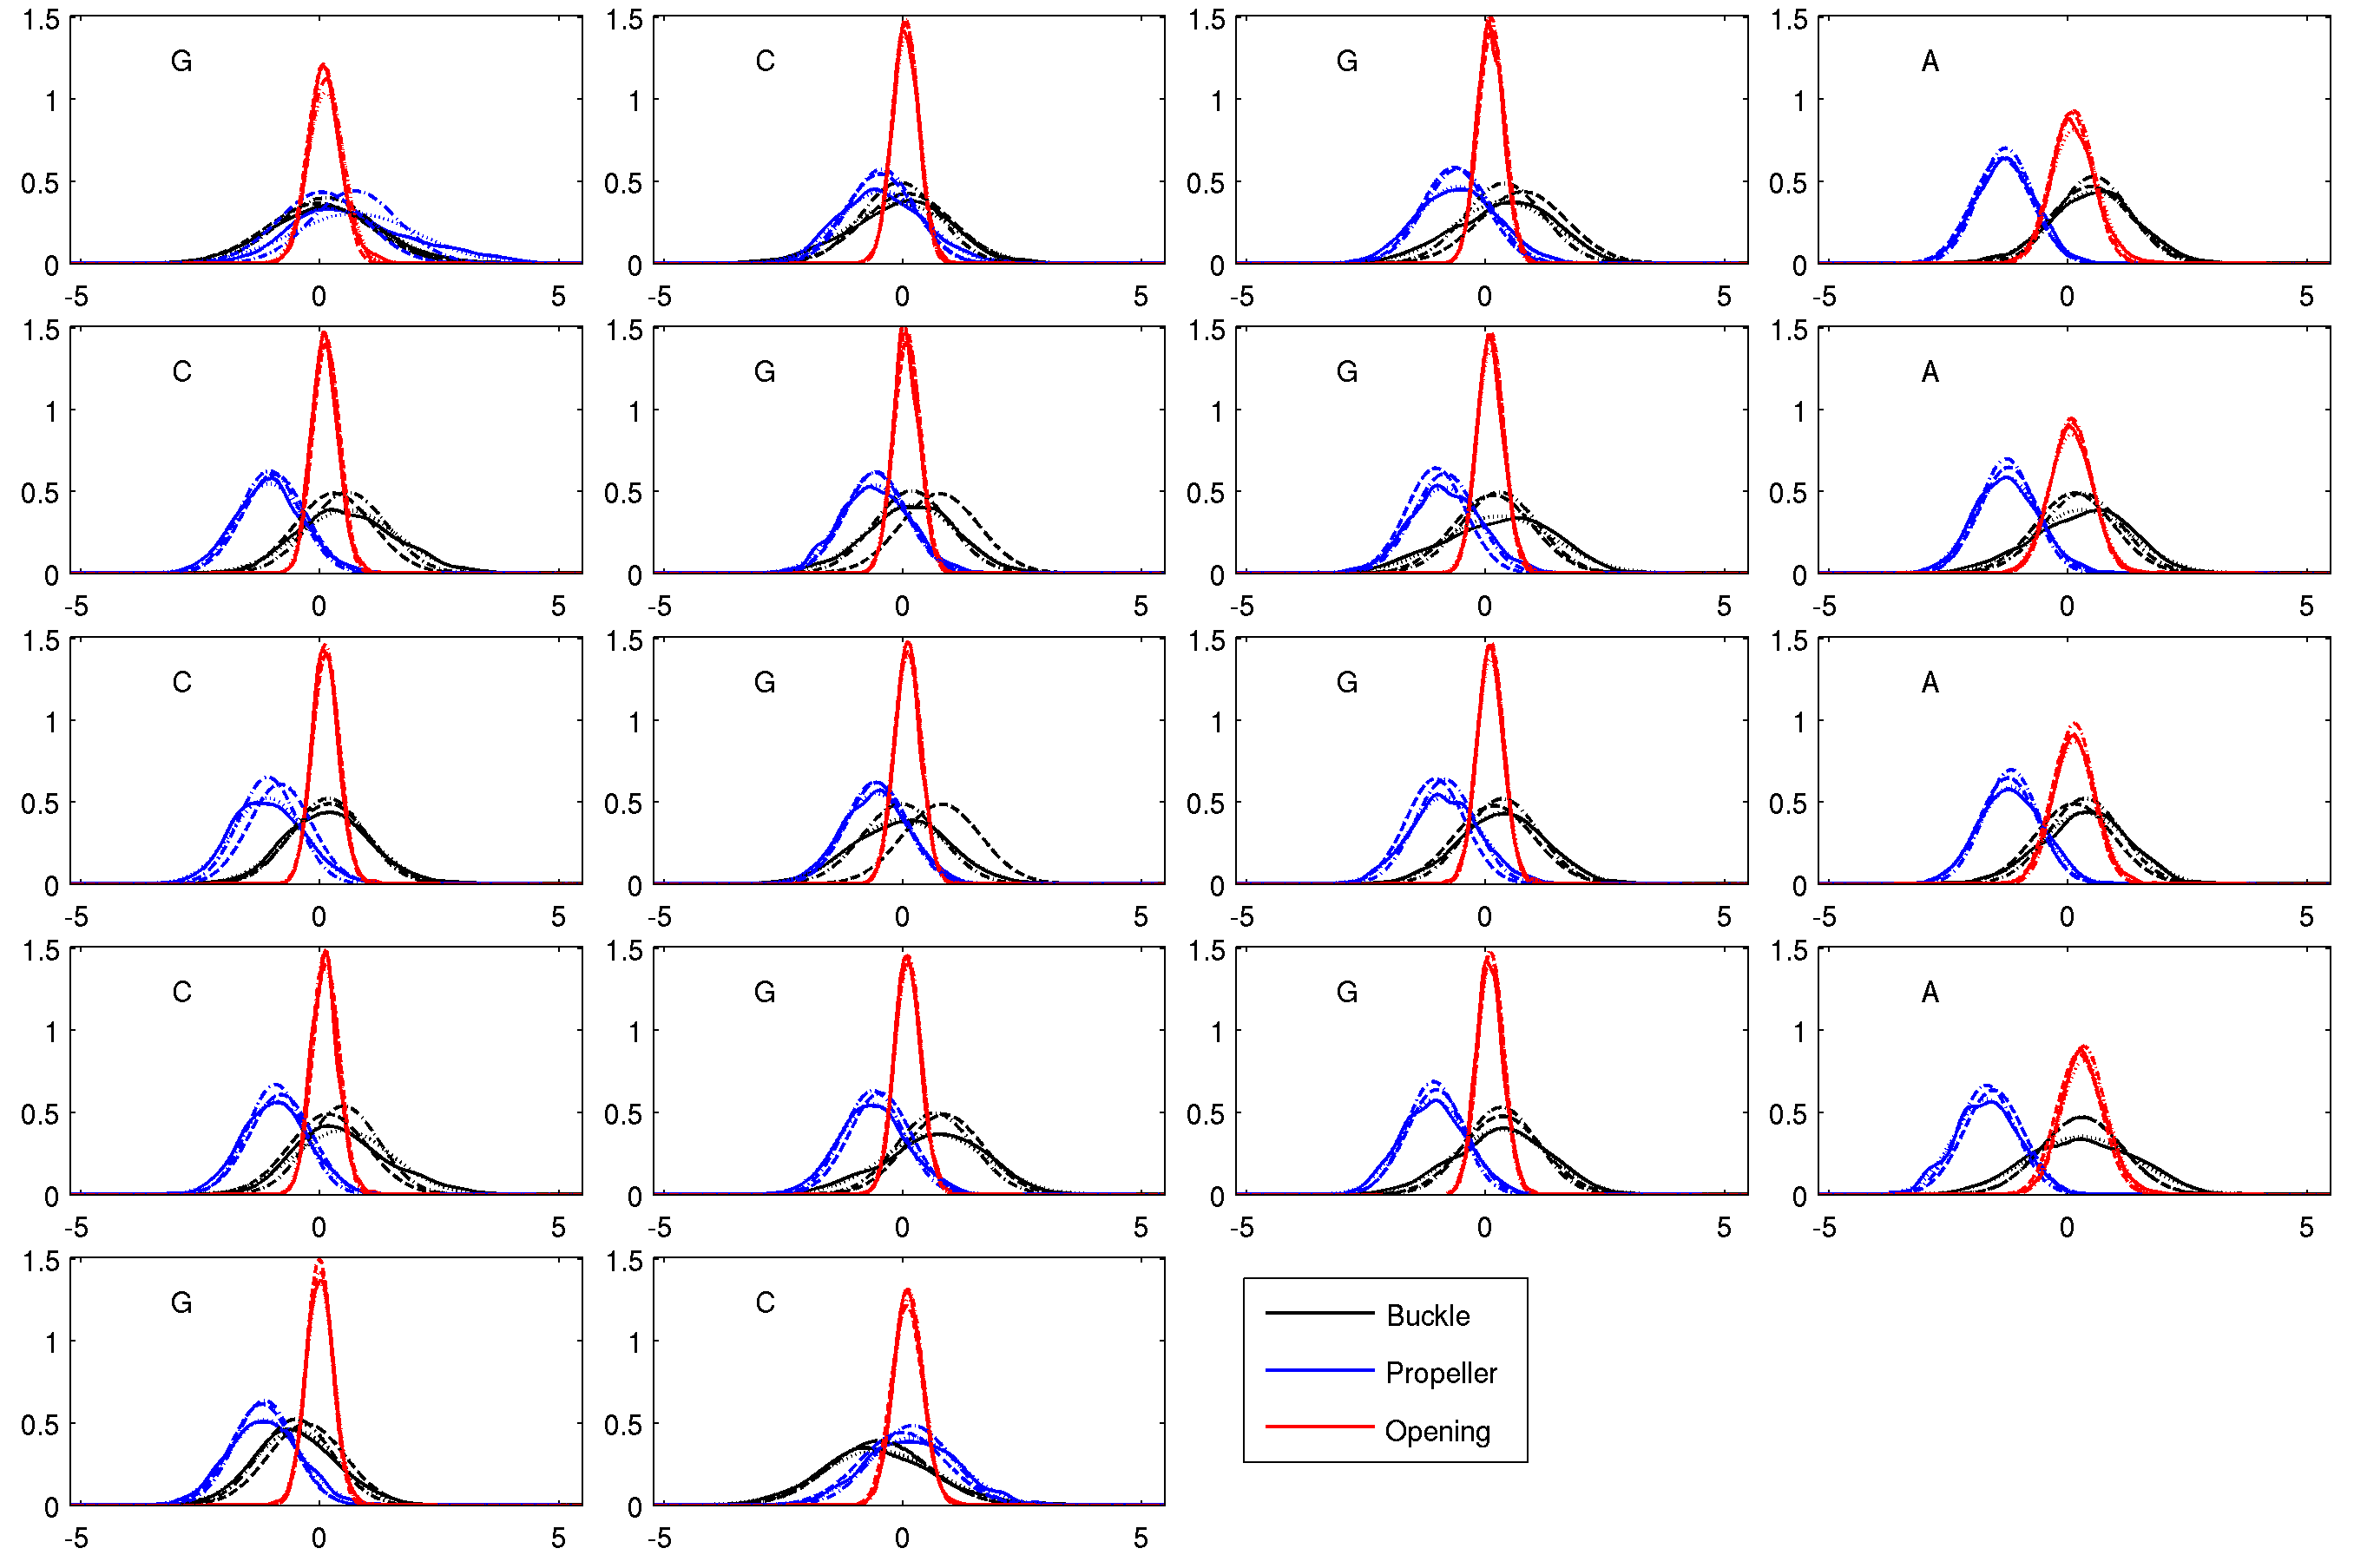
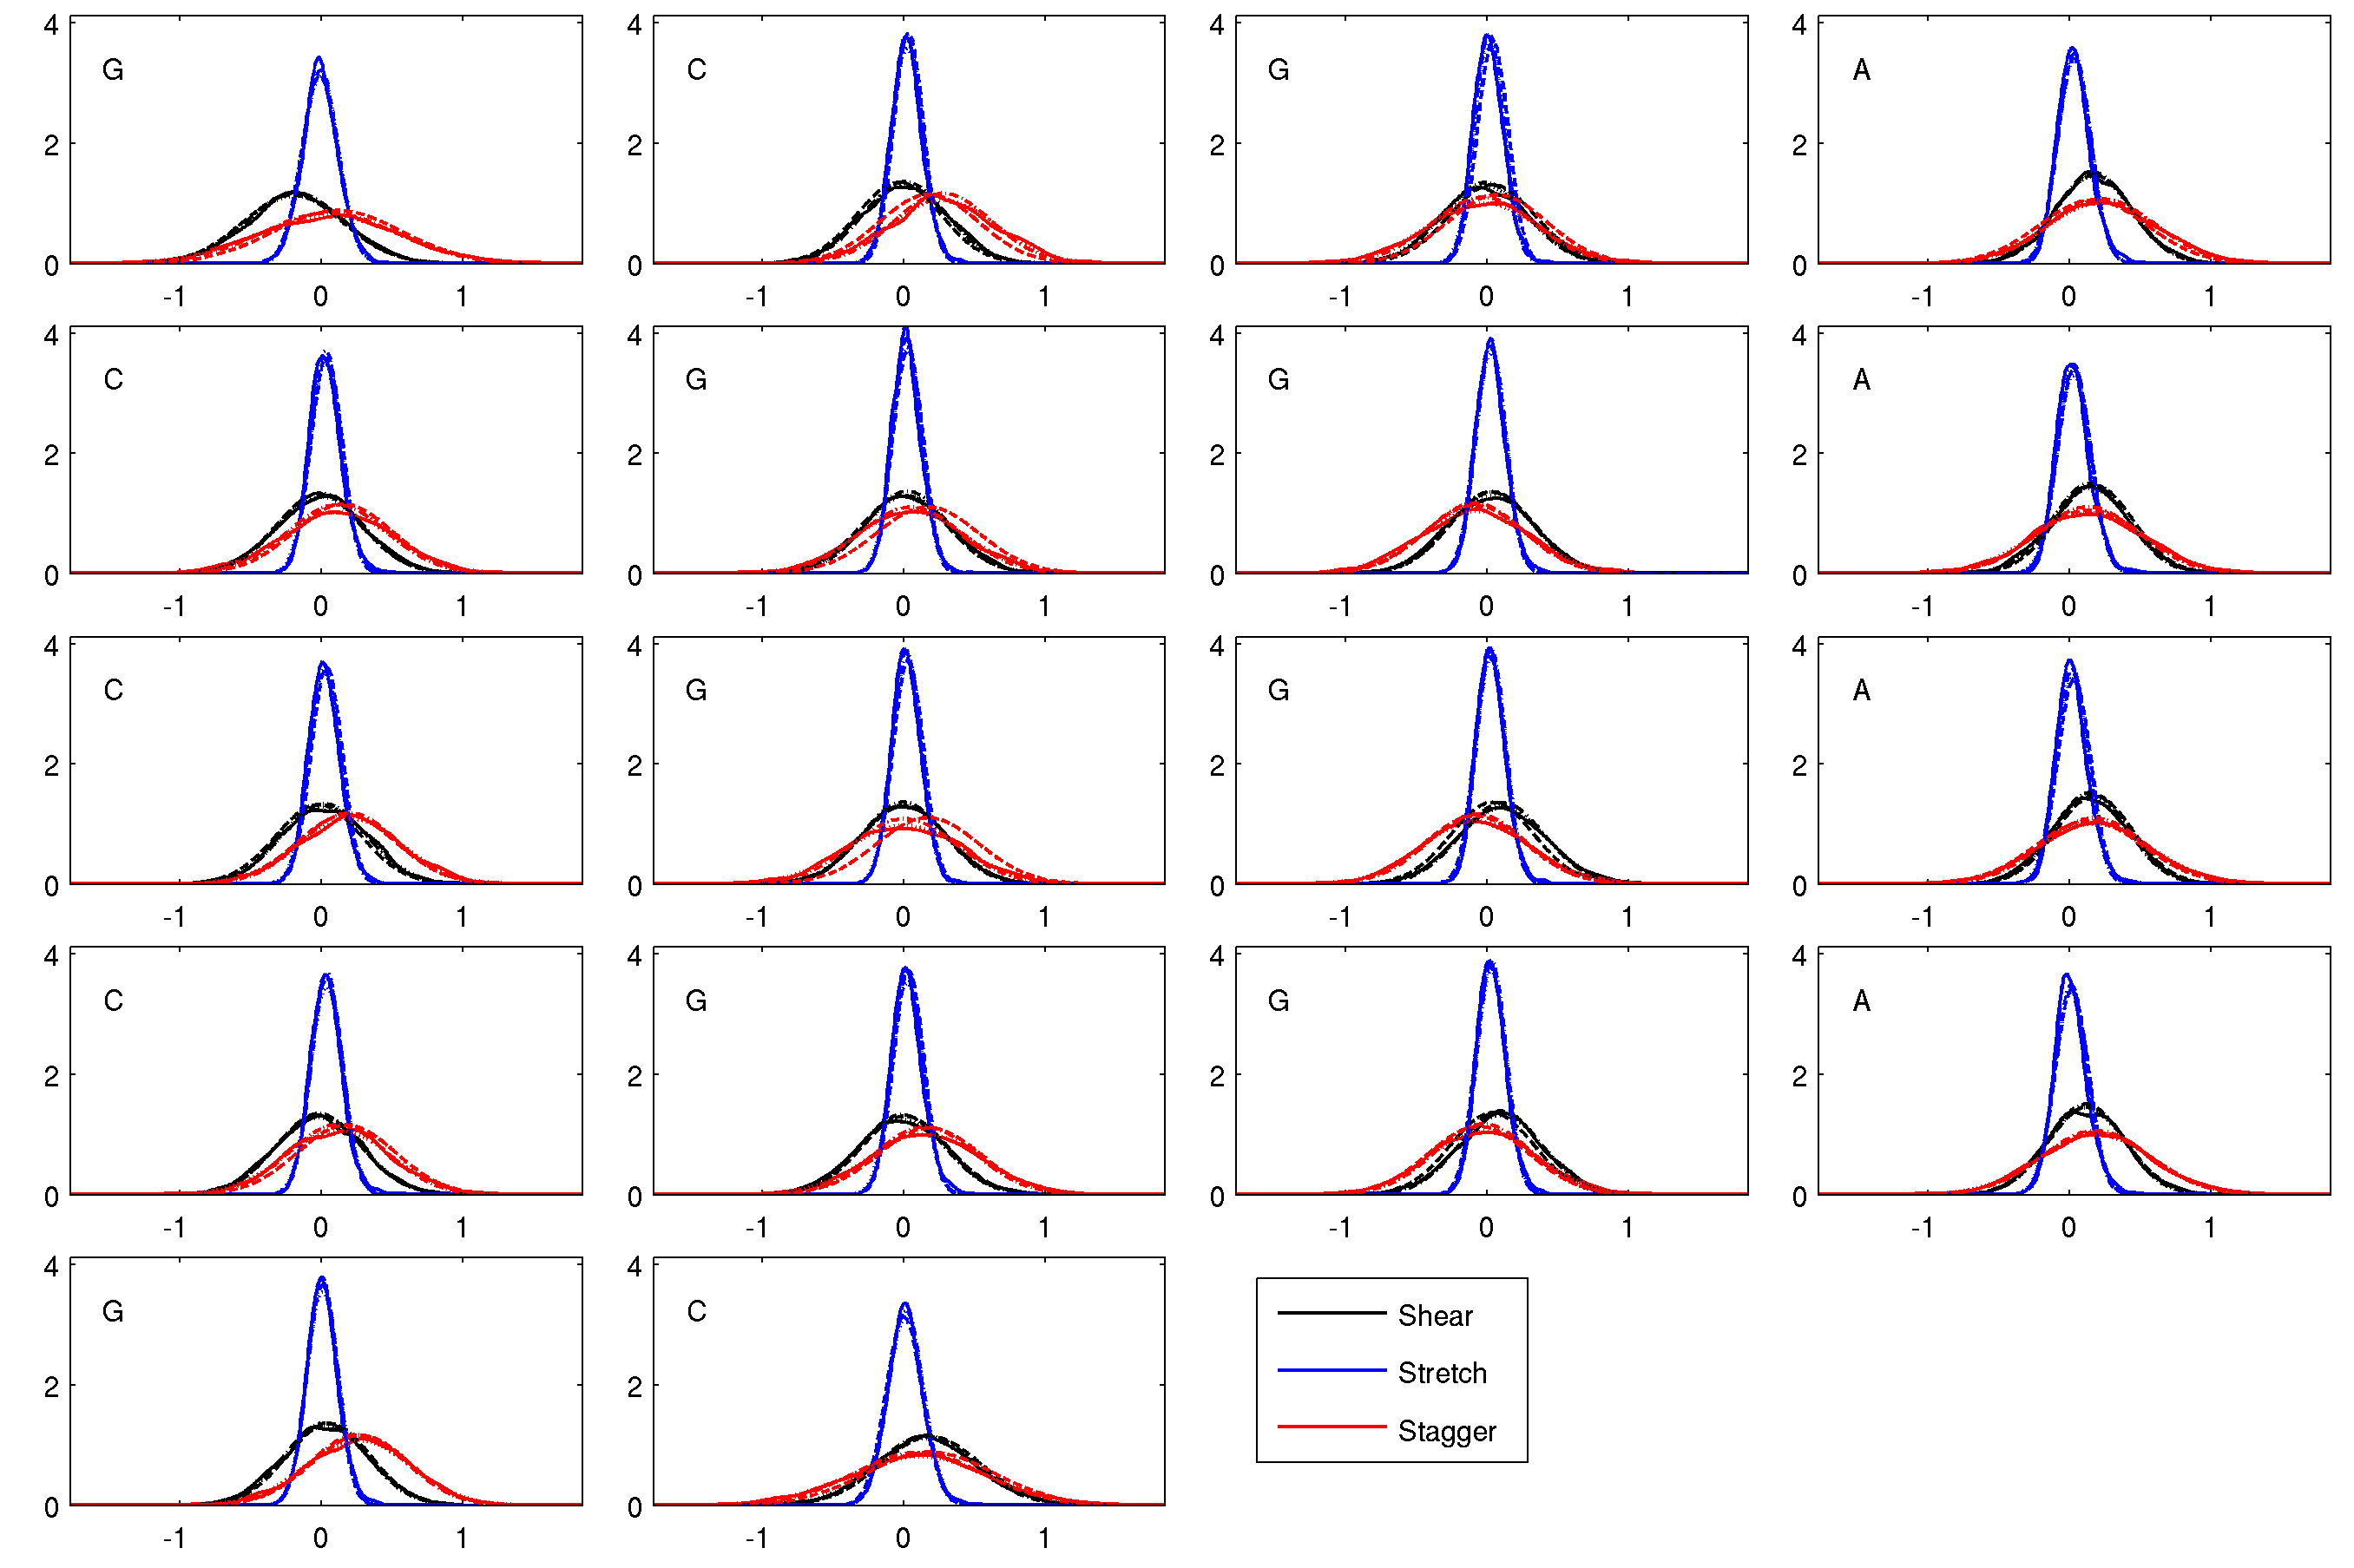
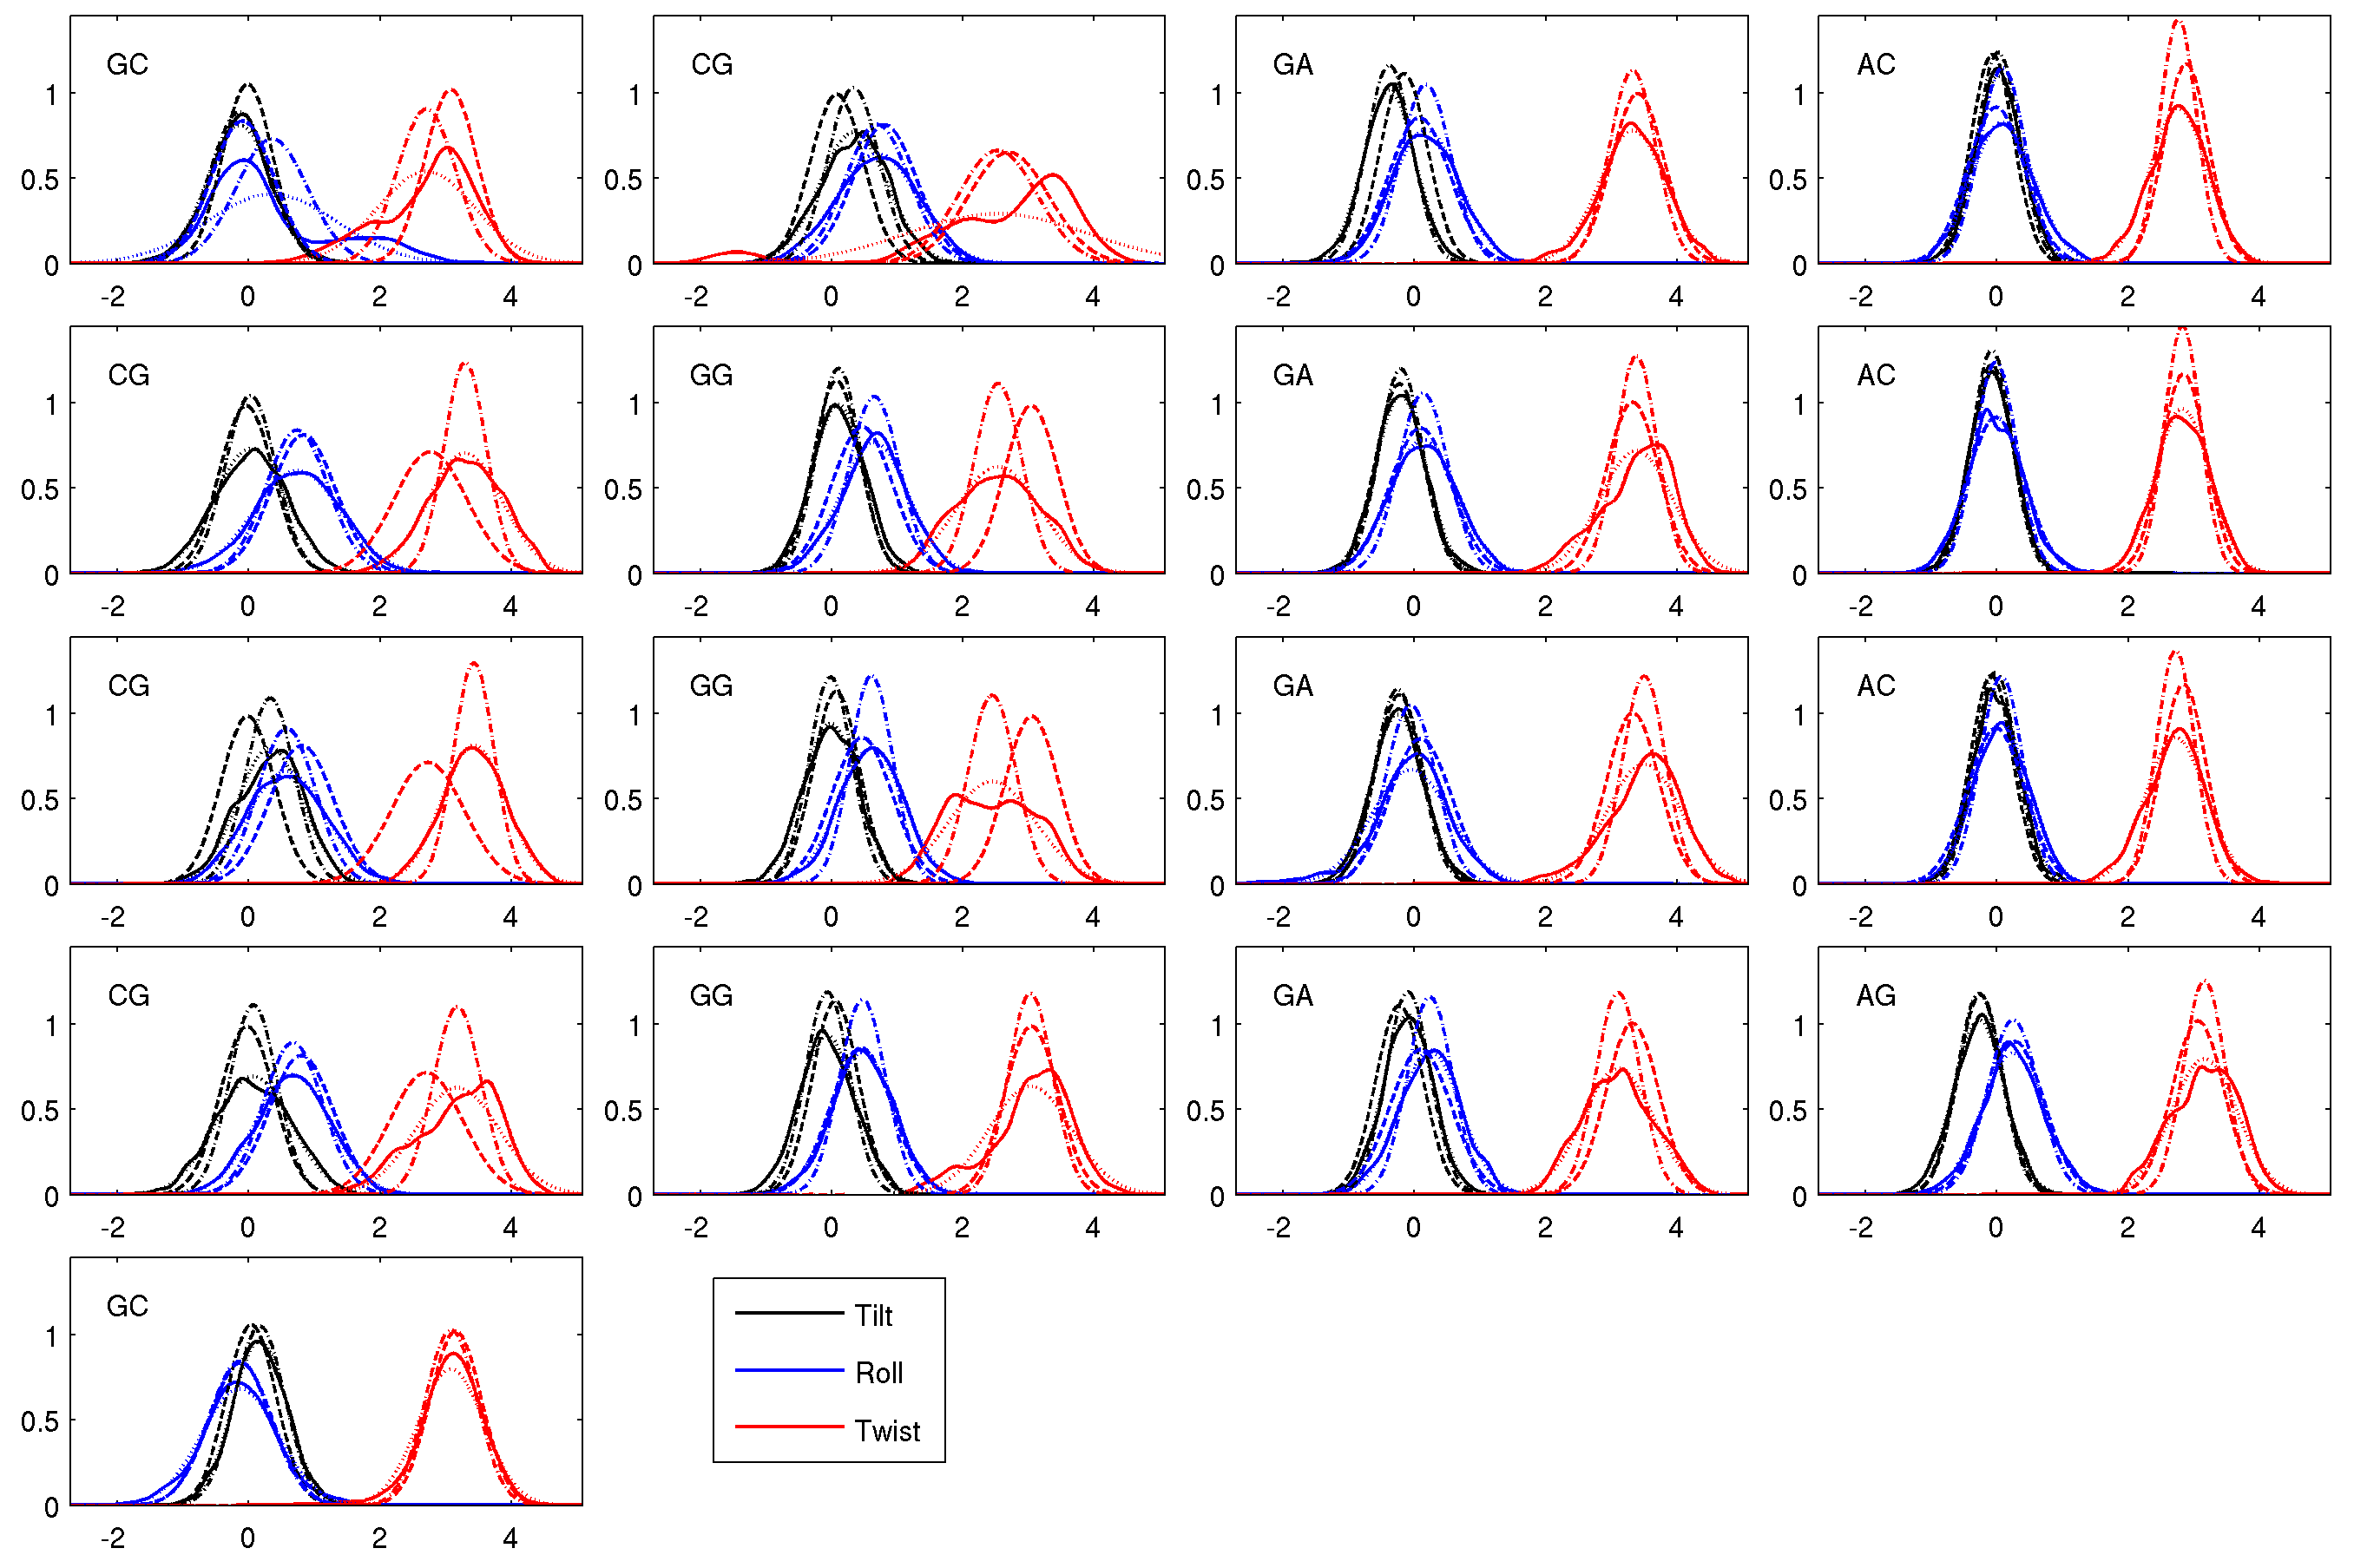
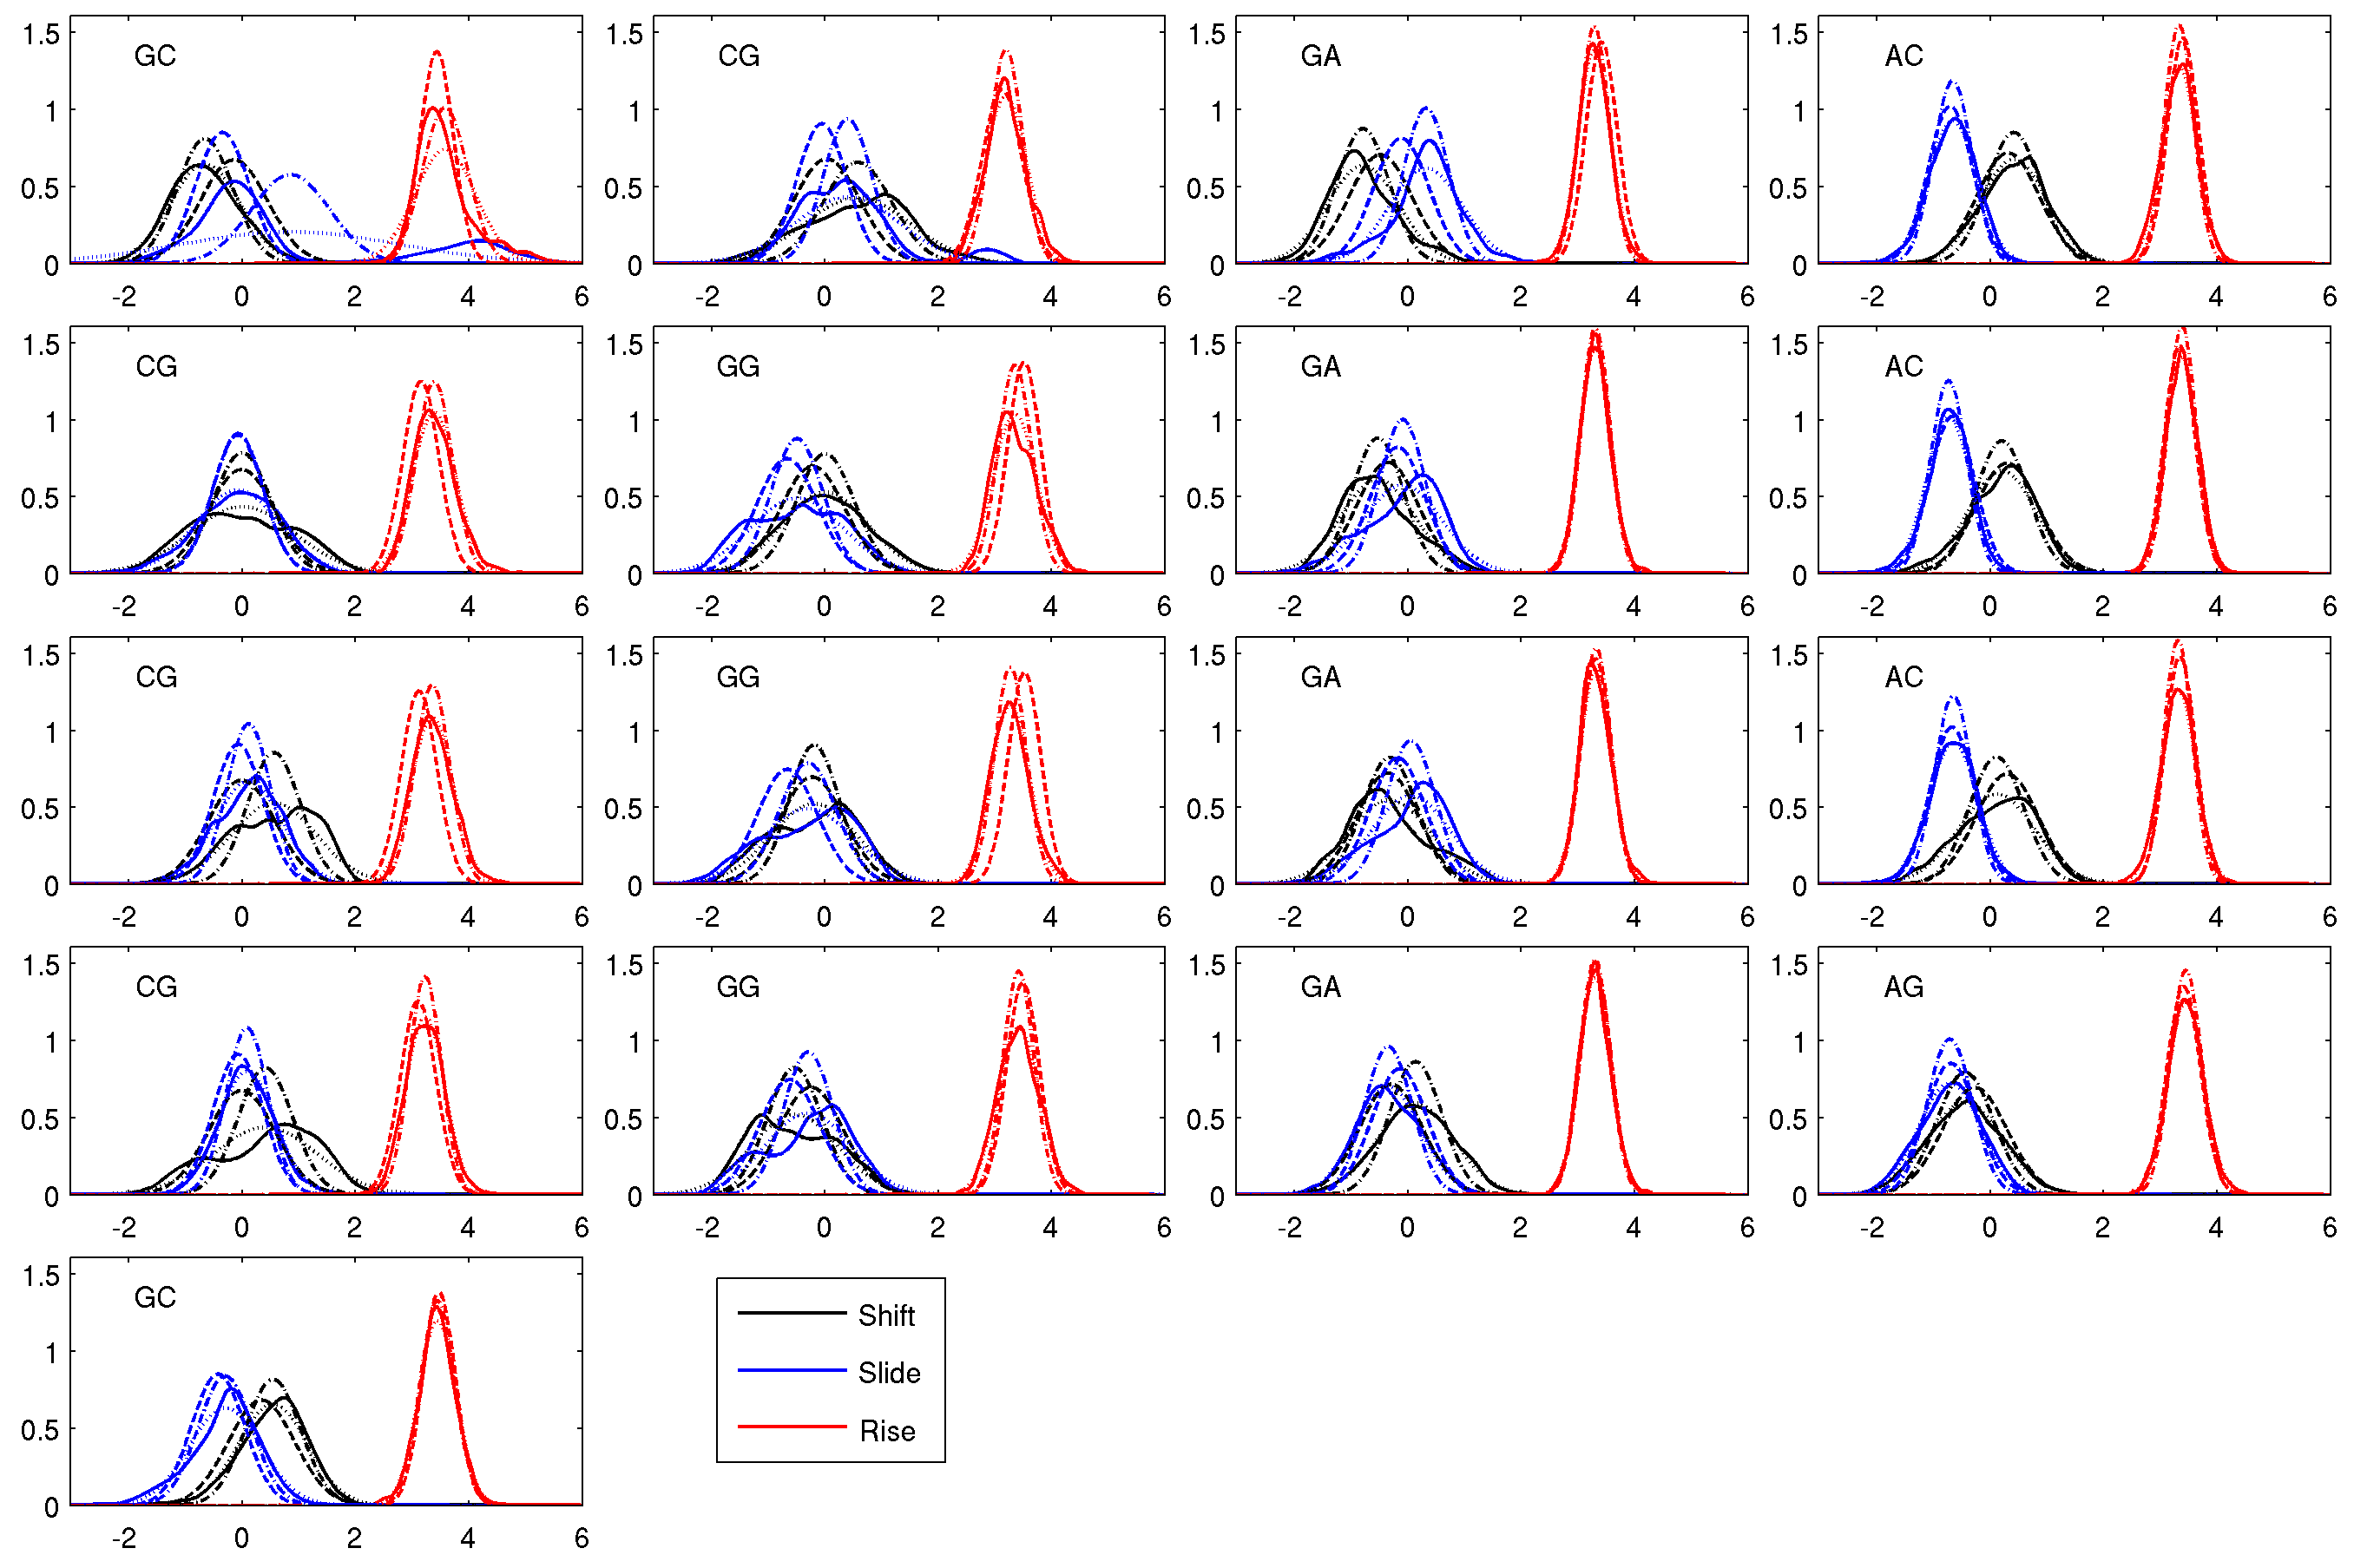
Histograms of wi
Marginal histograms of scalar rigid base DNA configuration parameters wi, i=1...(12N-6), where N is the number of base pairs in the oligomer. For each sequence parameter histograms are divided into four figures, corresponding to intra rotational, intra translational, inter rotational and inter translational parameters.
Solid lines correspond to a histogram of the data observed in the MD simulation, which in principle could be far from Gaussian, but in most cases are quite close. Dotted lines correspond to the Gaussian marginal determined from the Gaussian oligomer training set density ρo, dashed-dotted lines correspond to the Gaussian marginal determined from the nearest-neighbour Gaussian distribution ρM, and finally dashed lines represents the Gaussian marginal determined from reconstructed Gaussian density ρm. For many of the histograms the four curves are practicably indistinguishable.