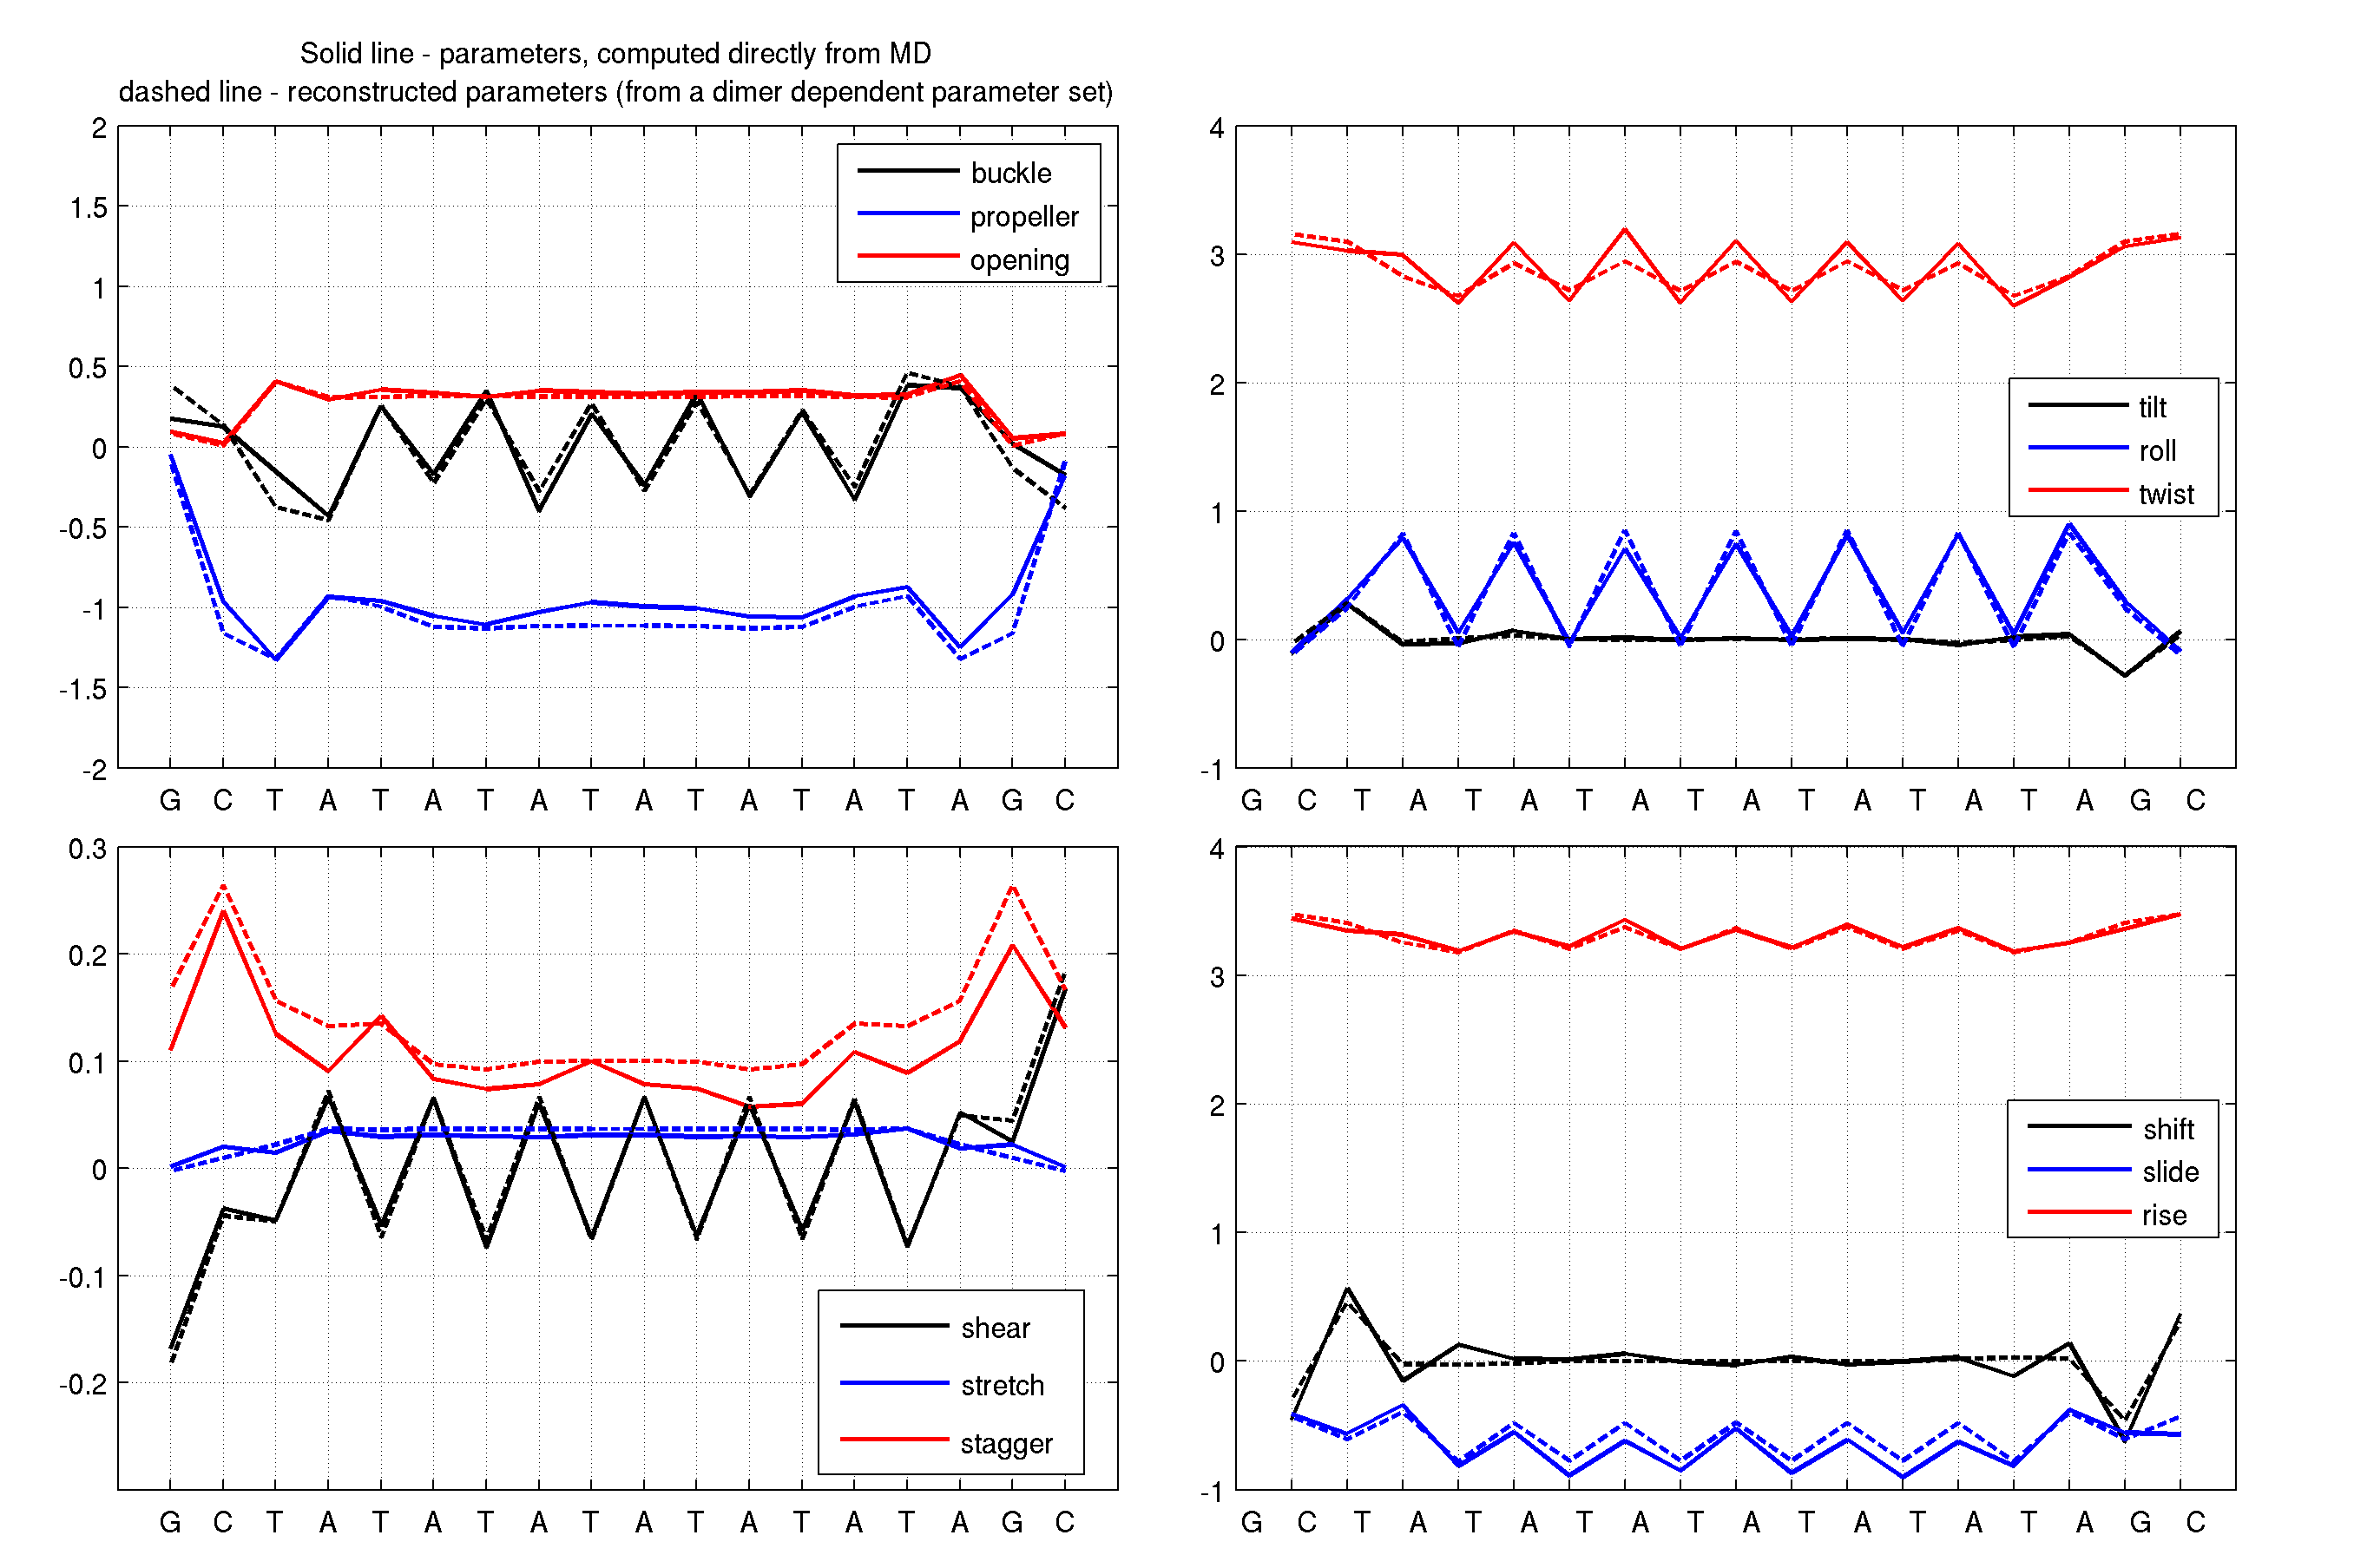
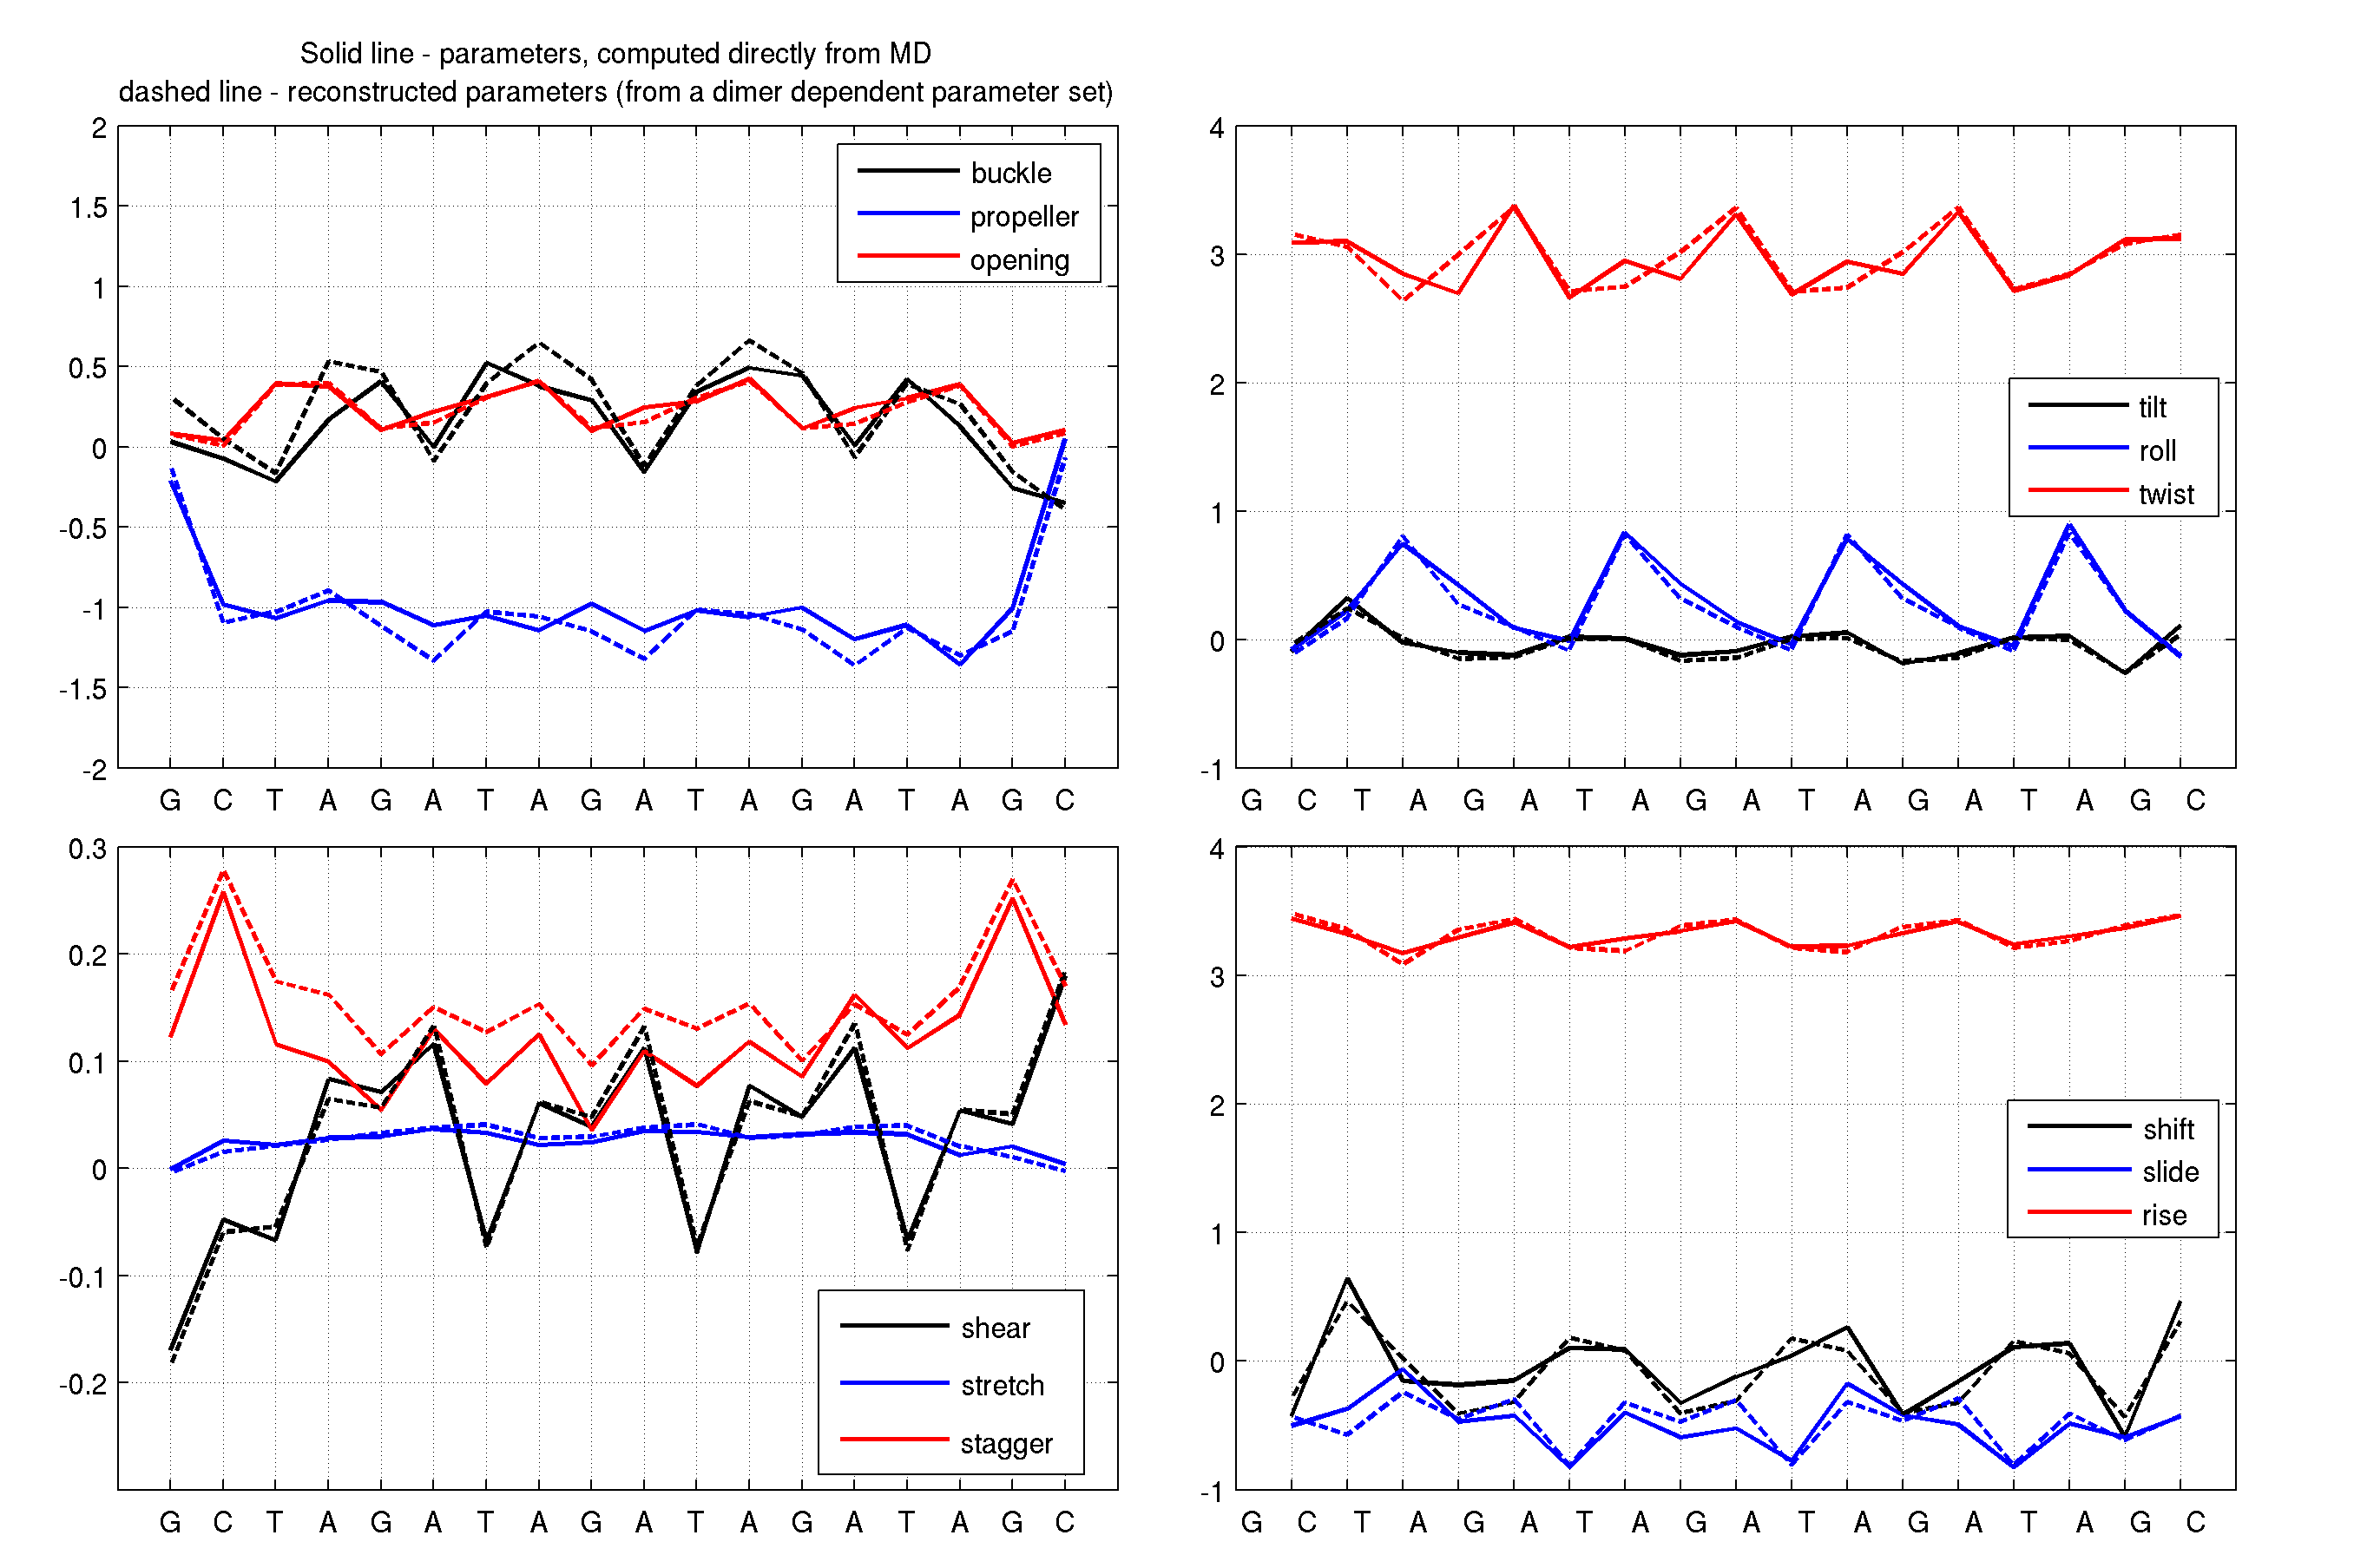
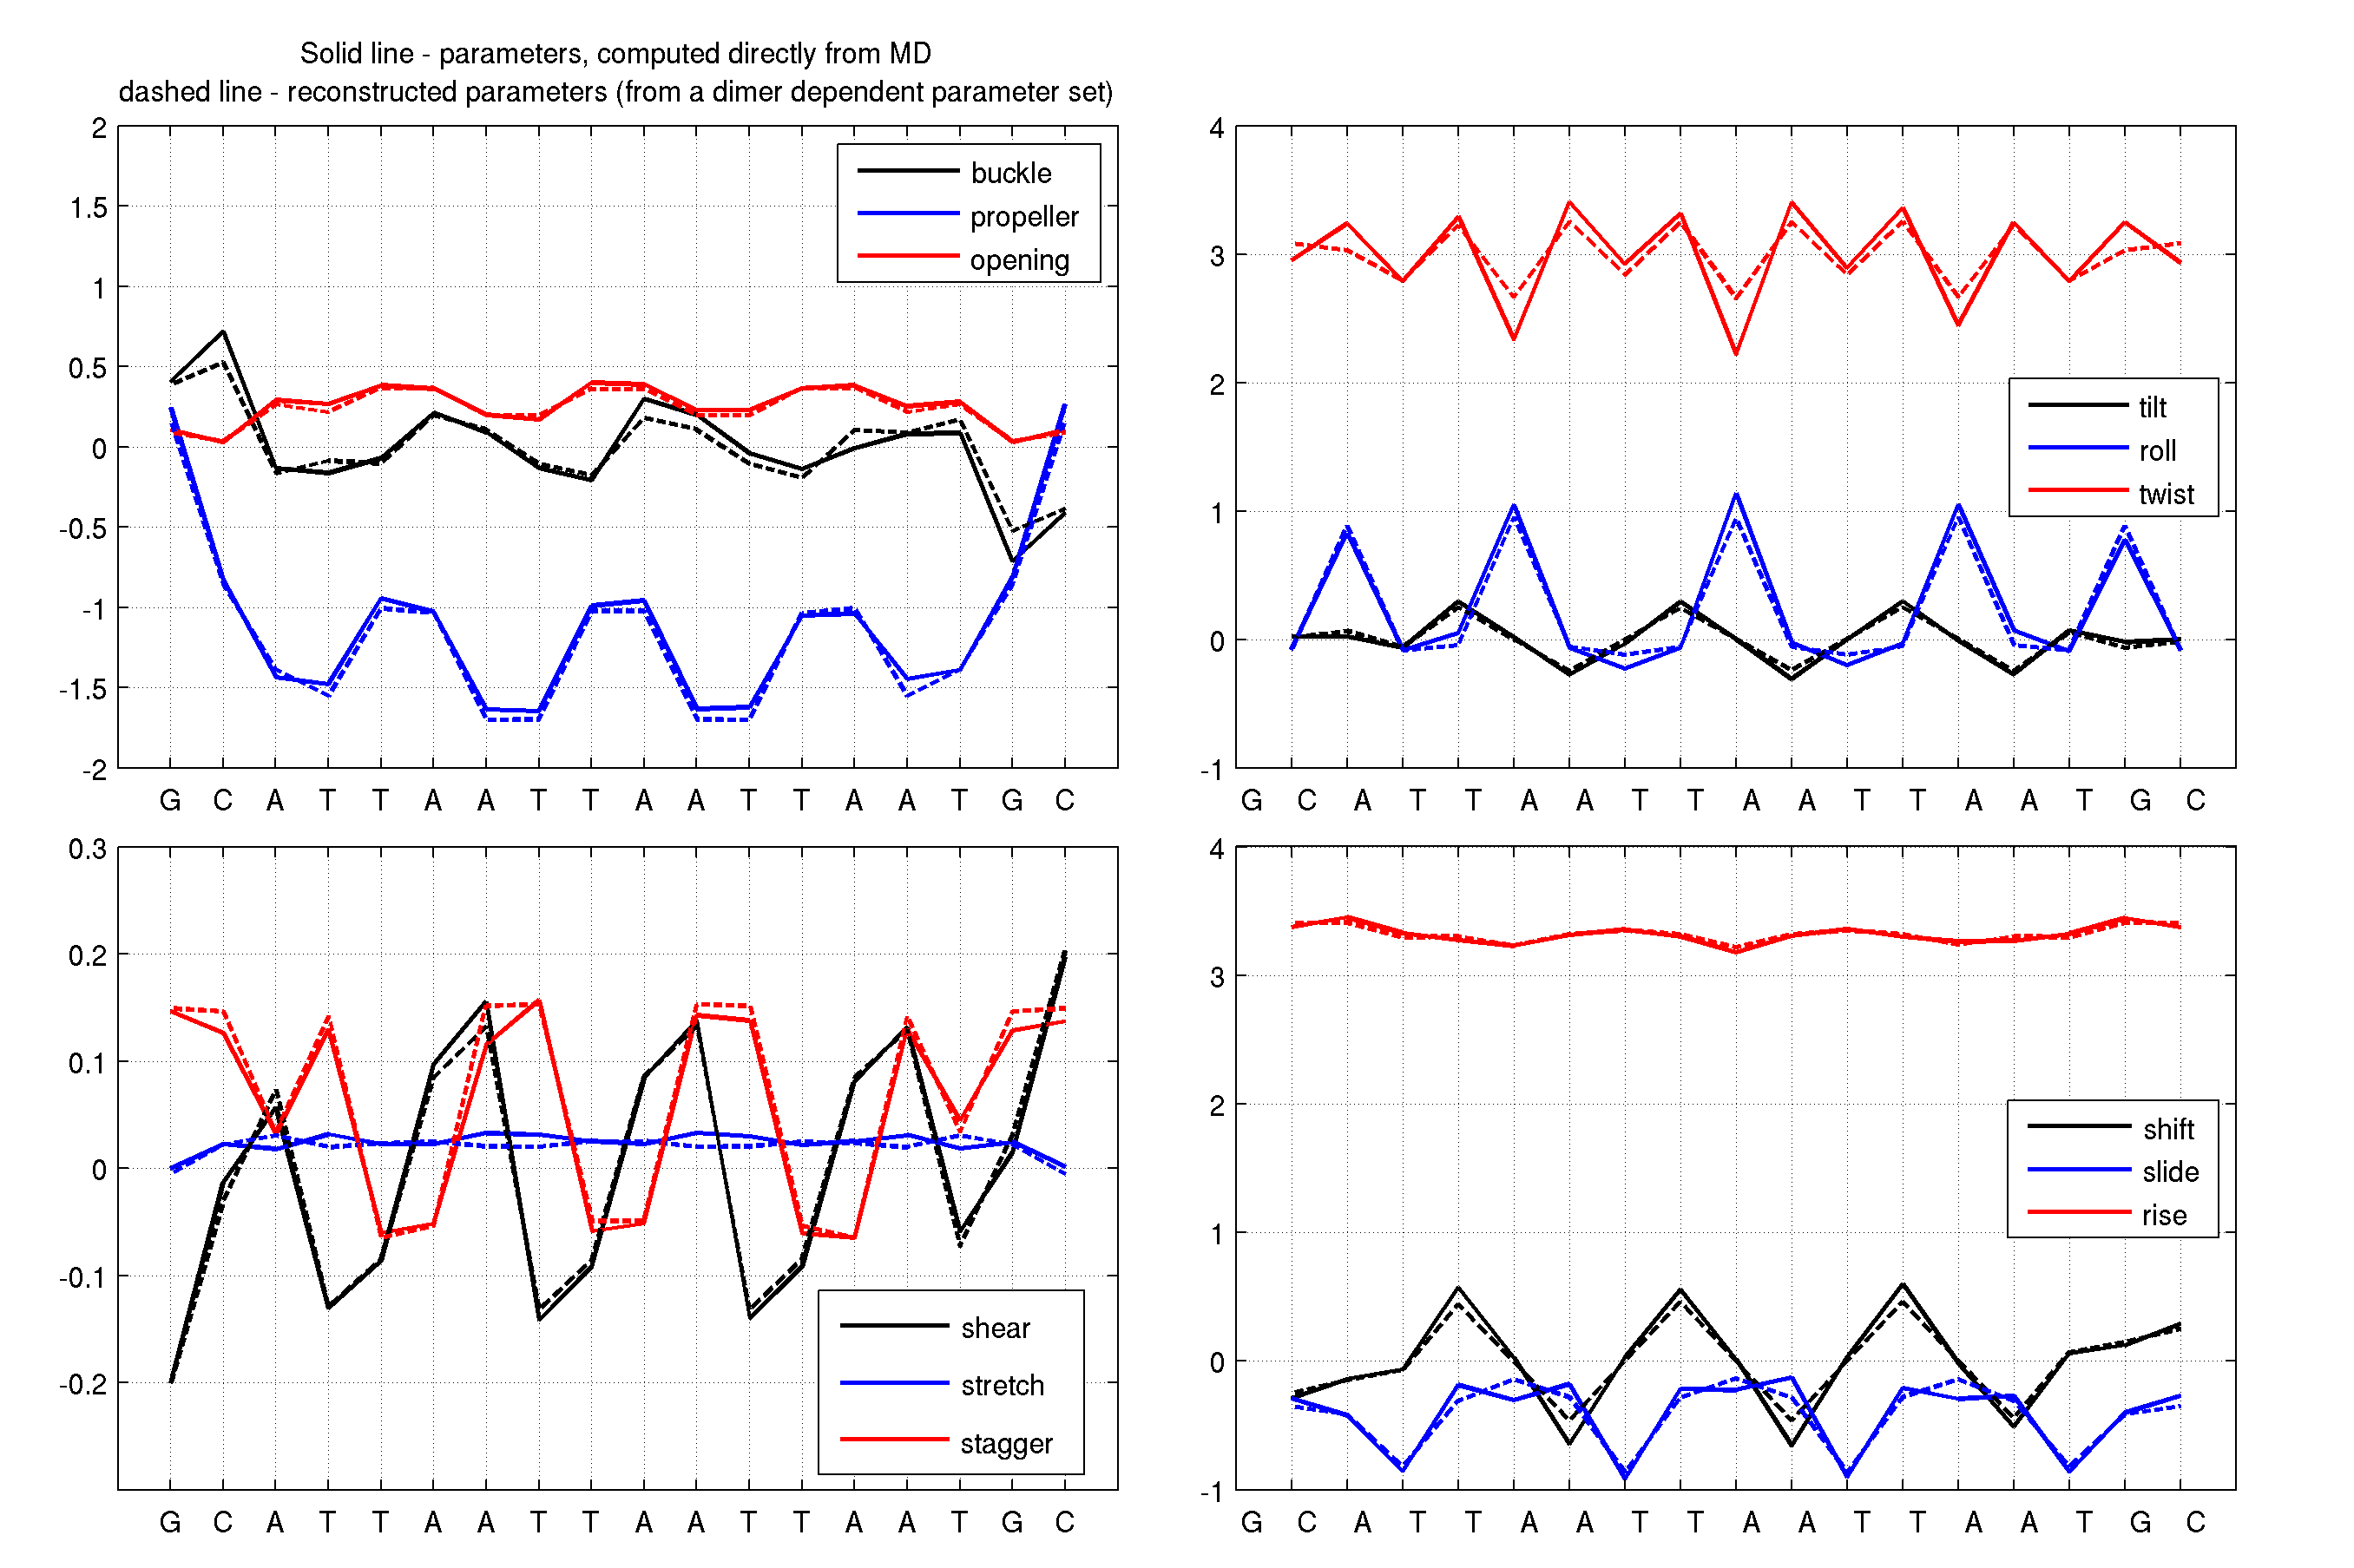
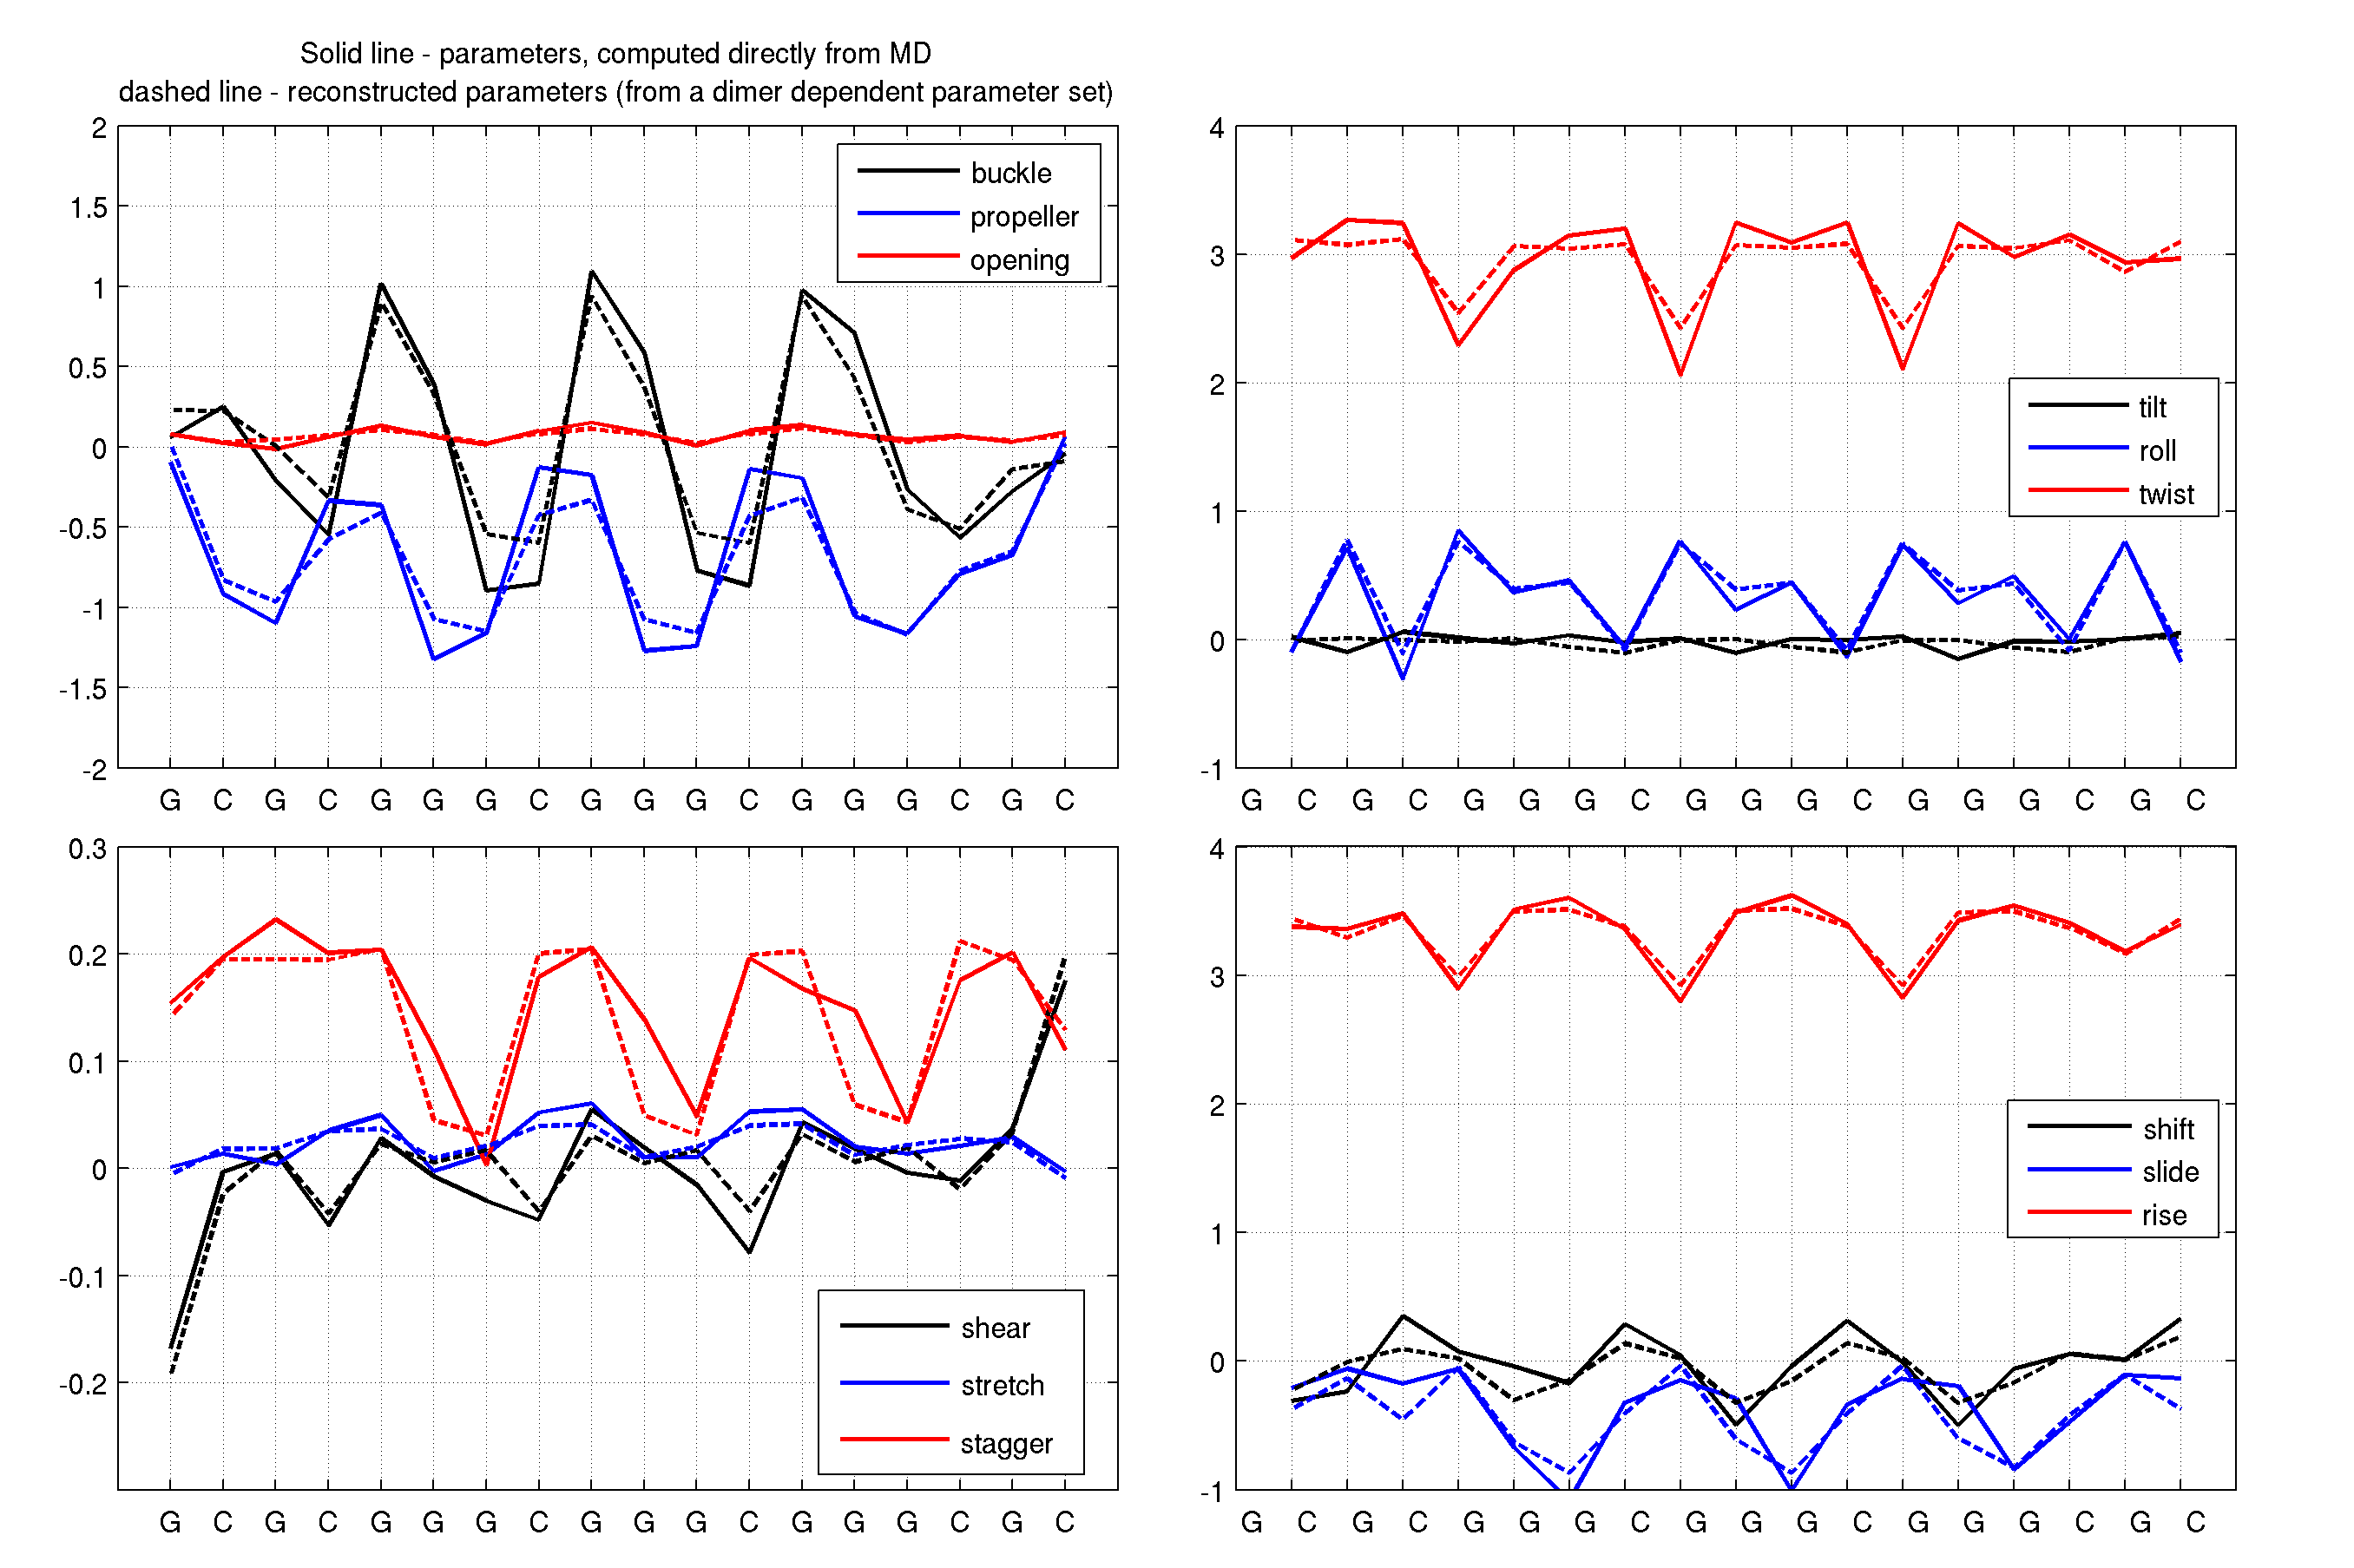
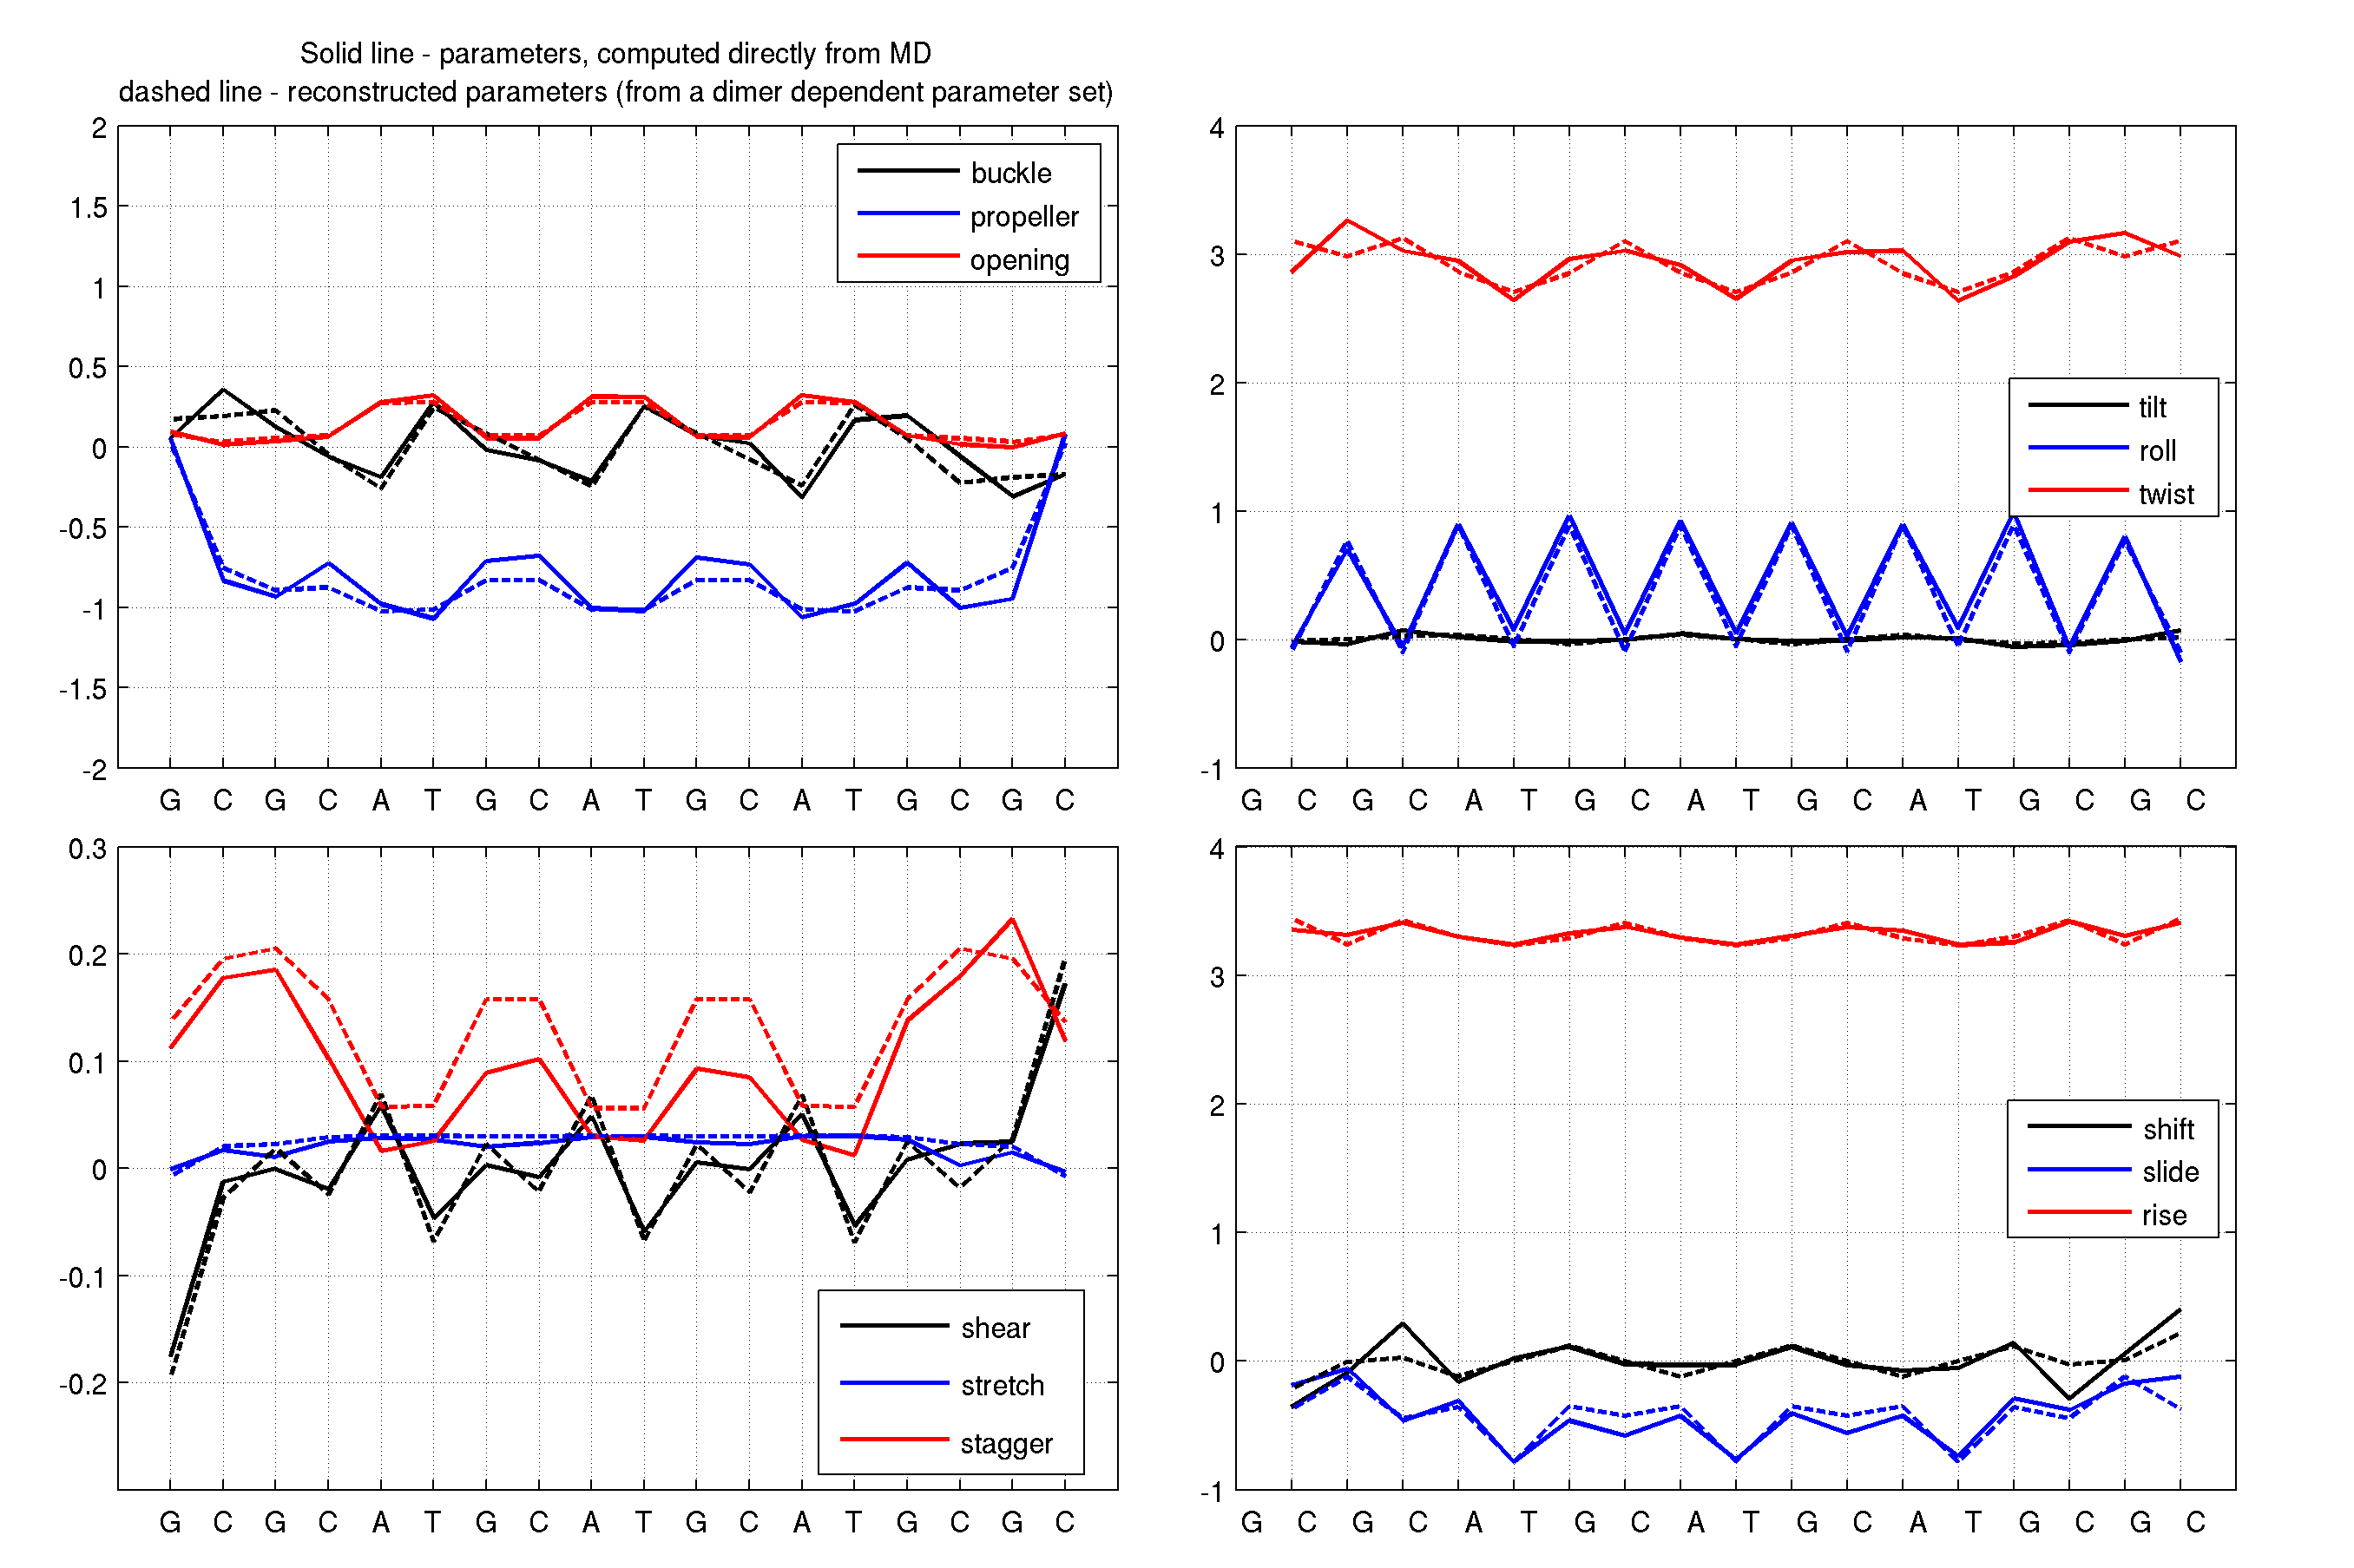
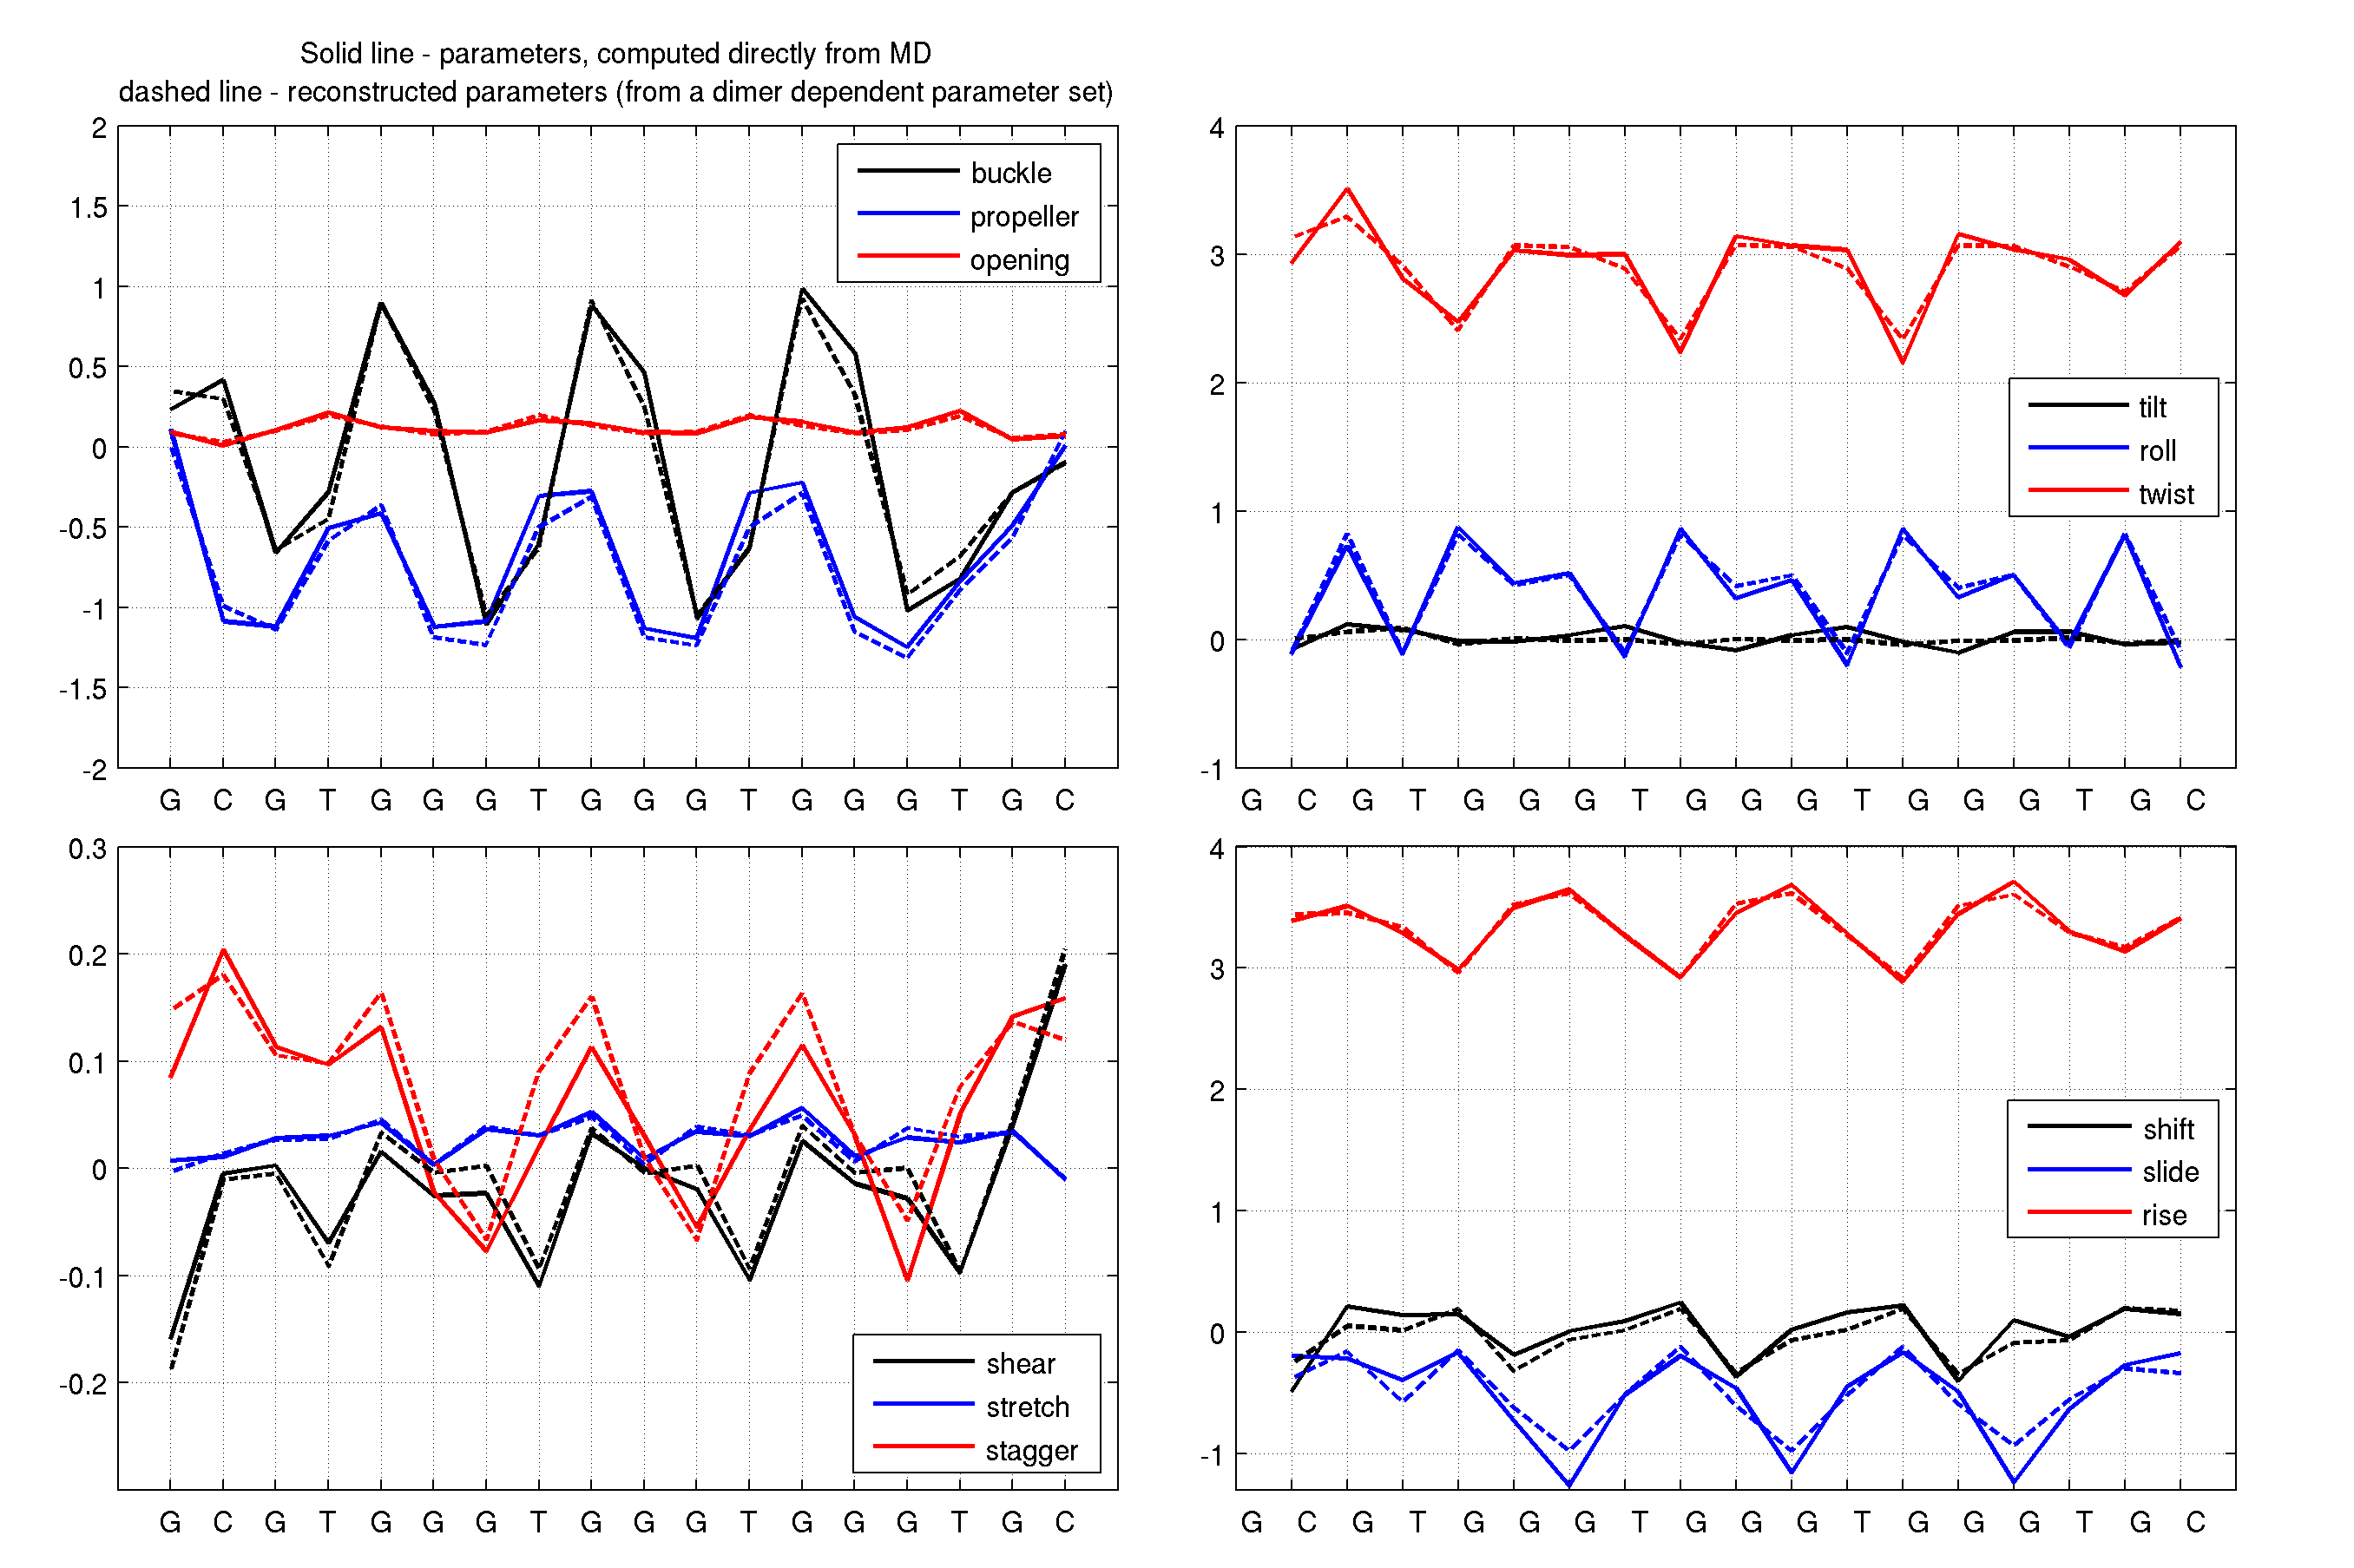
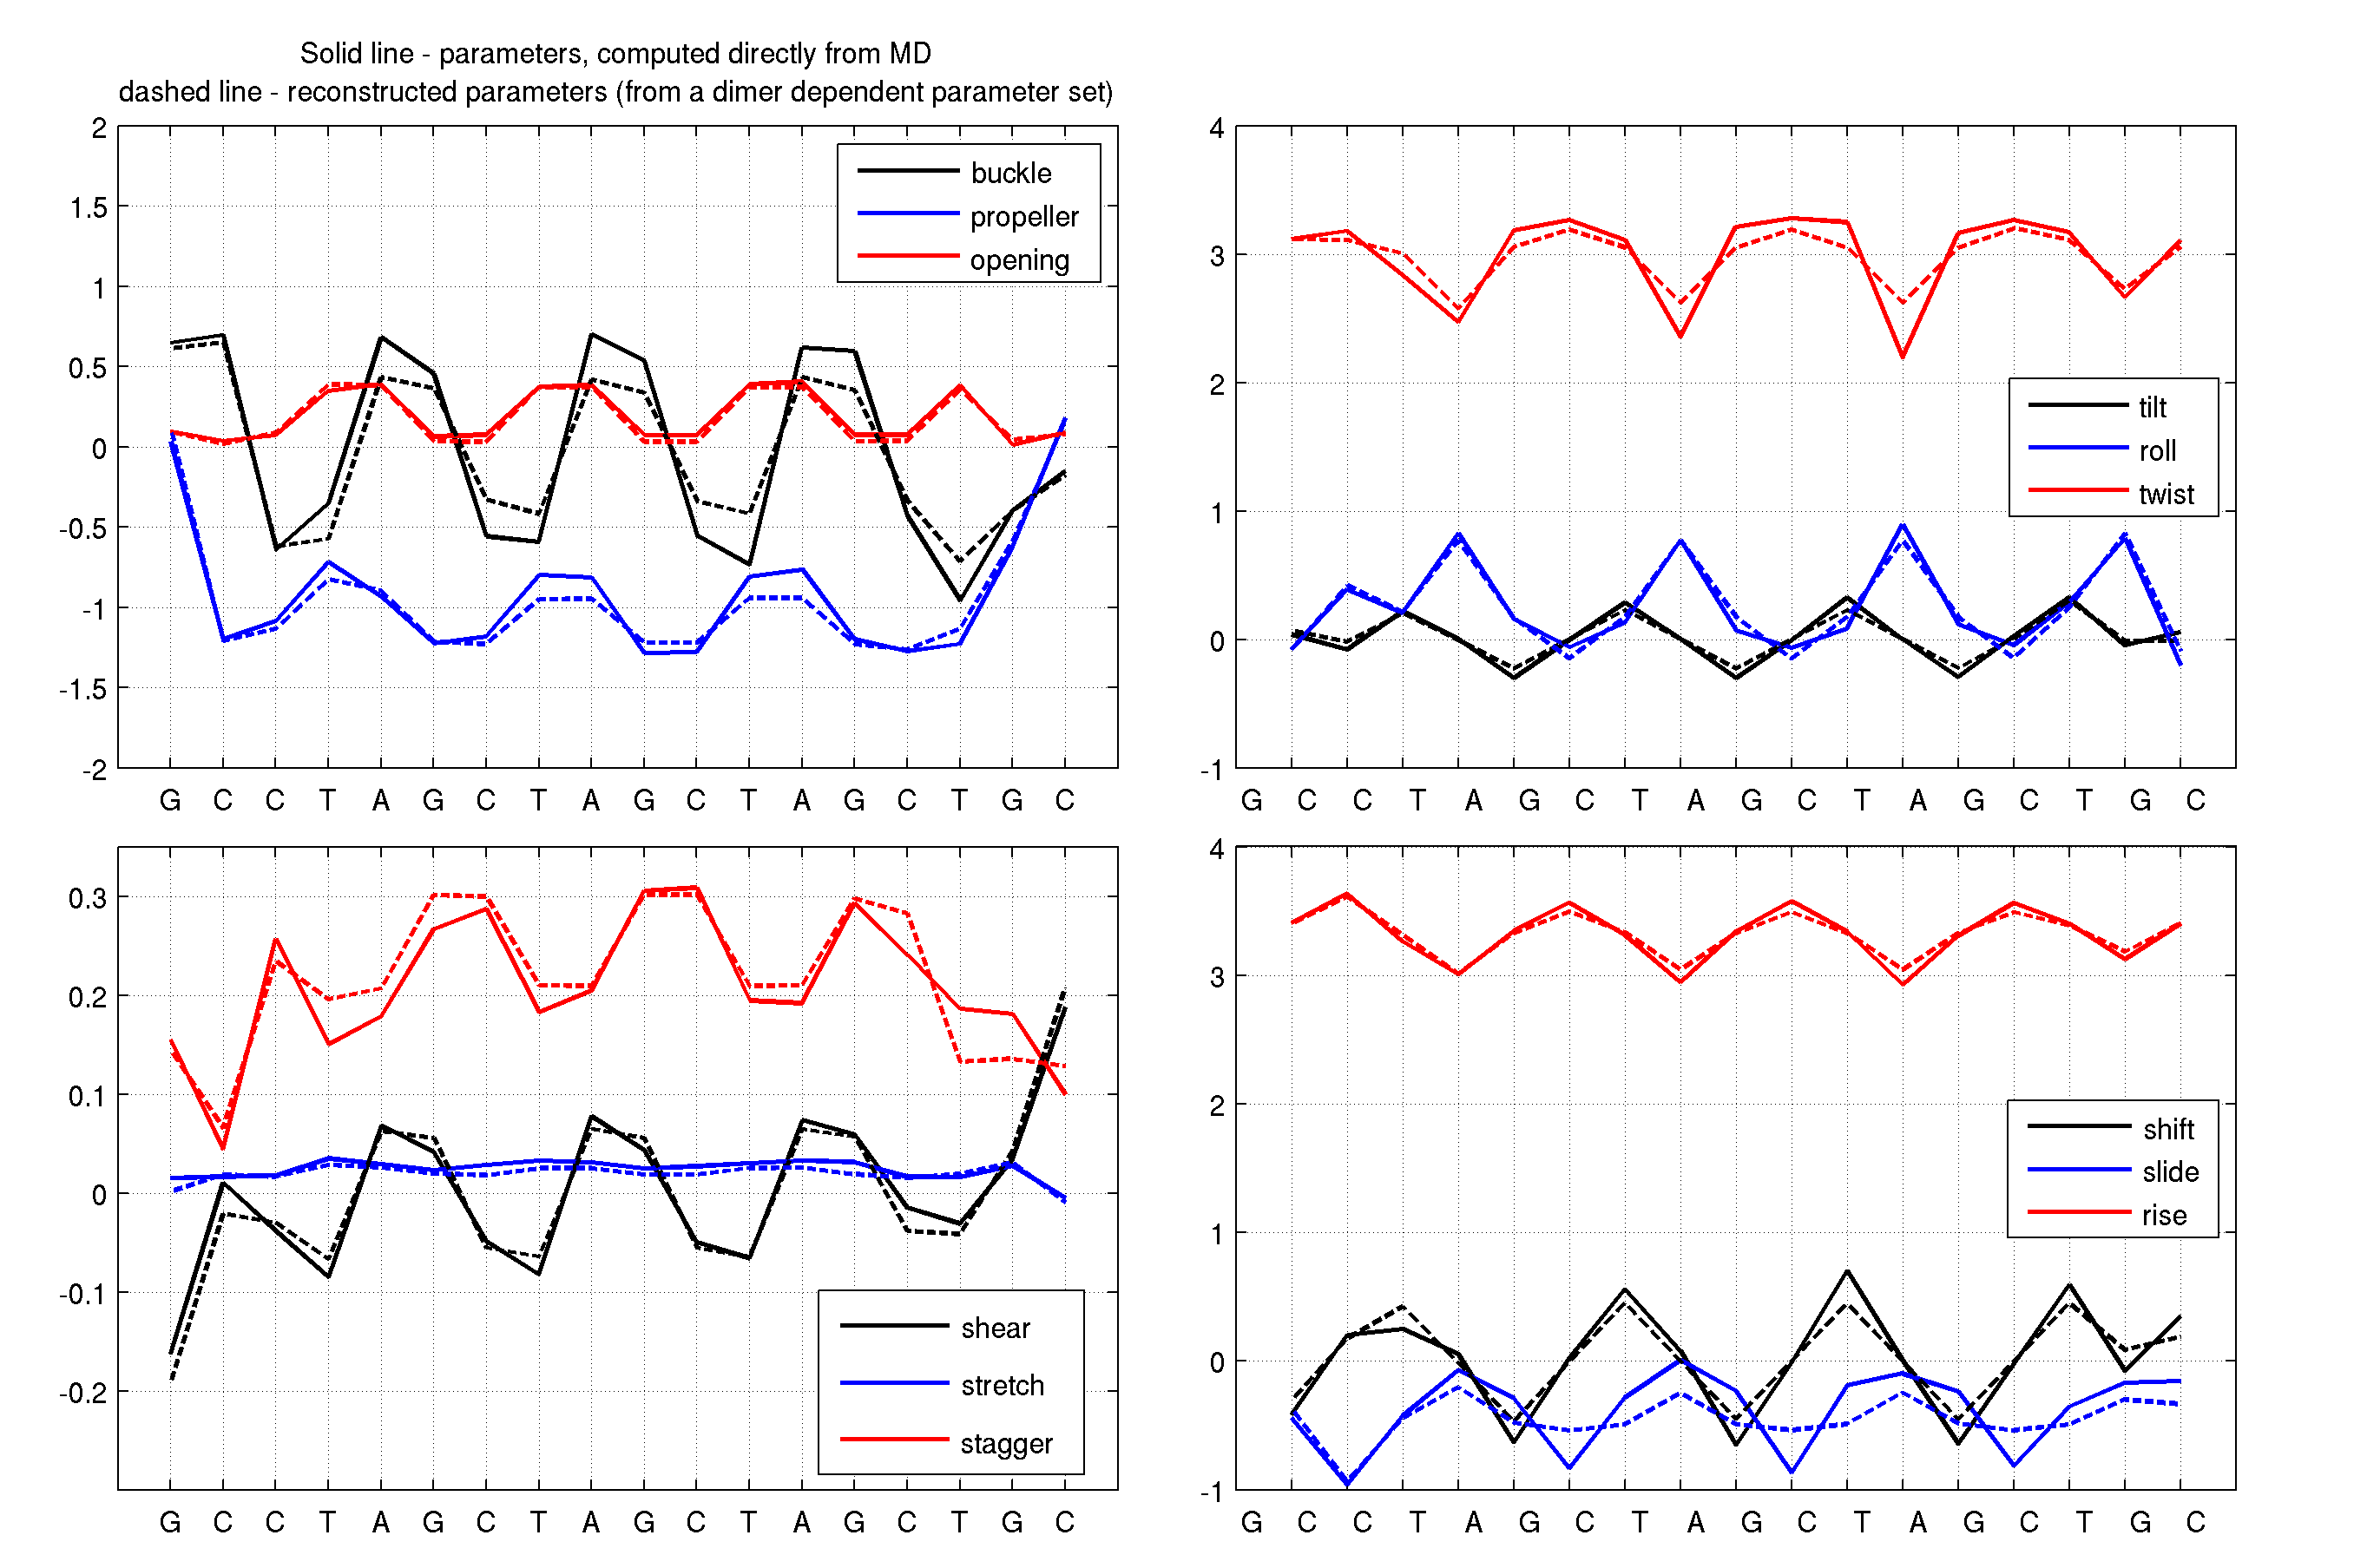
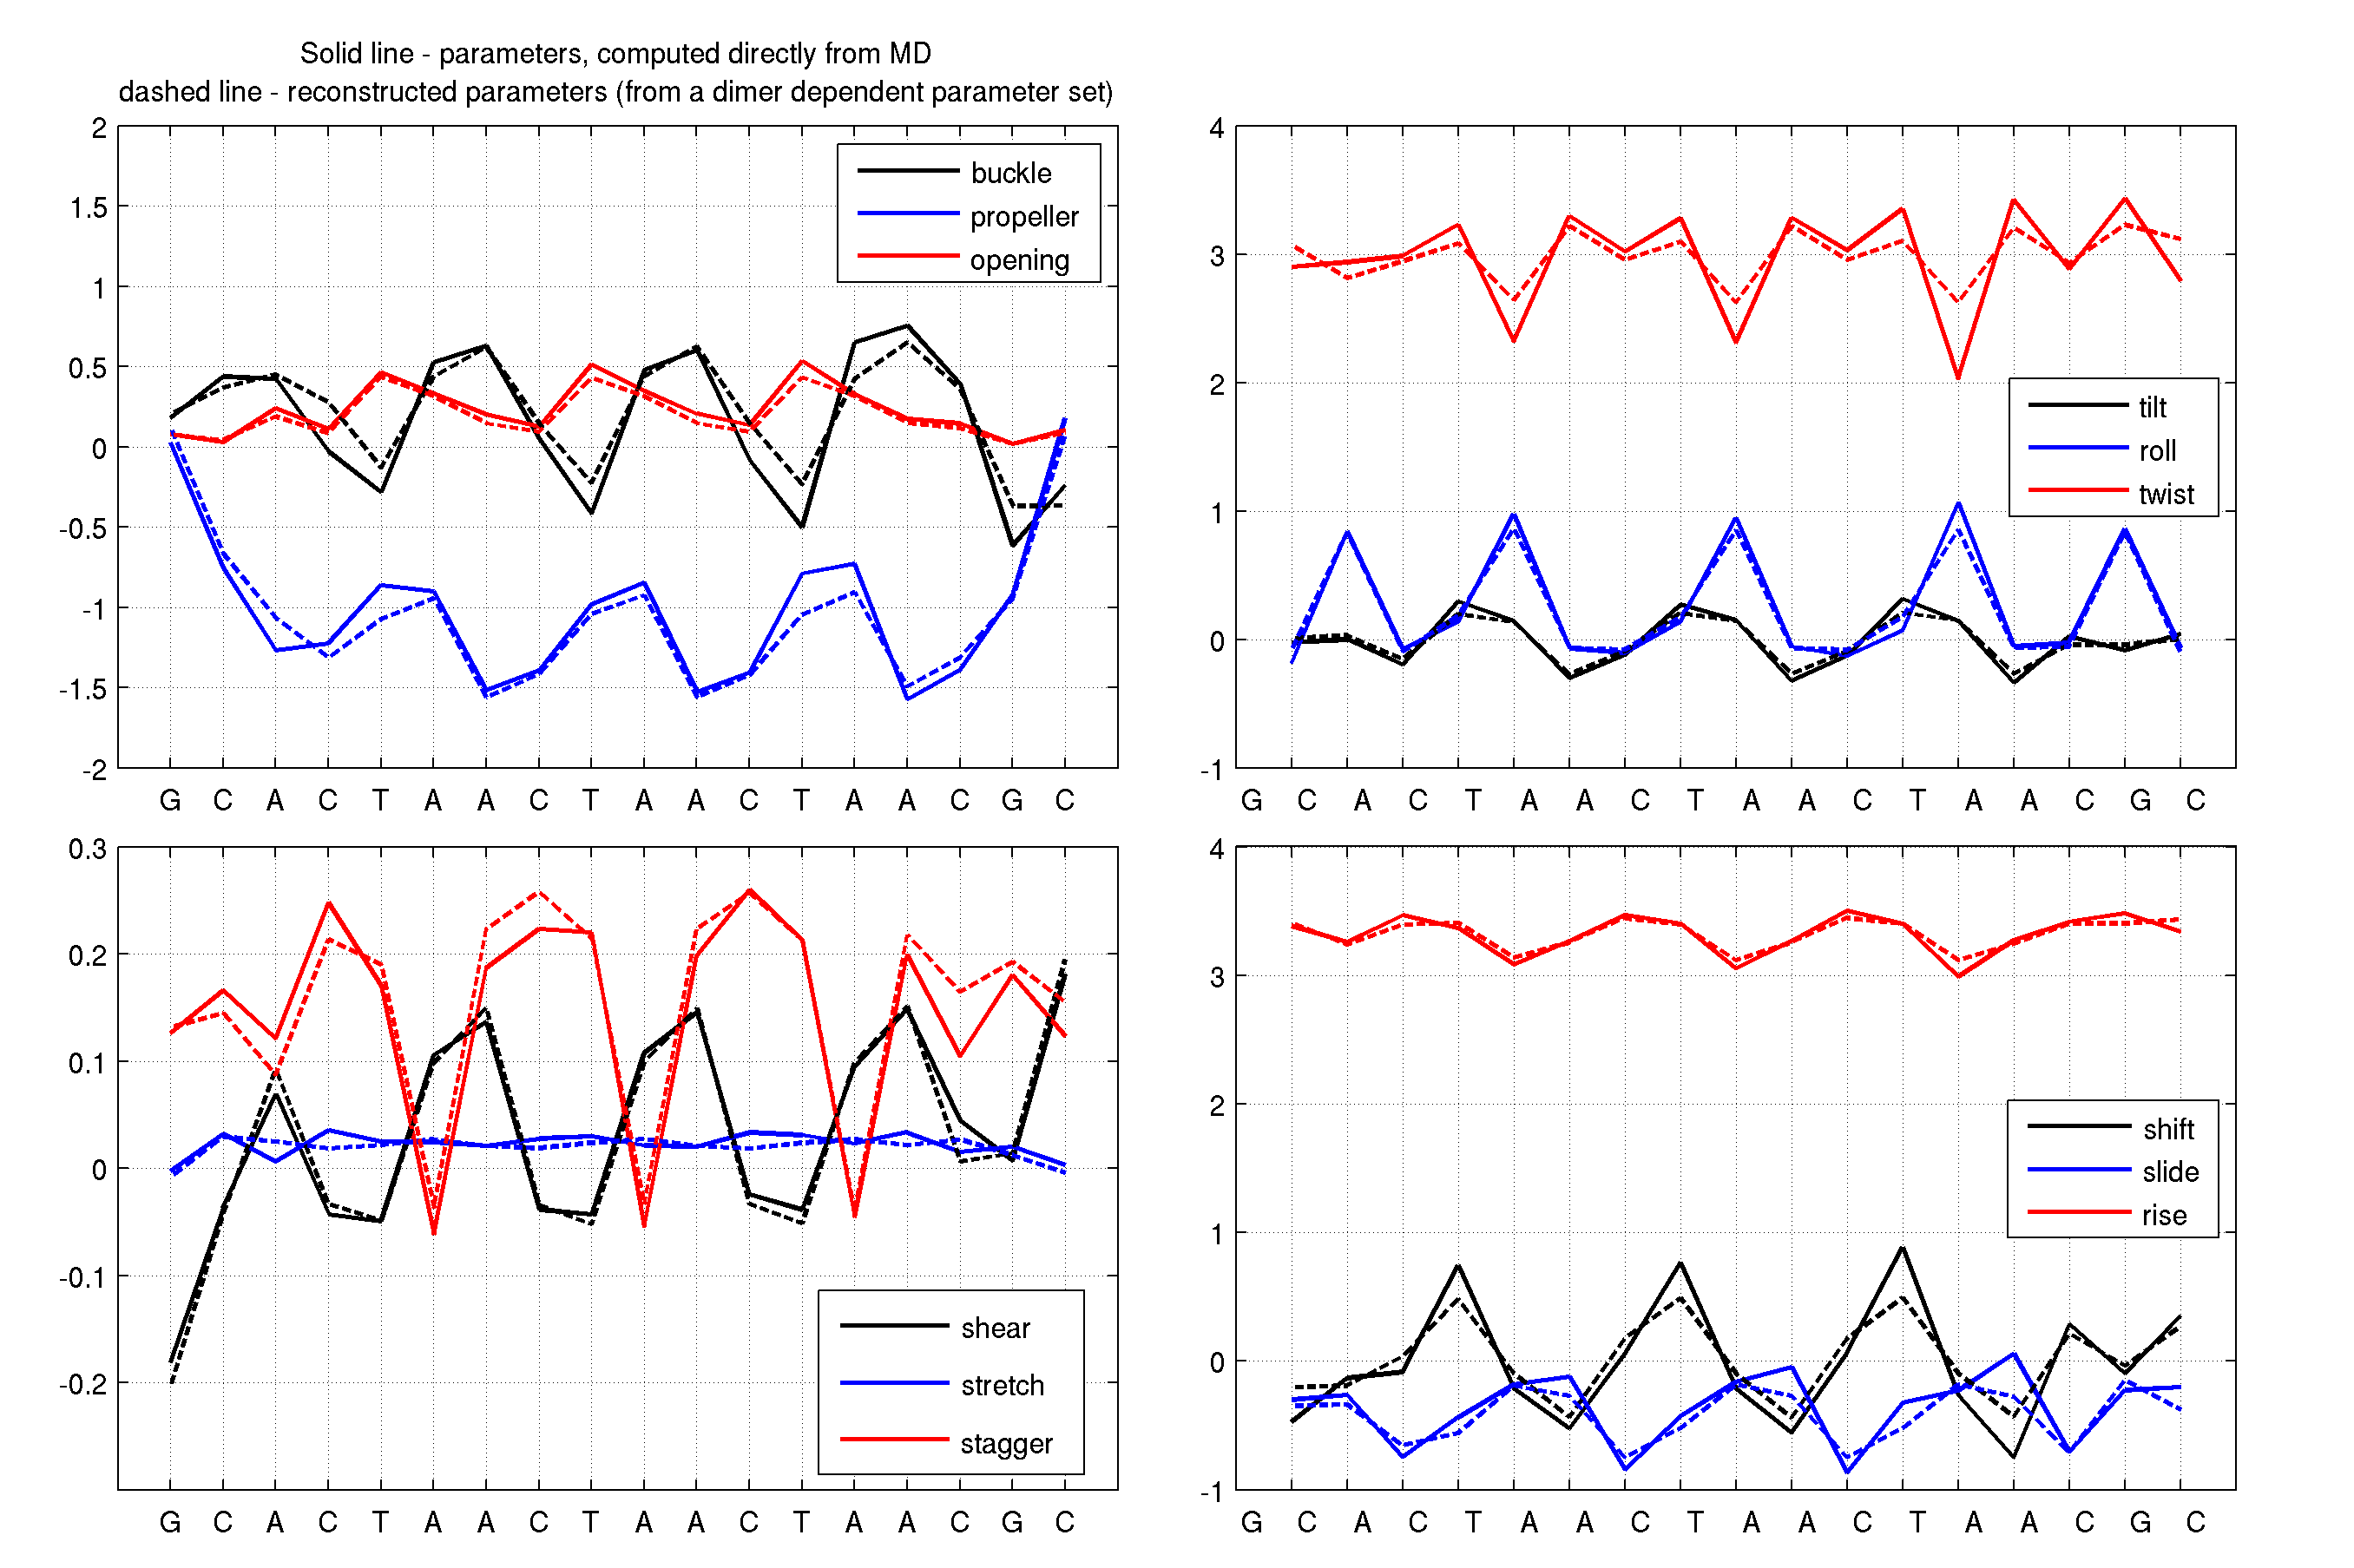
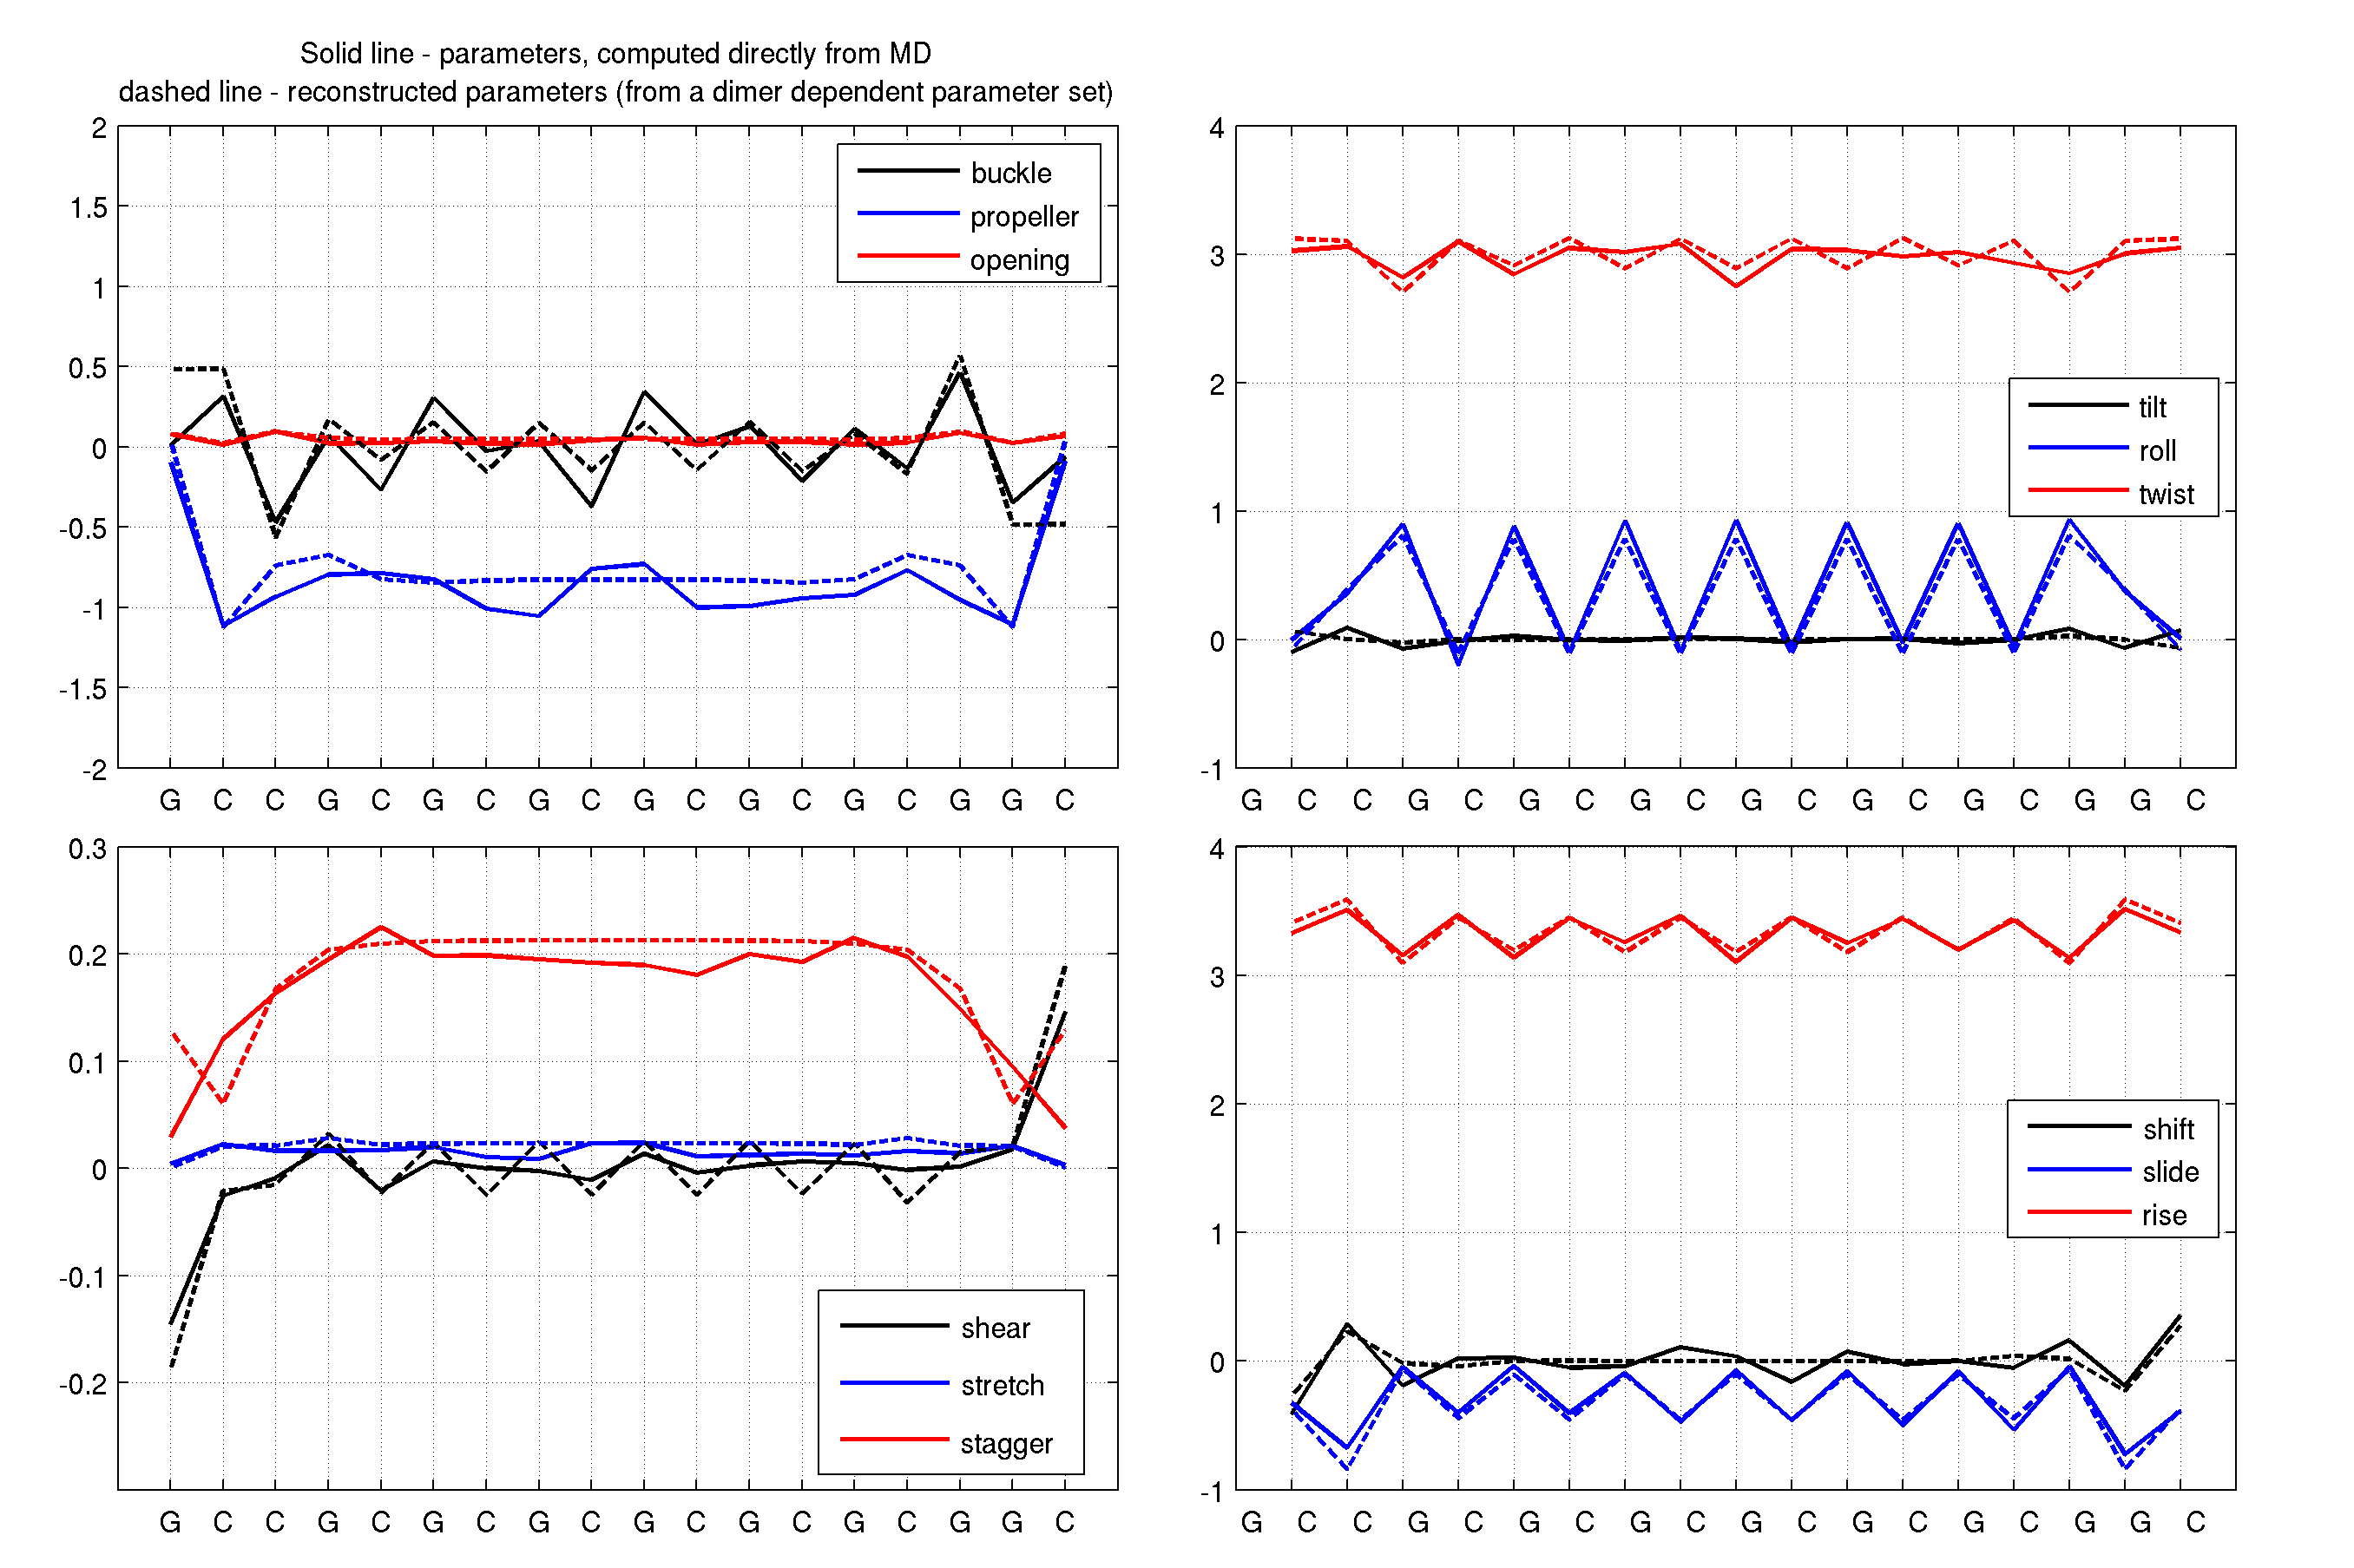
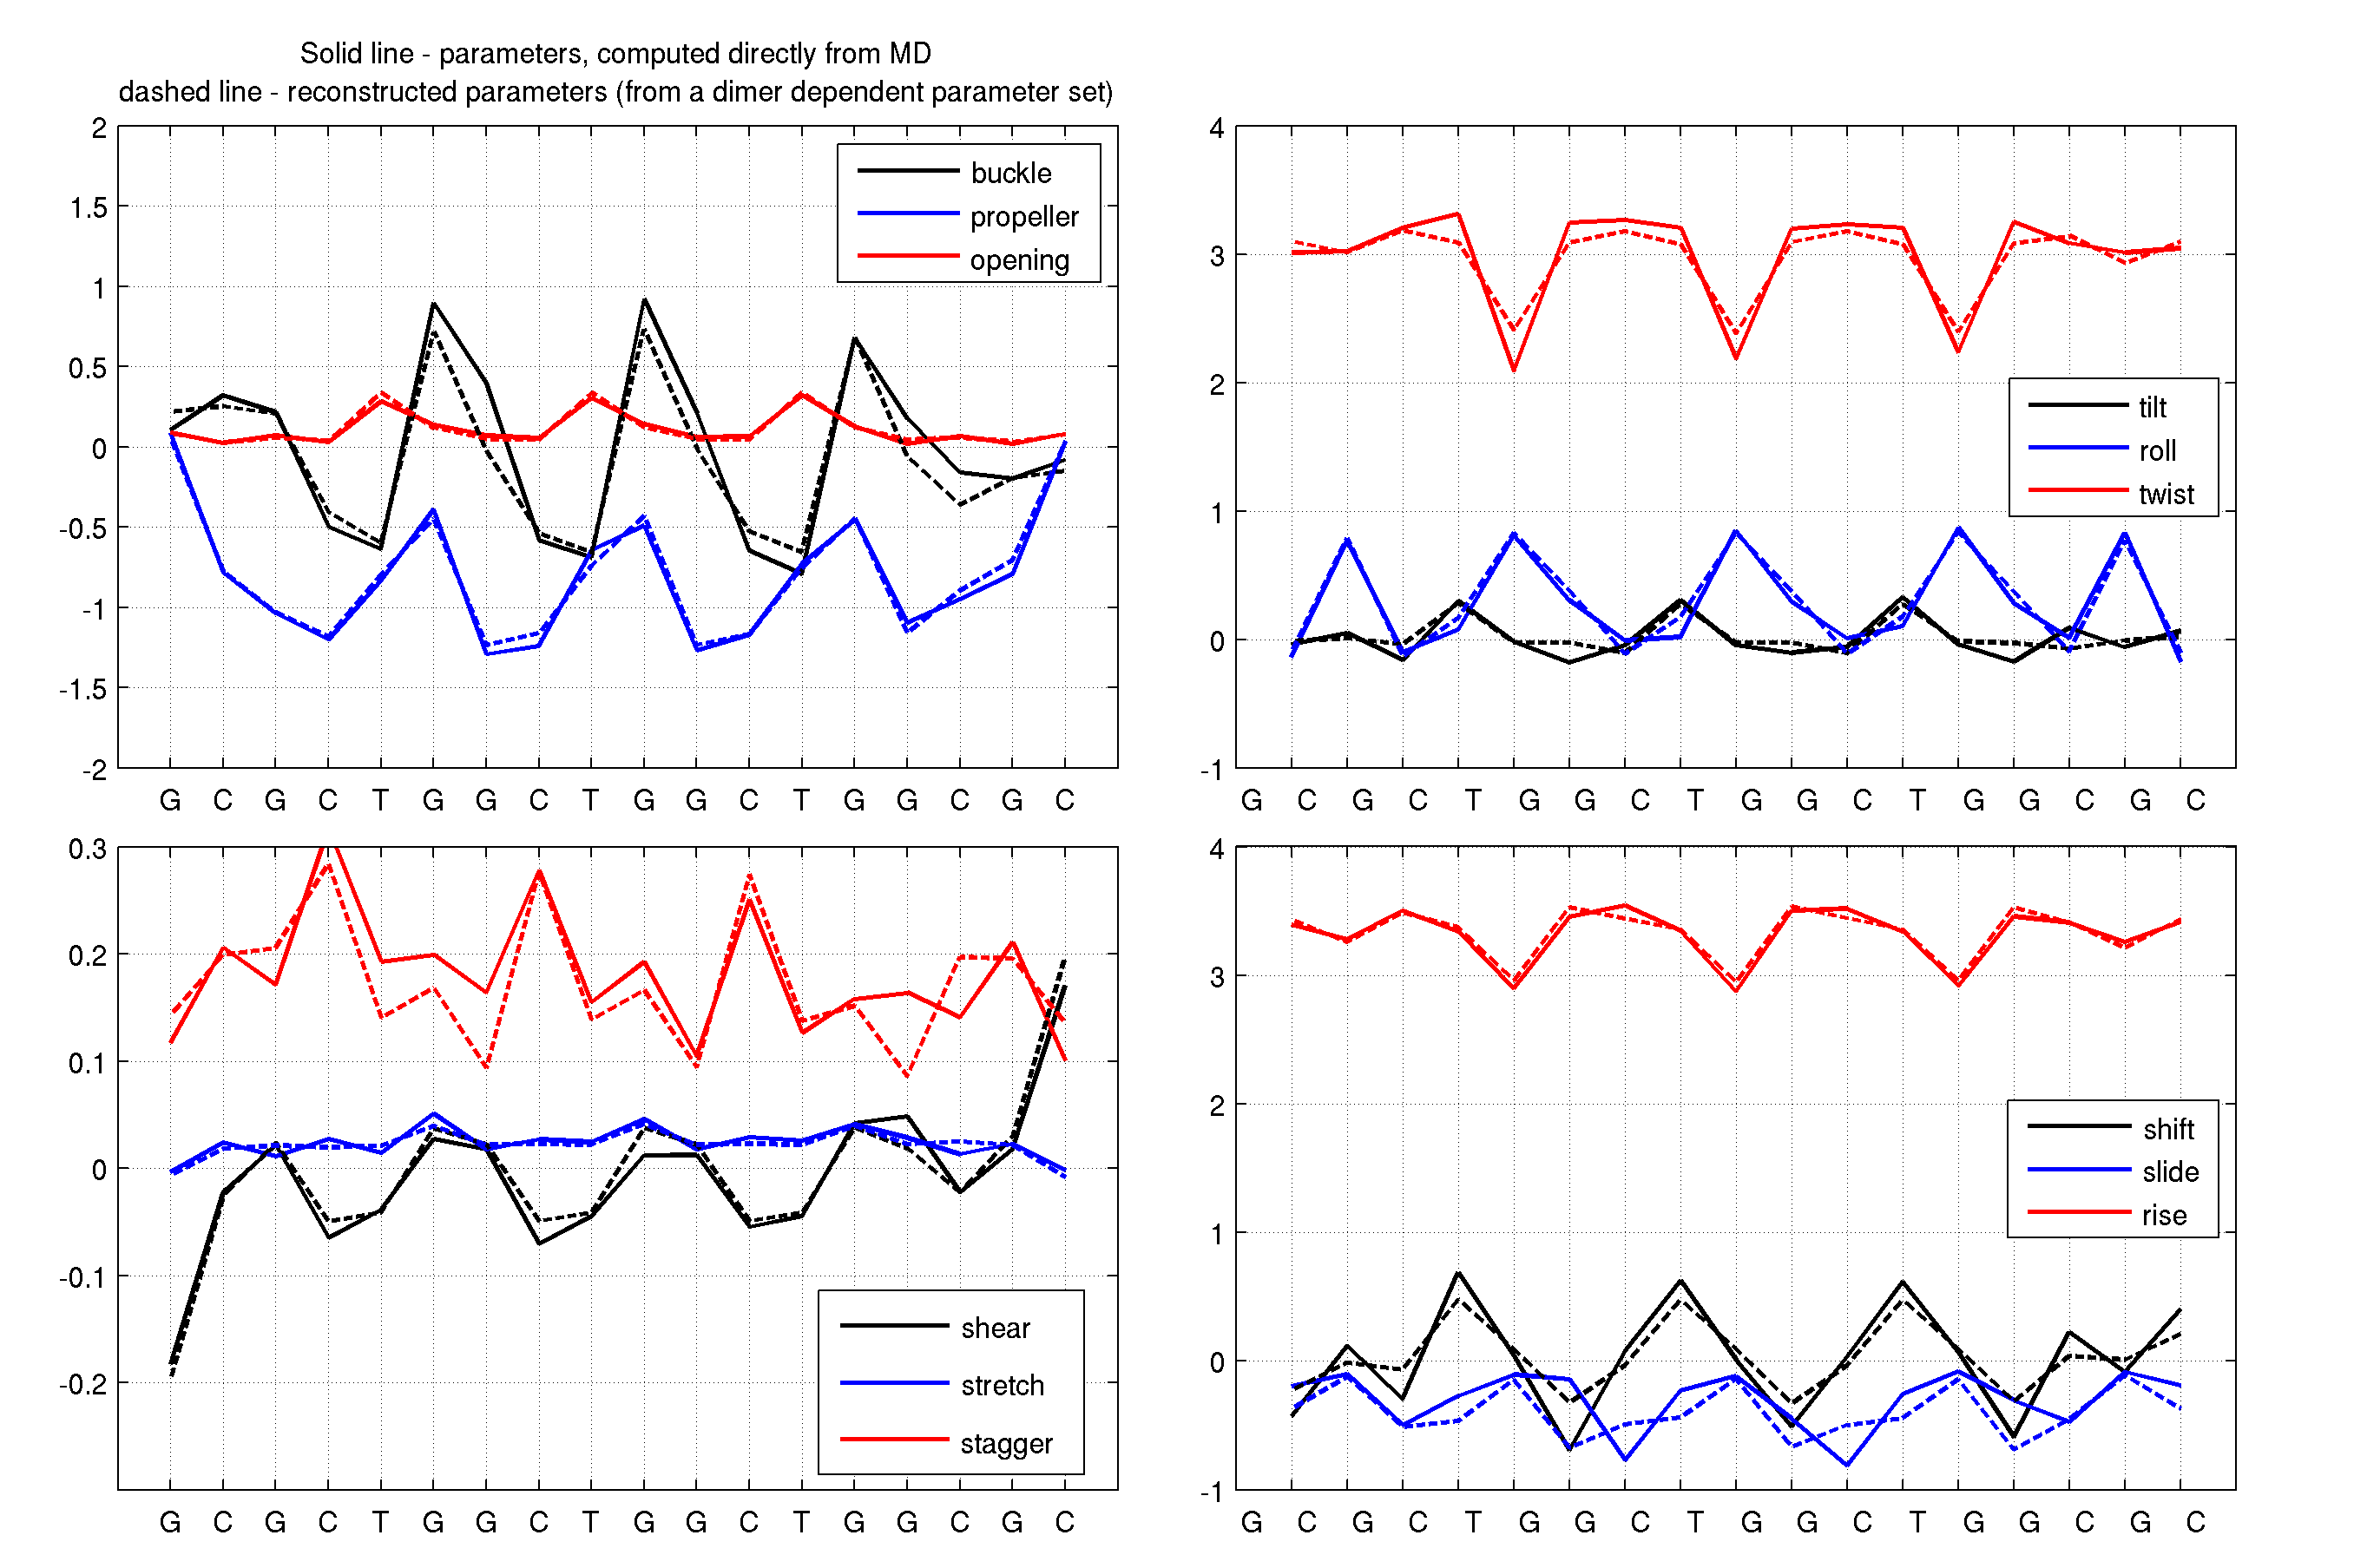
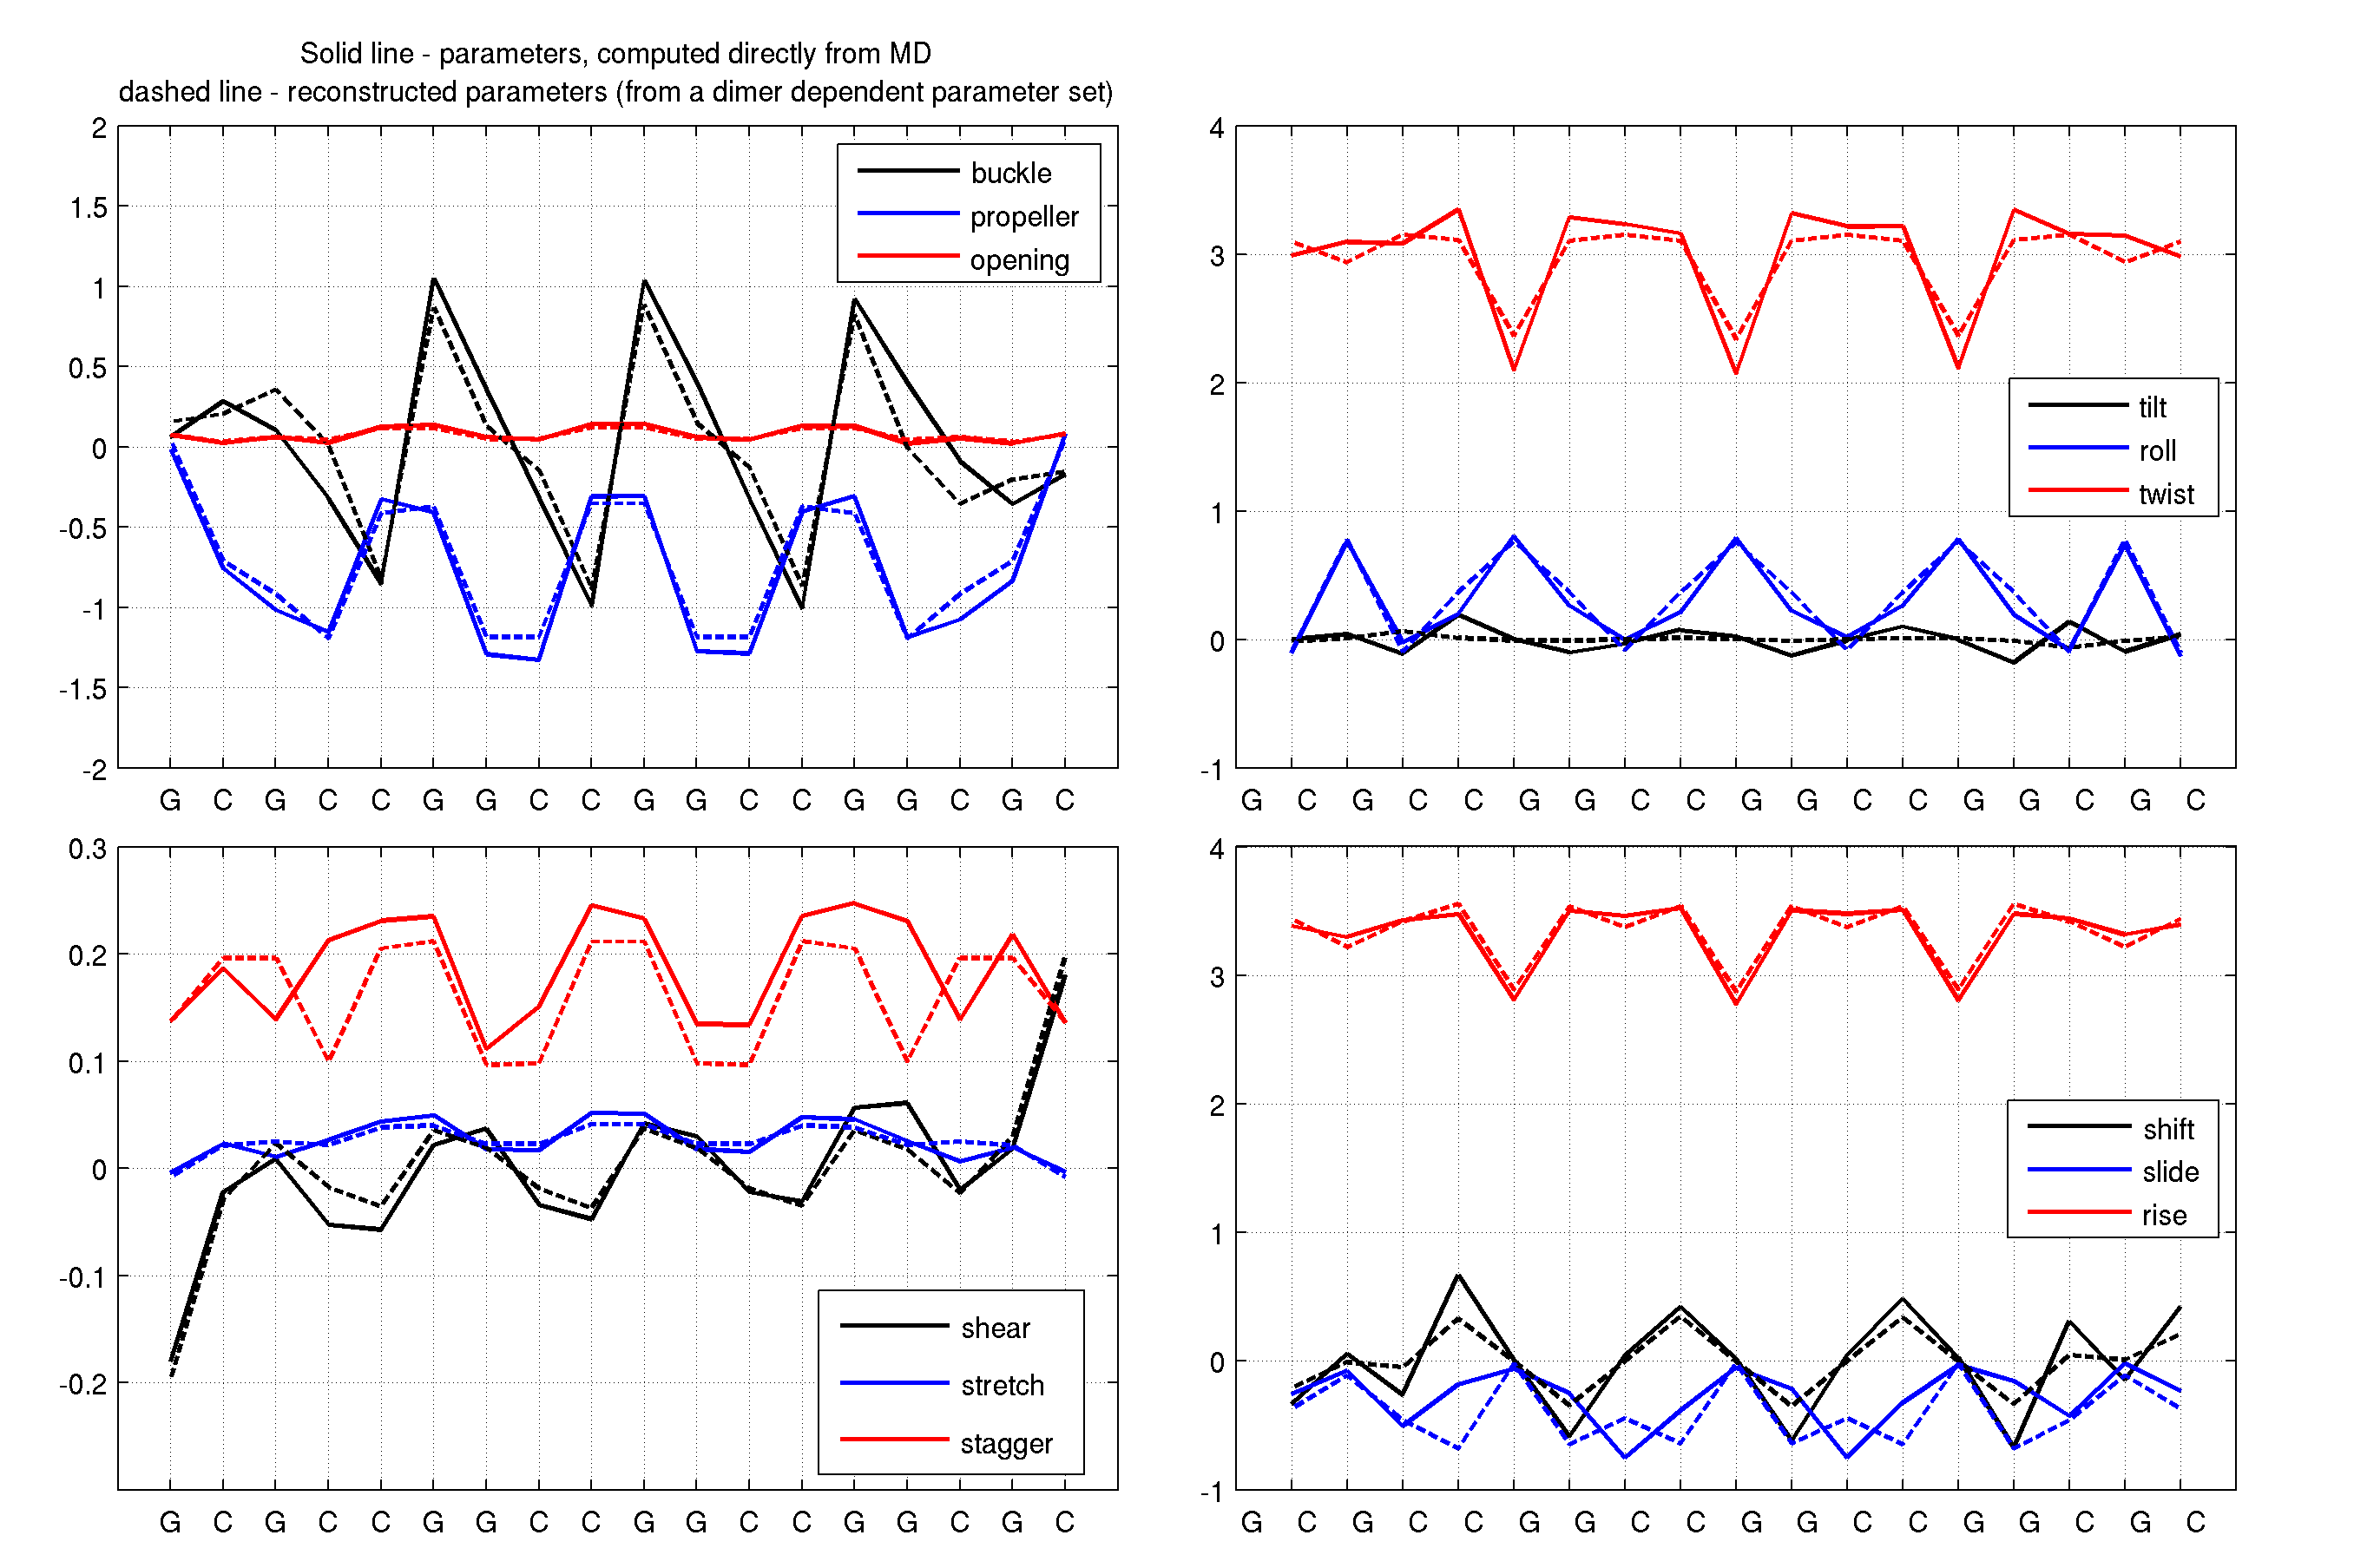
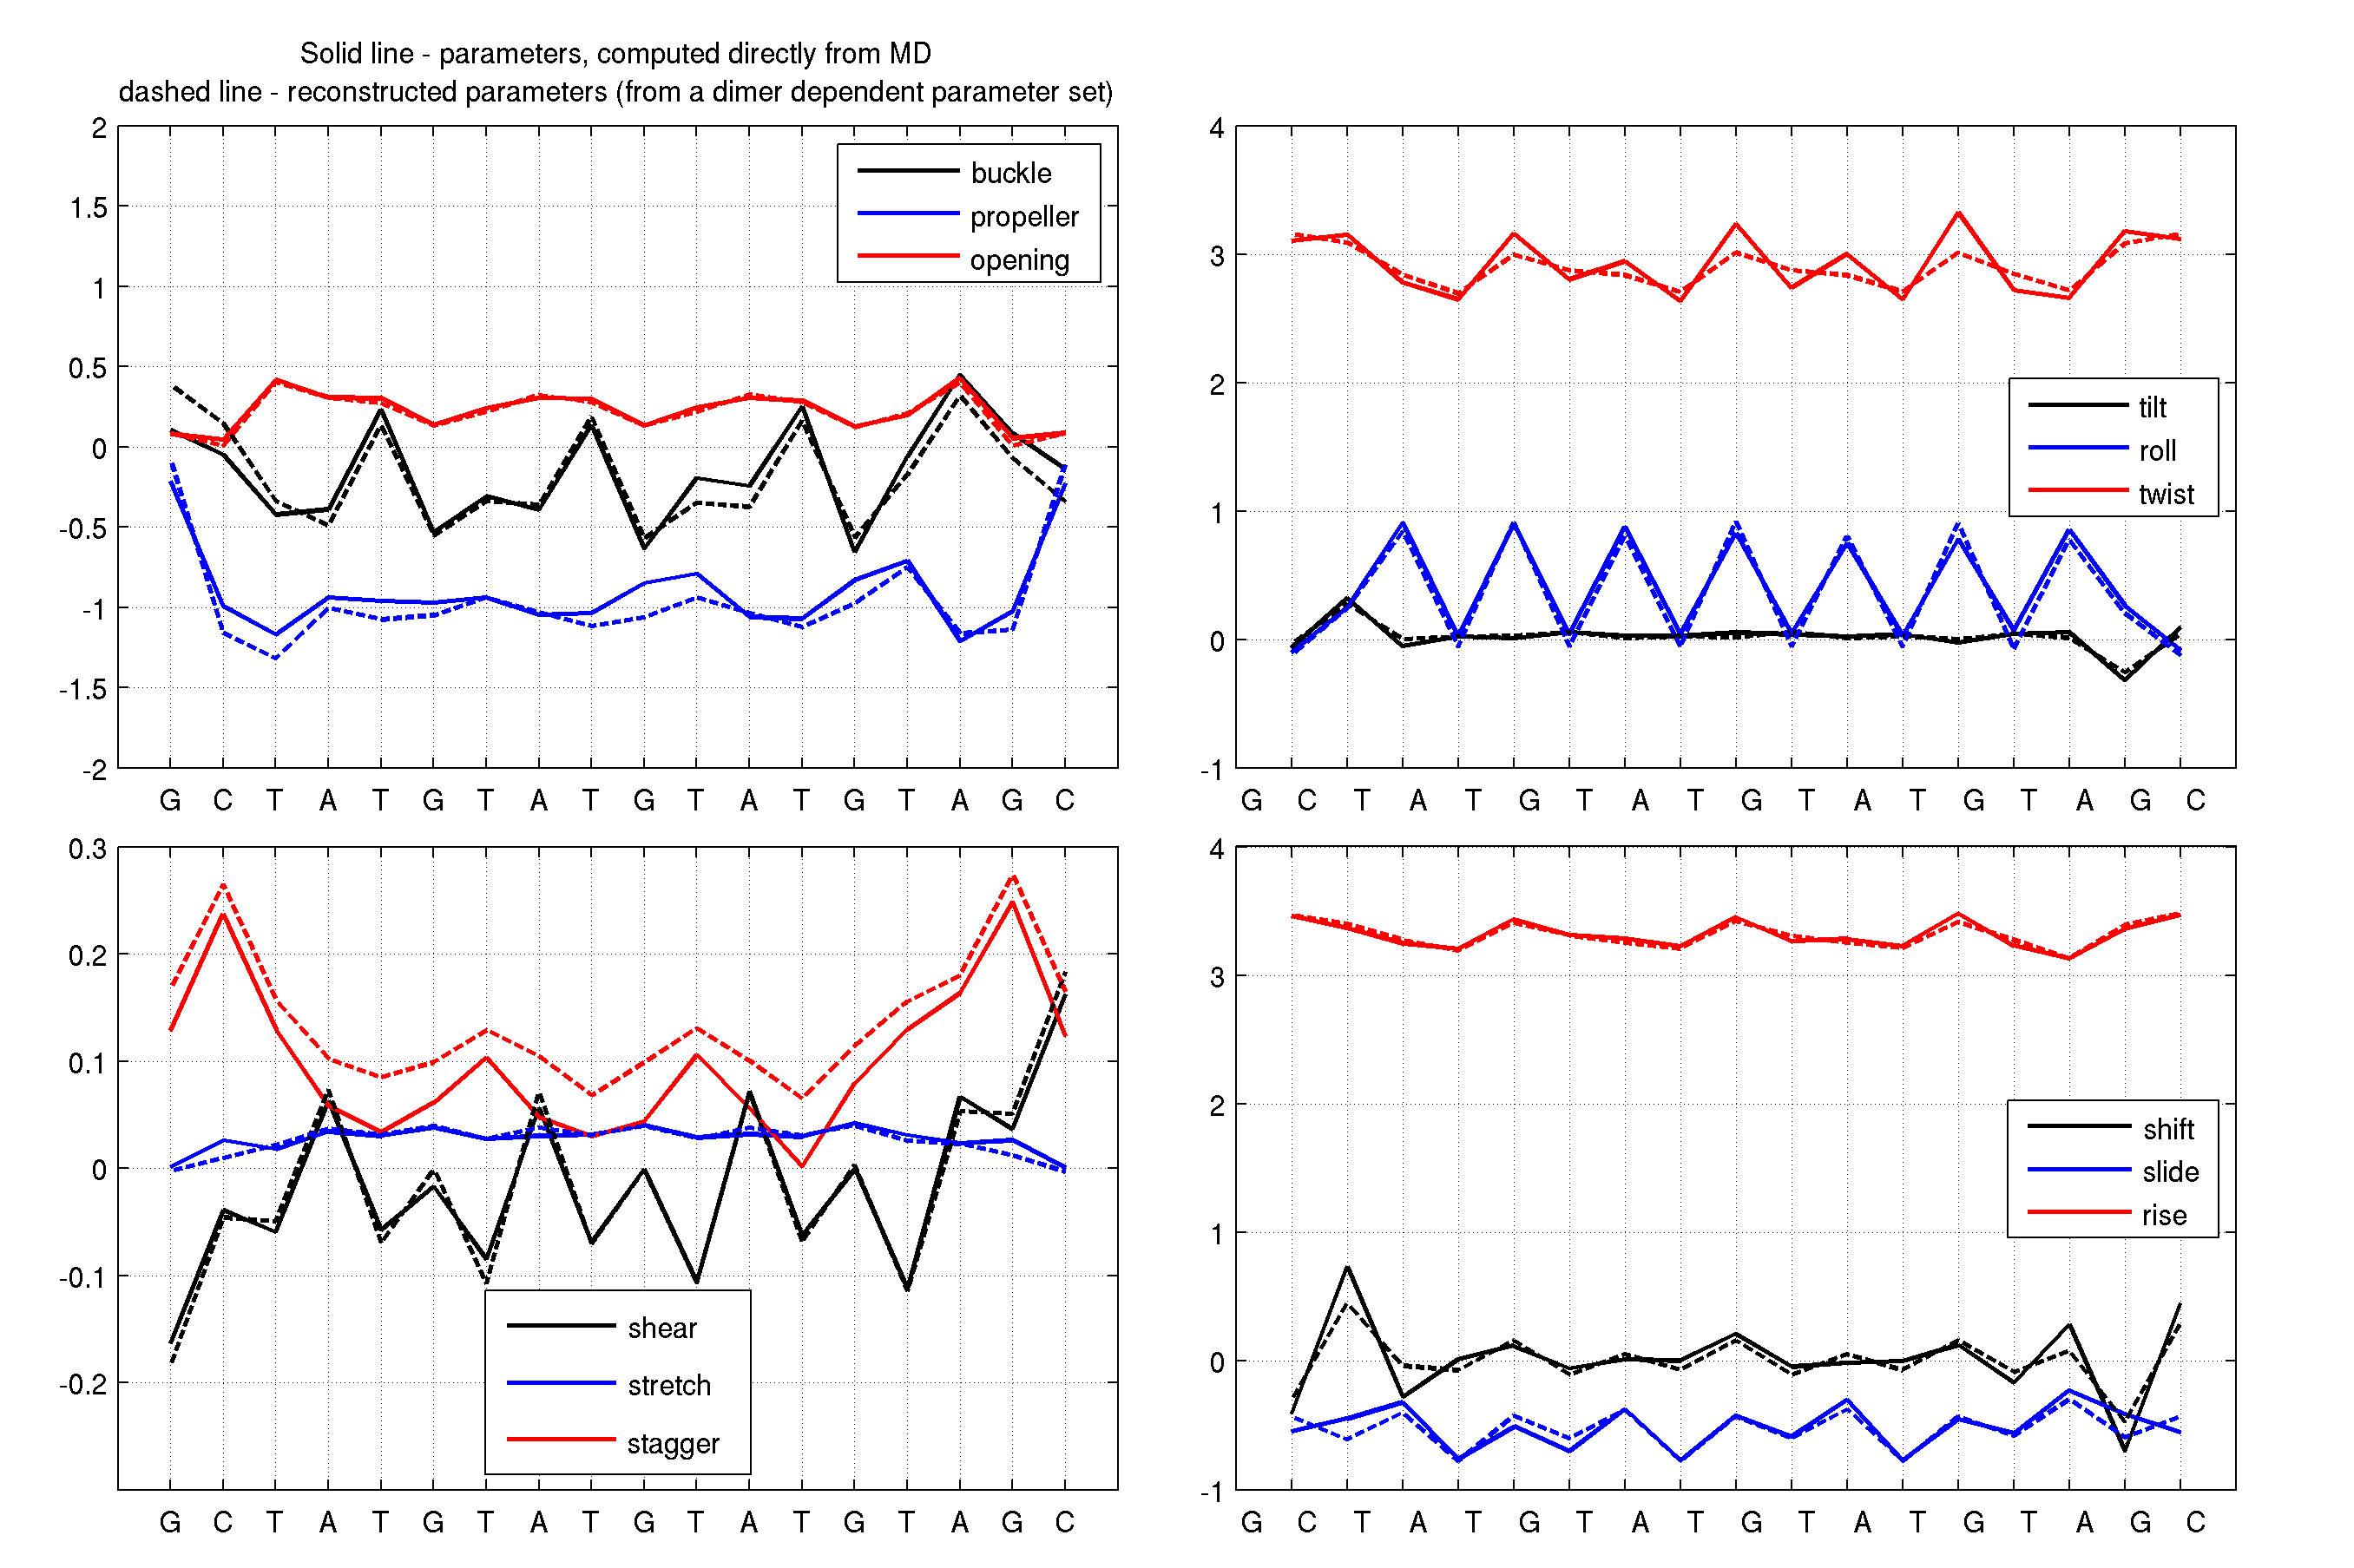
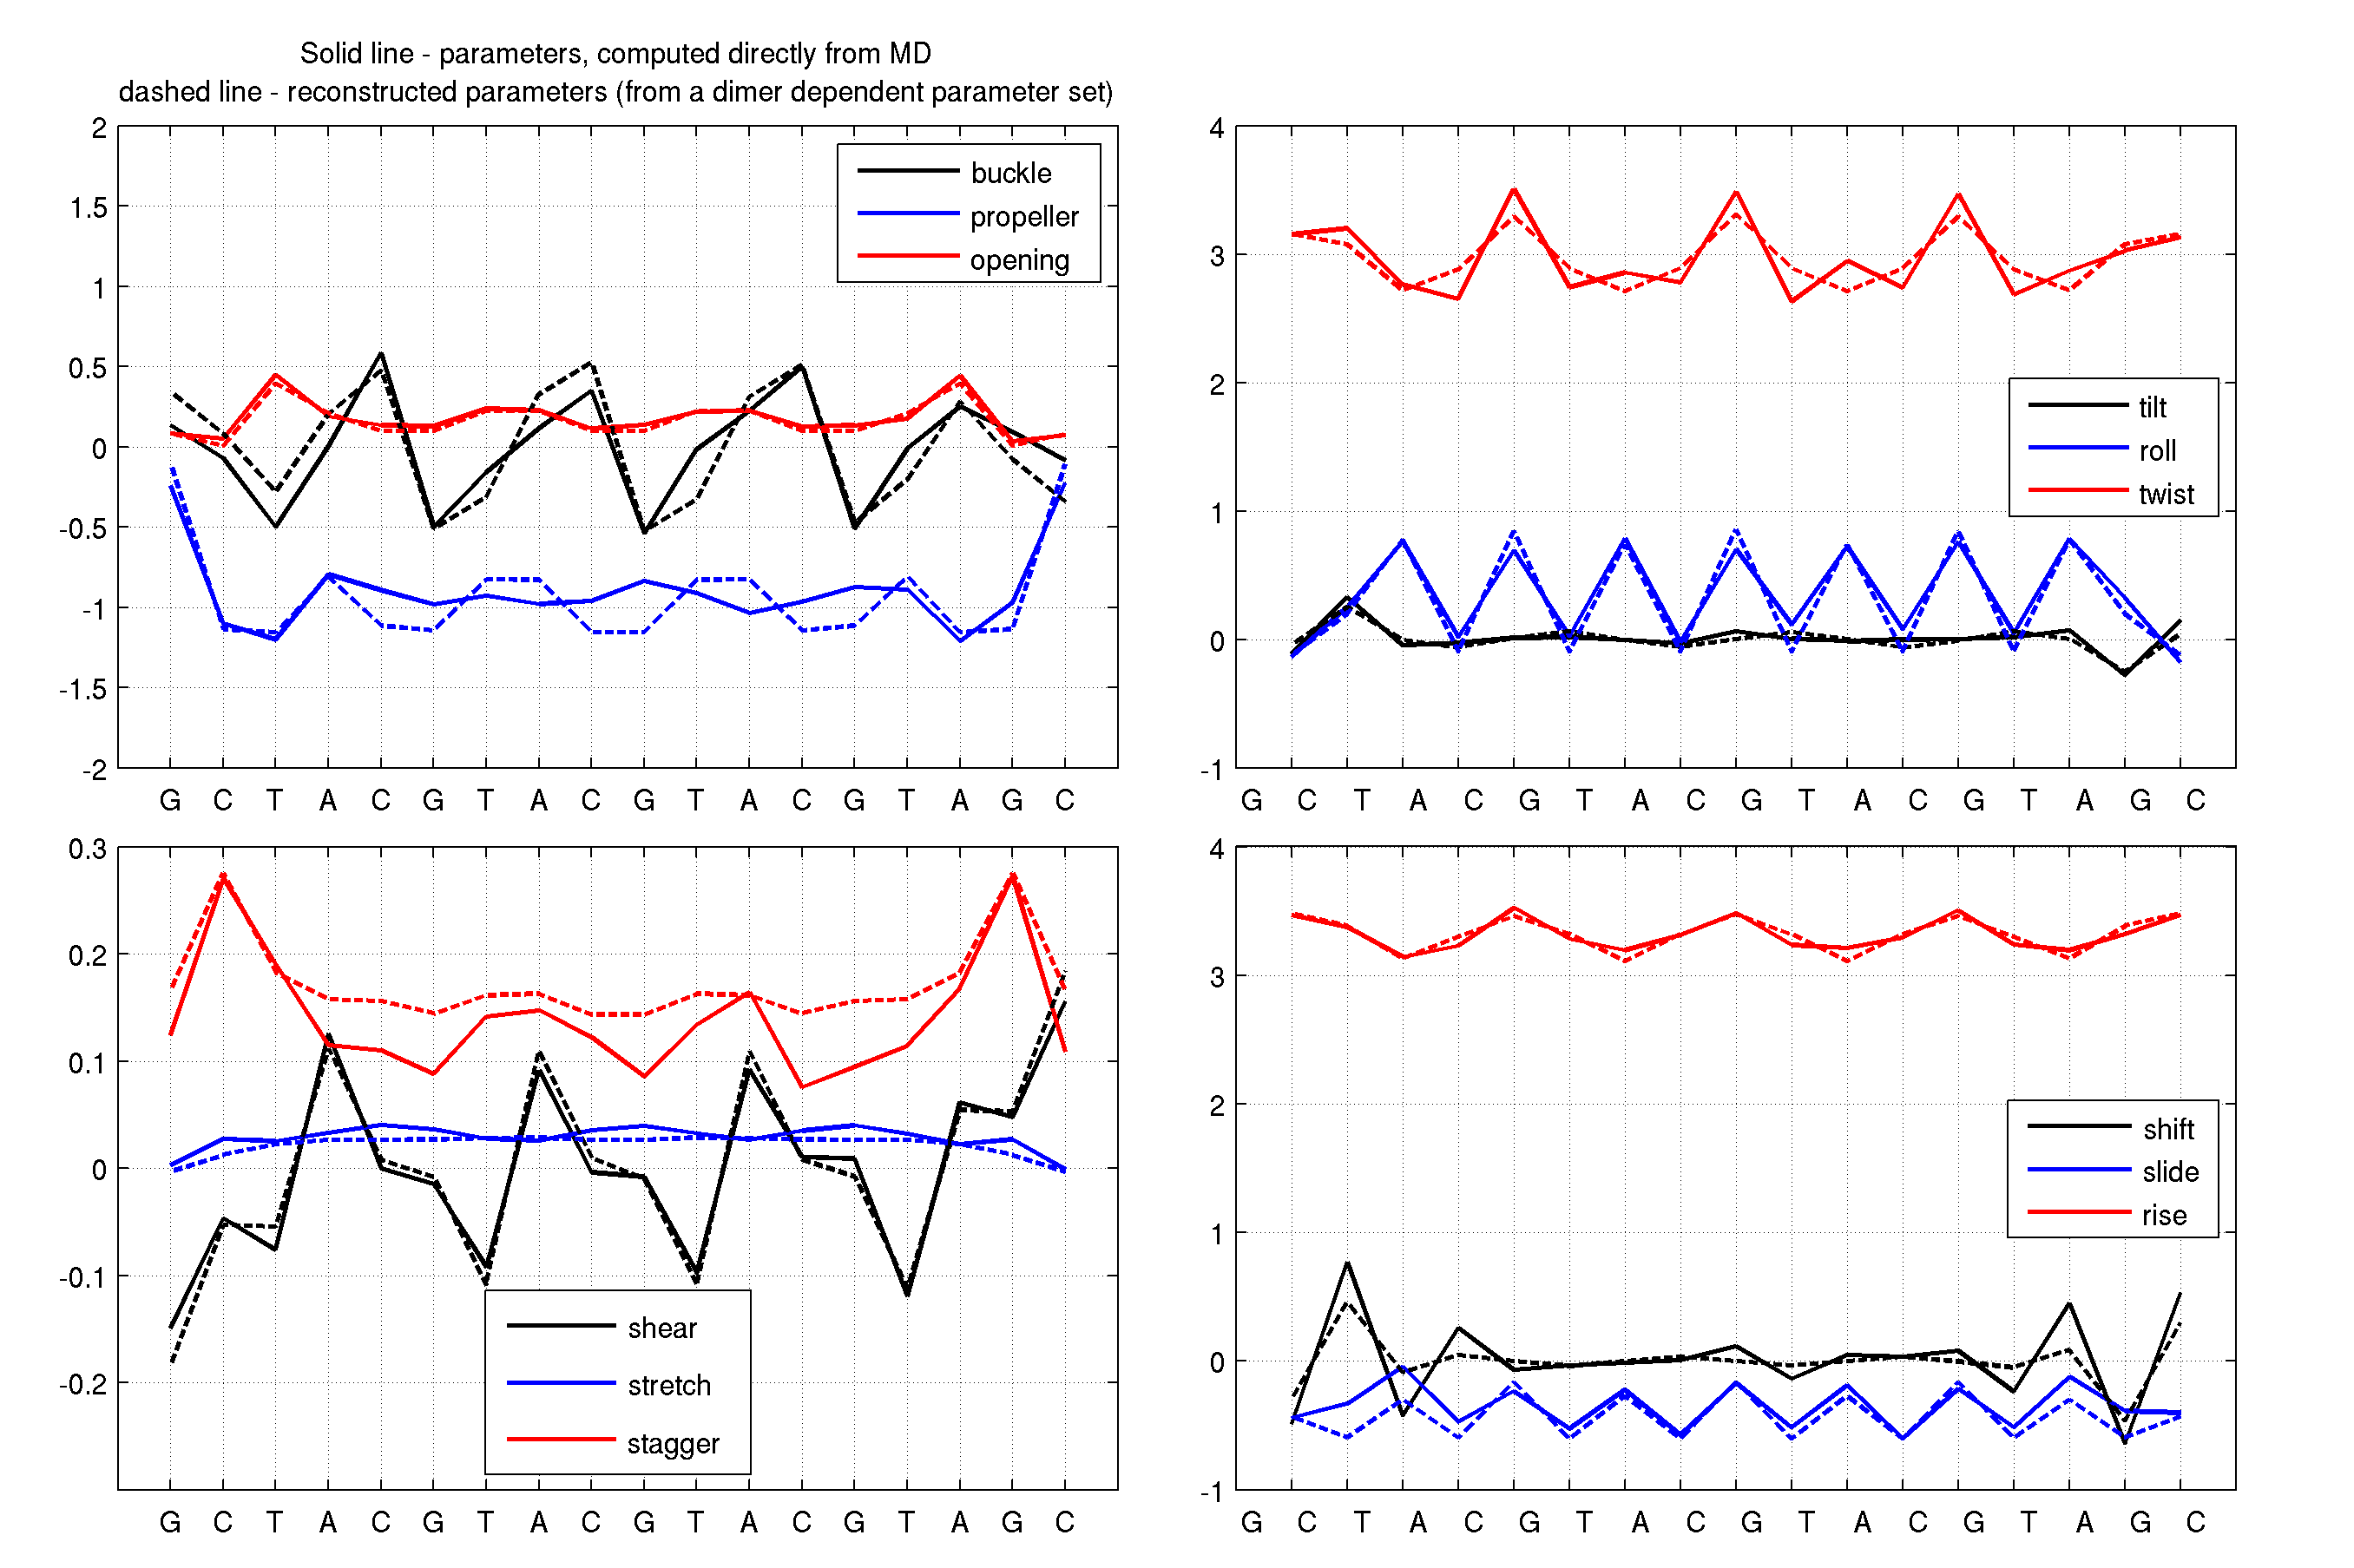
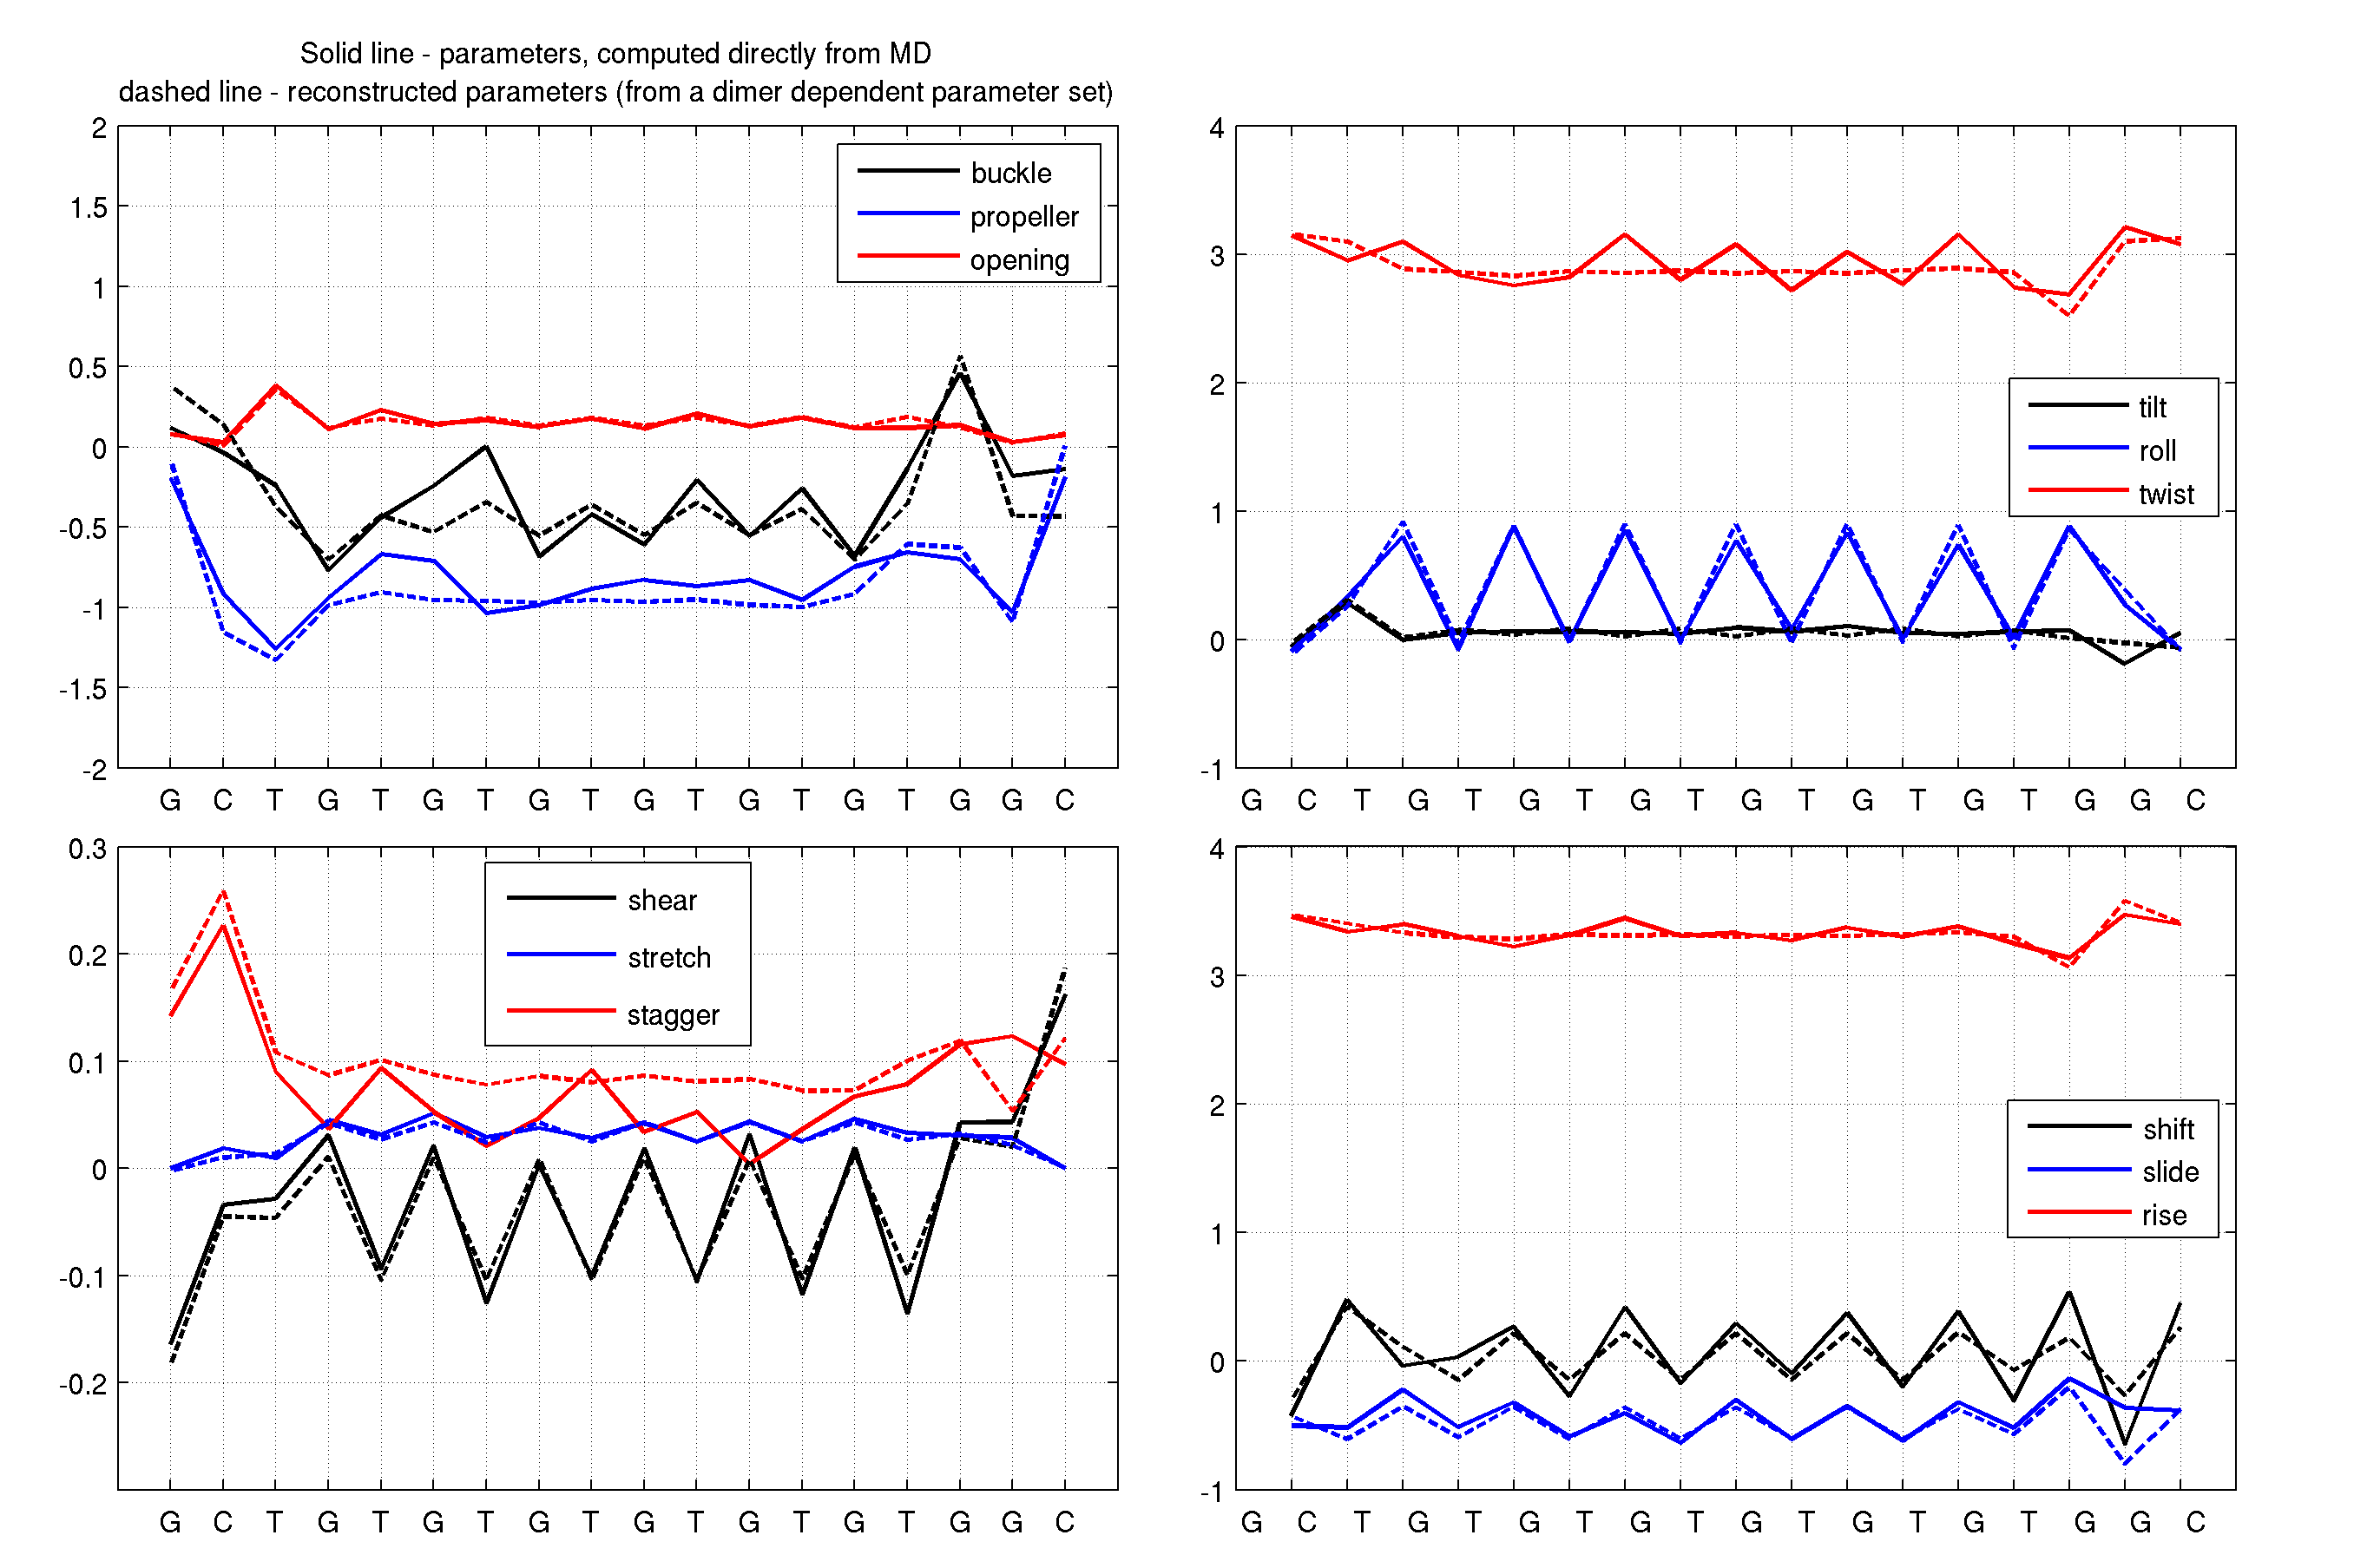
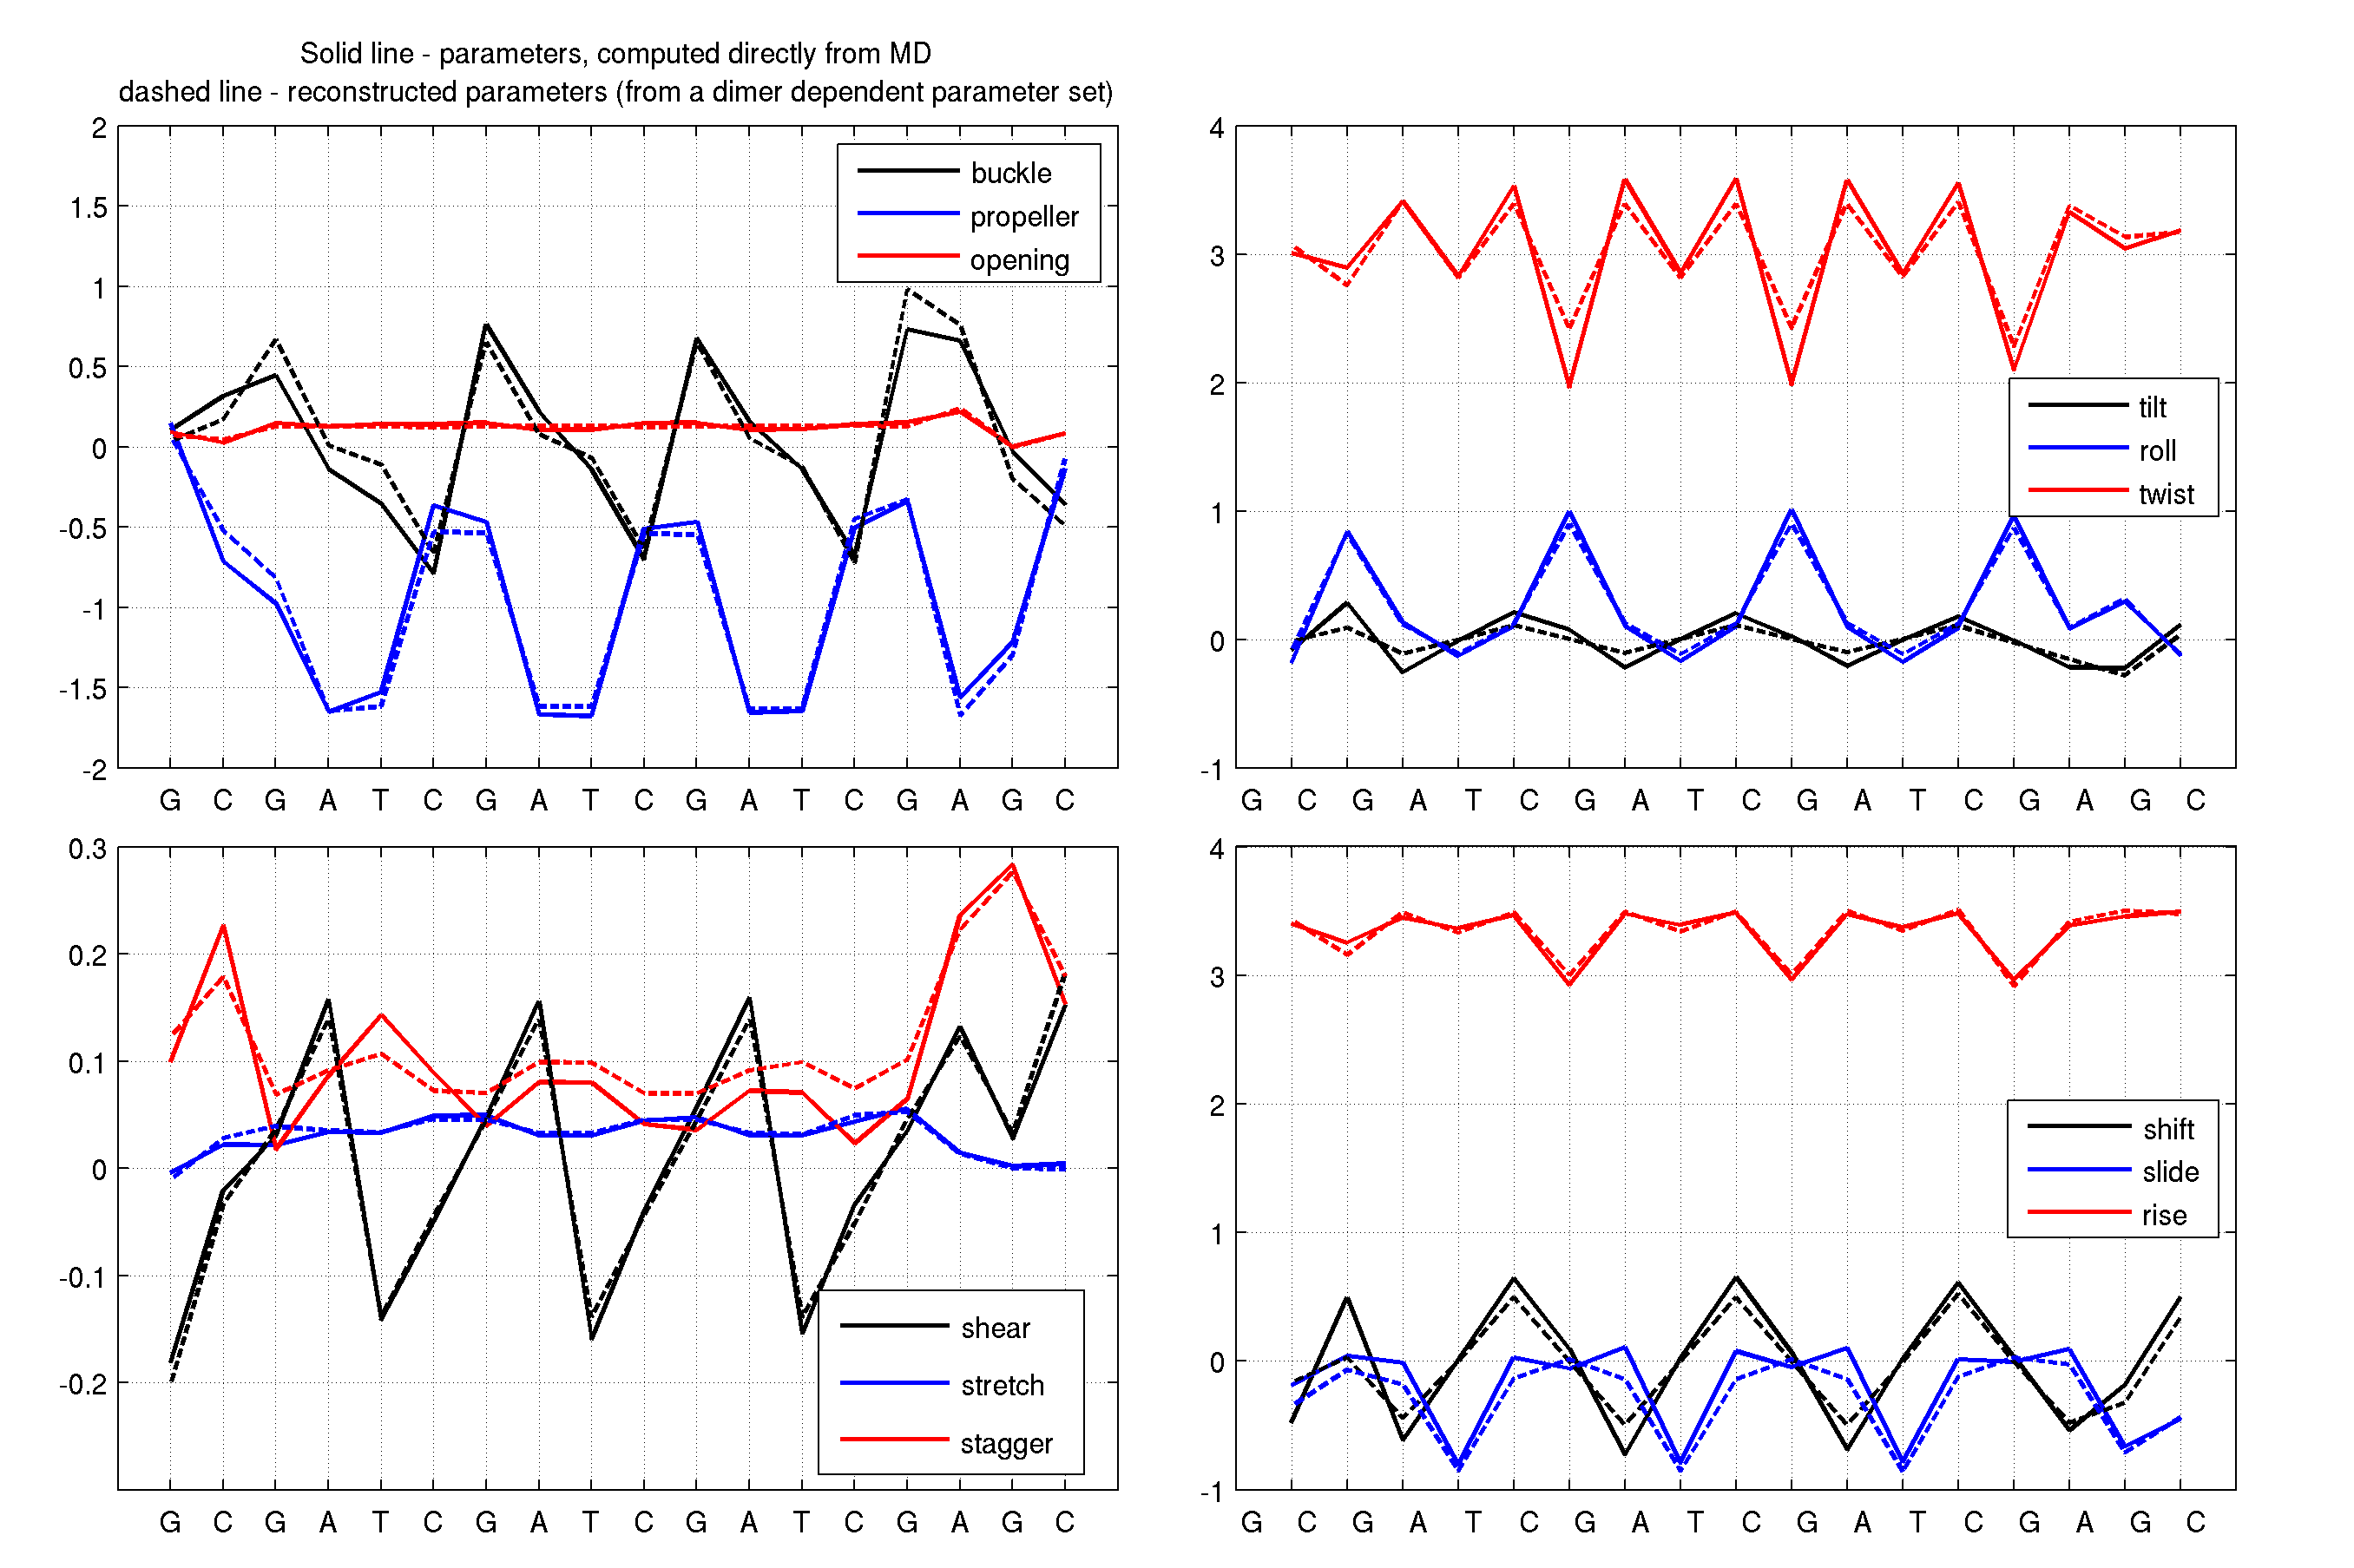
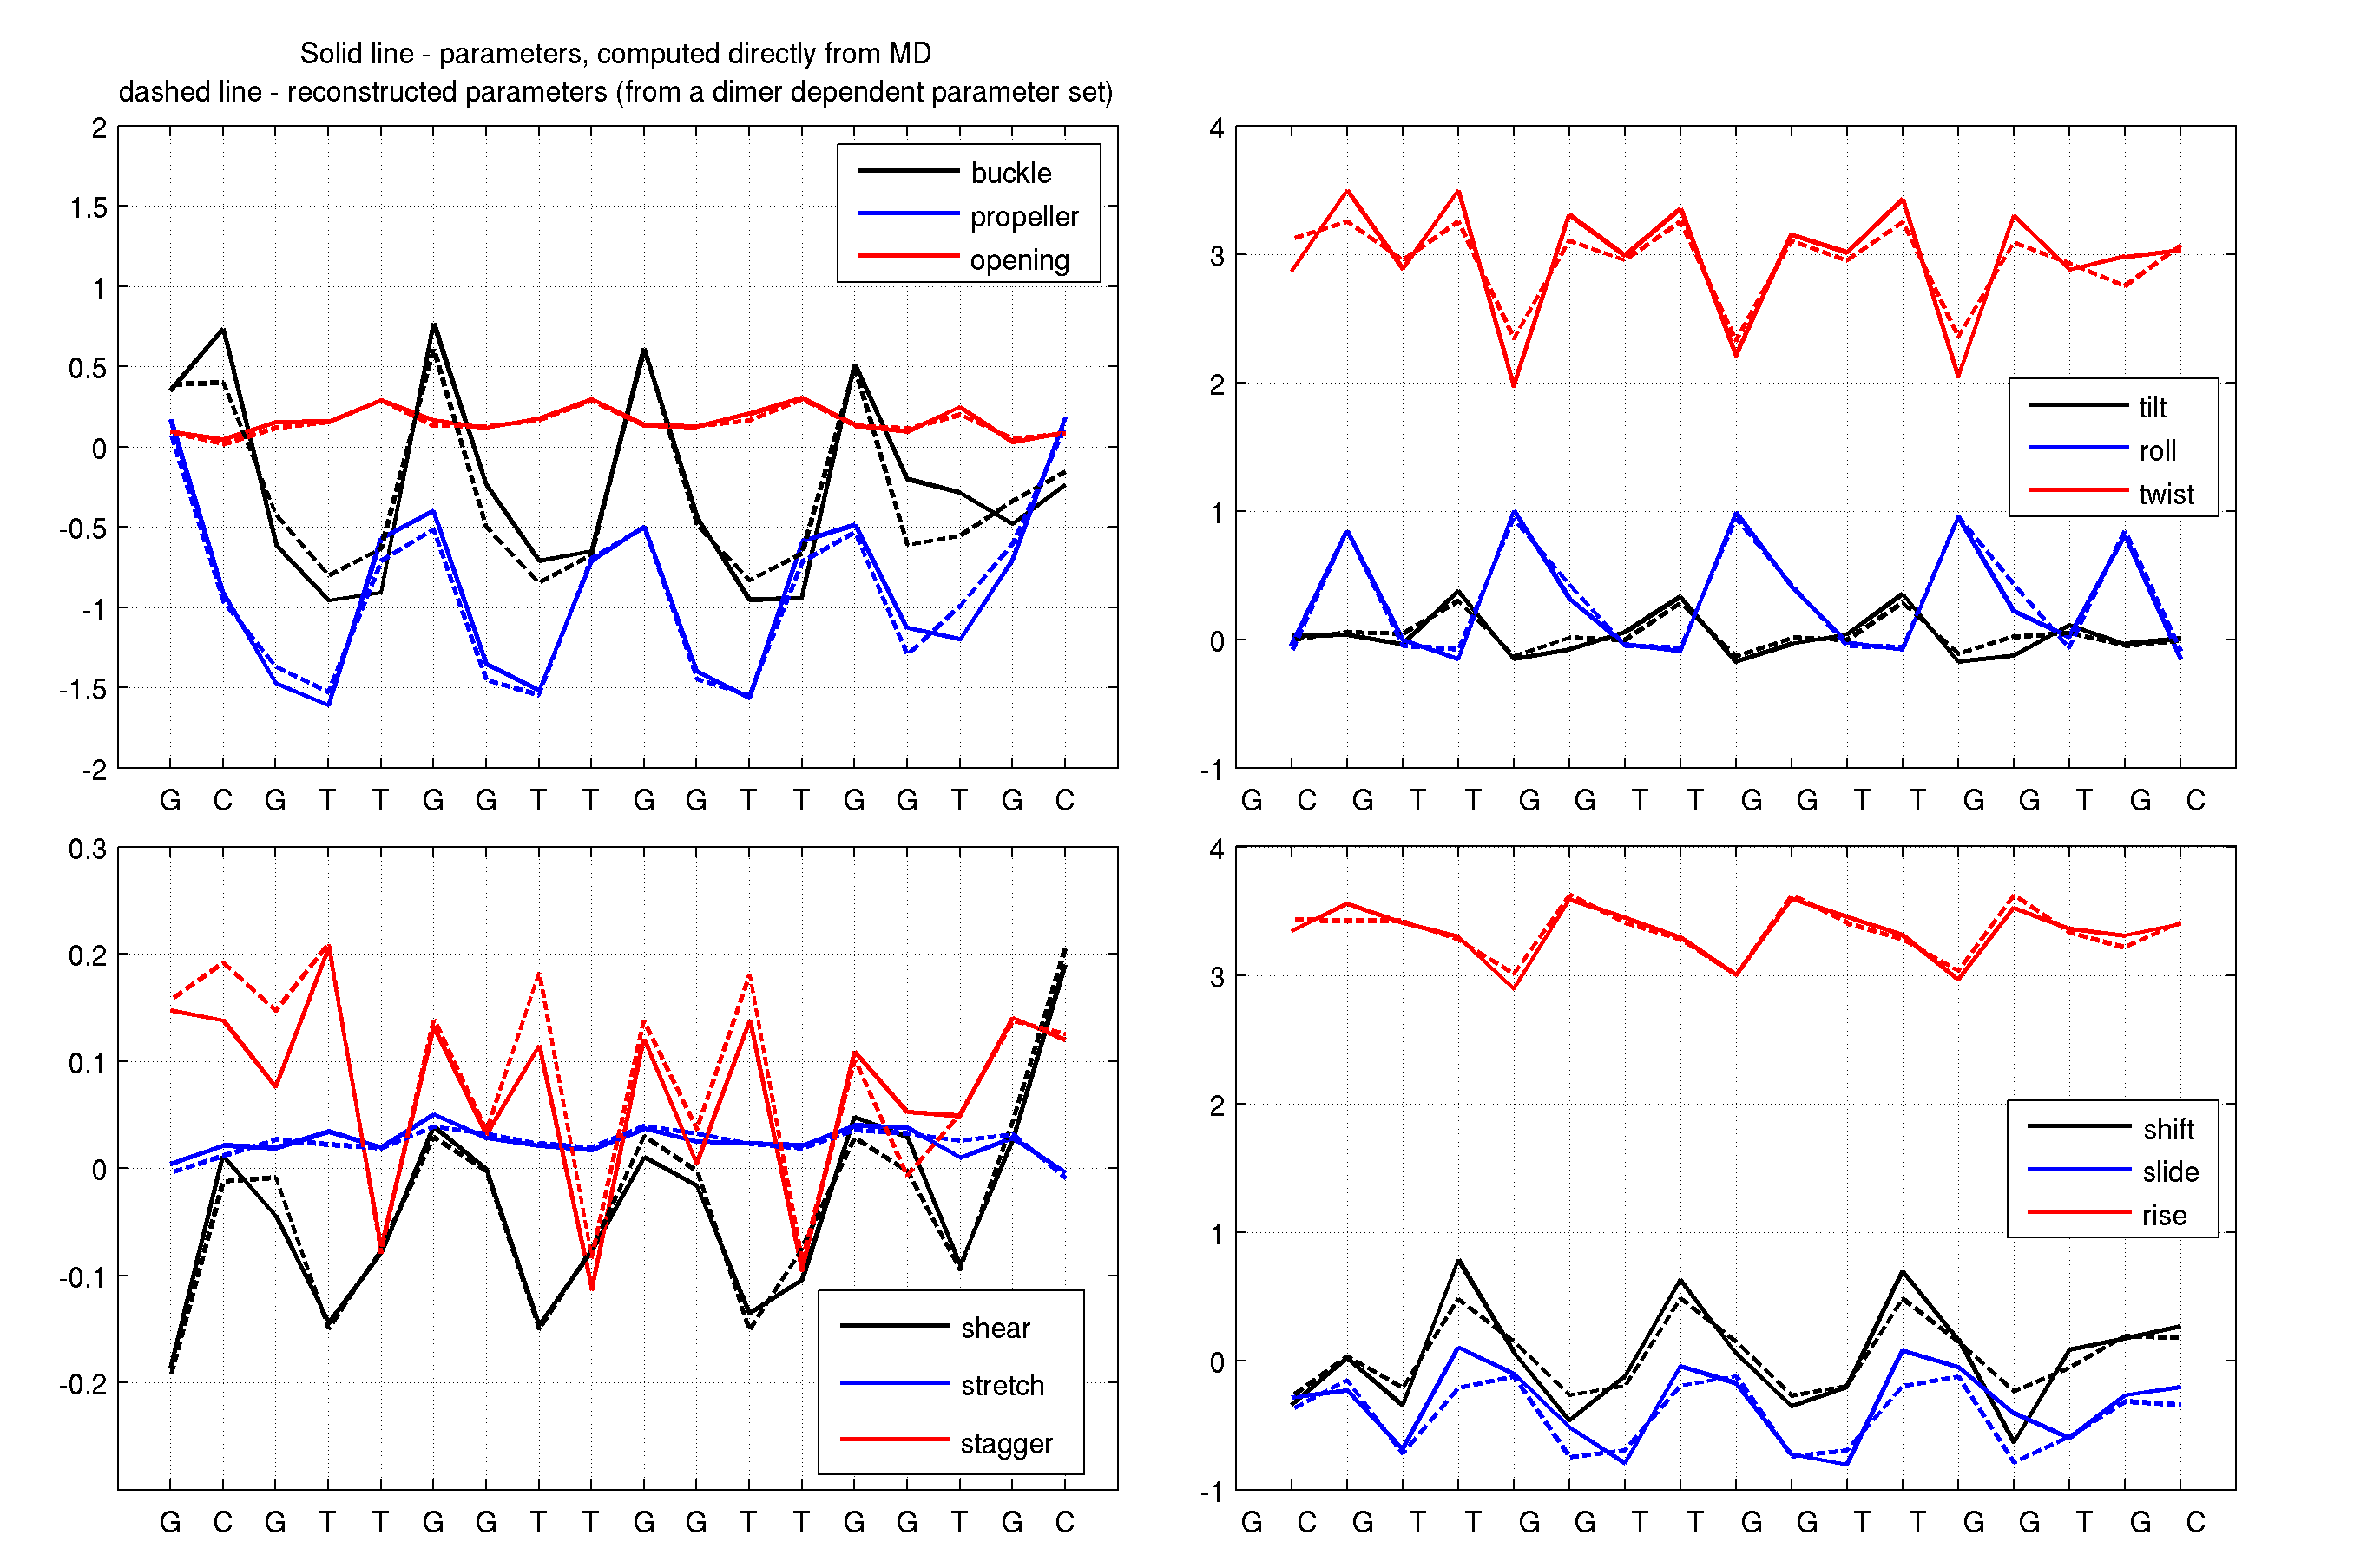
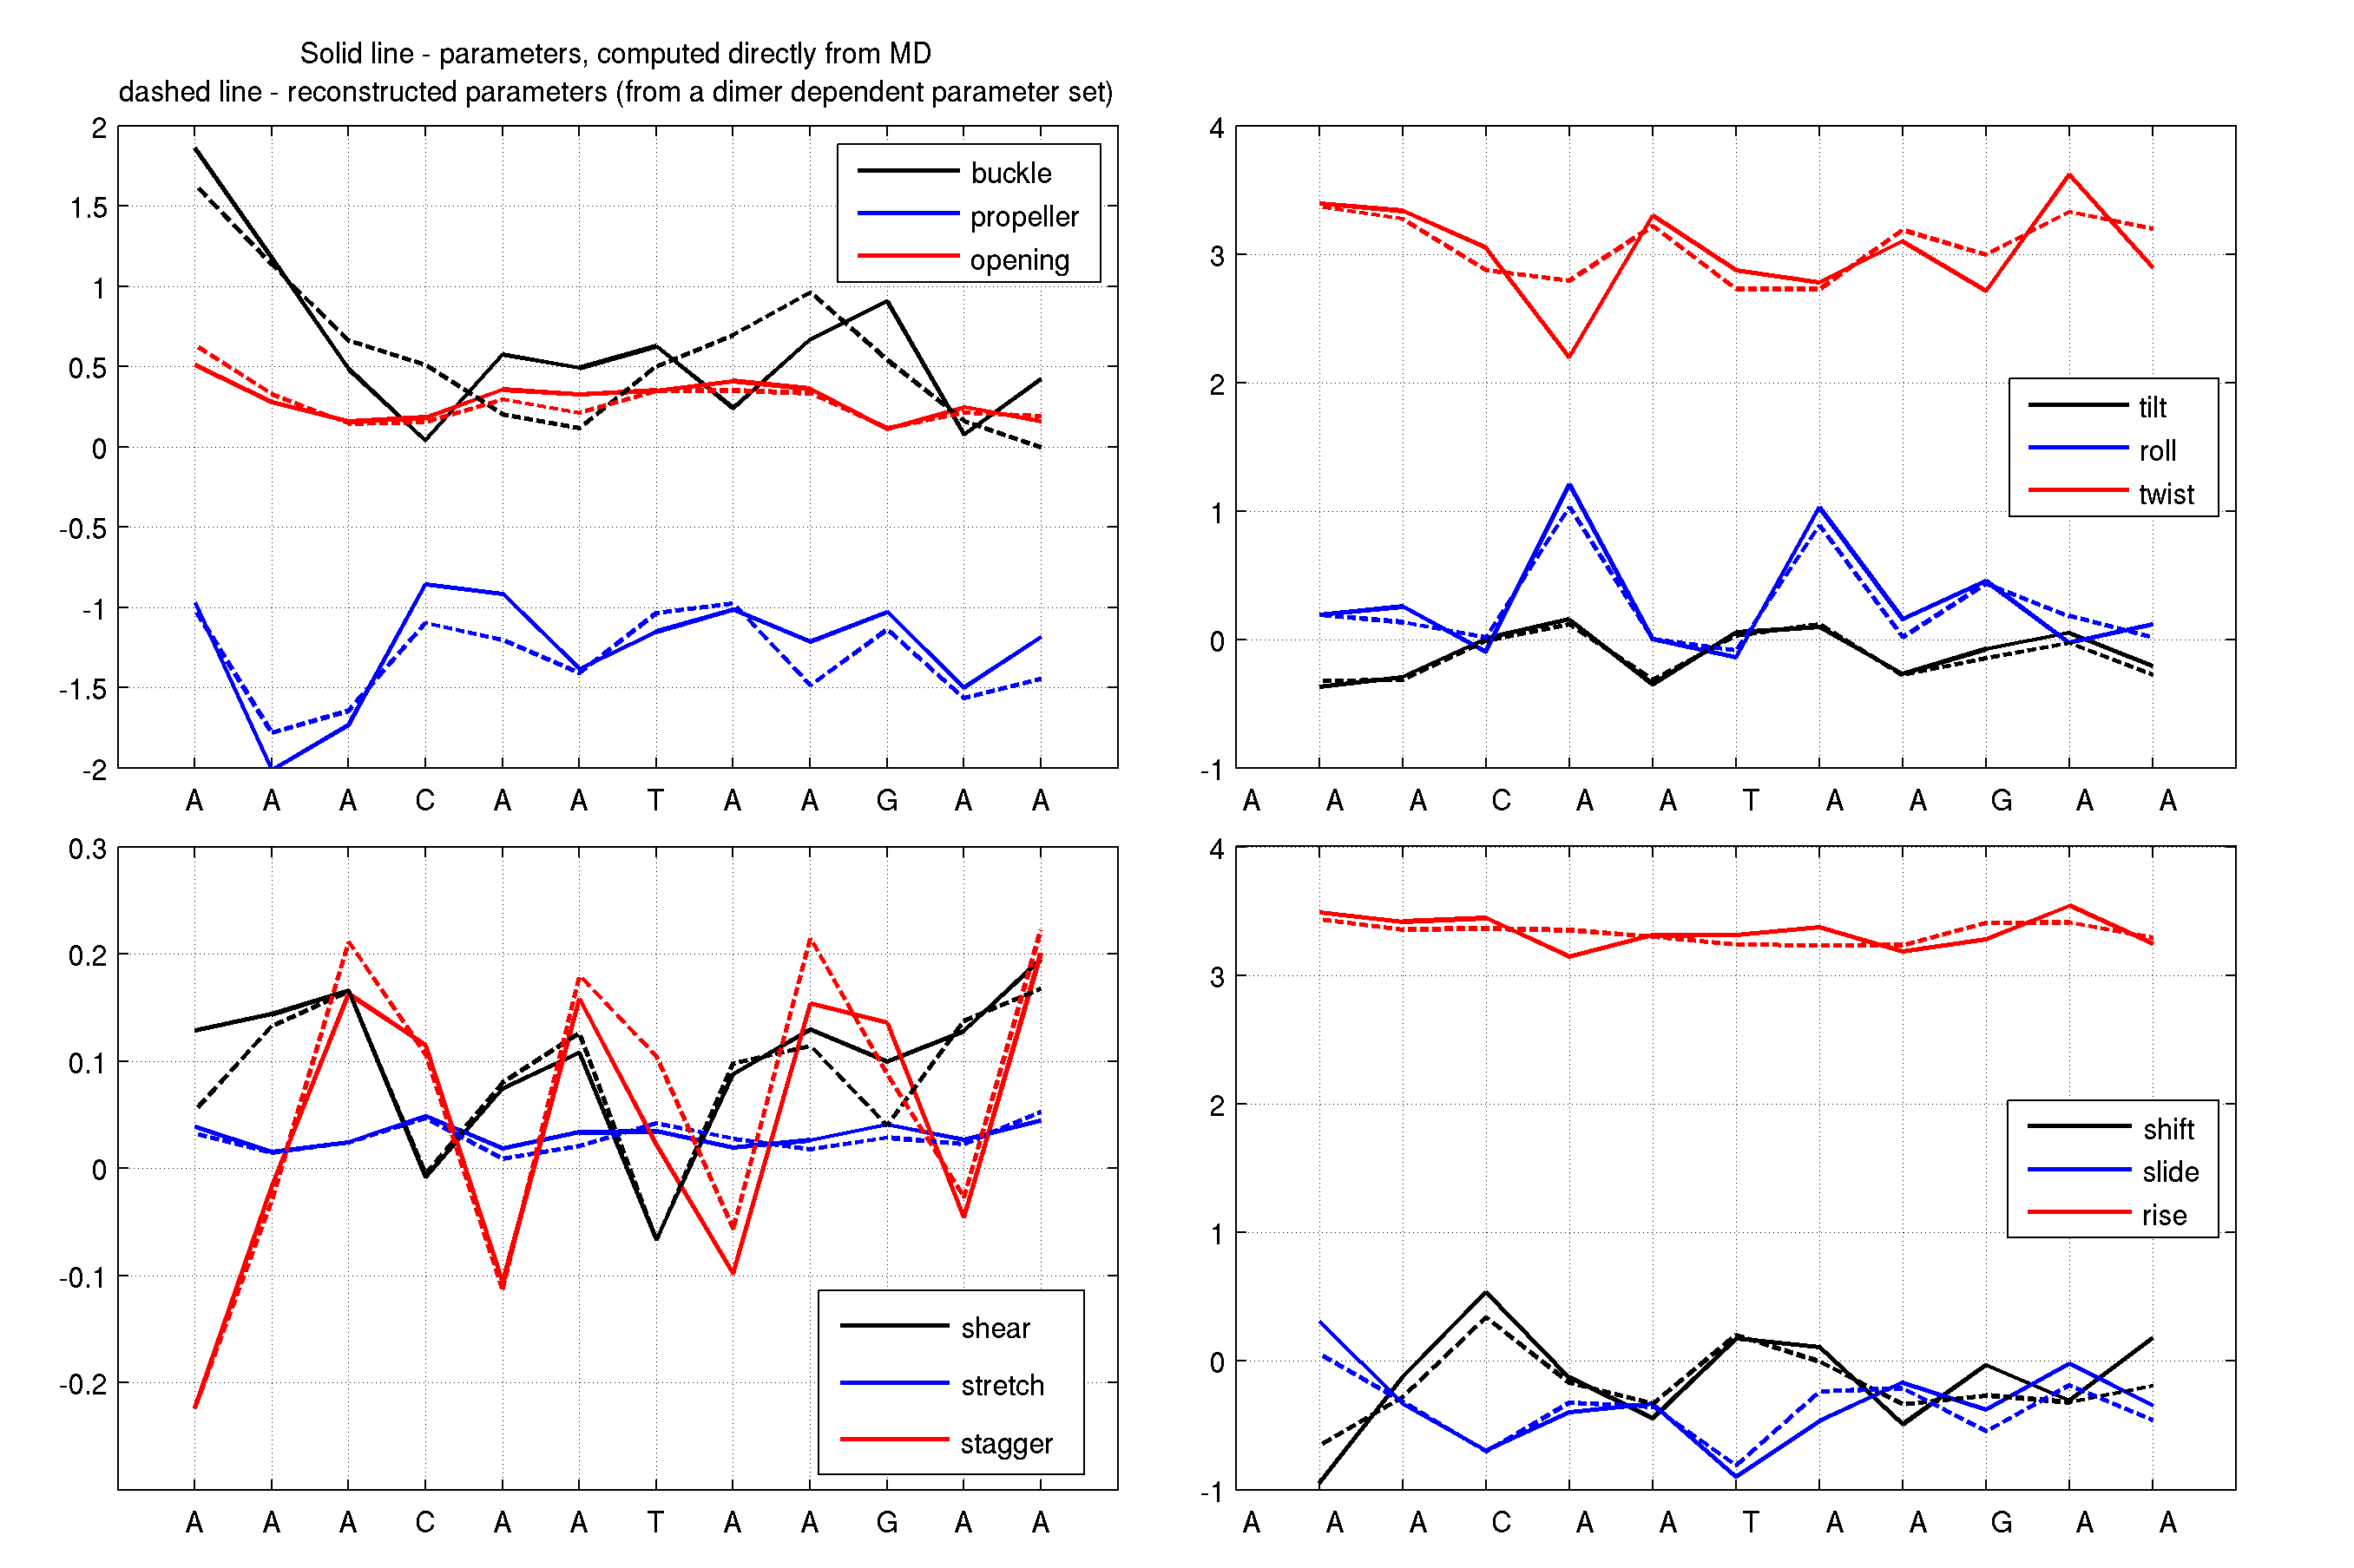
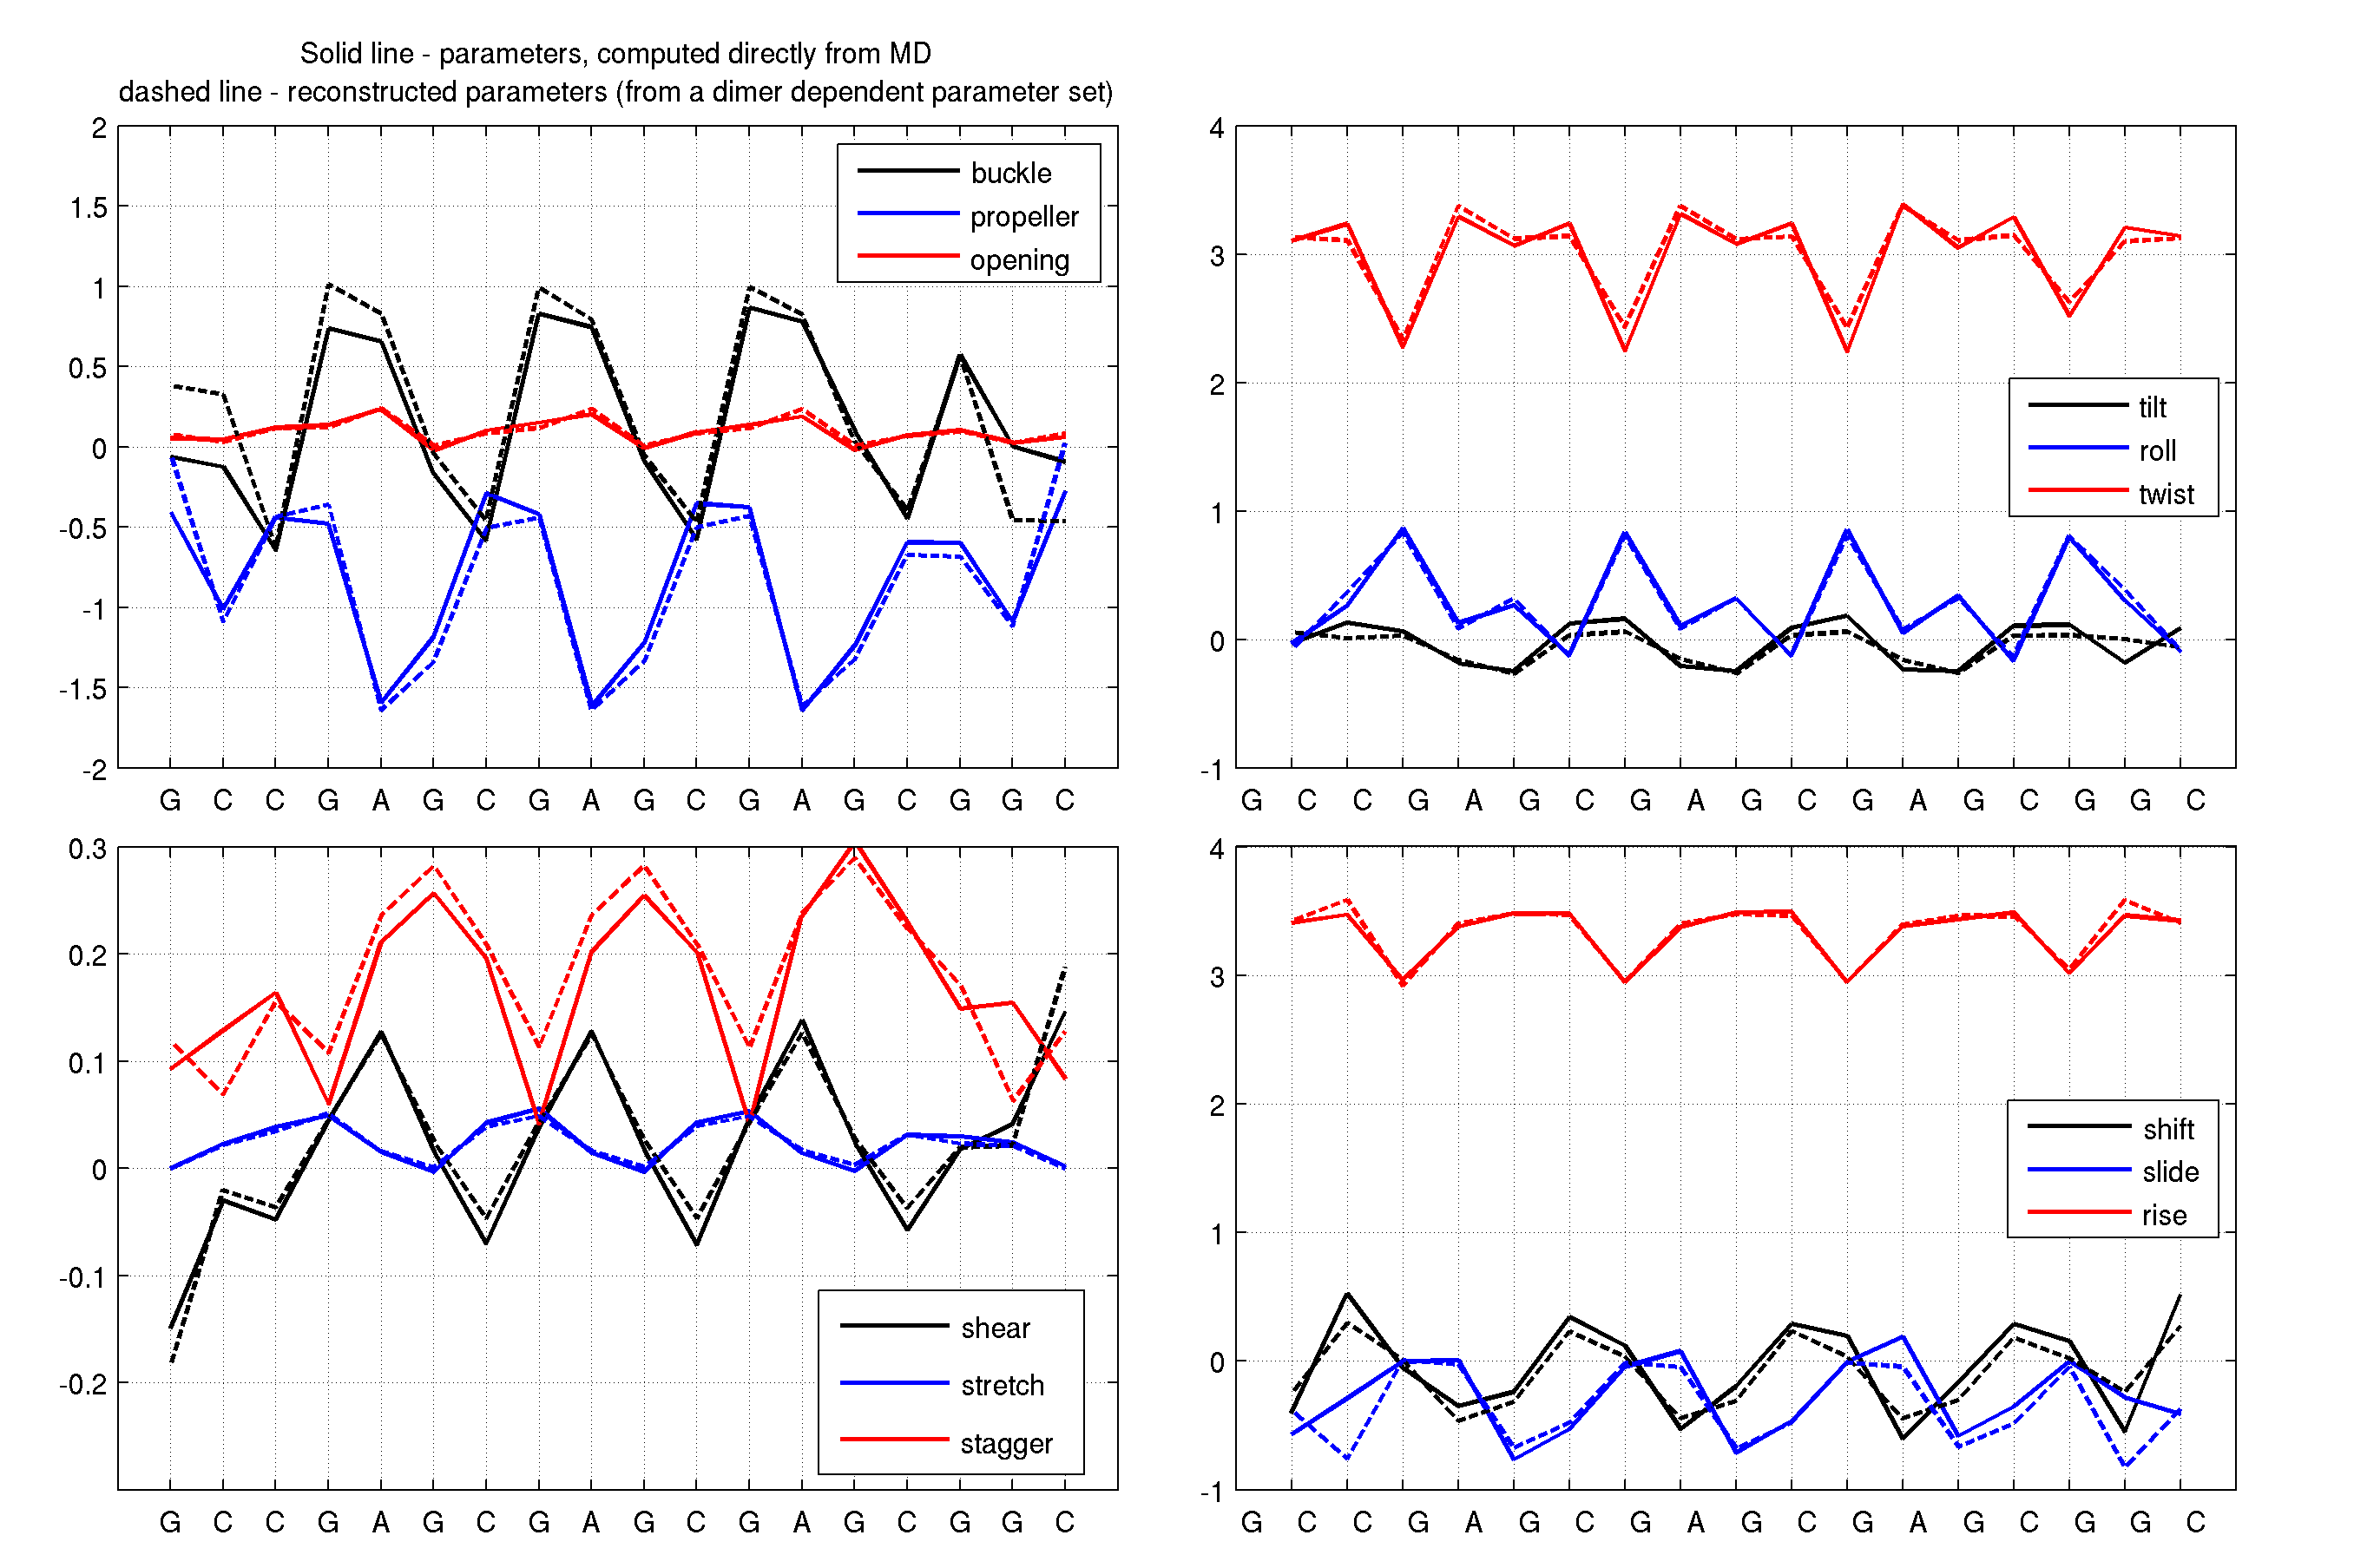
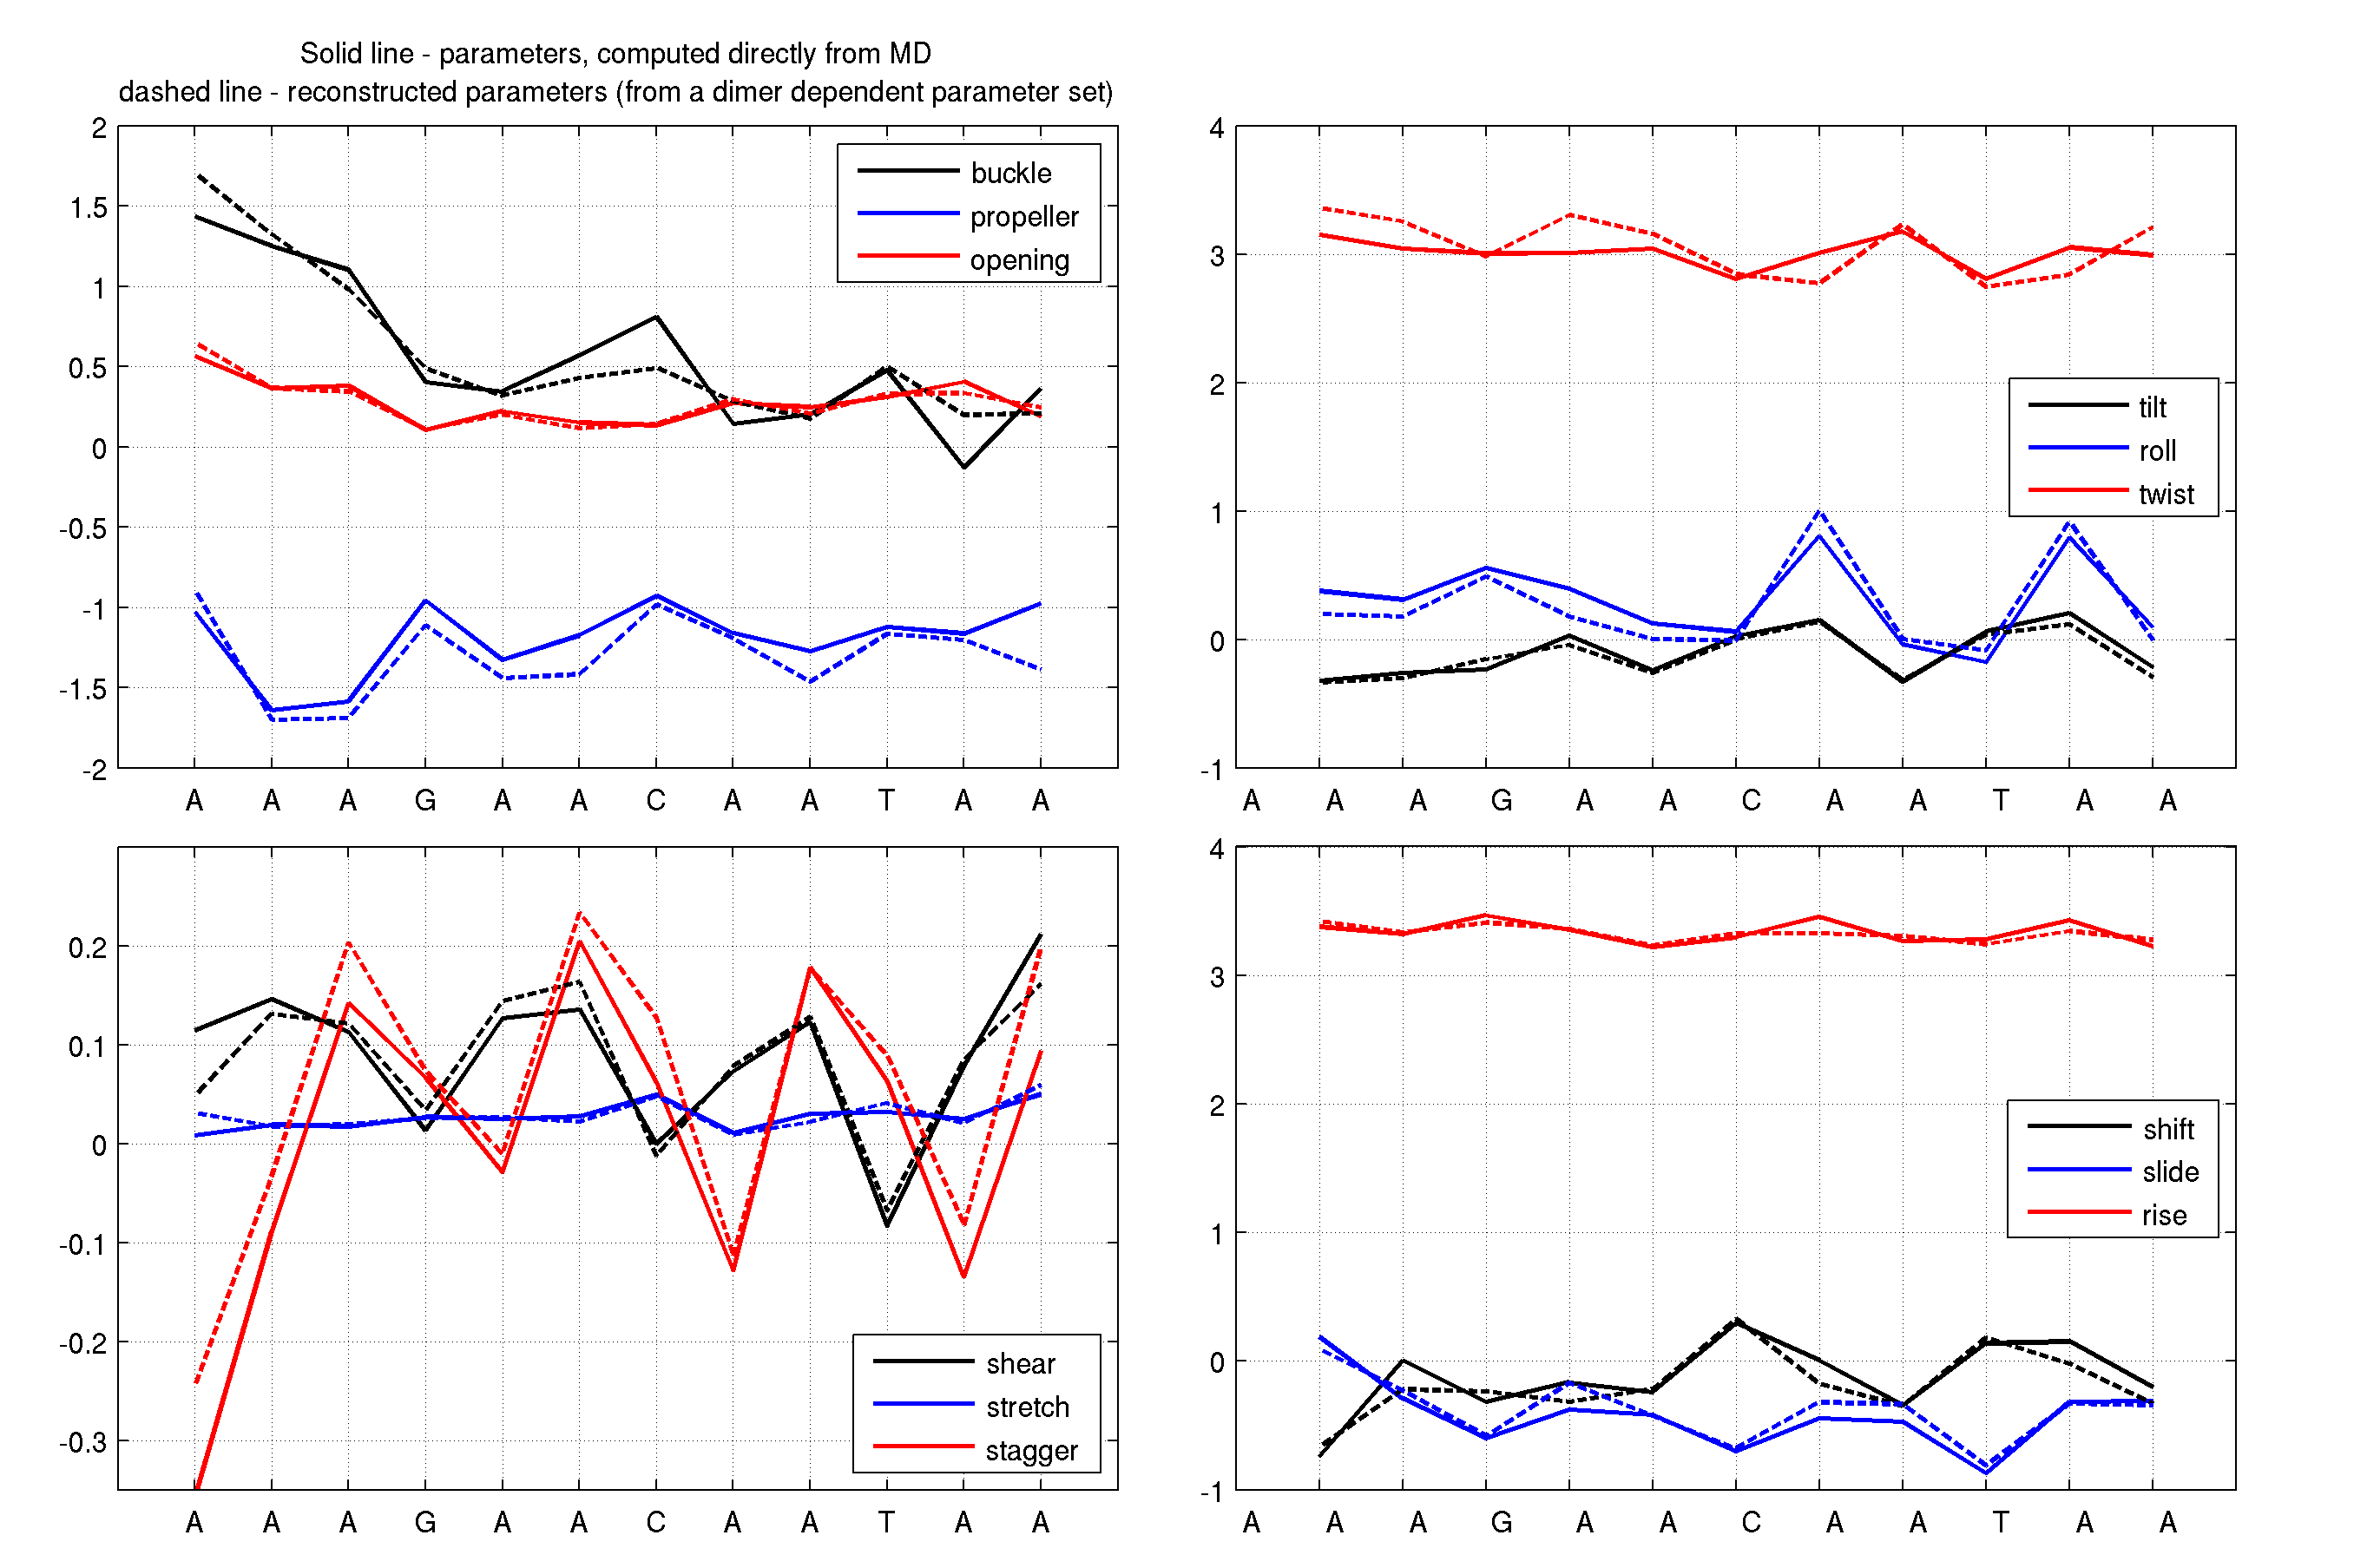
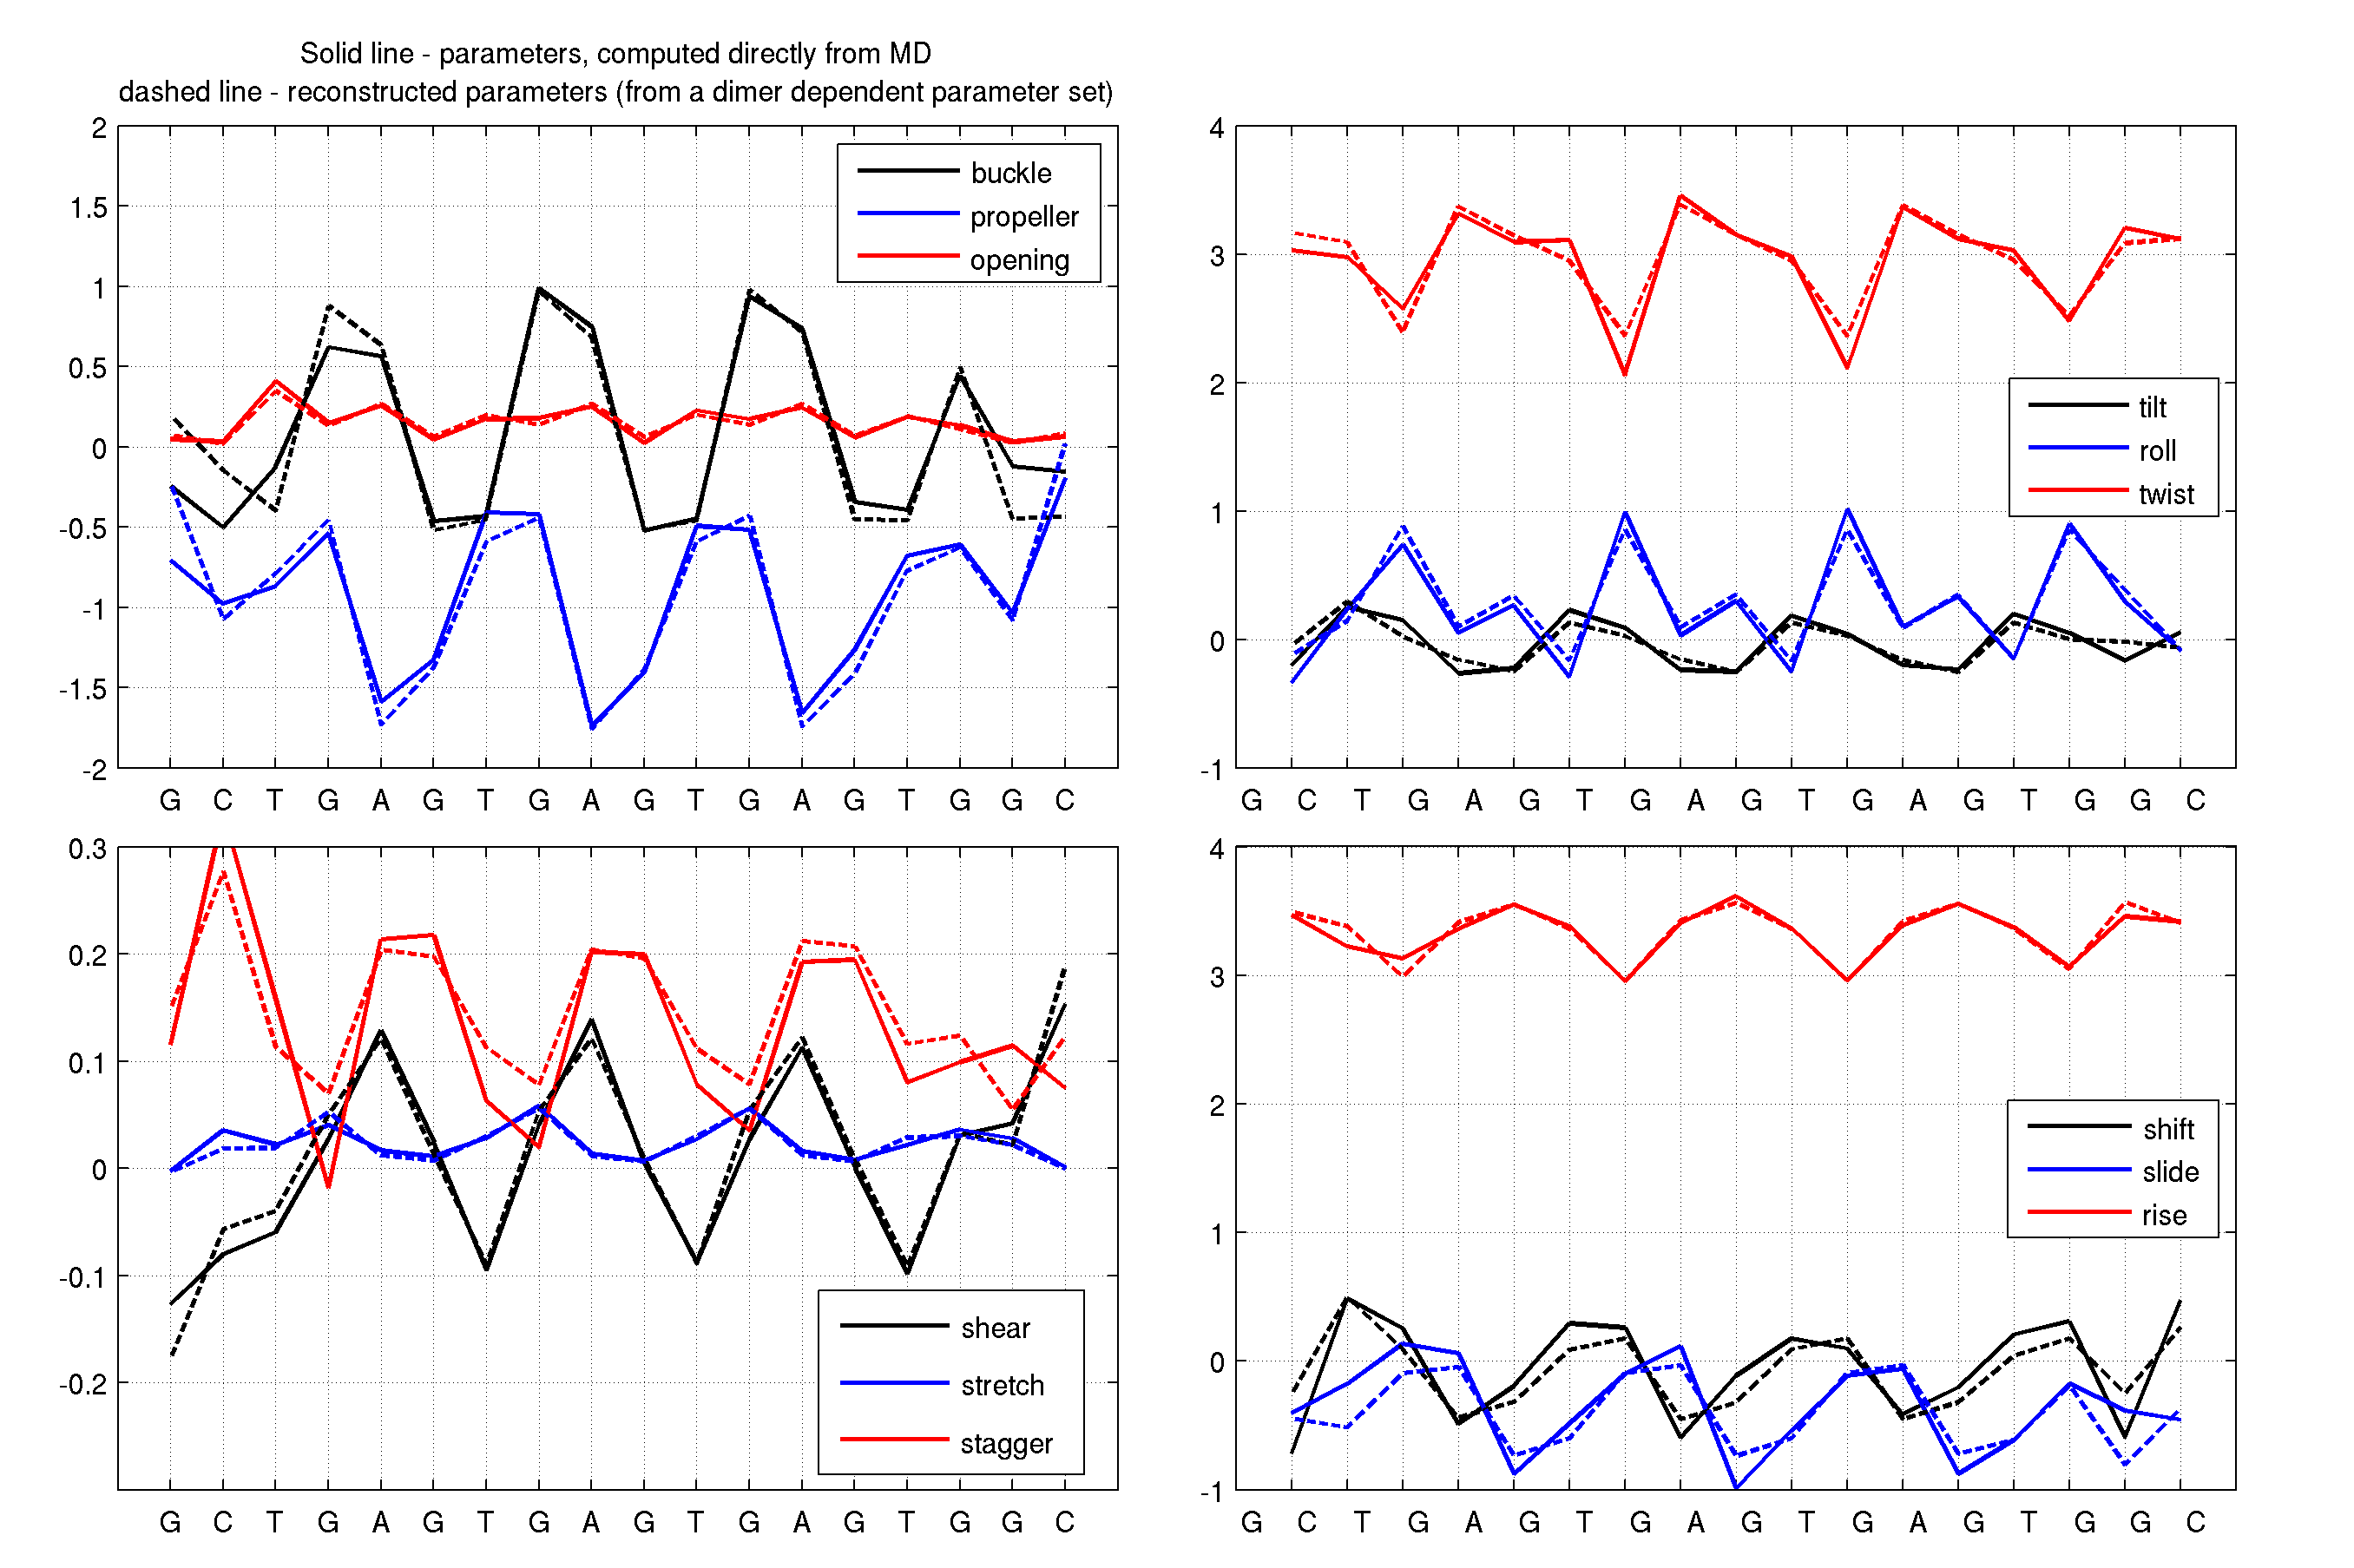
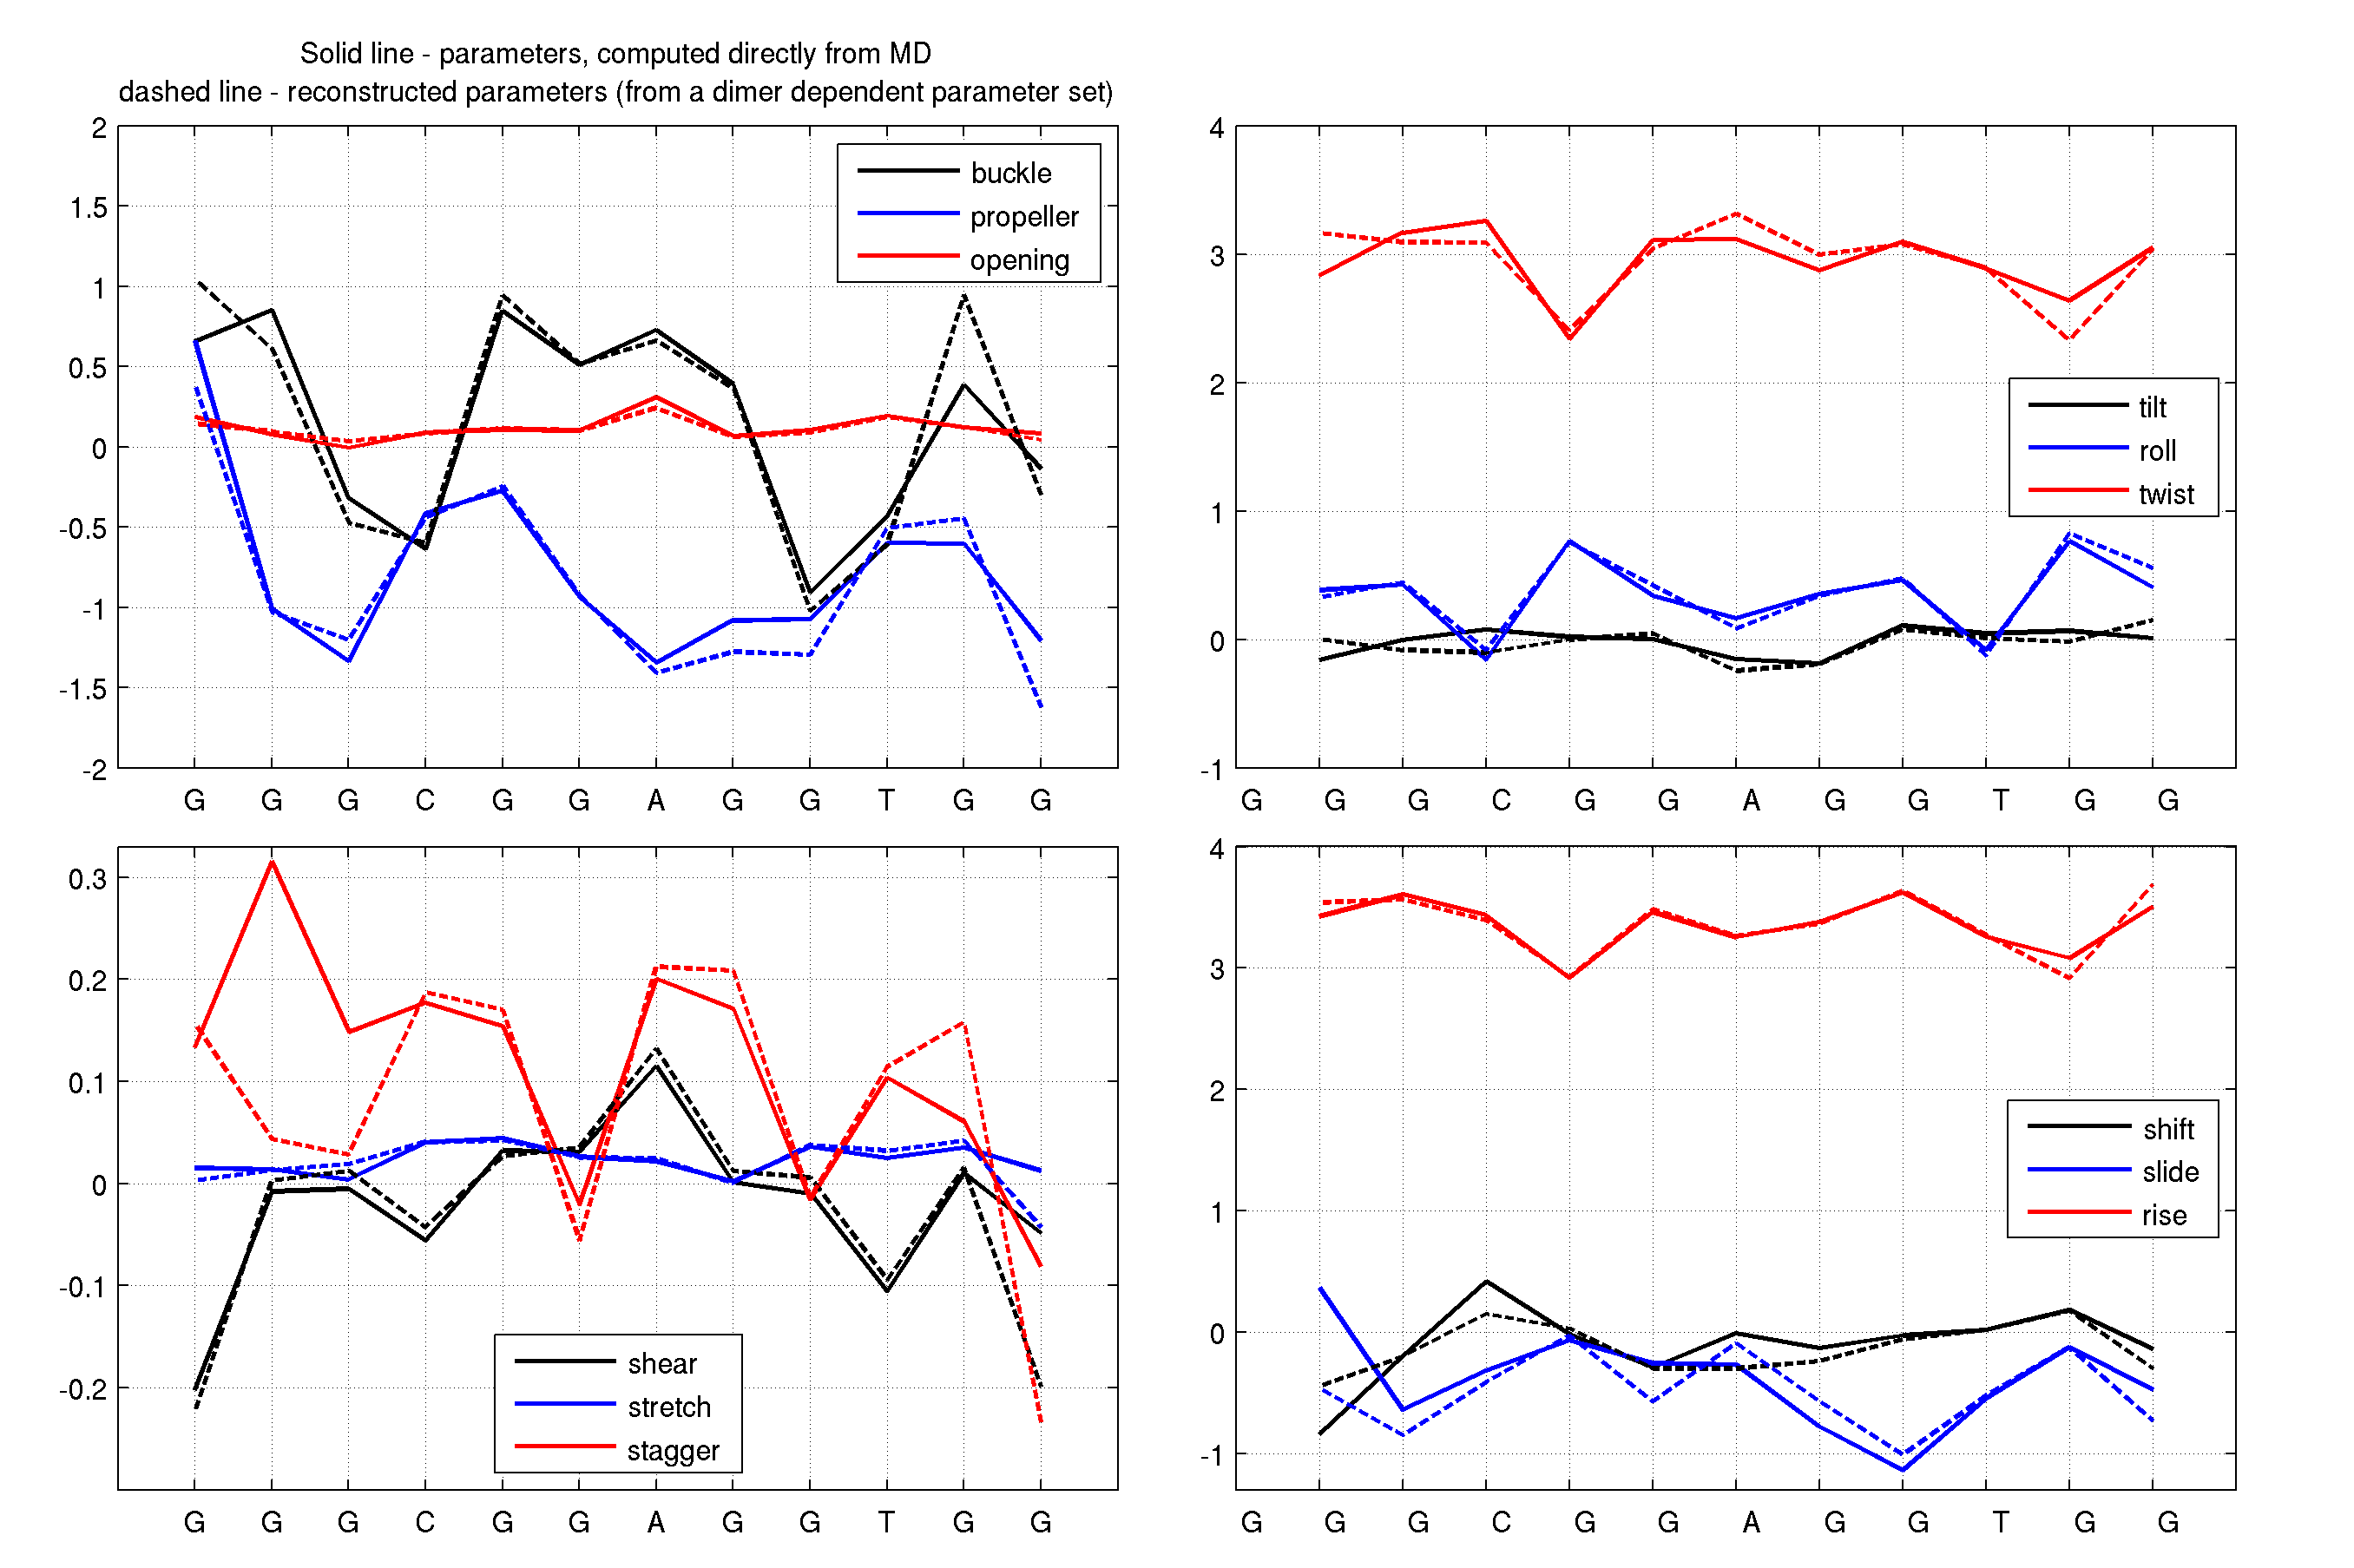
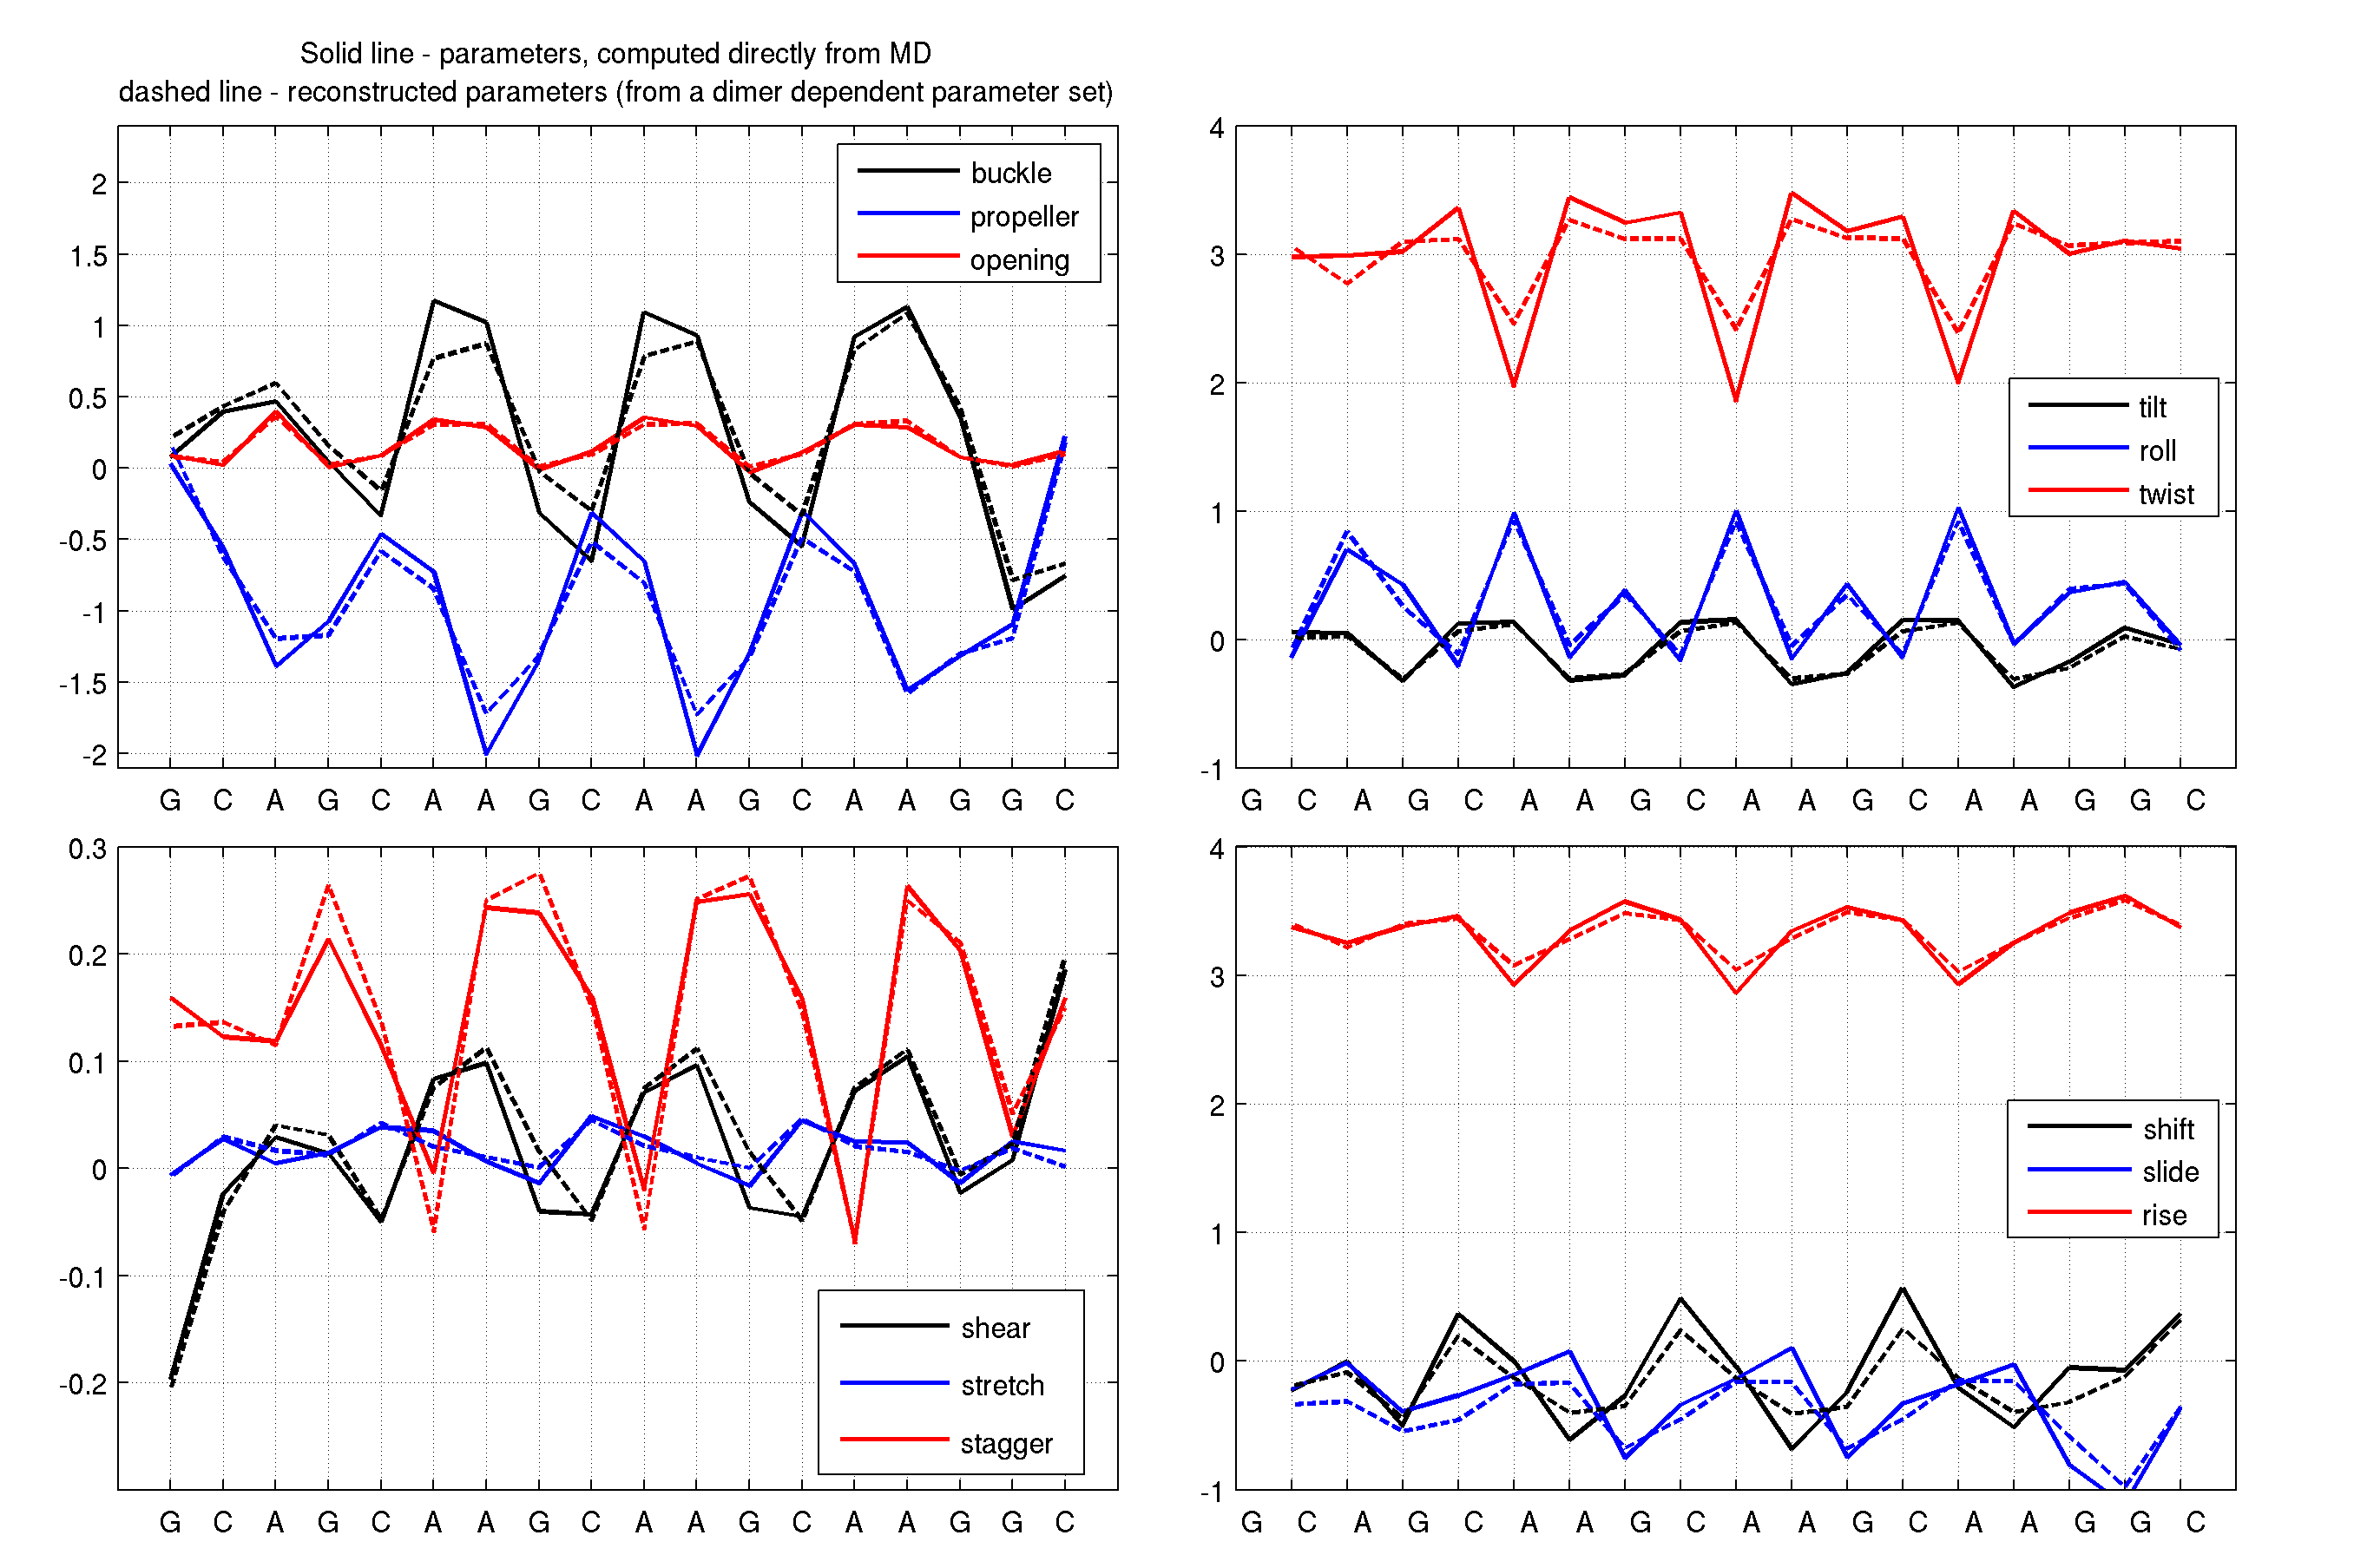
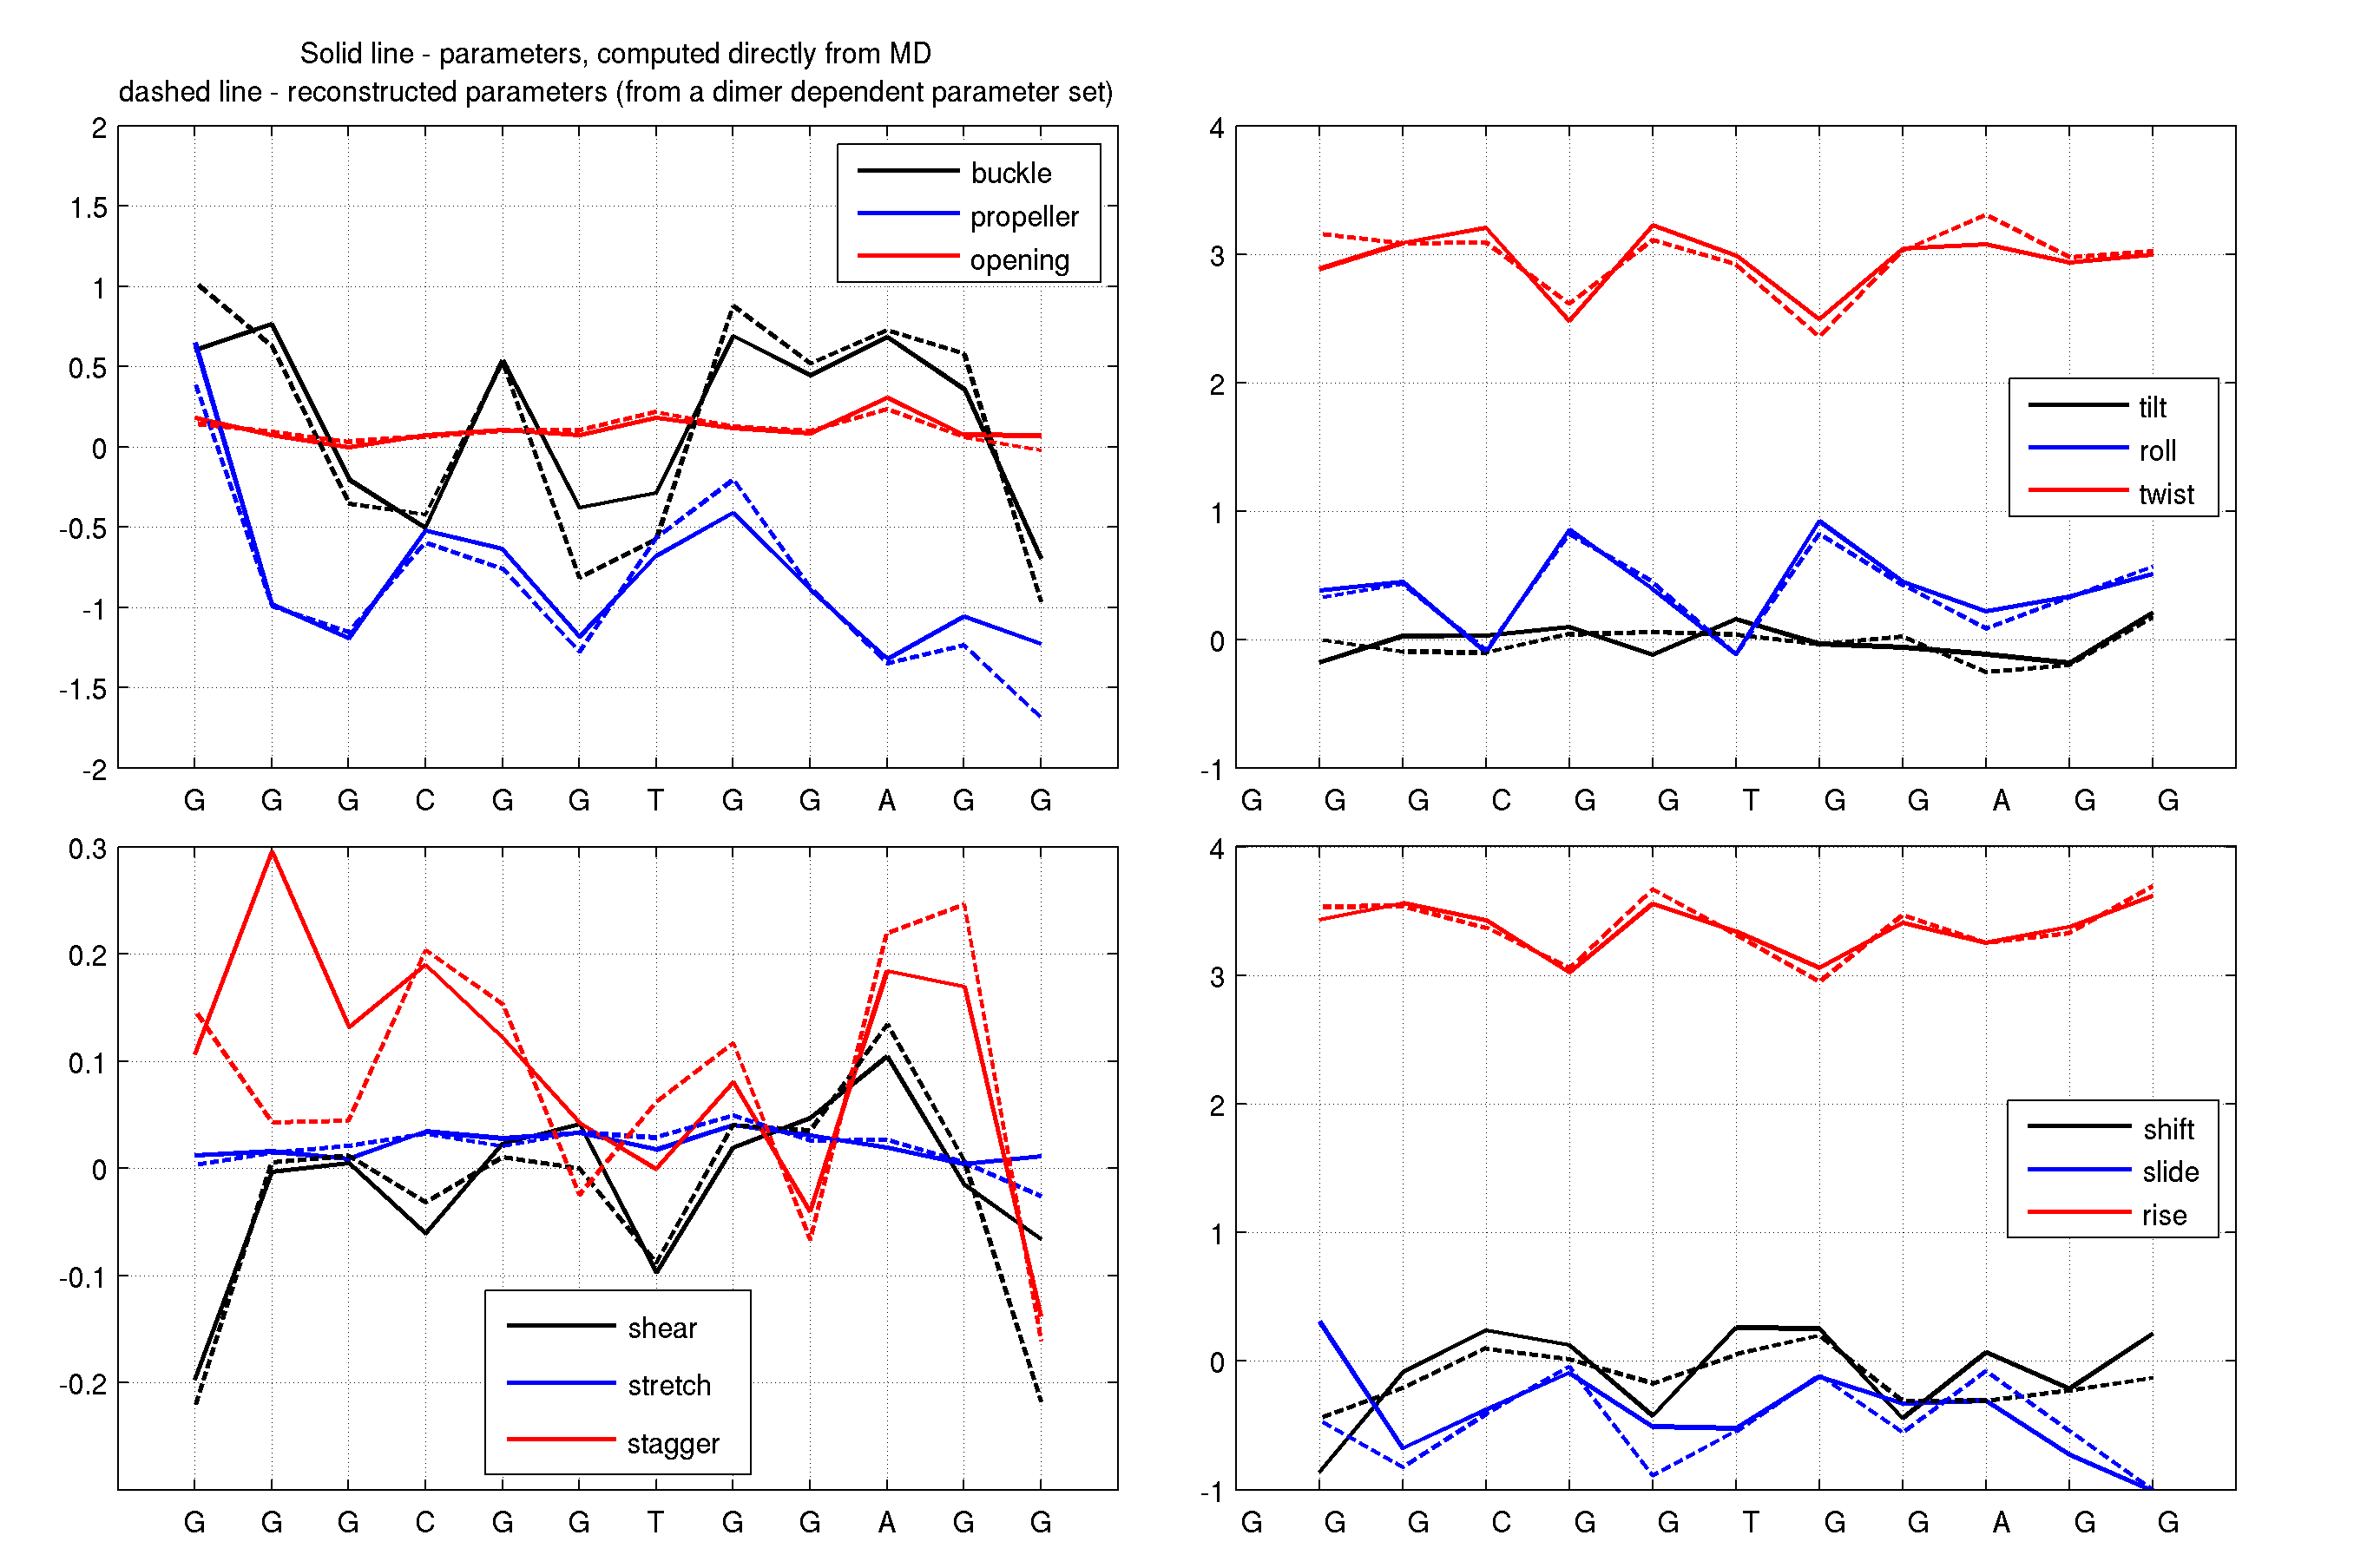
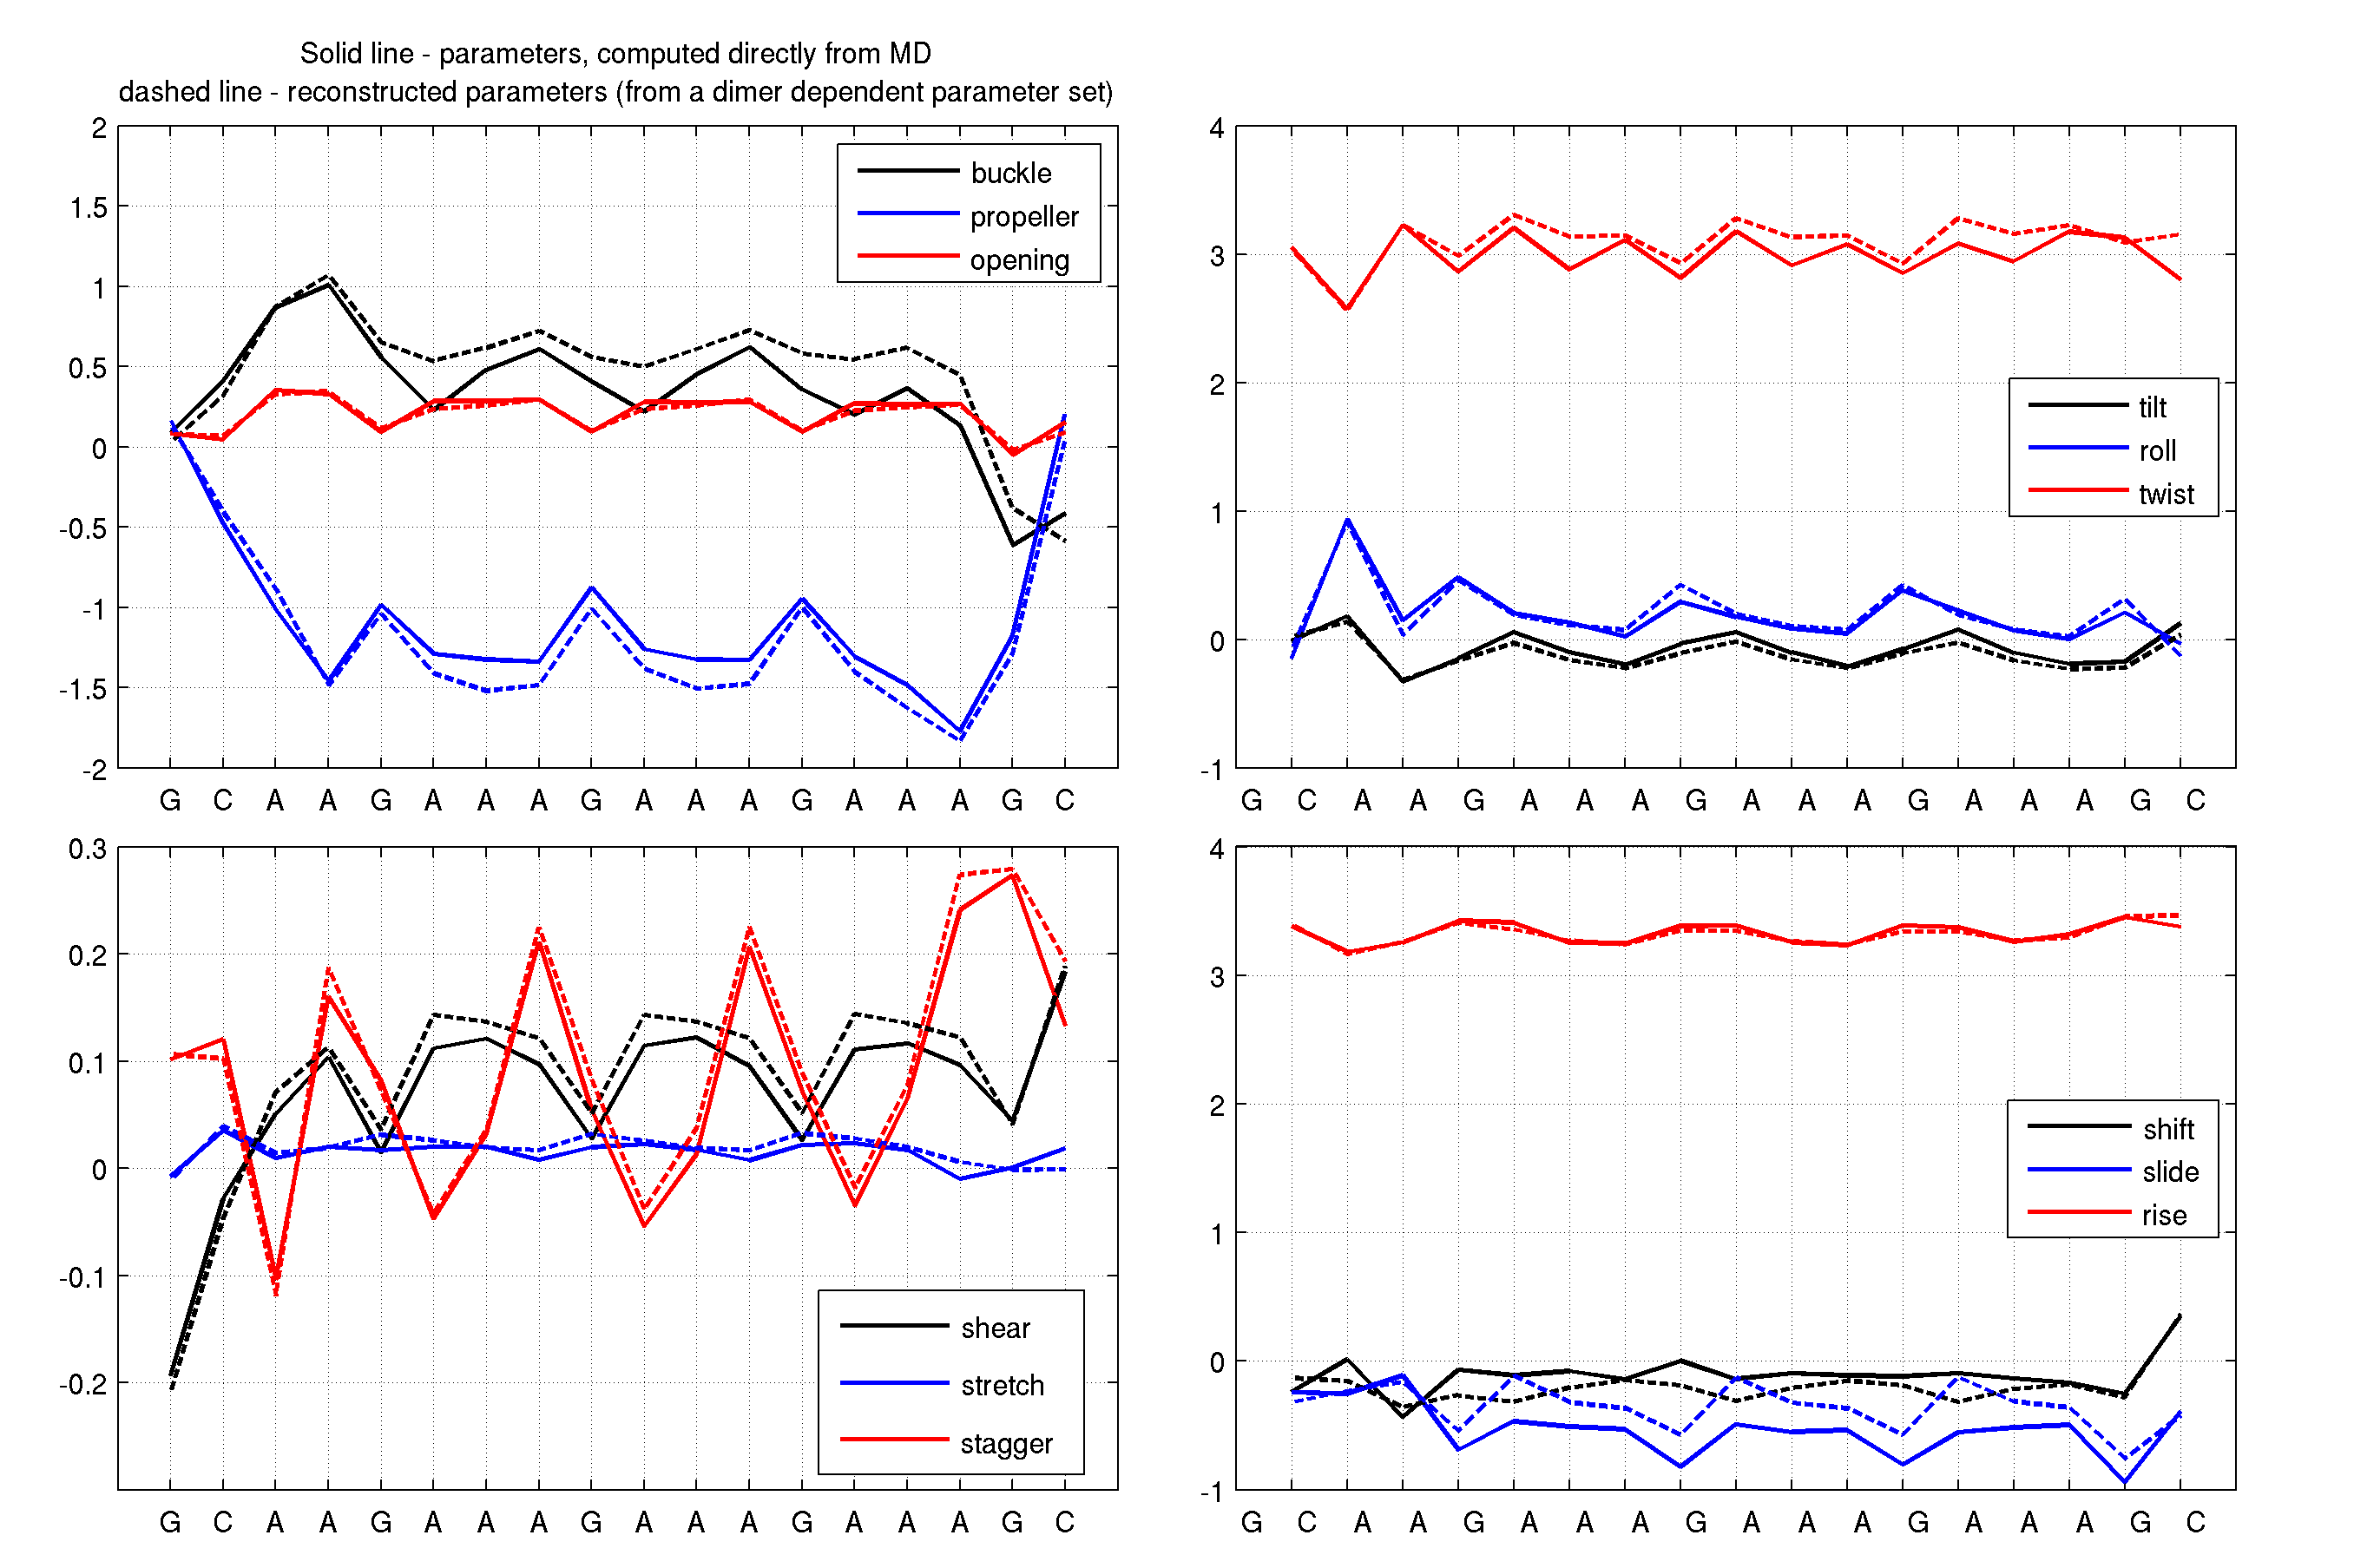
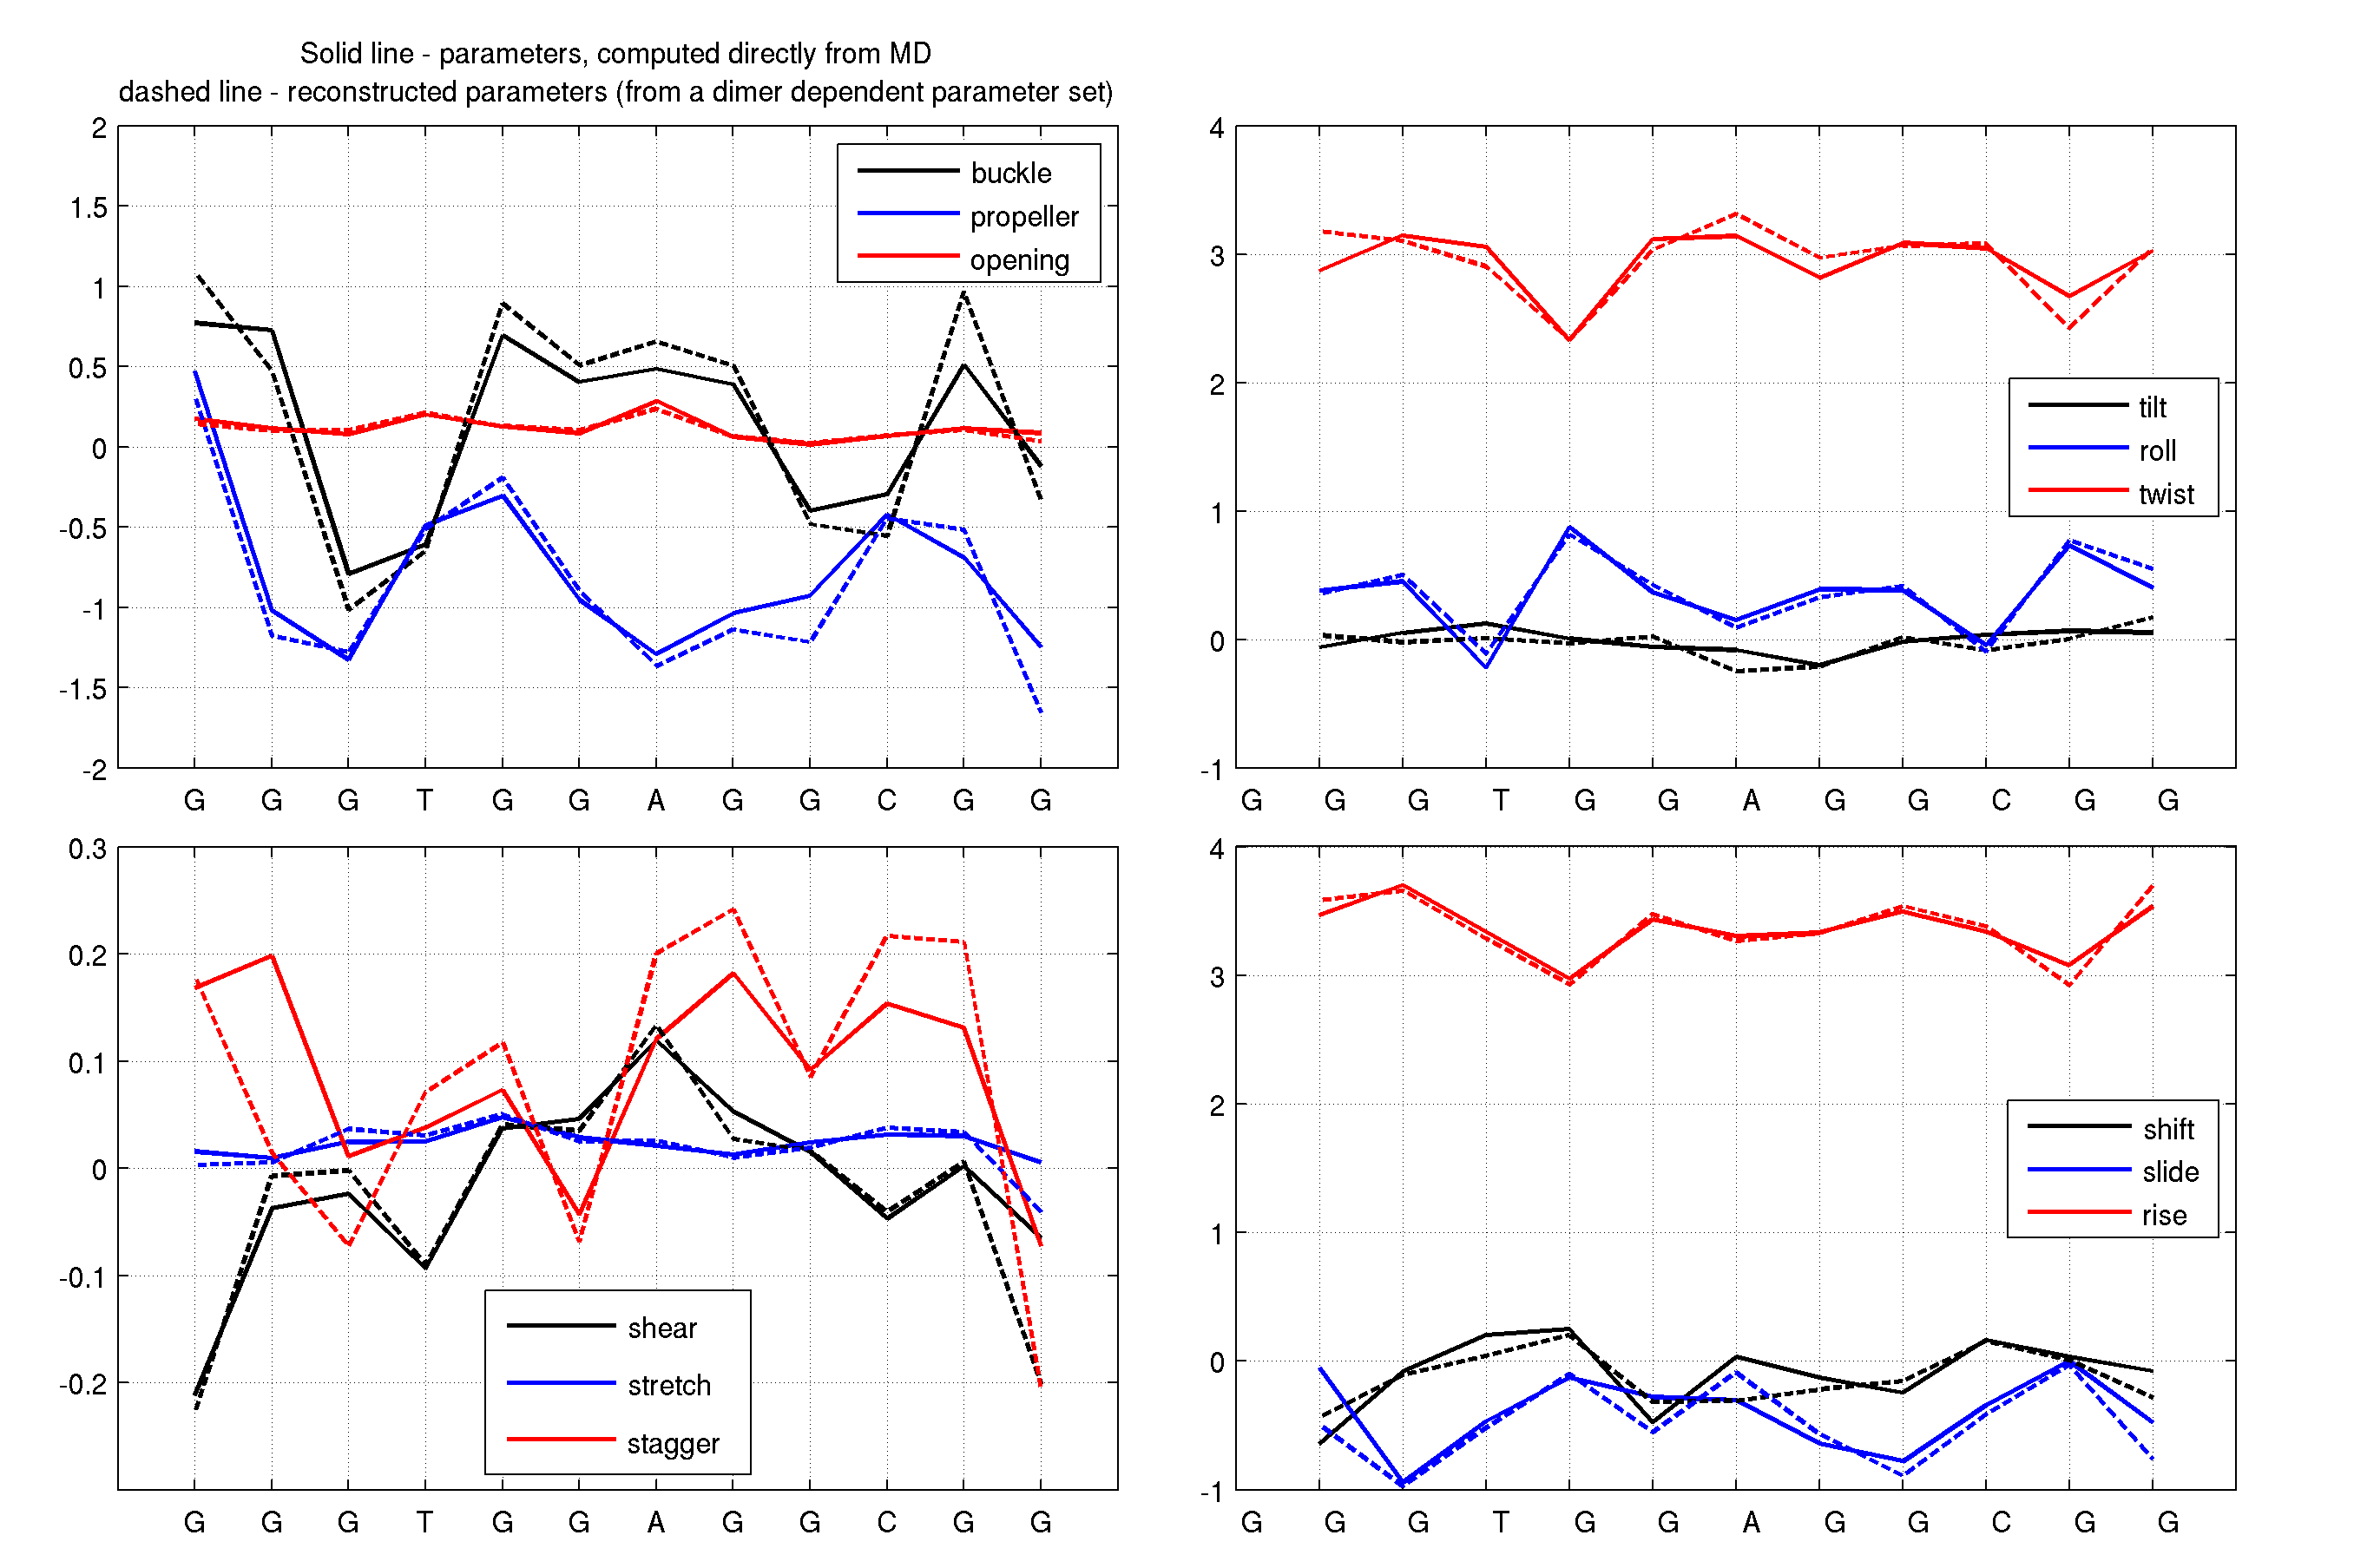
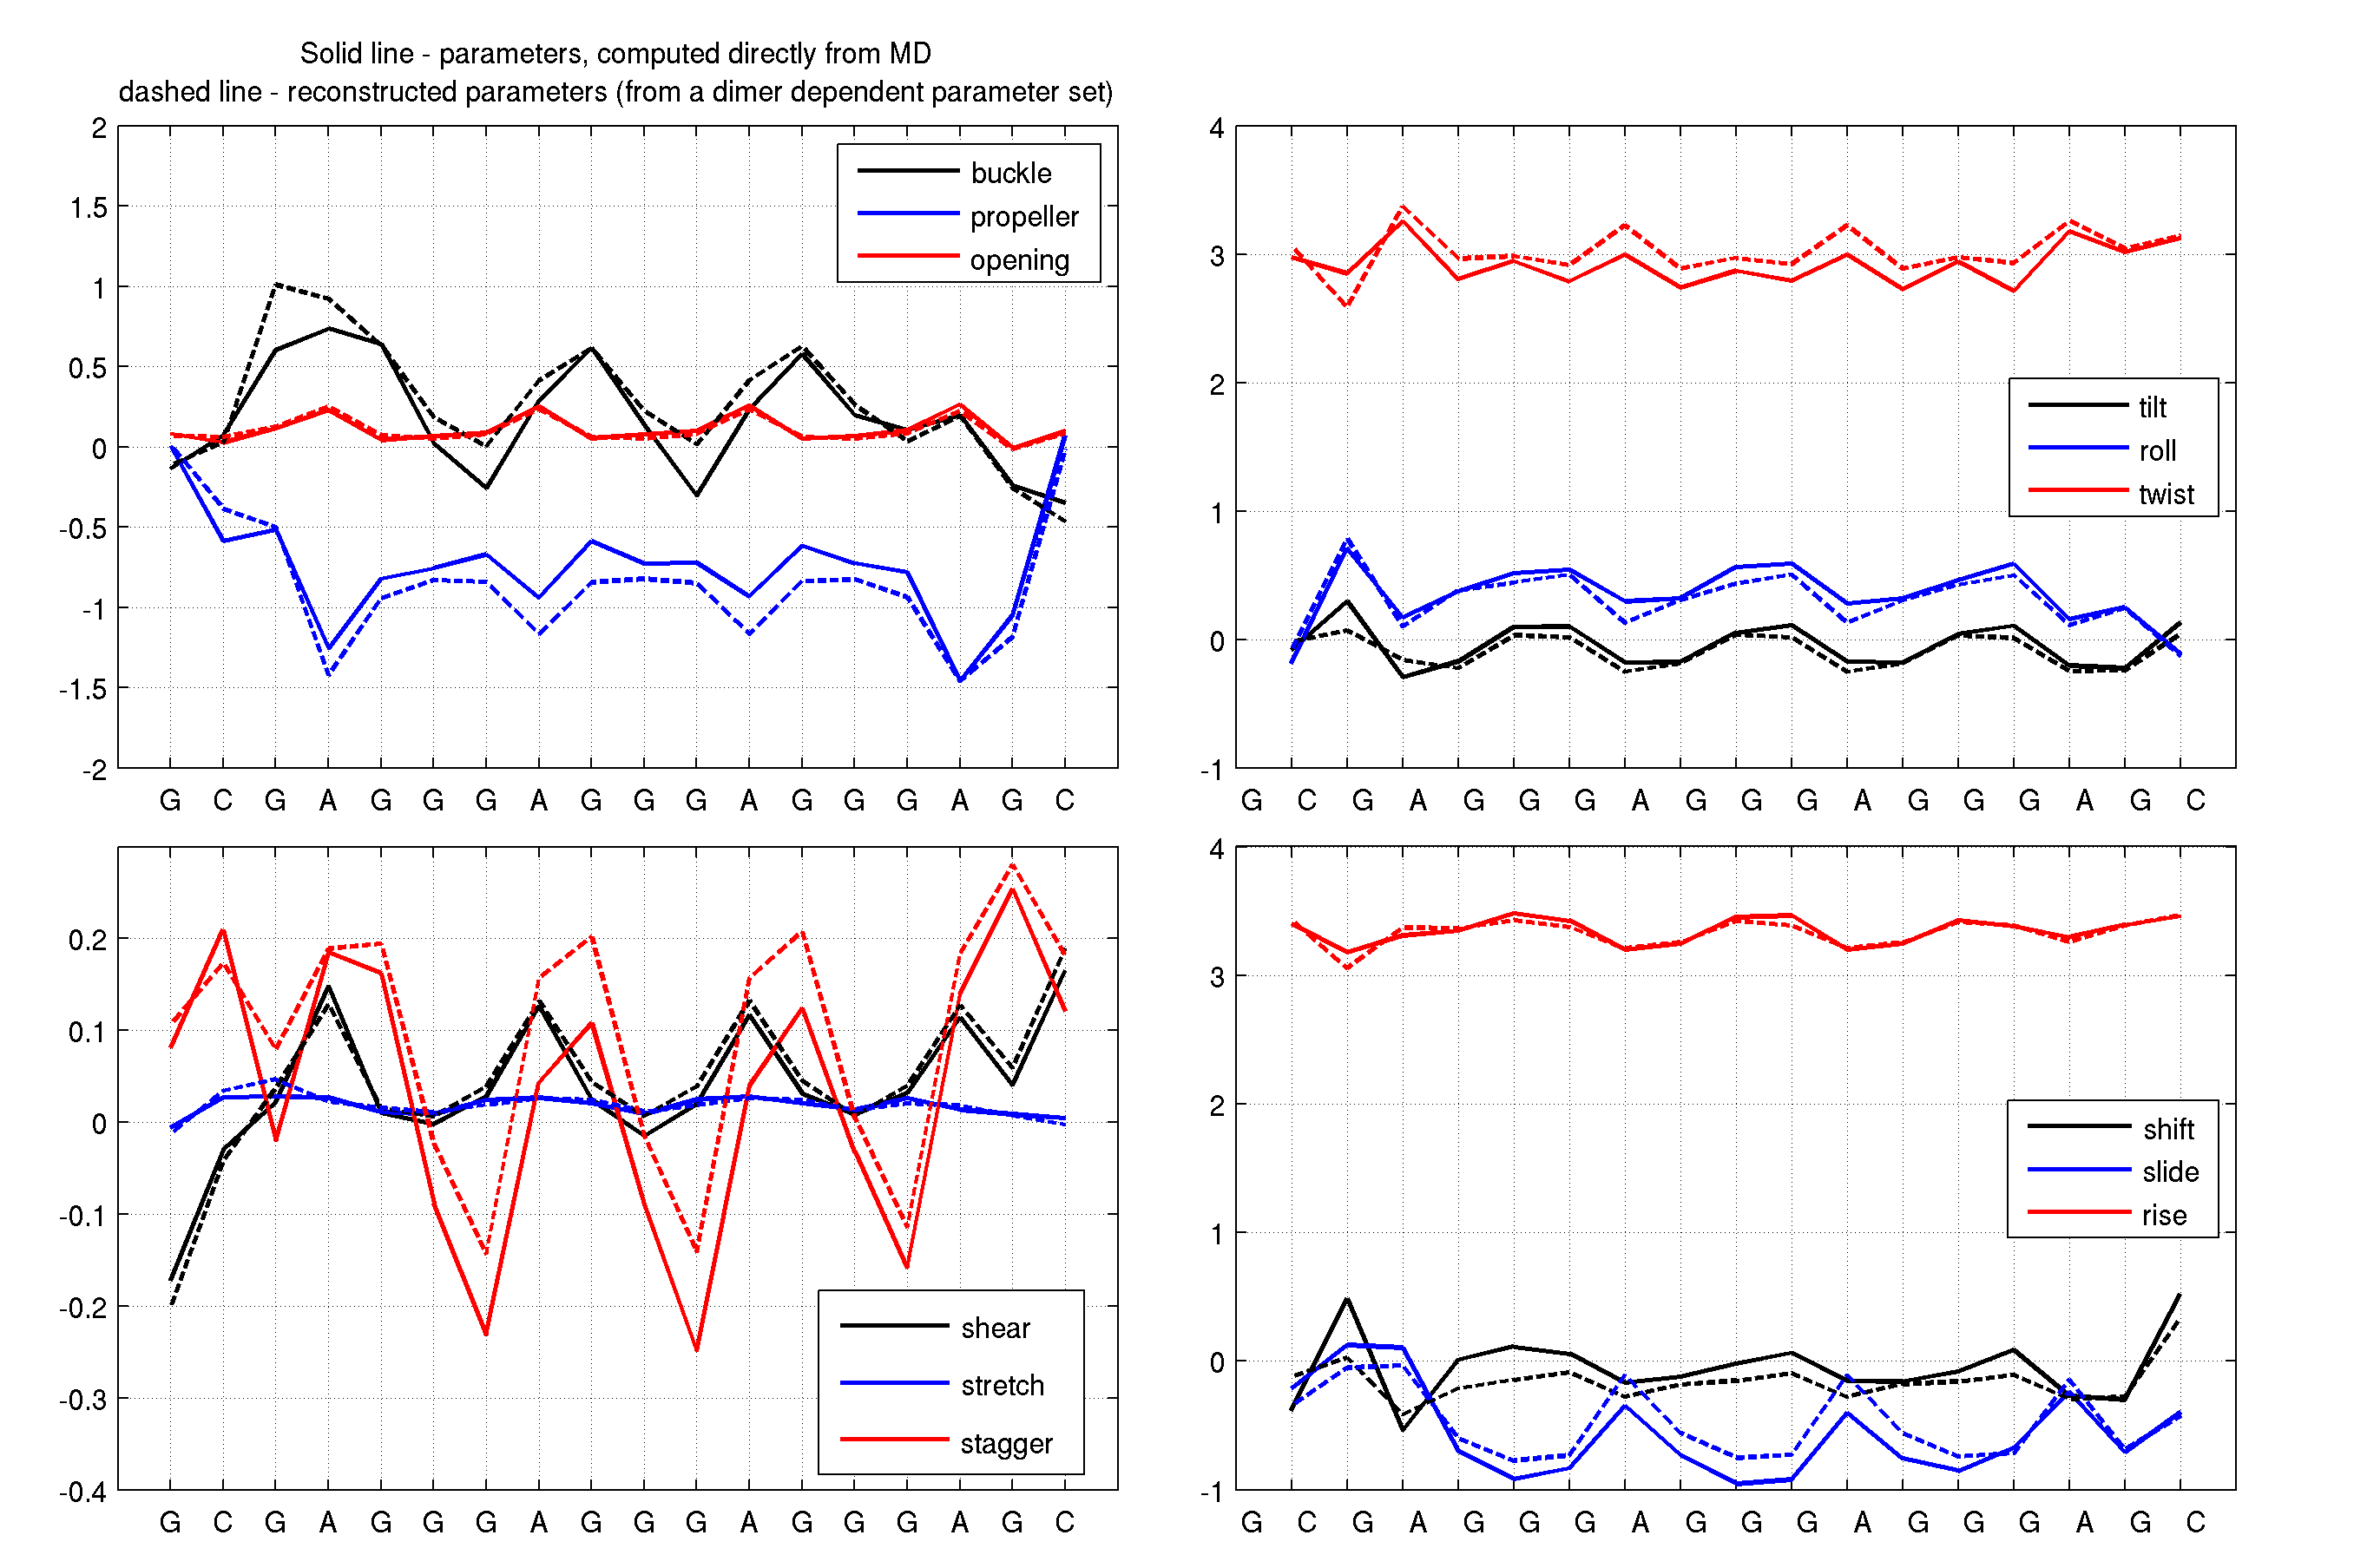
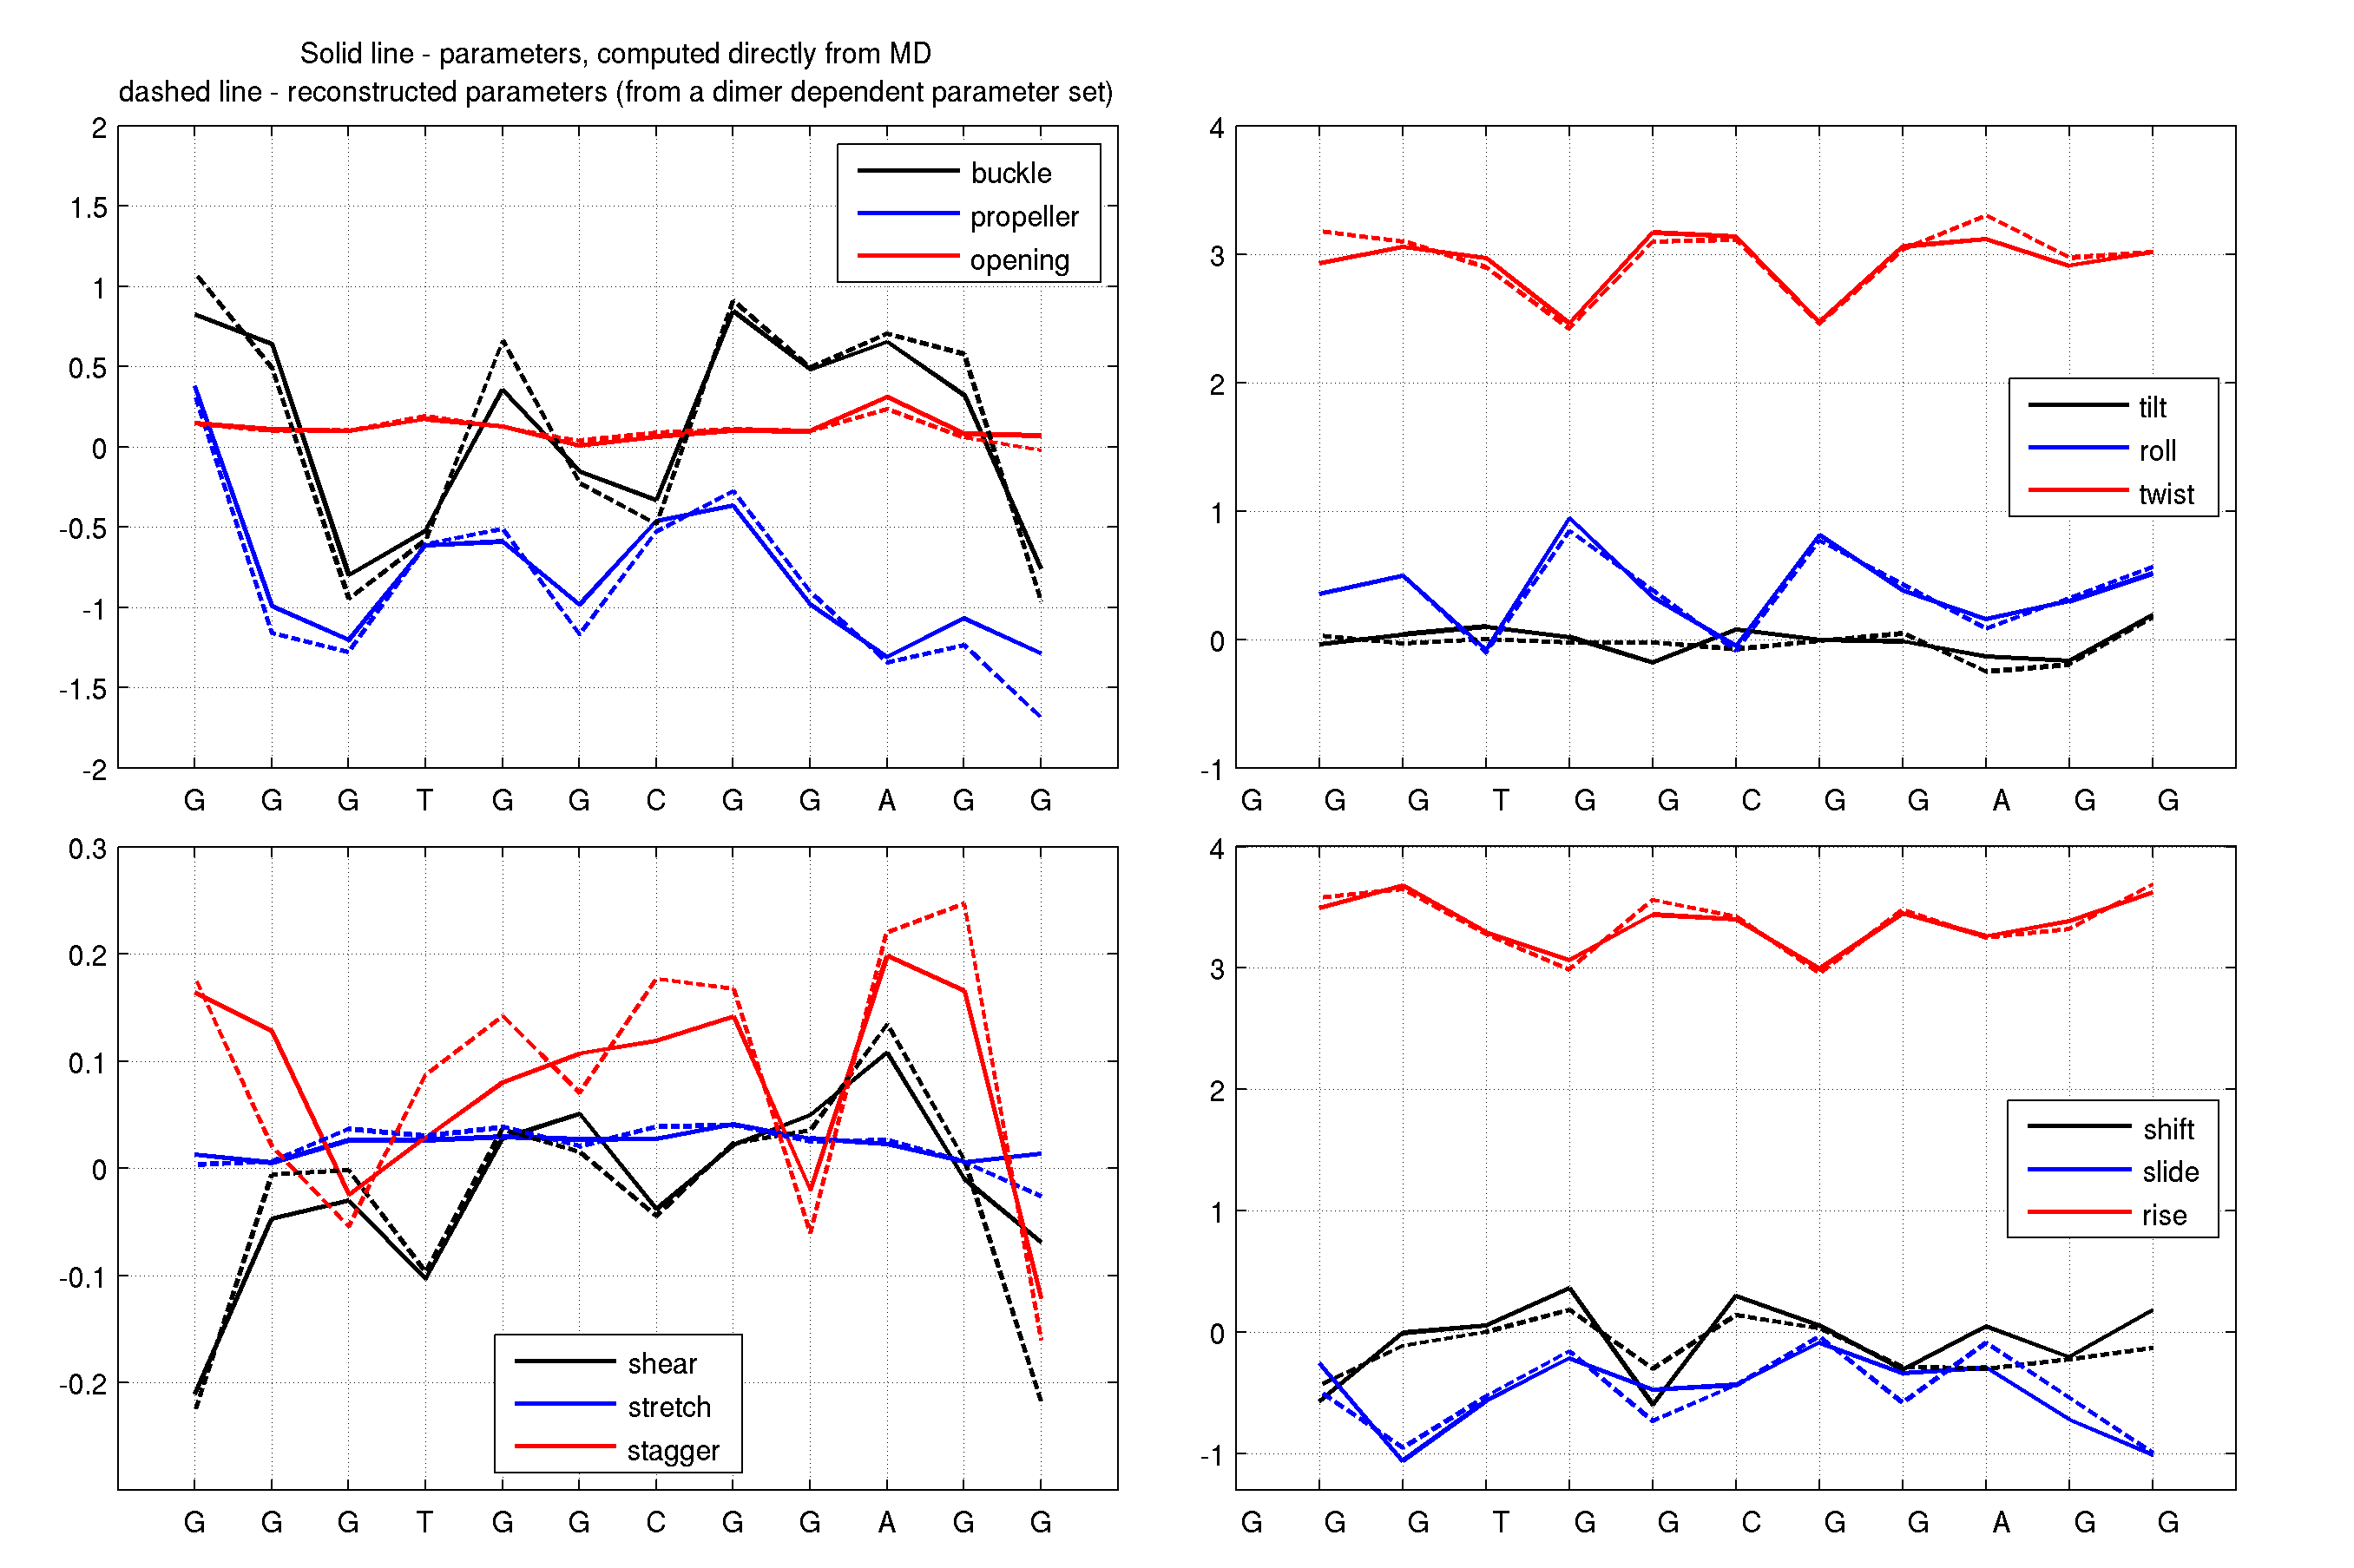
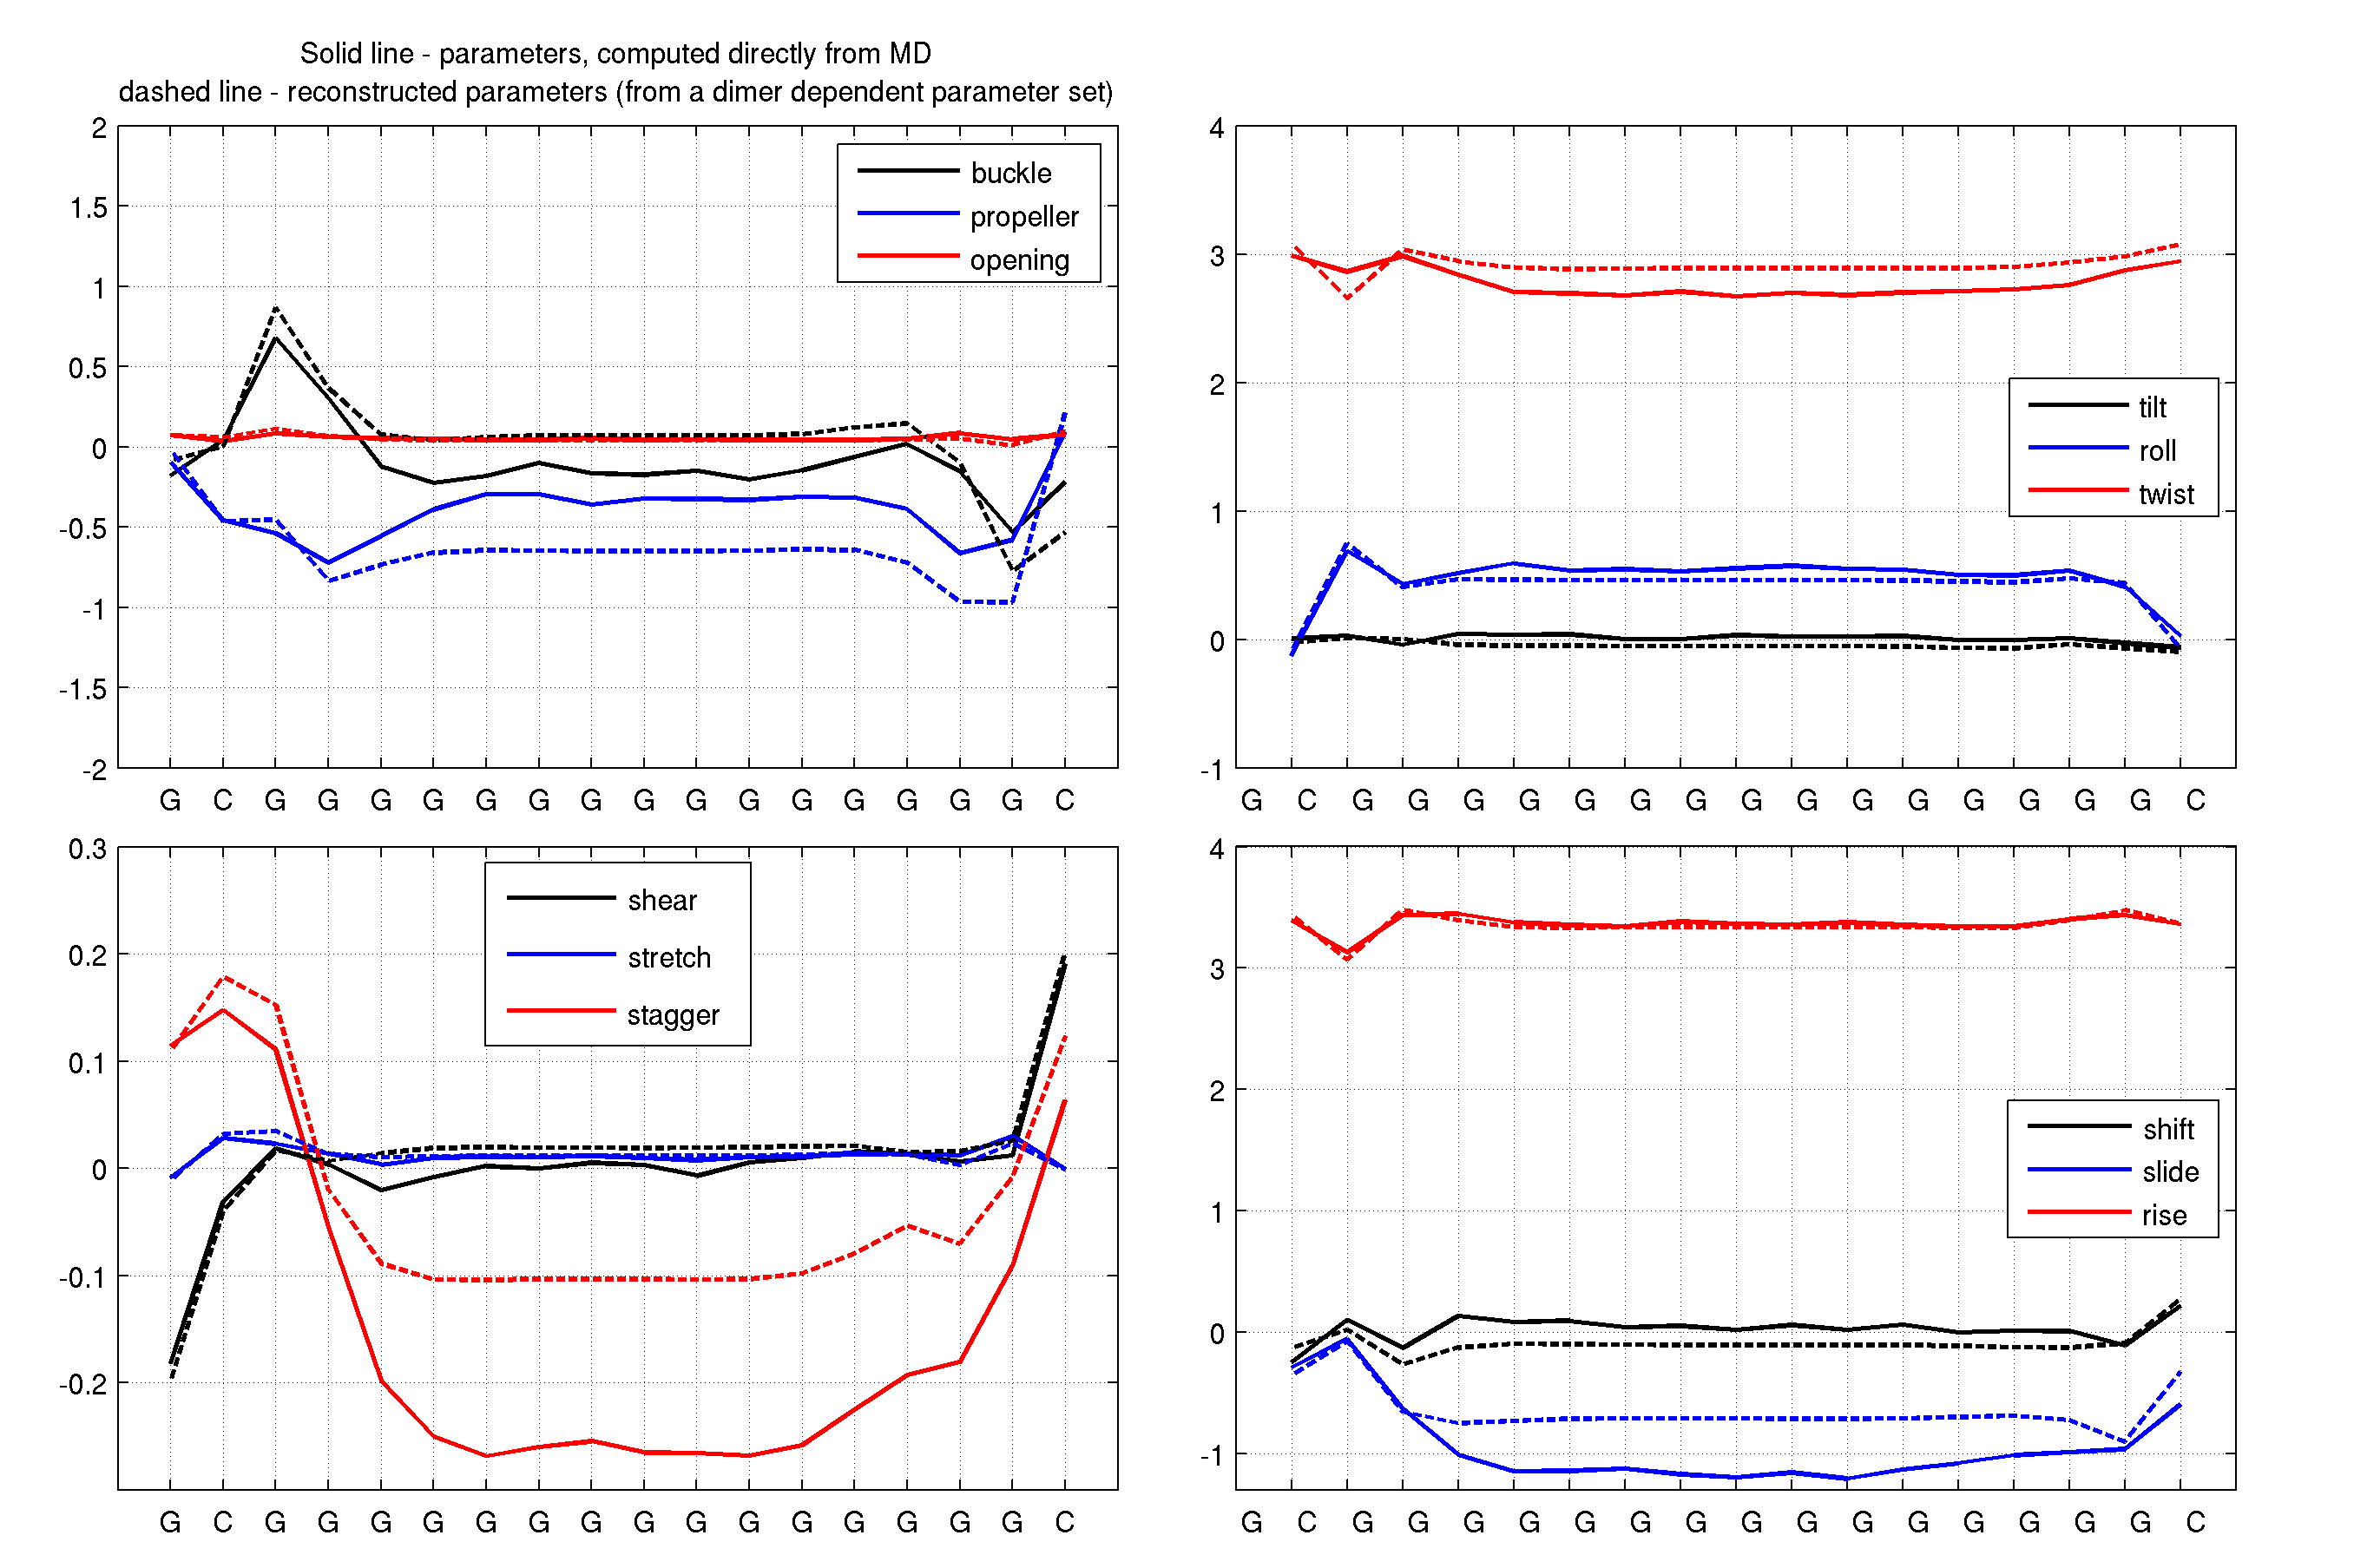
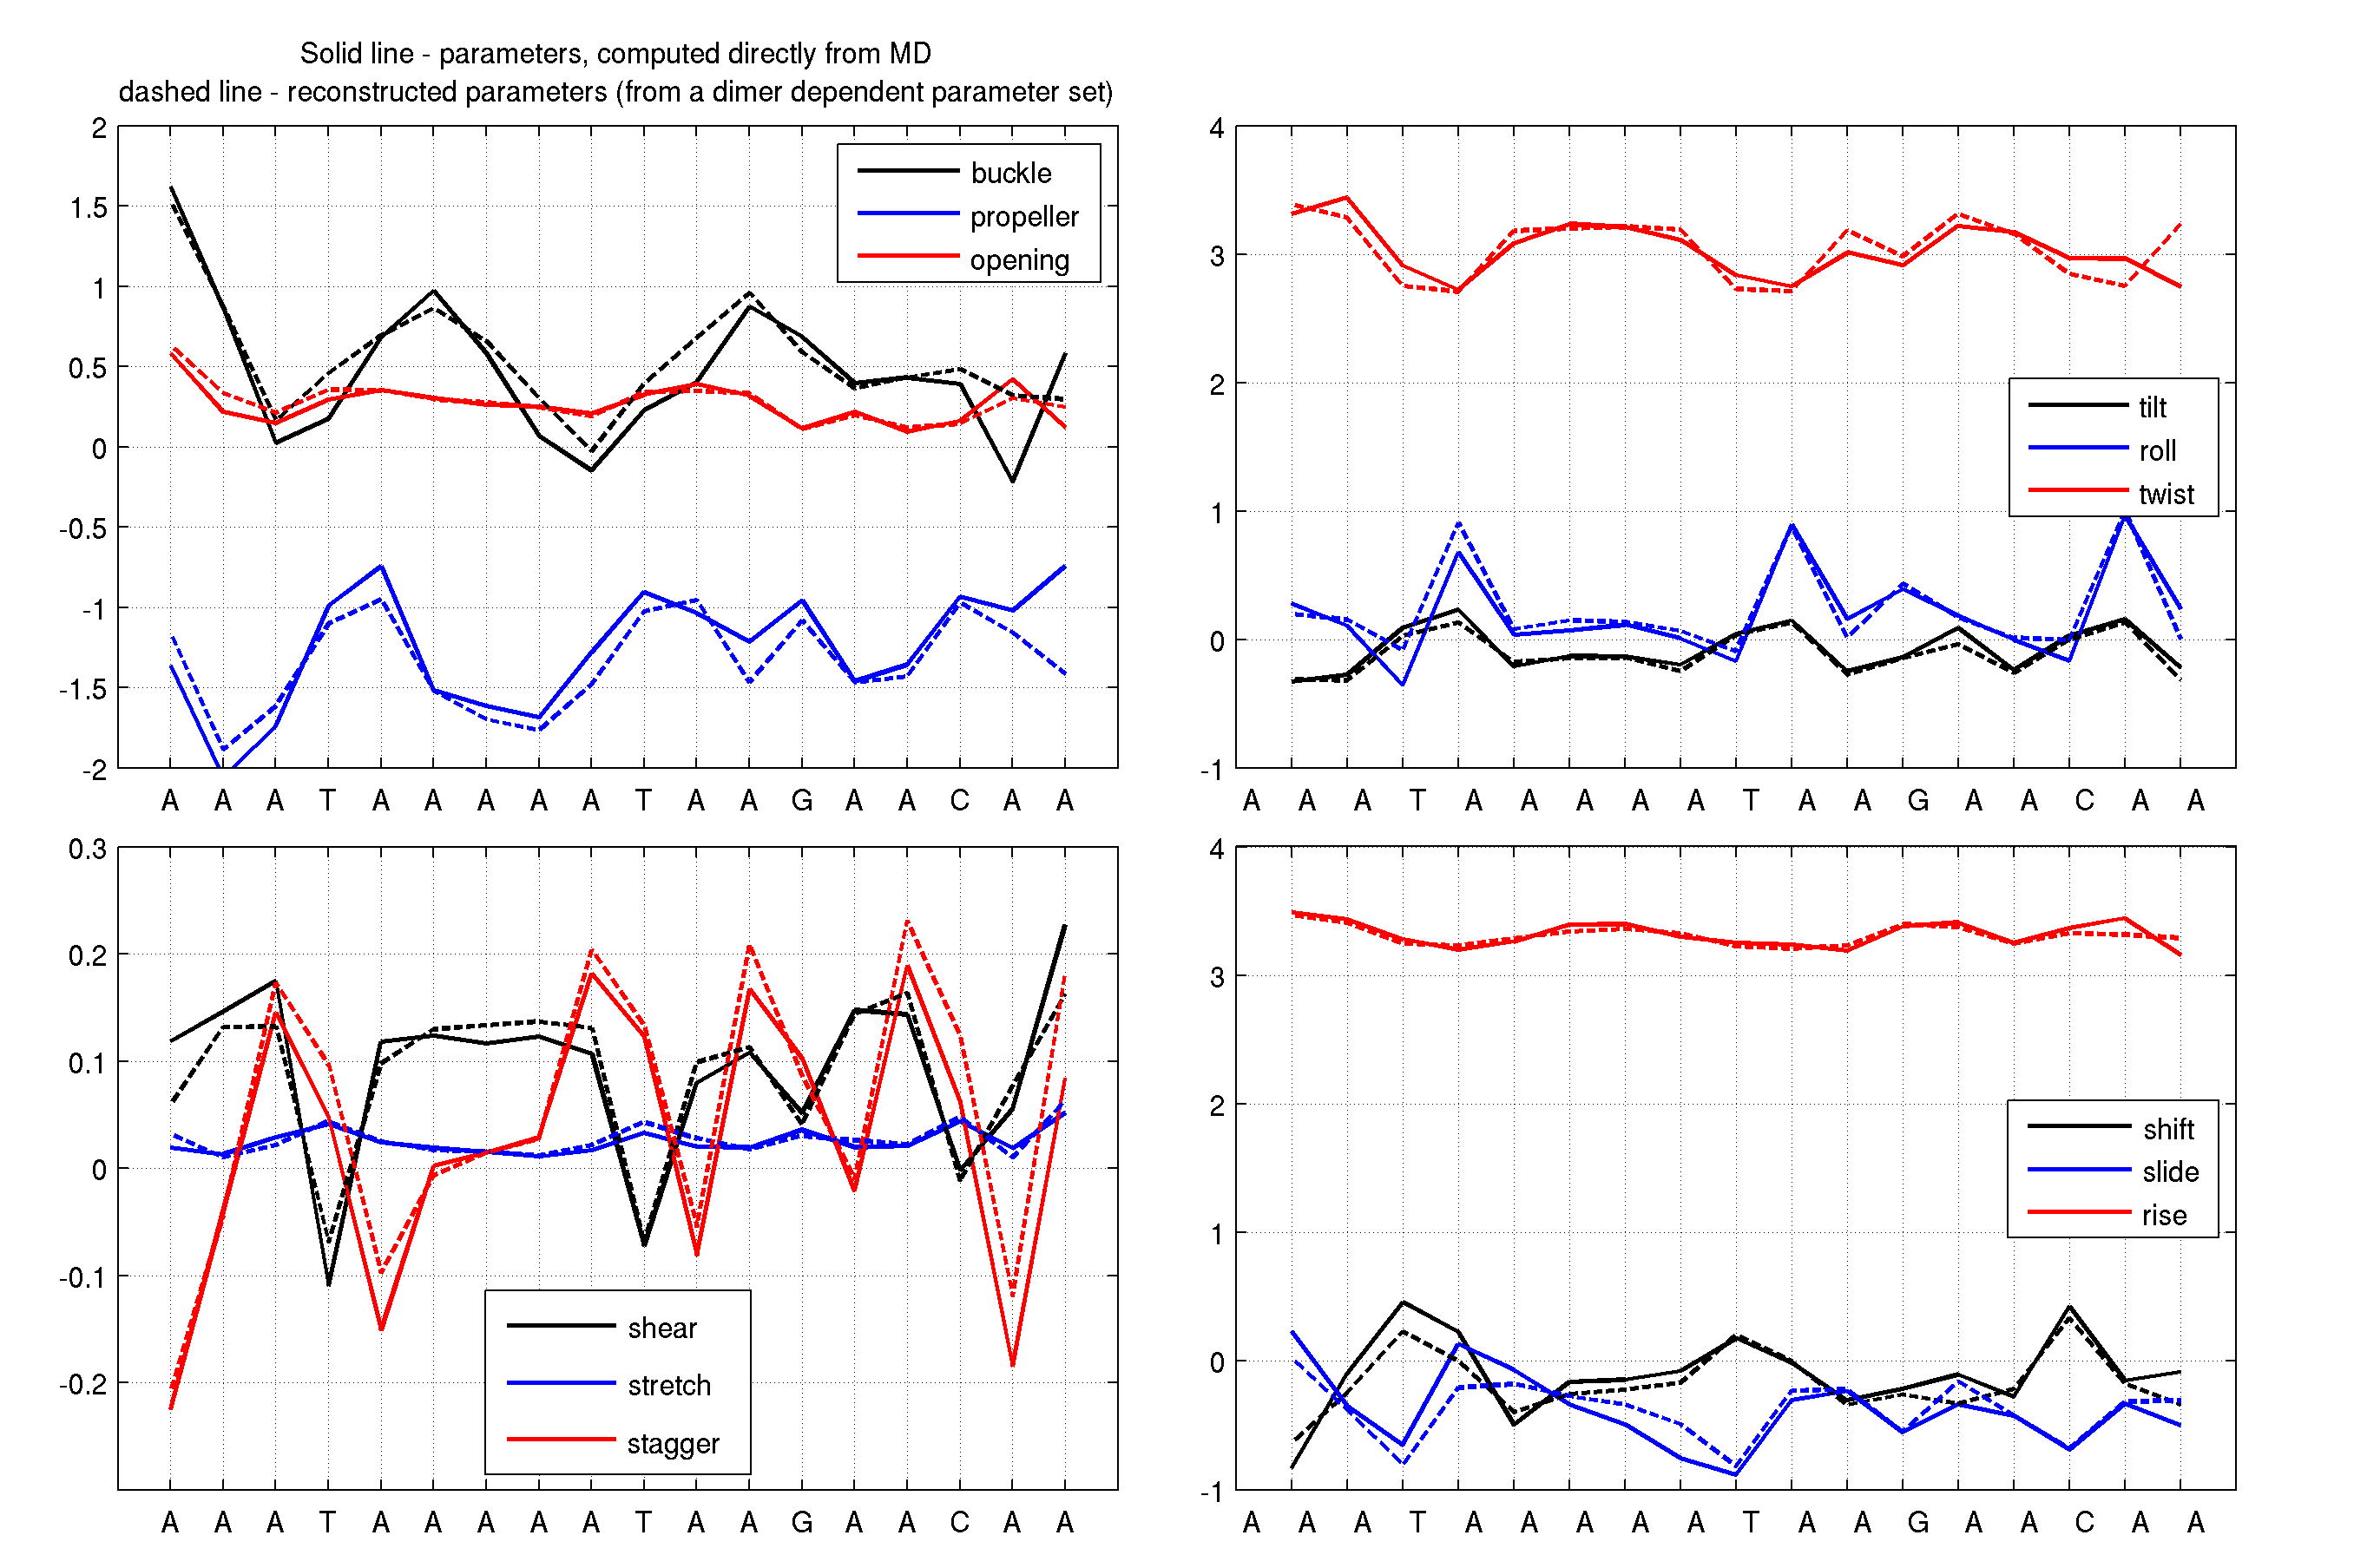
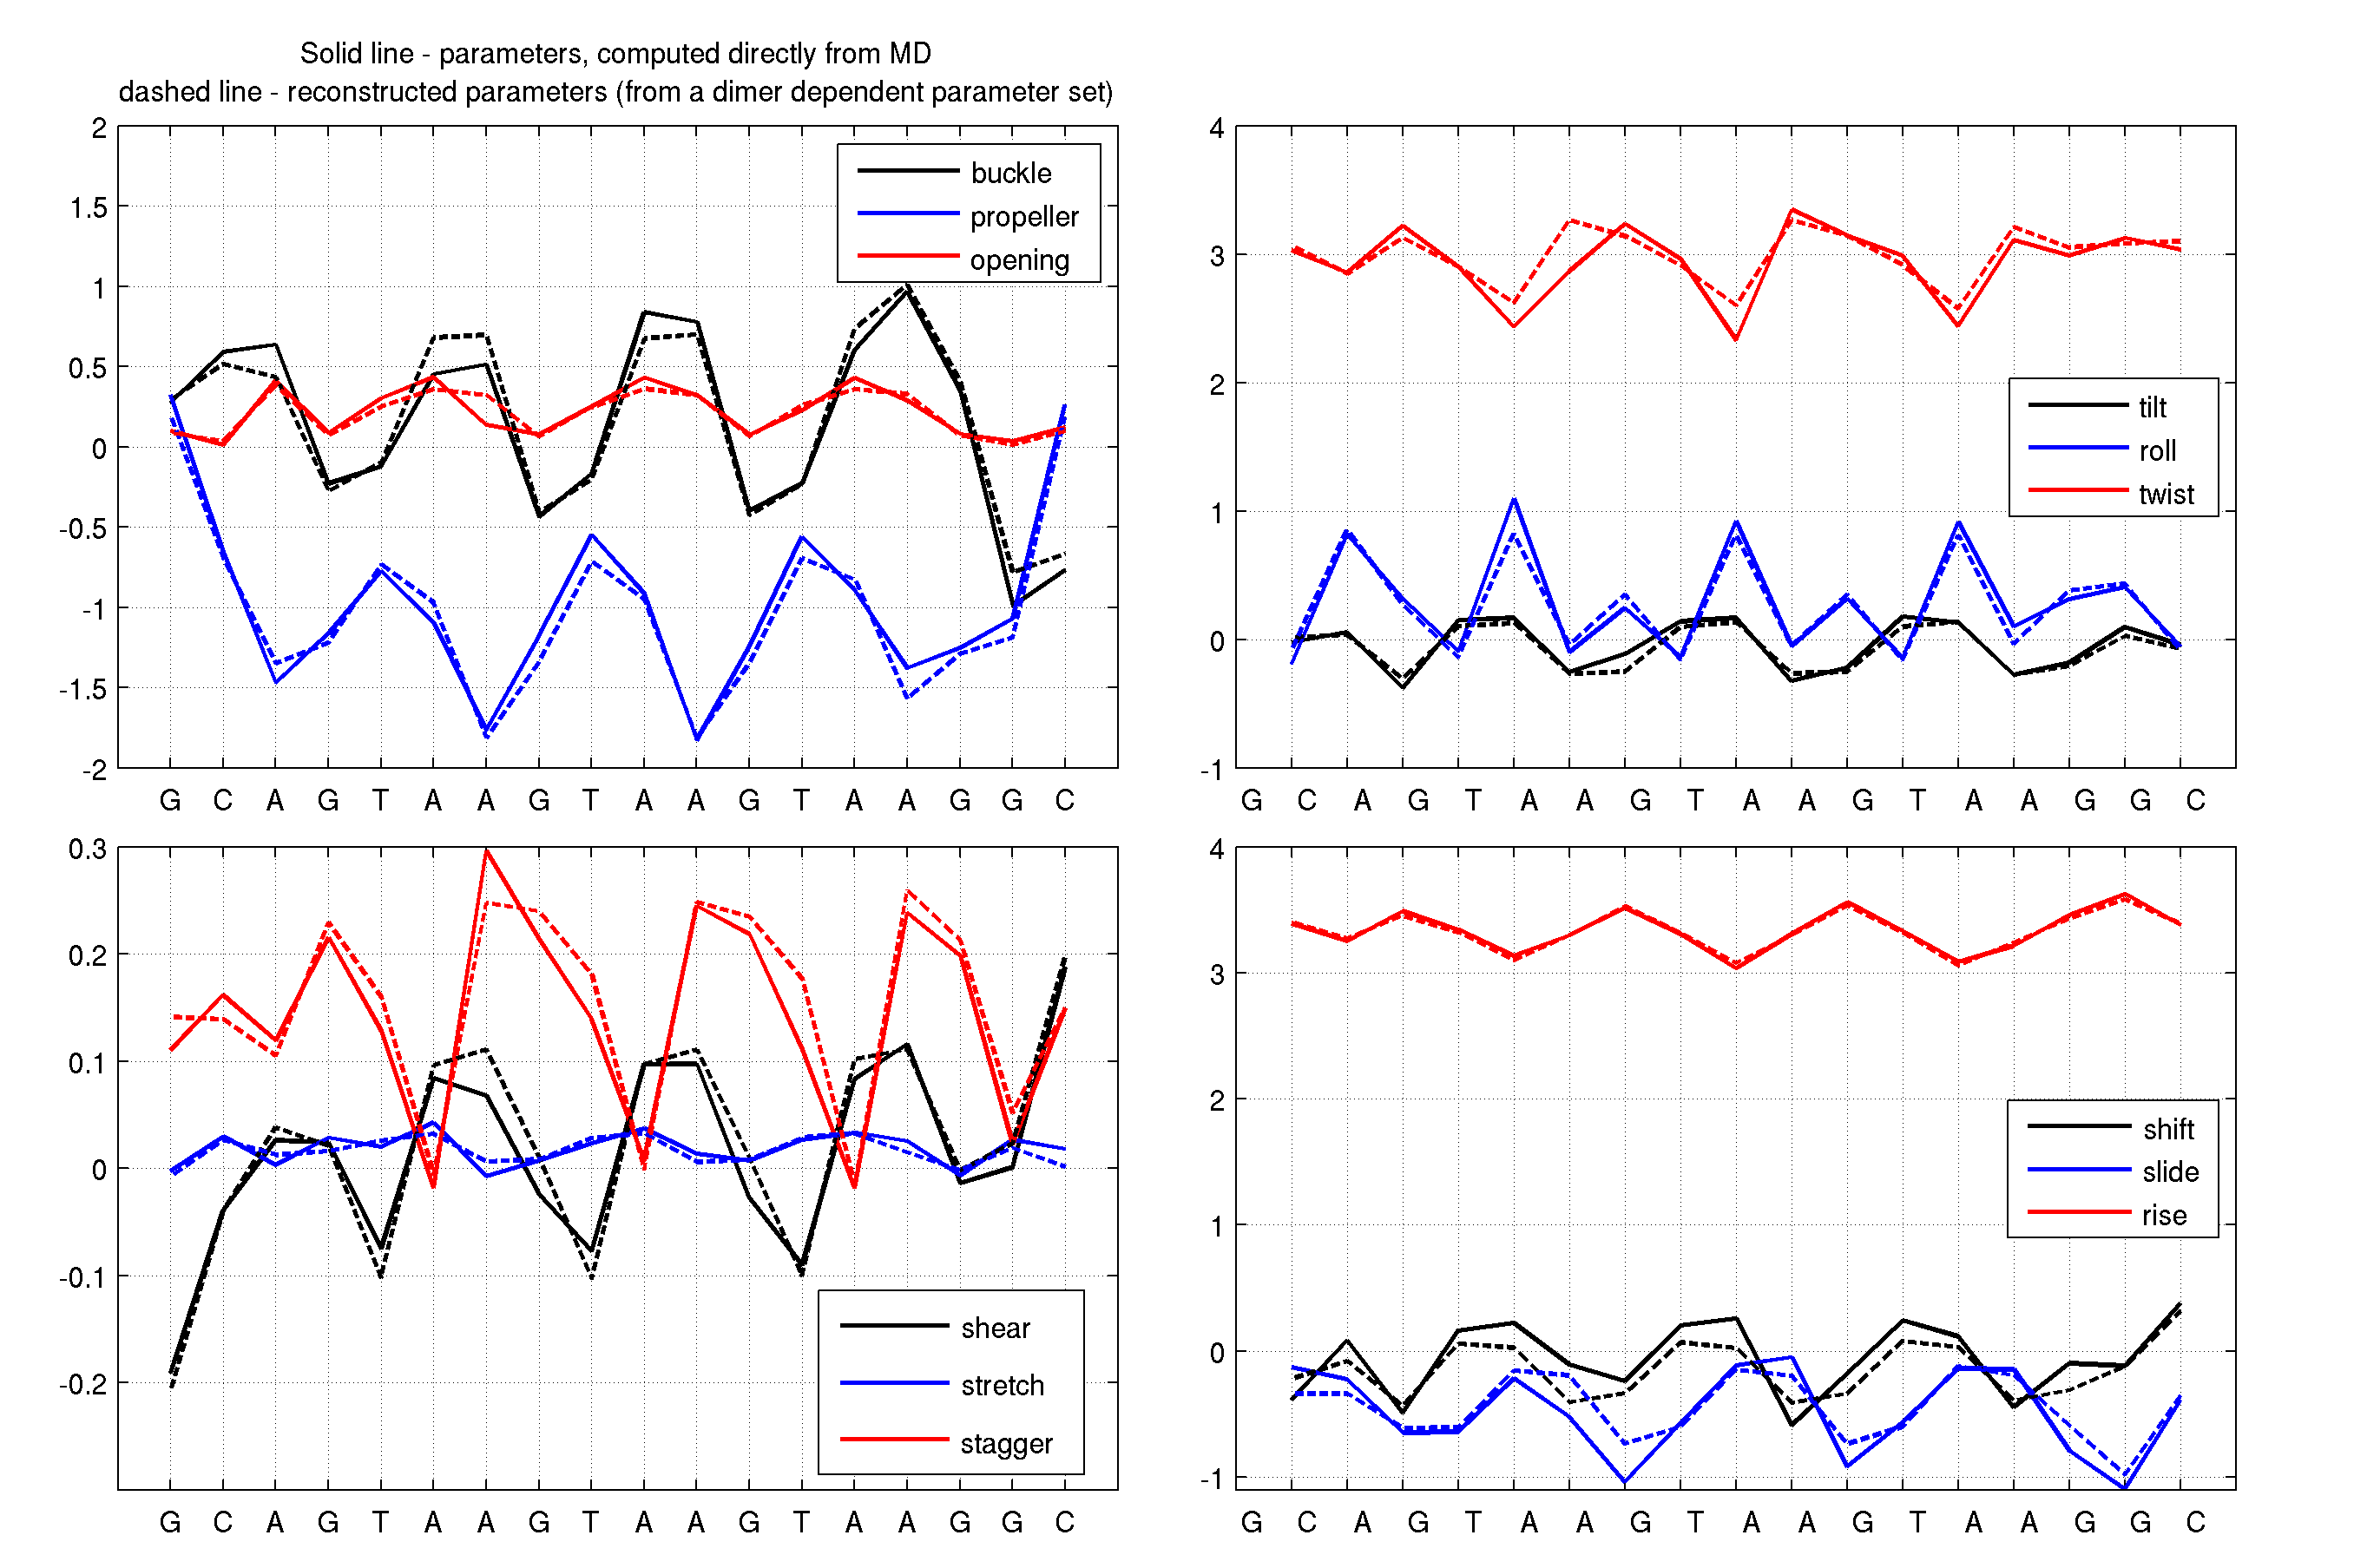
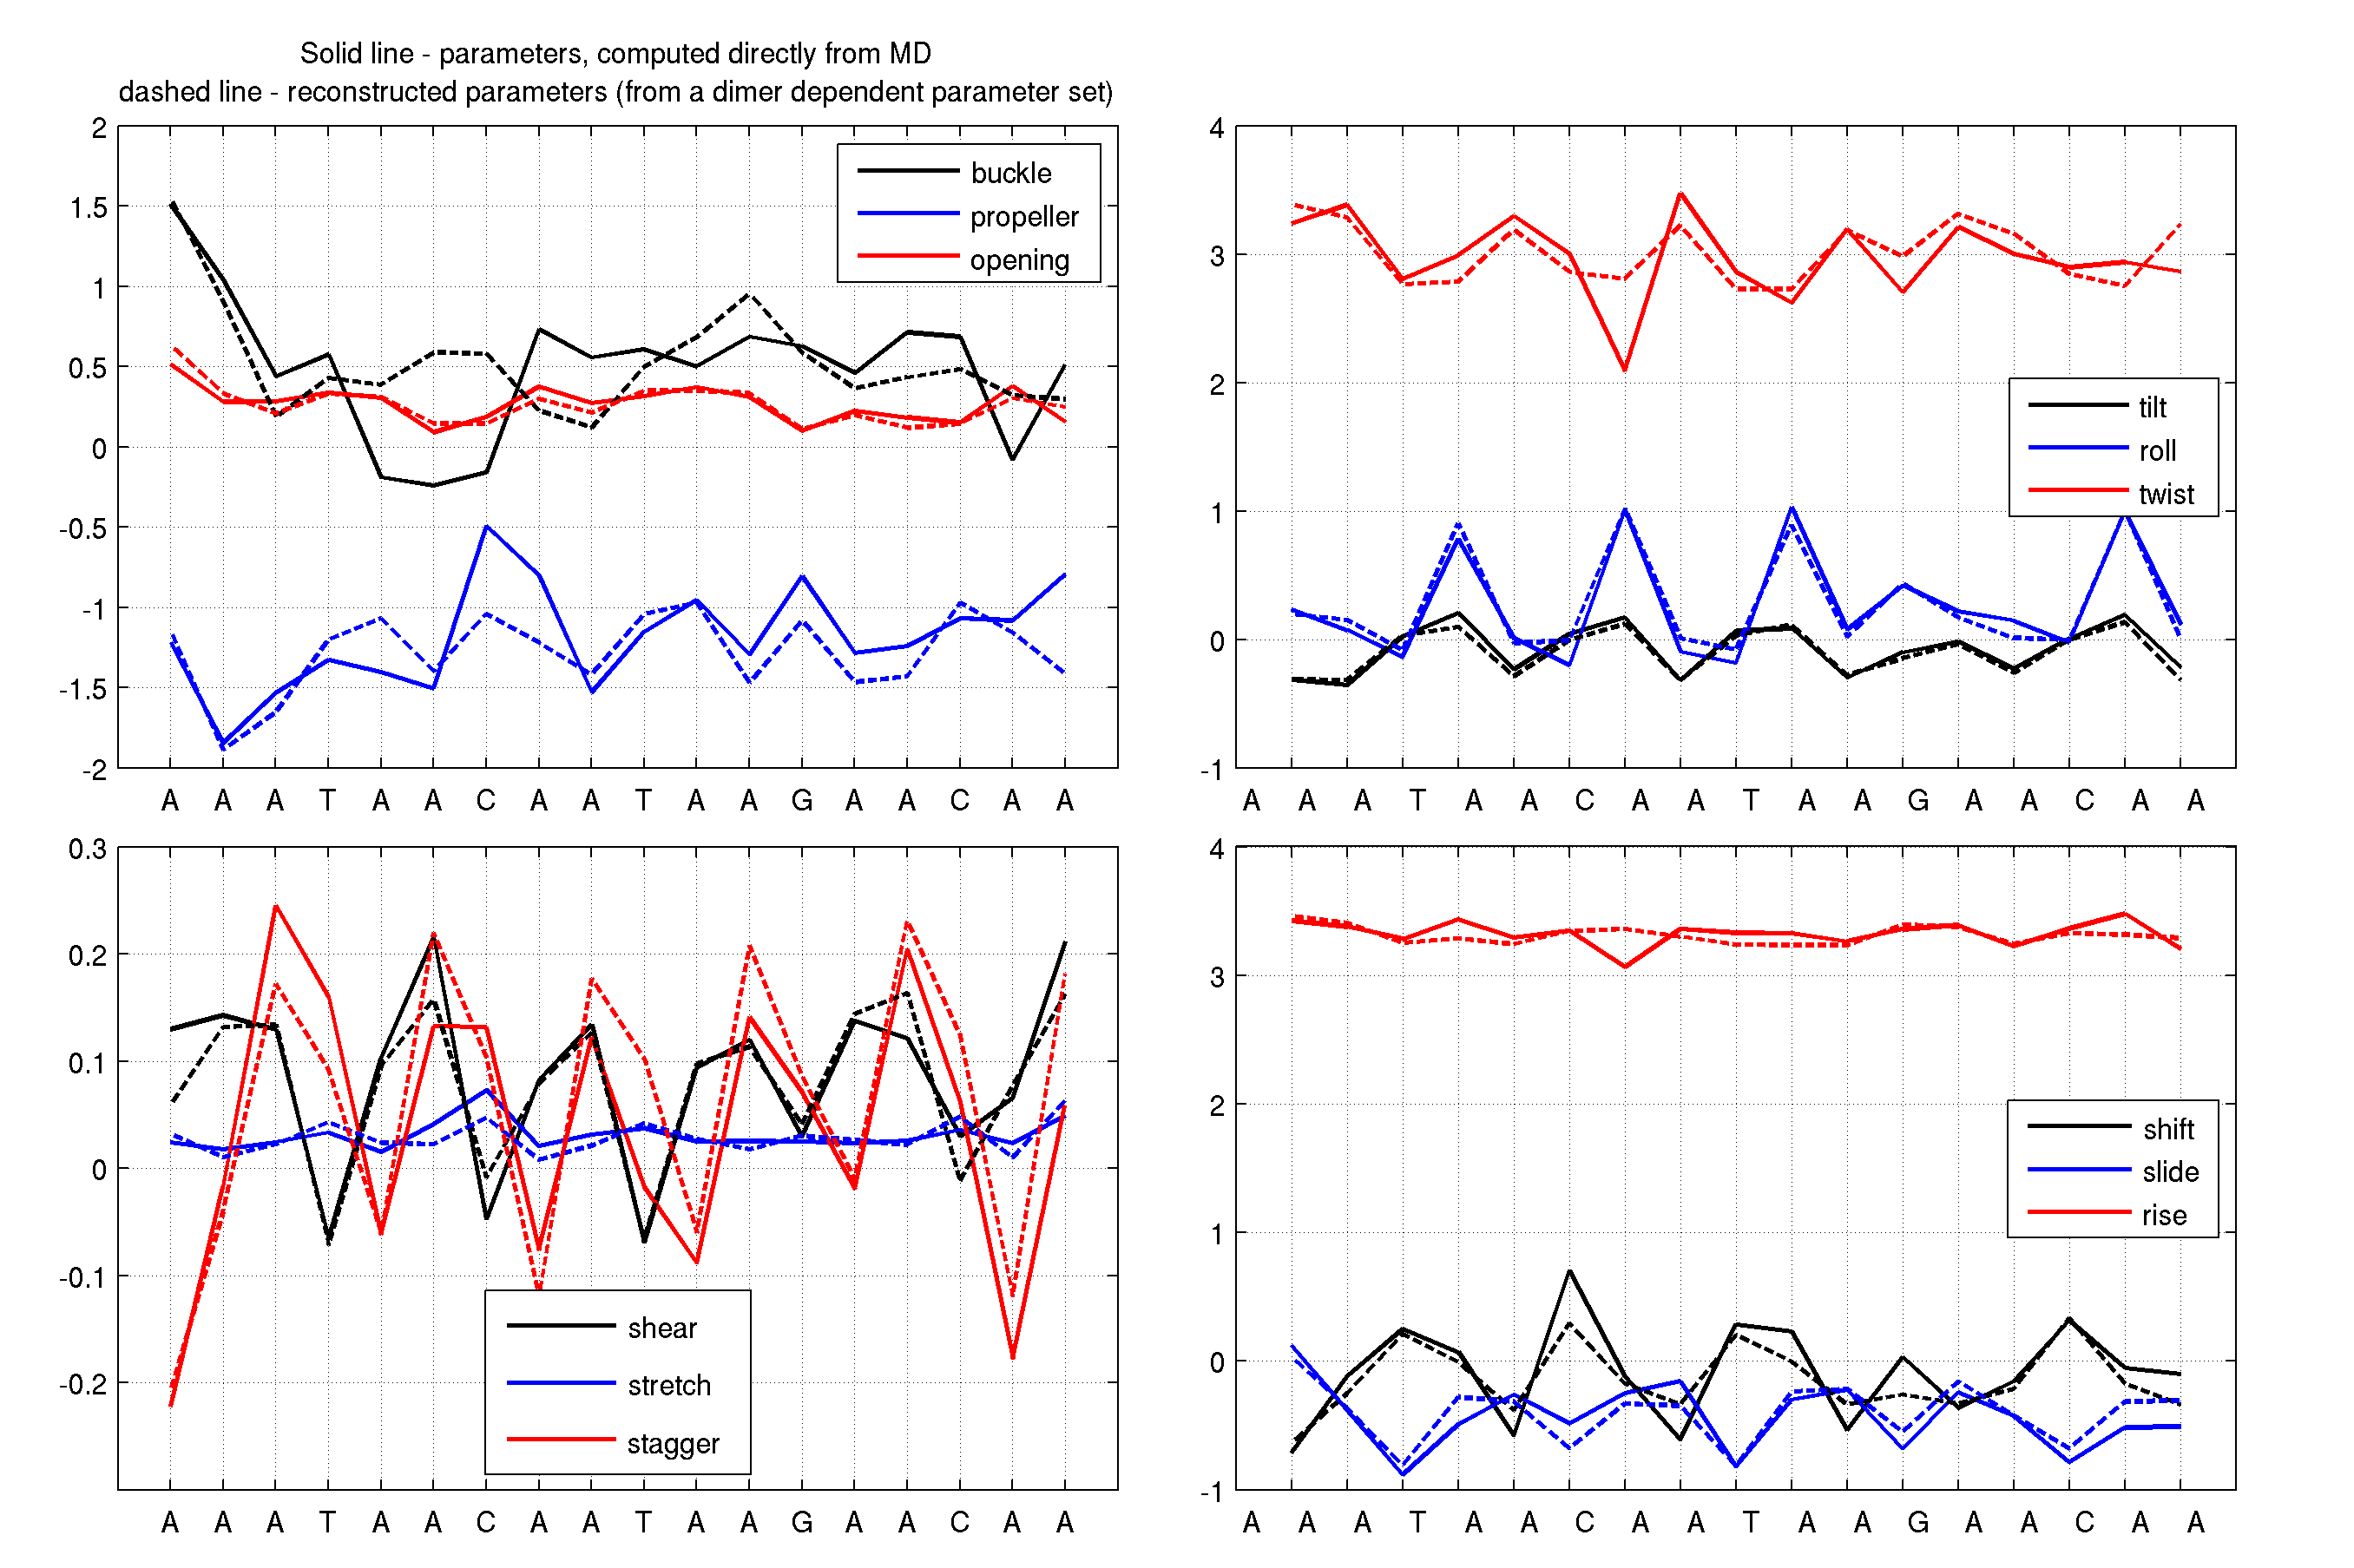
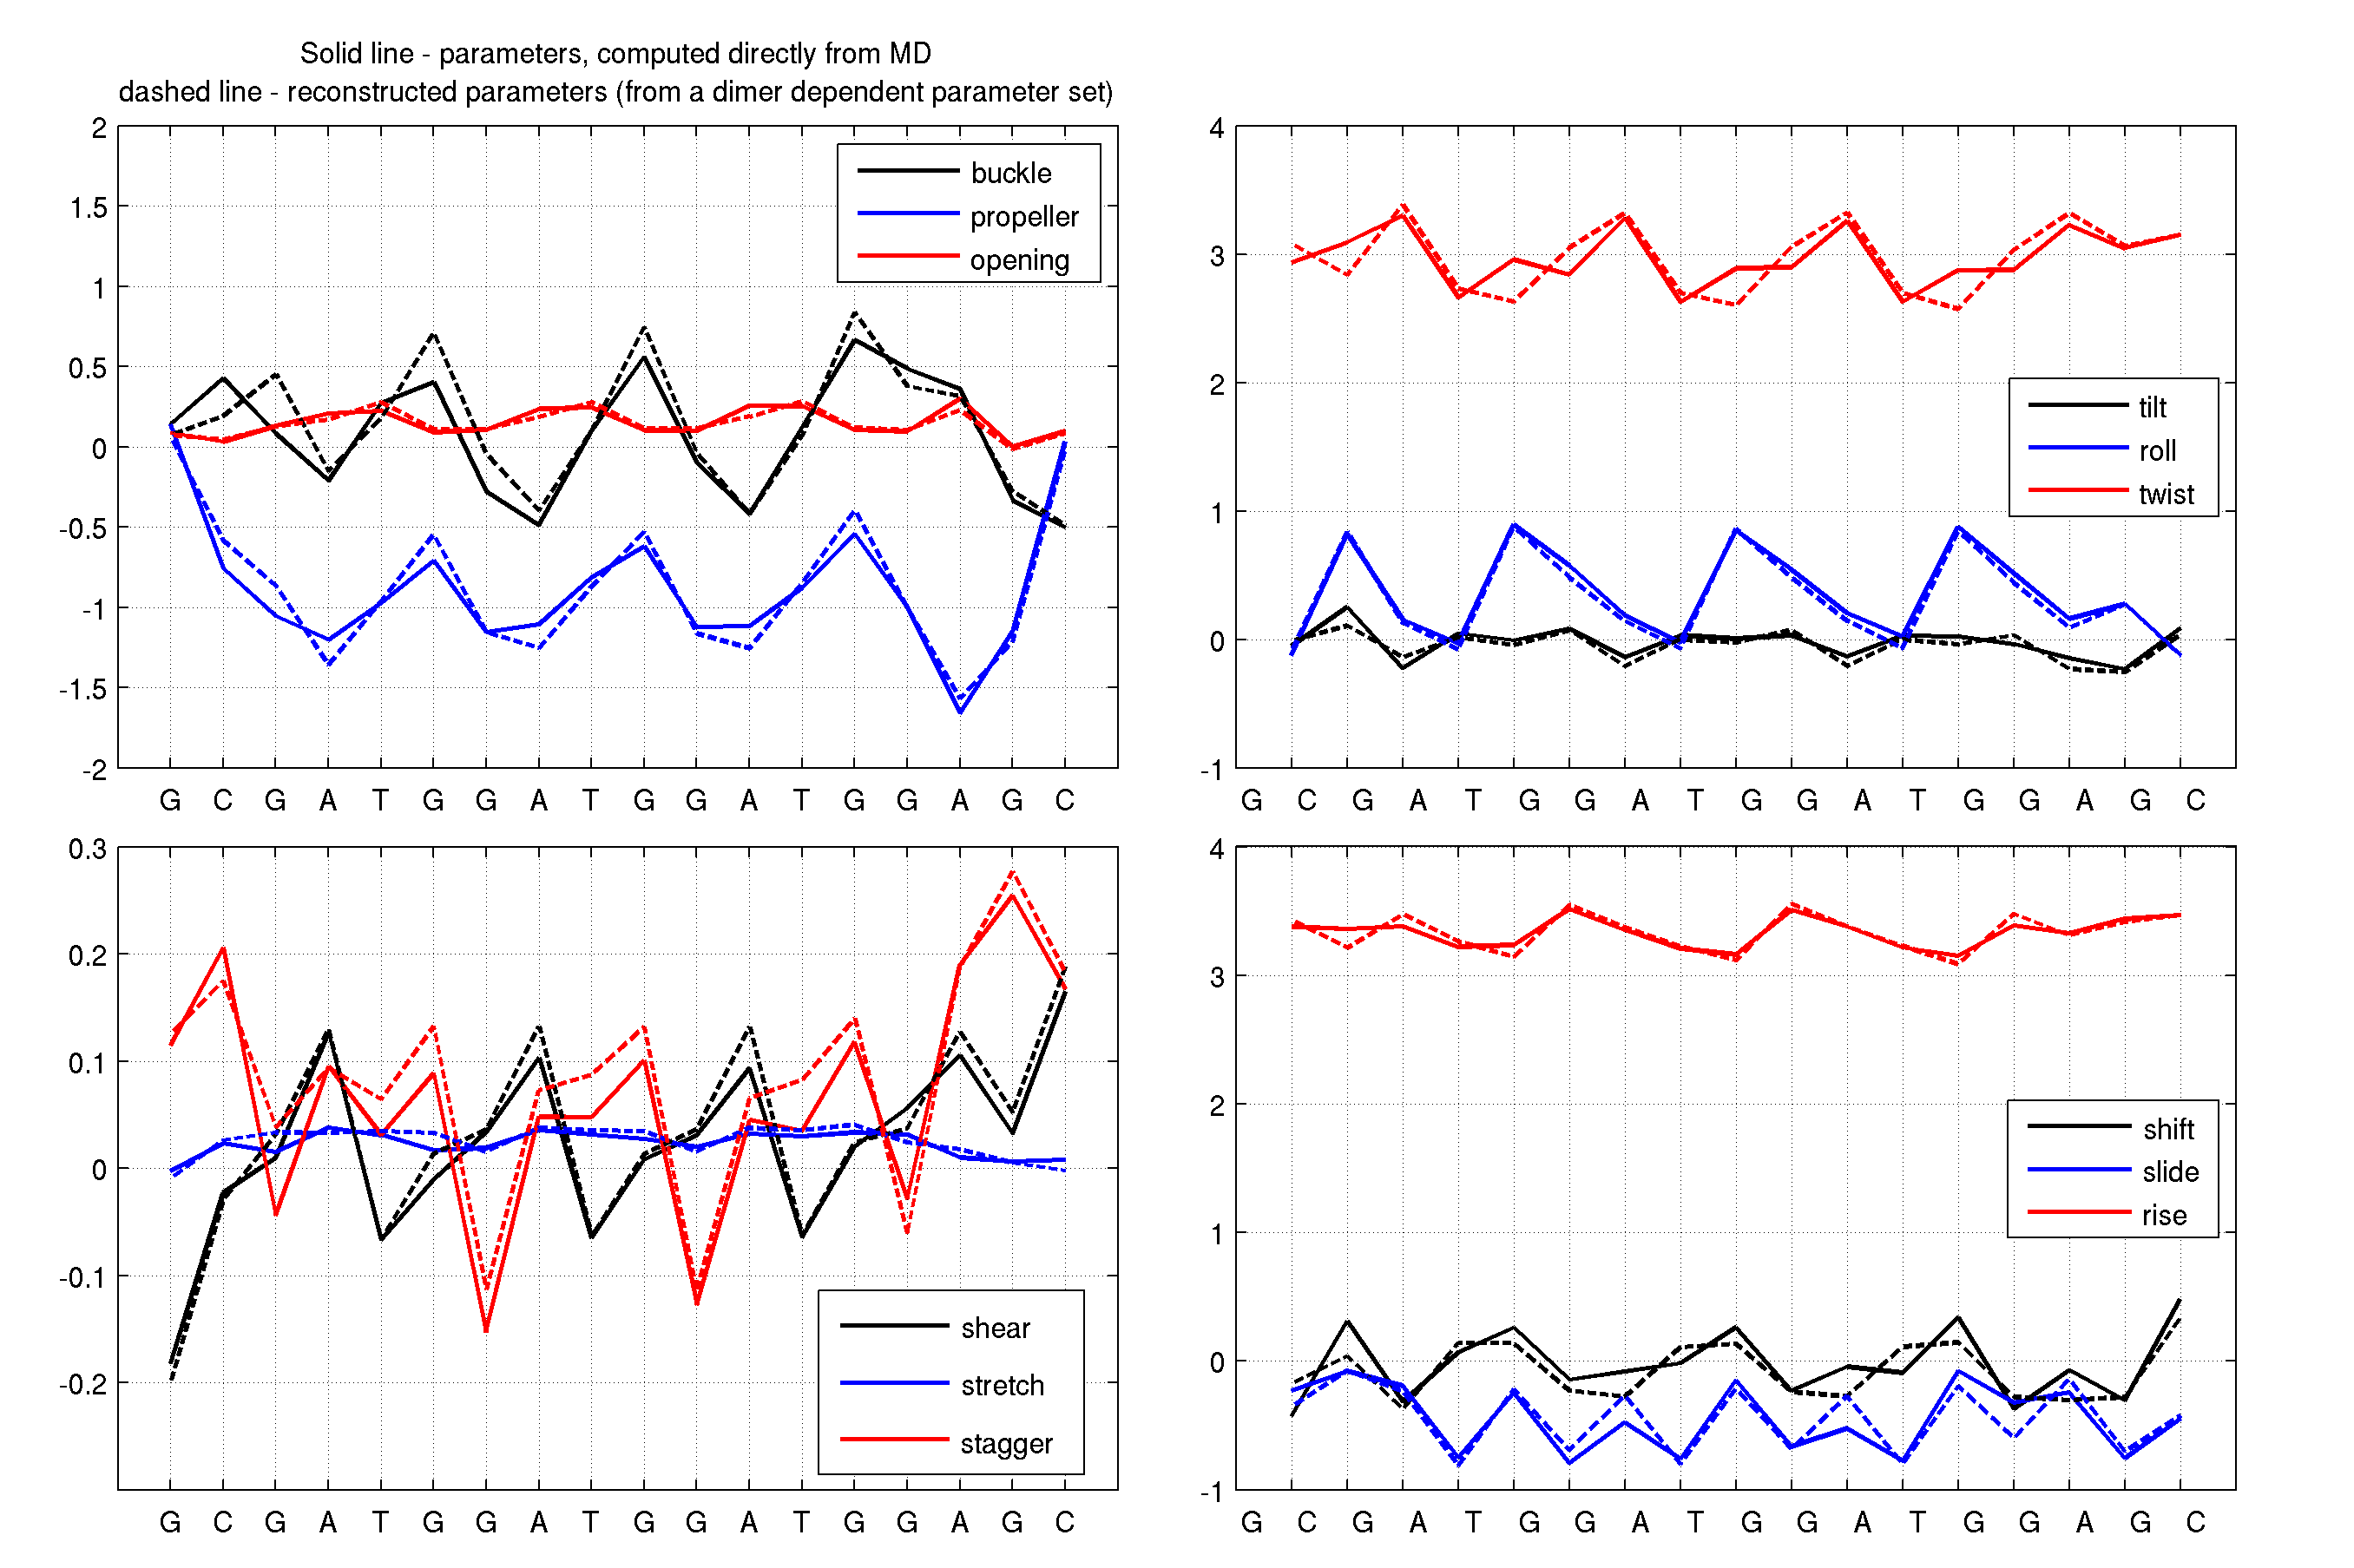
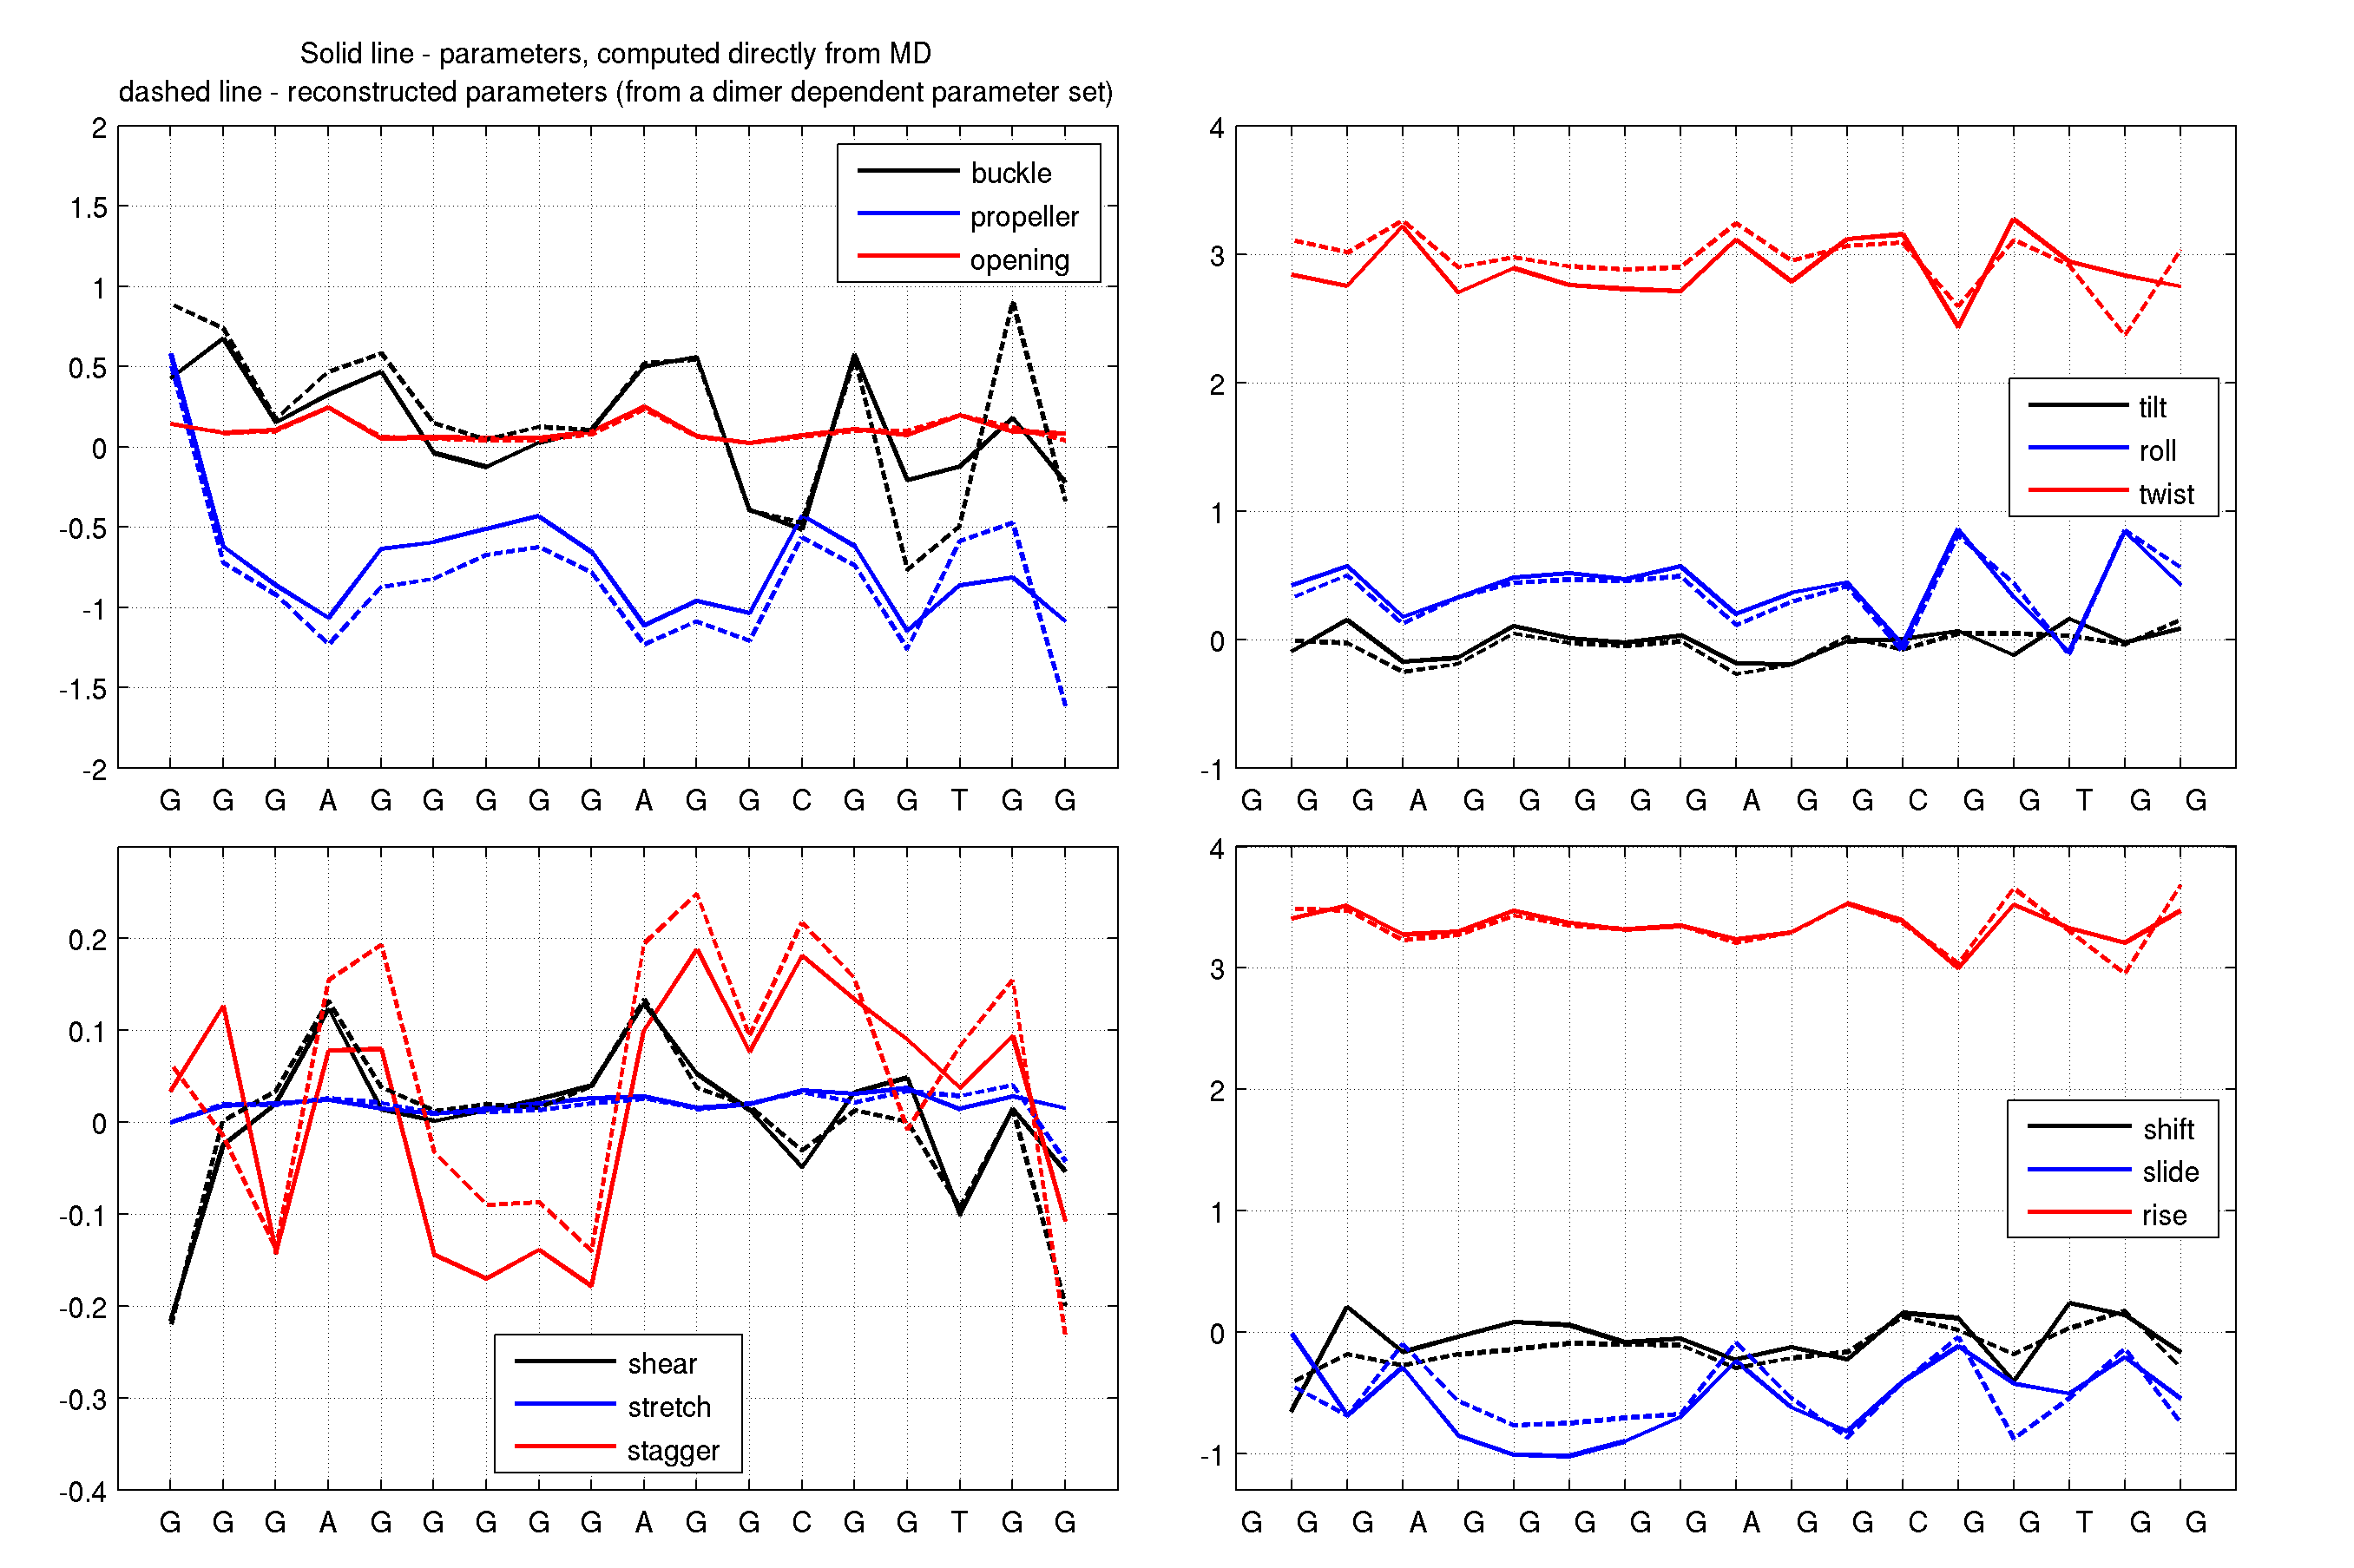
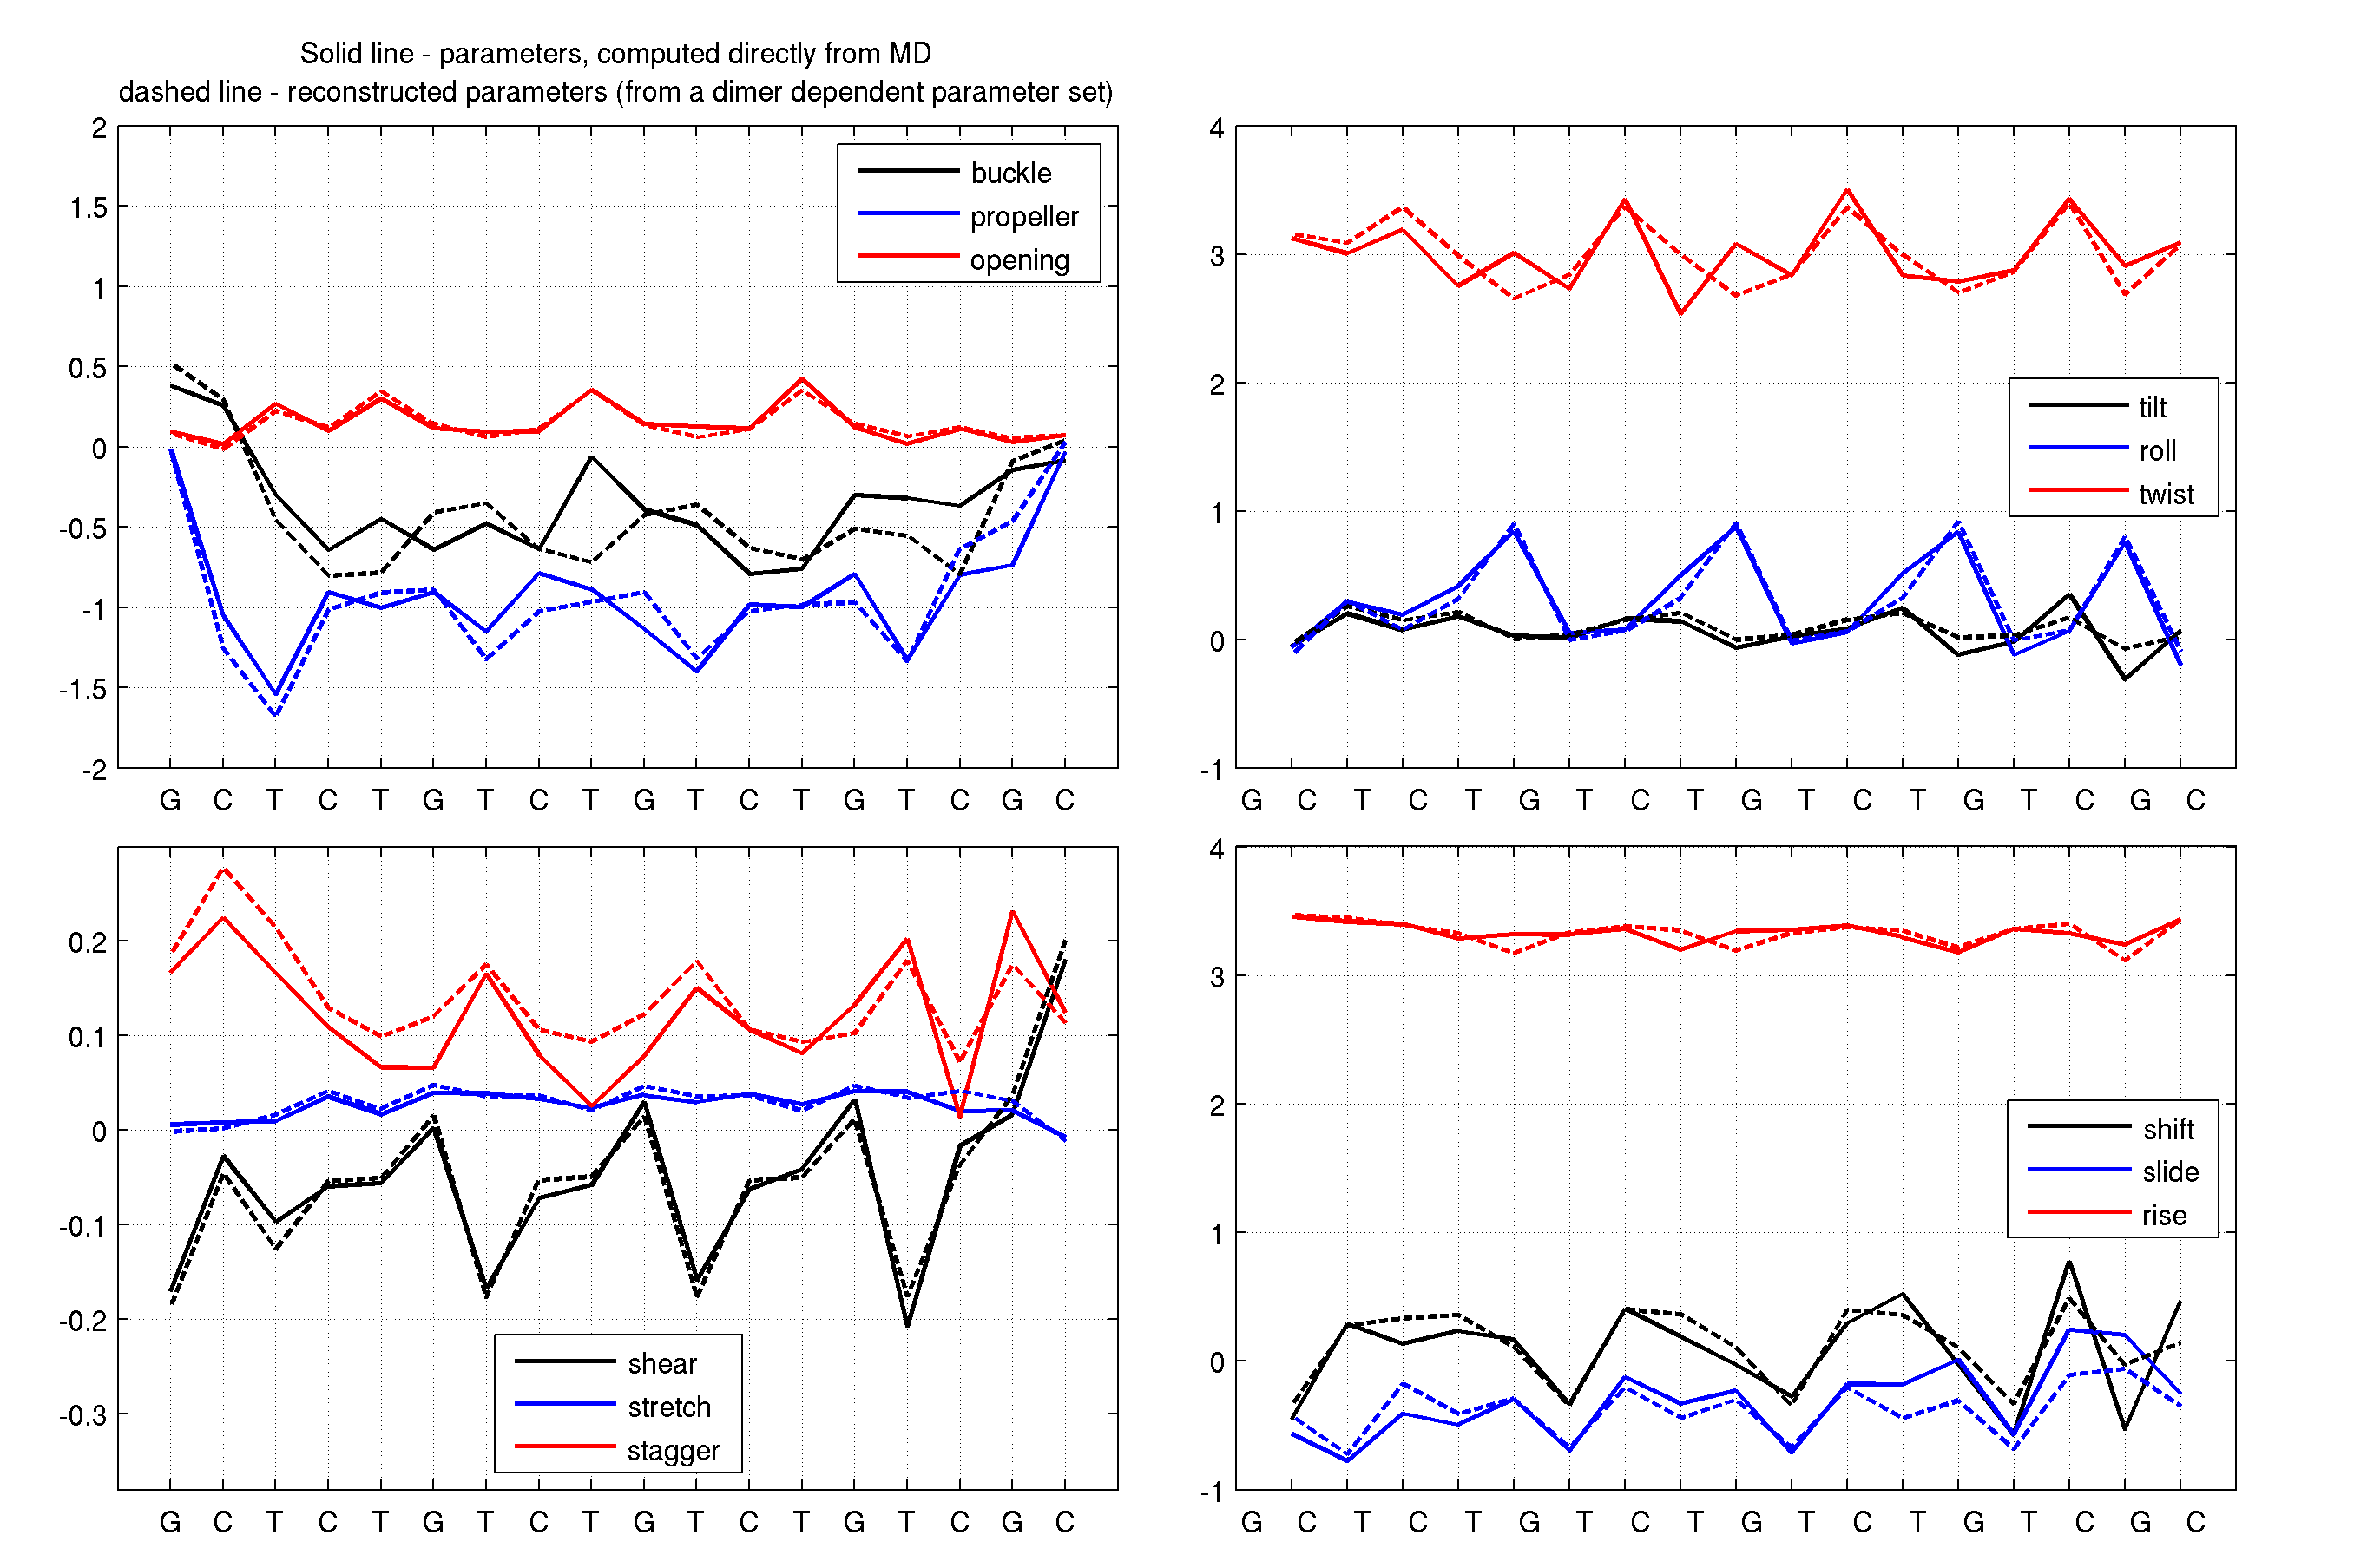
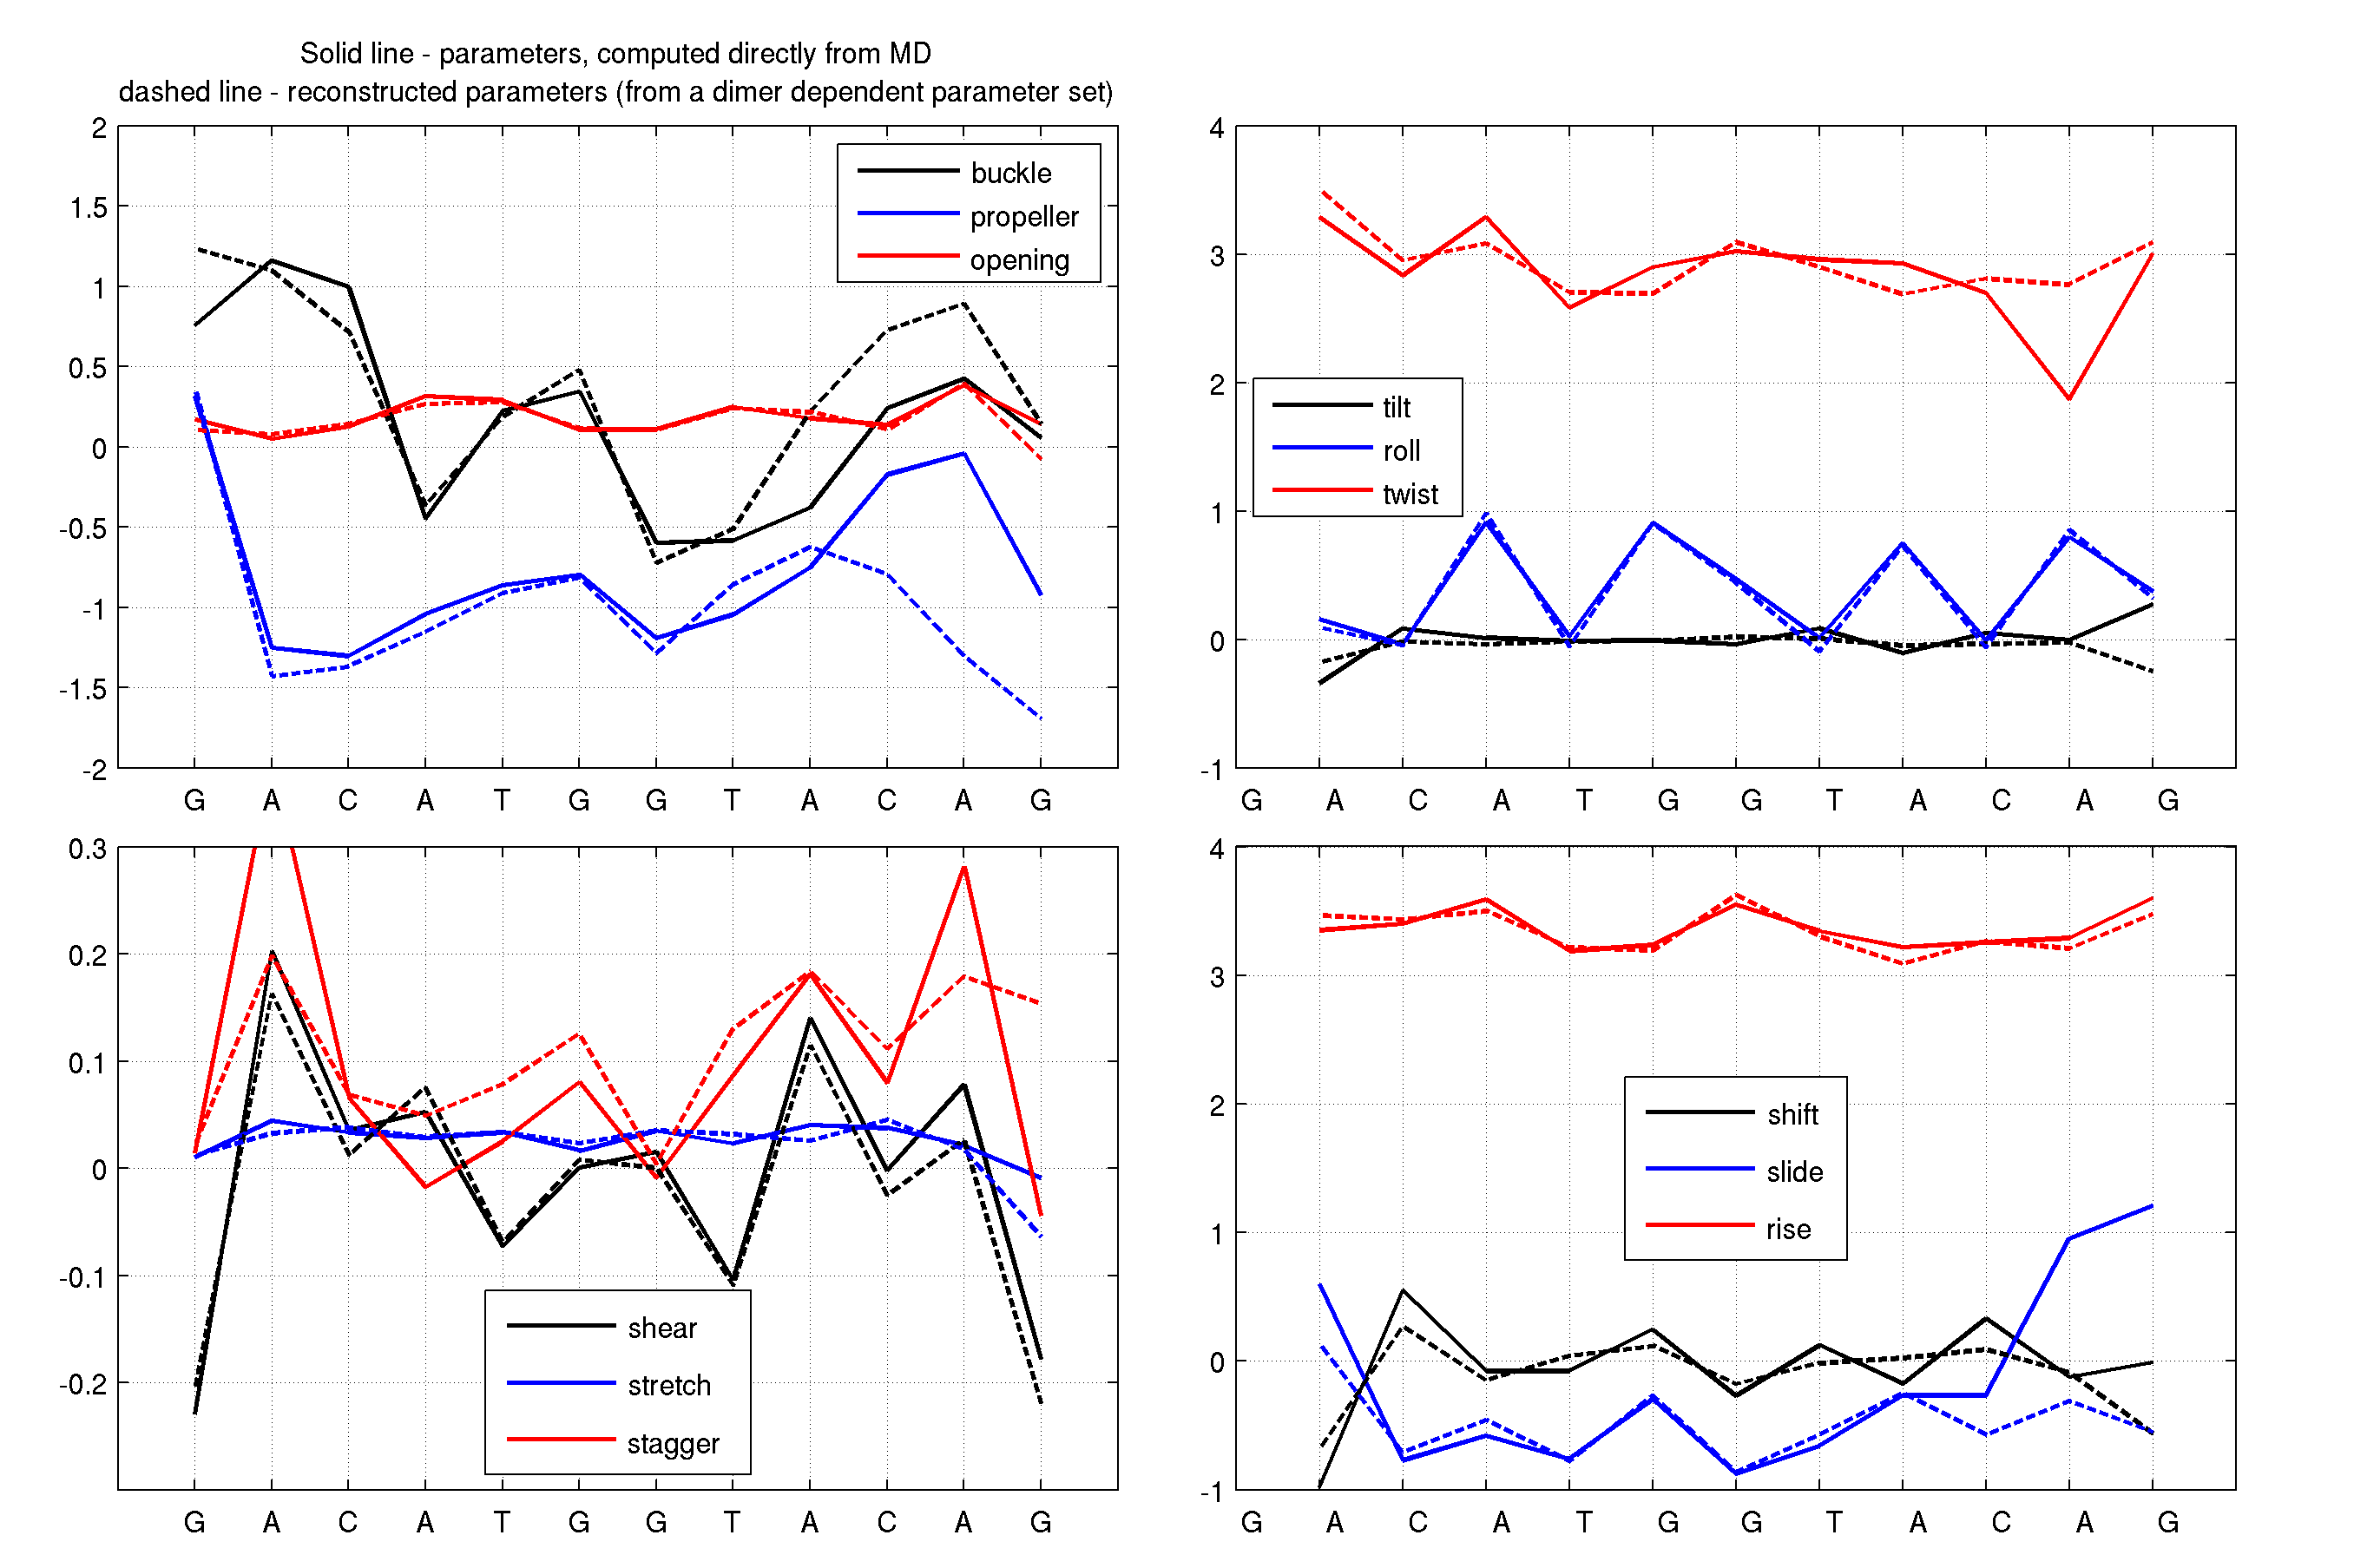
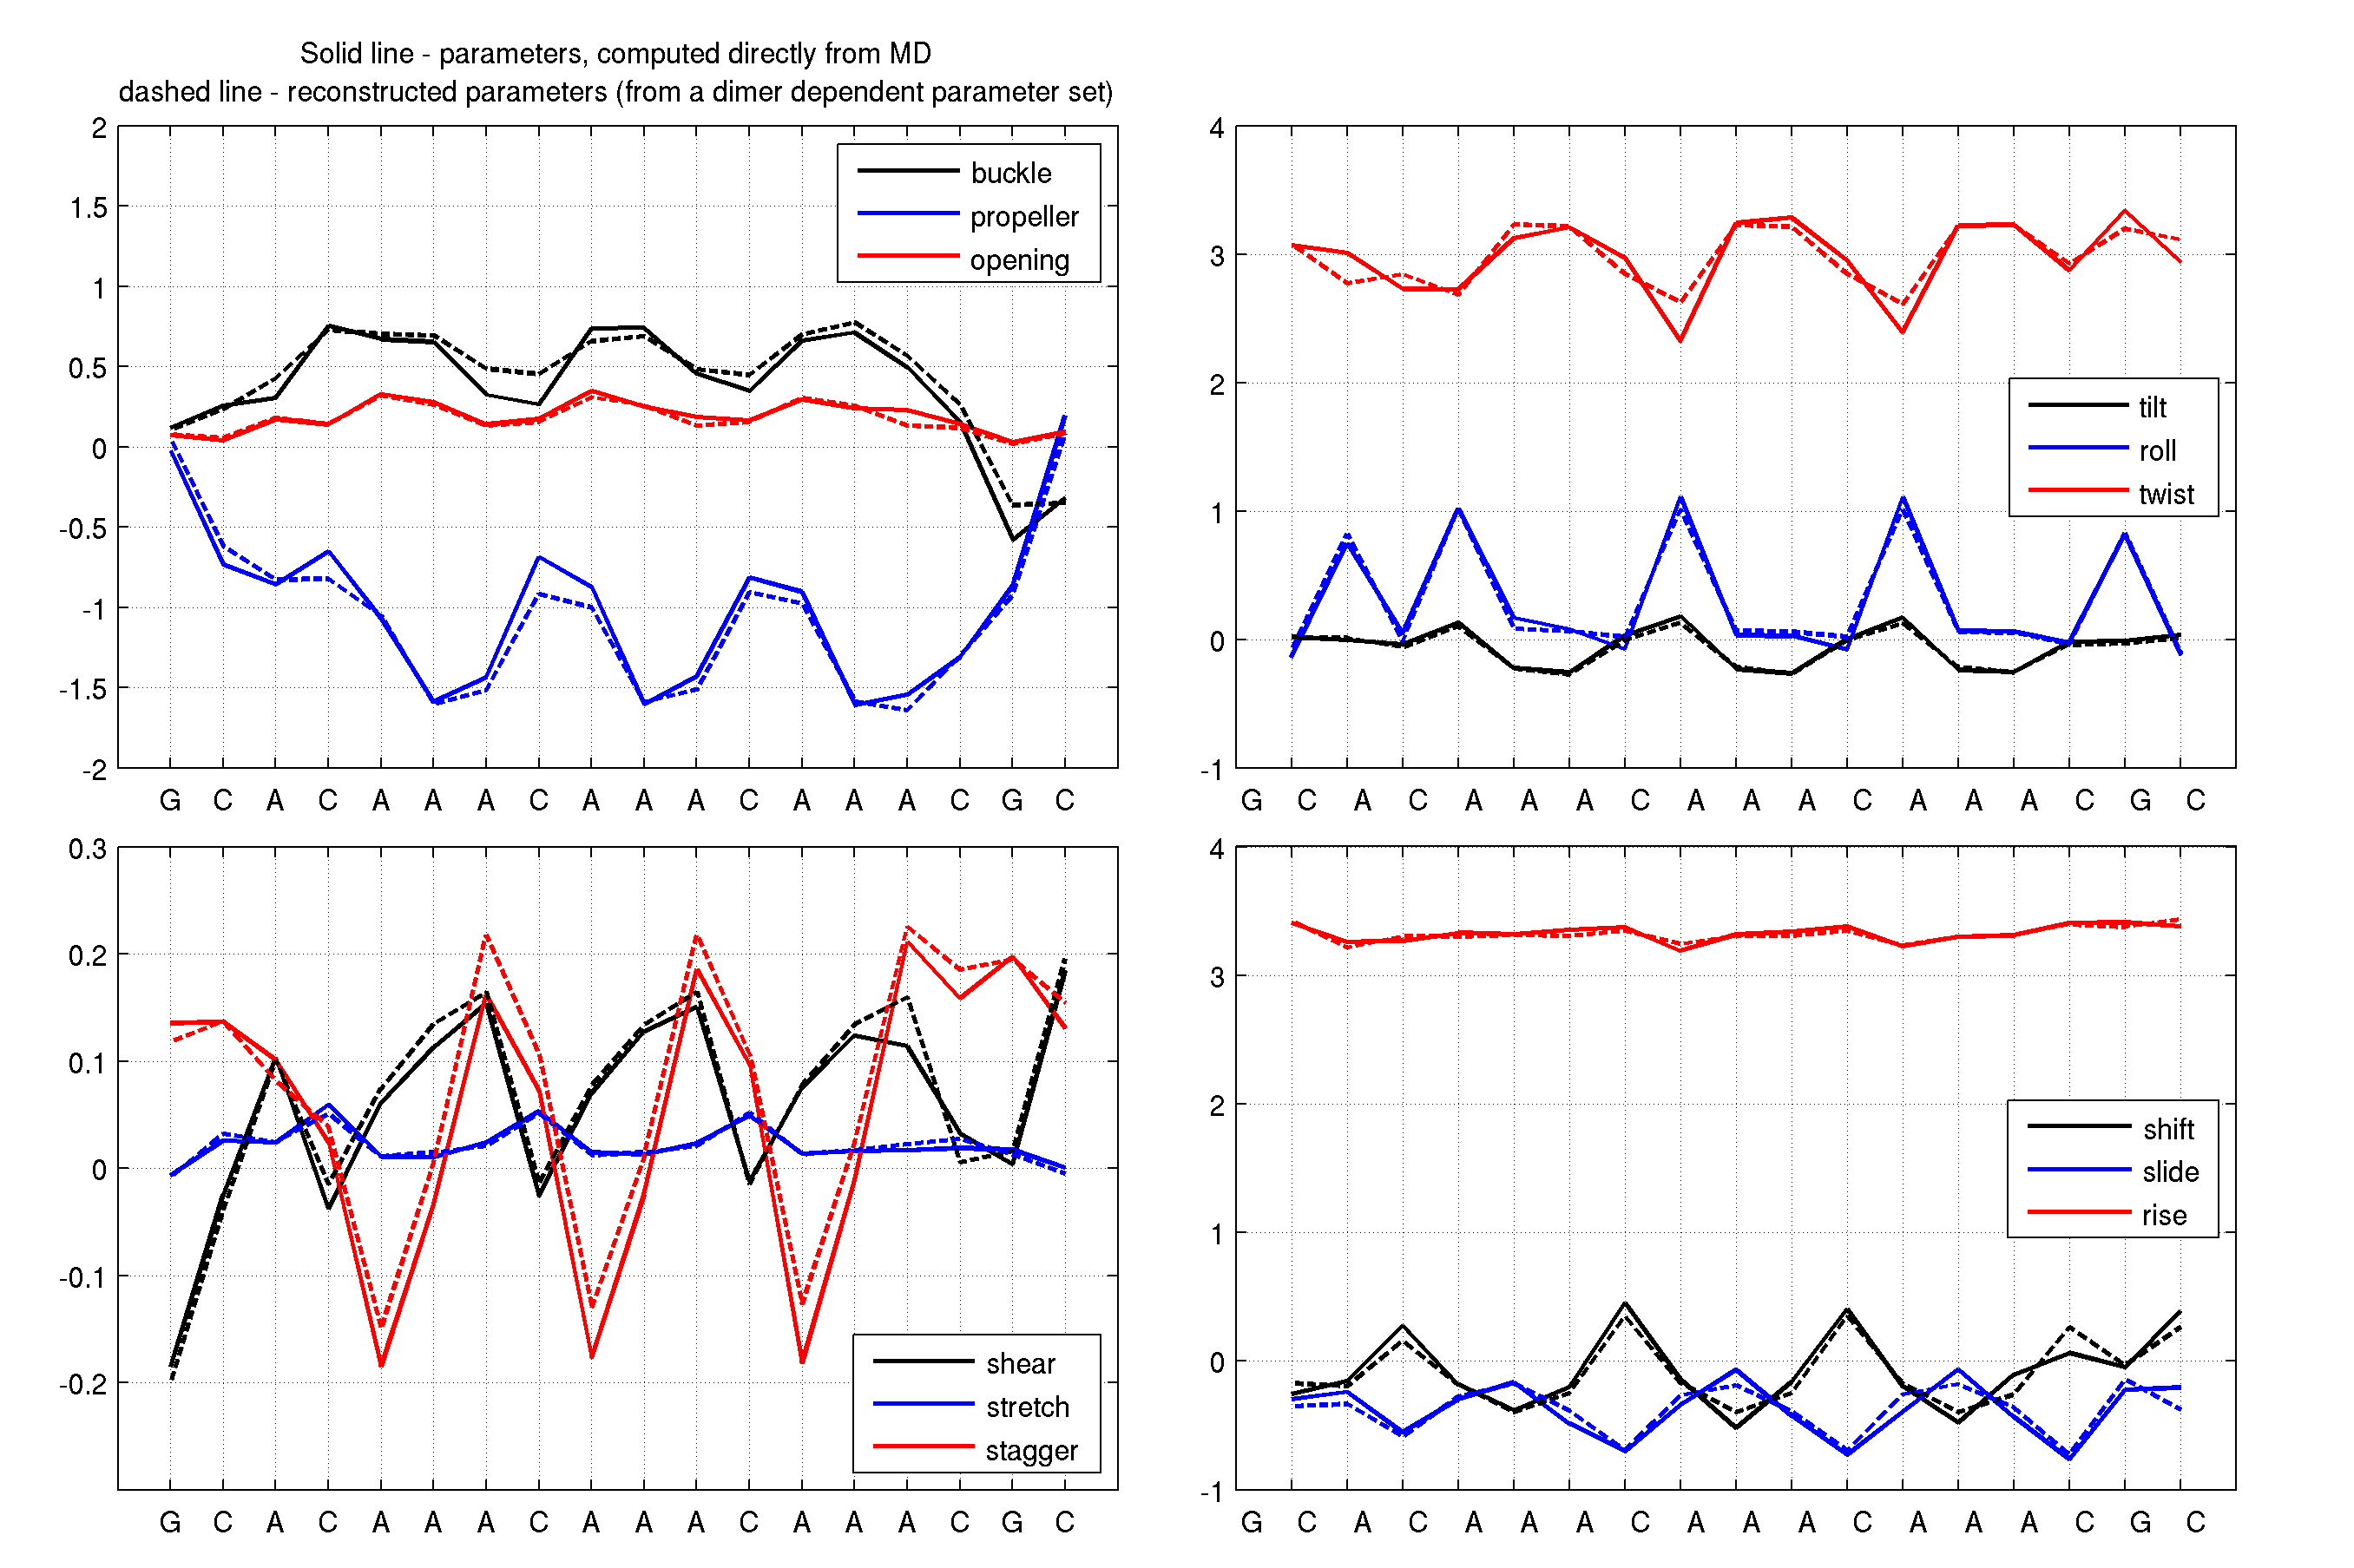
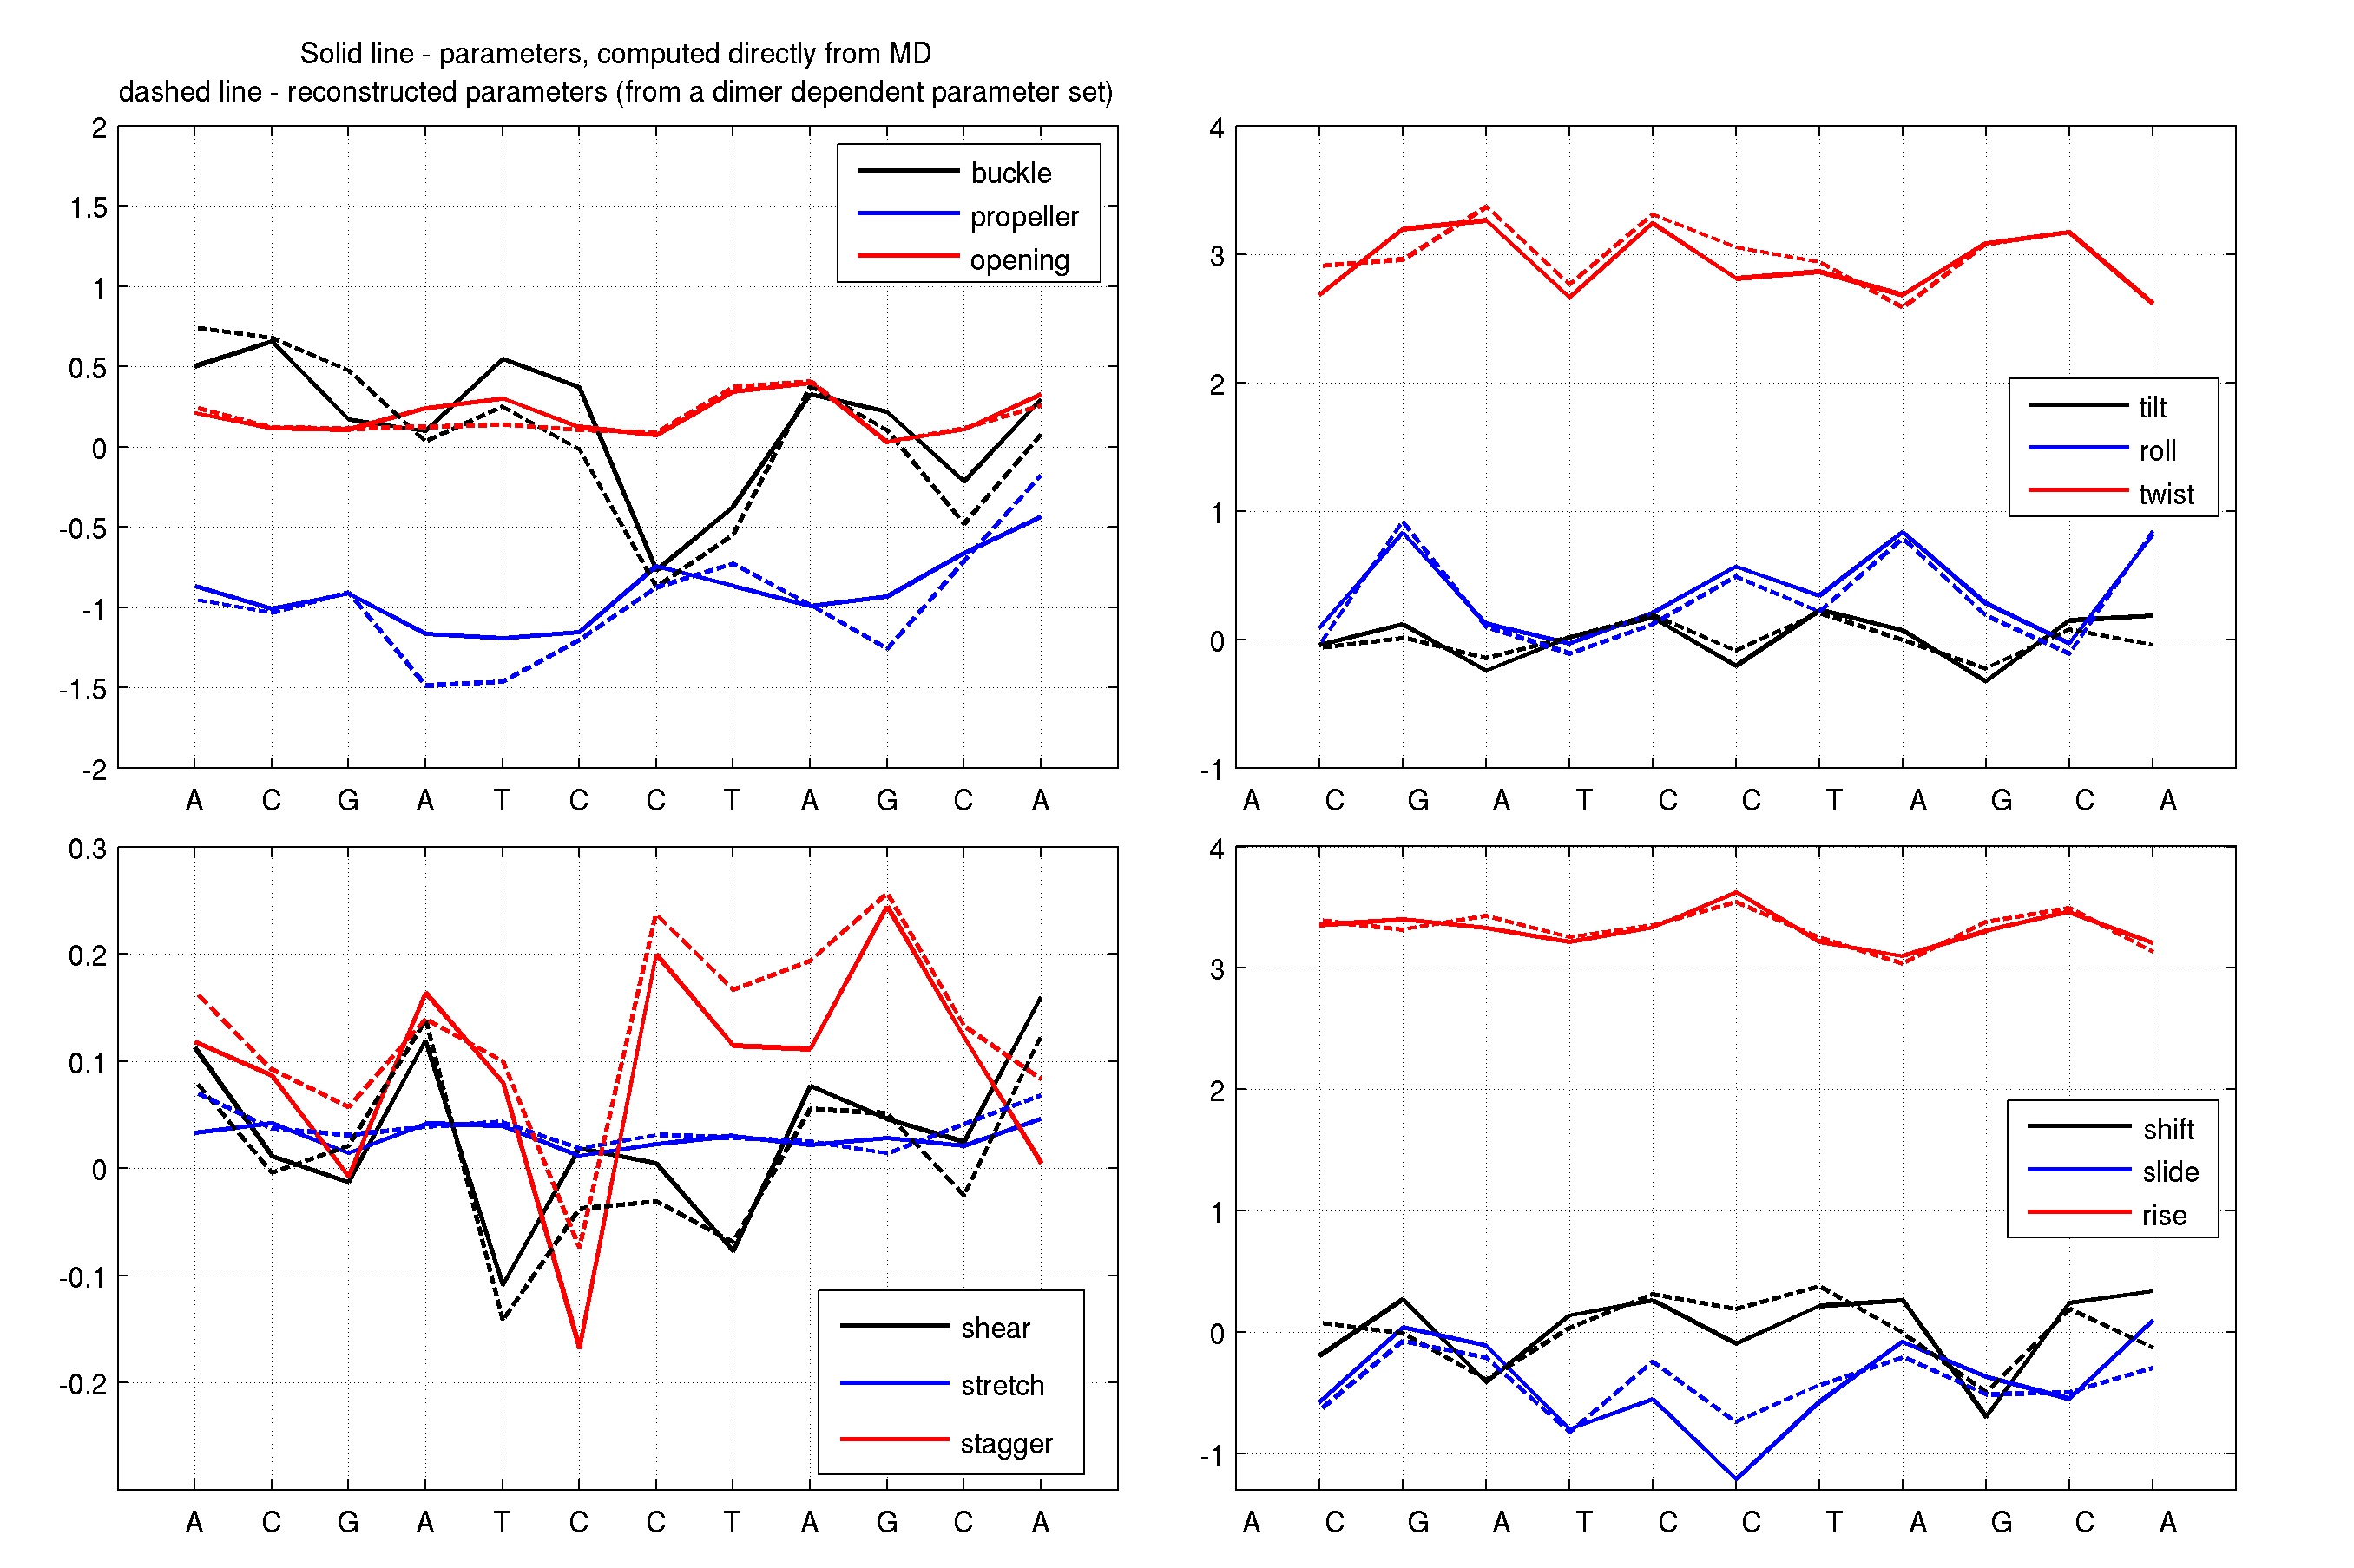
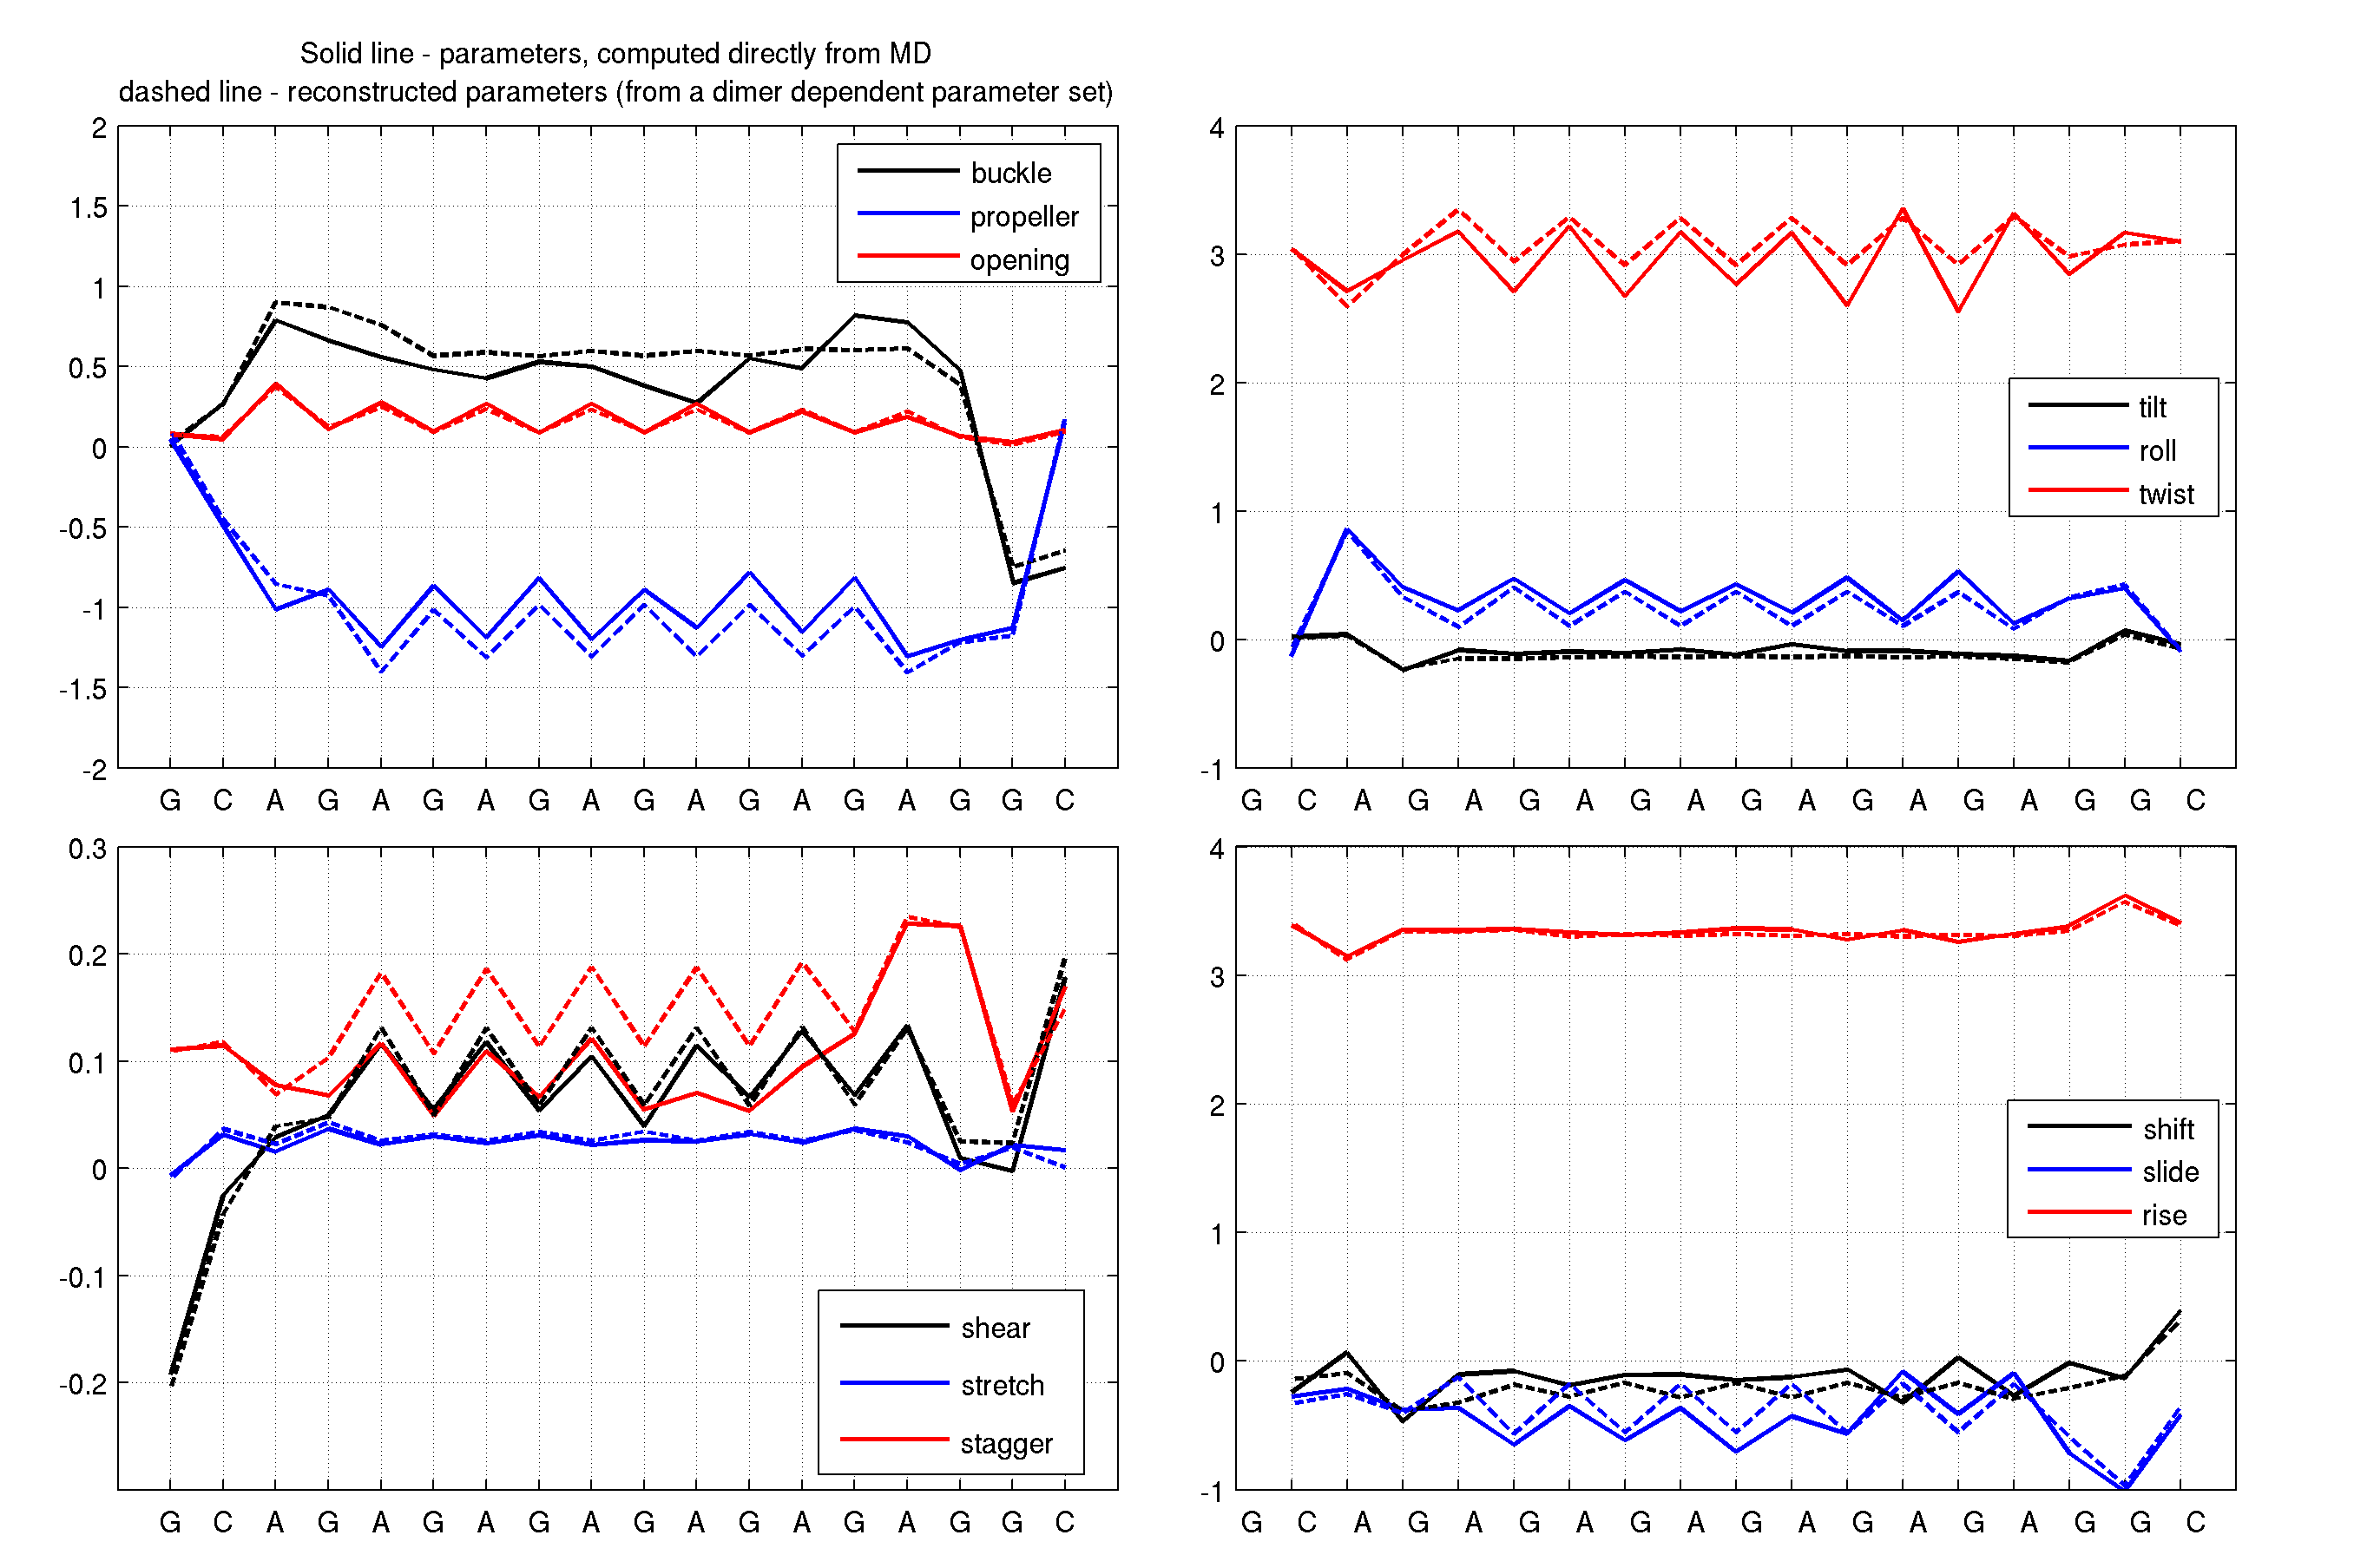
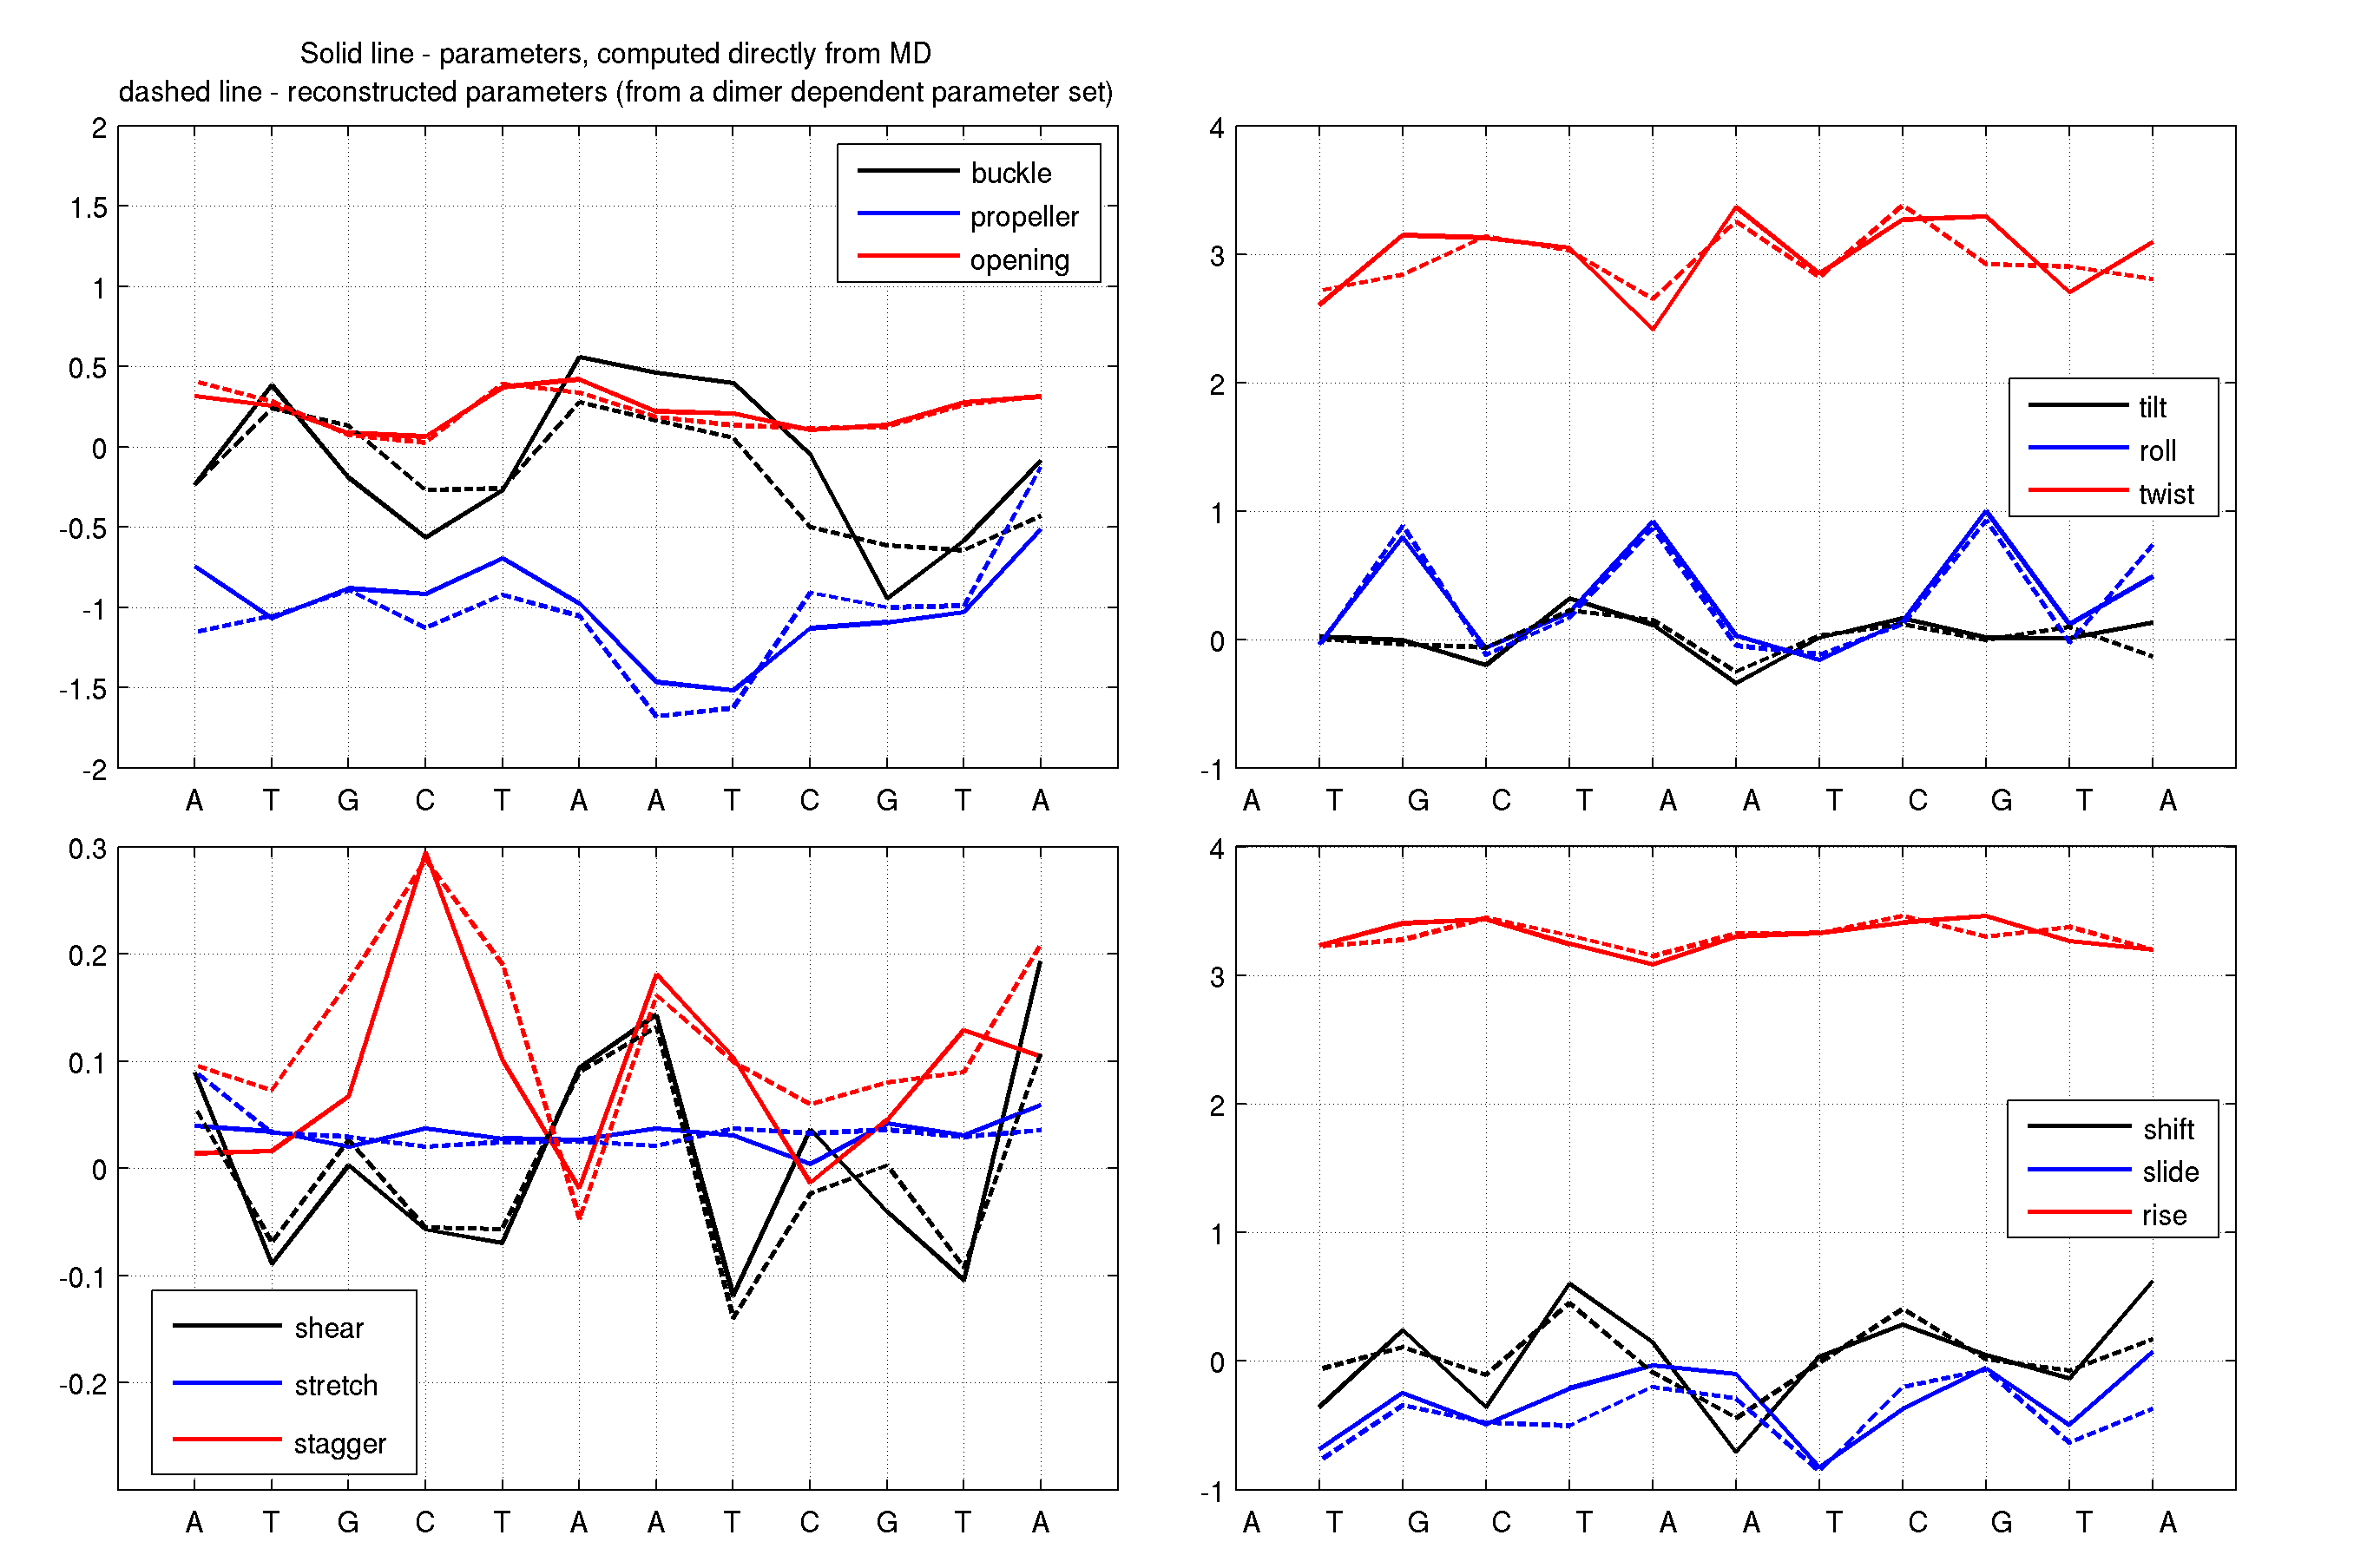
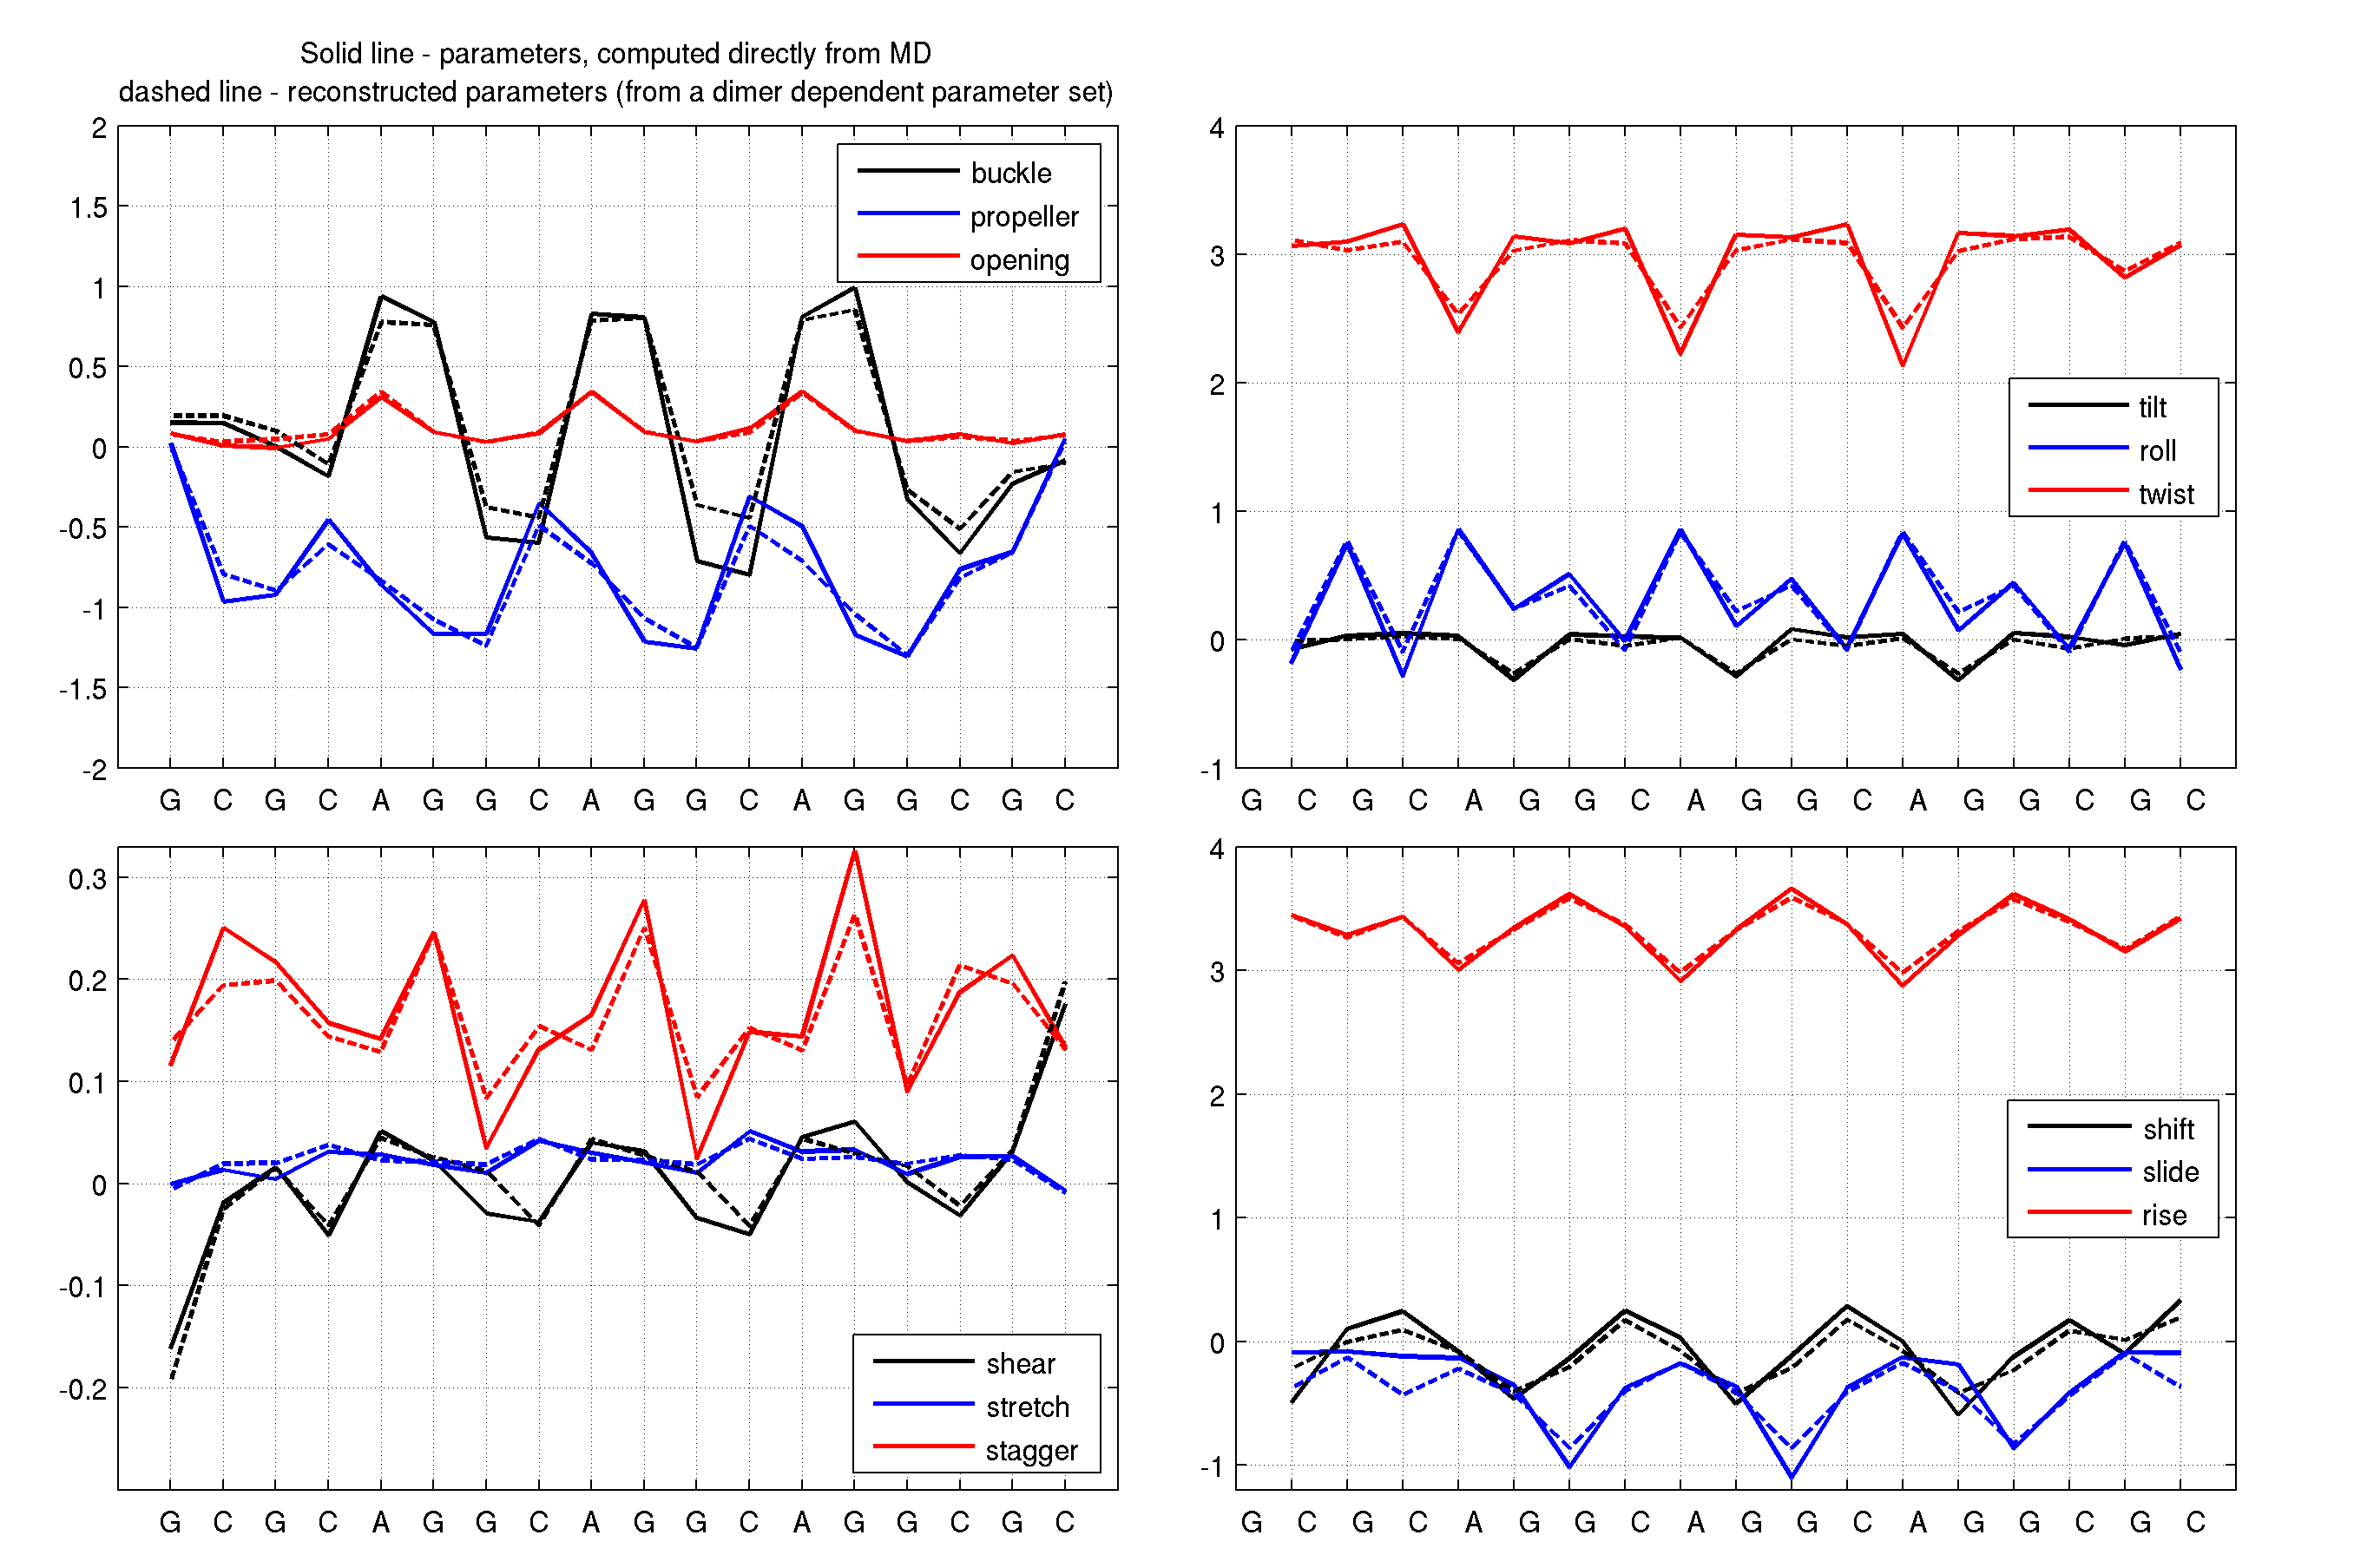
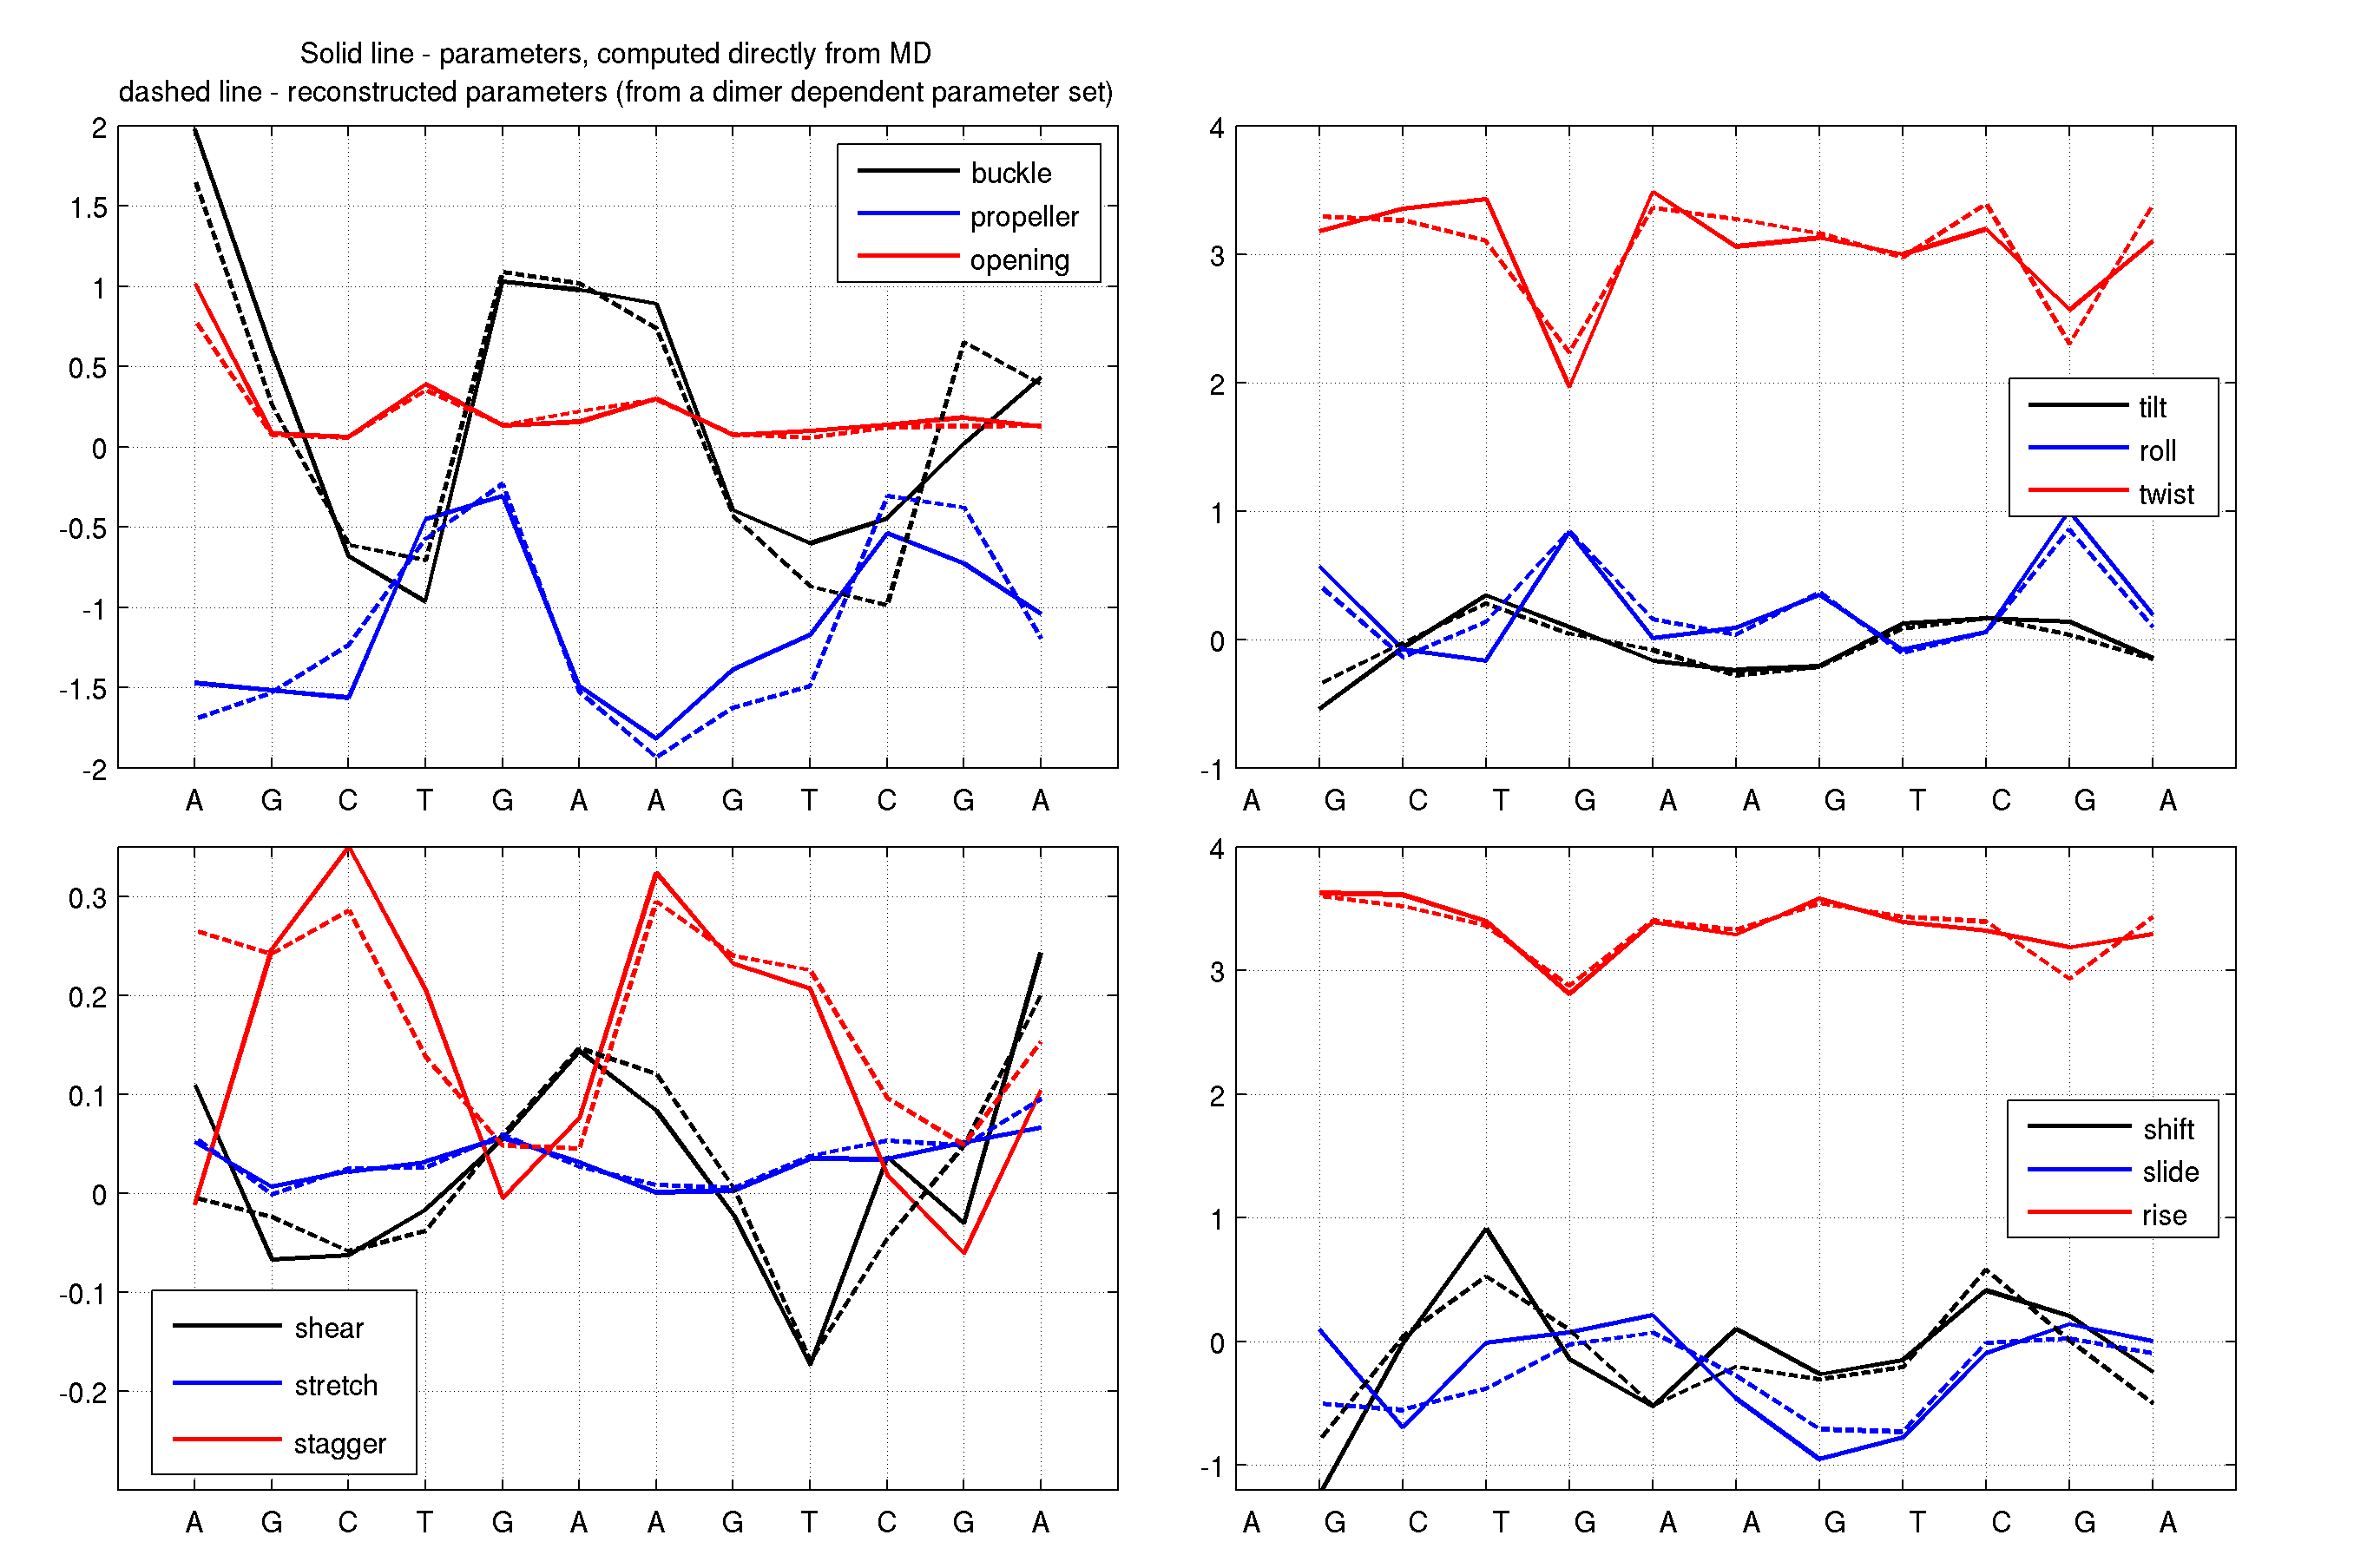
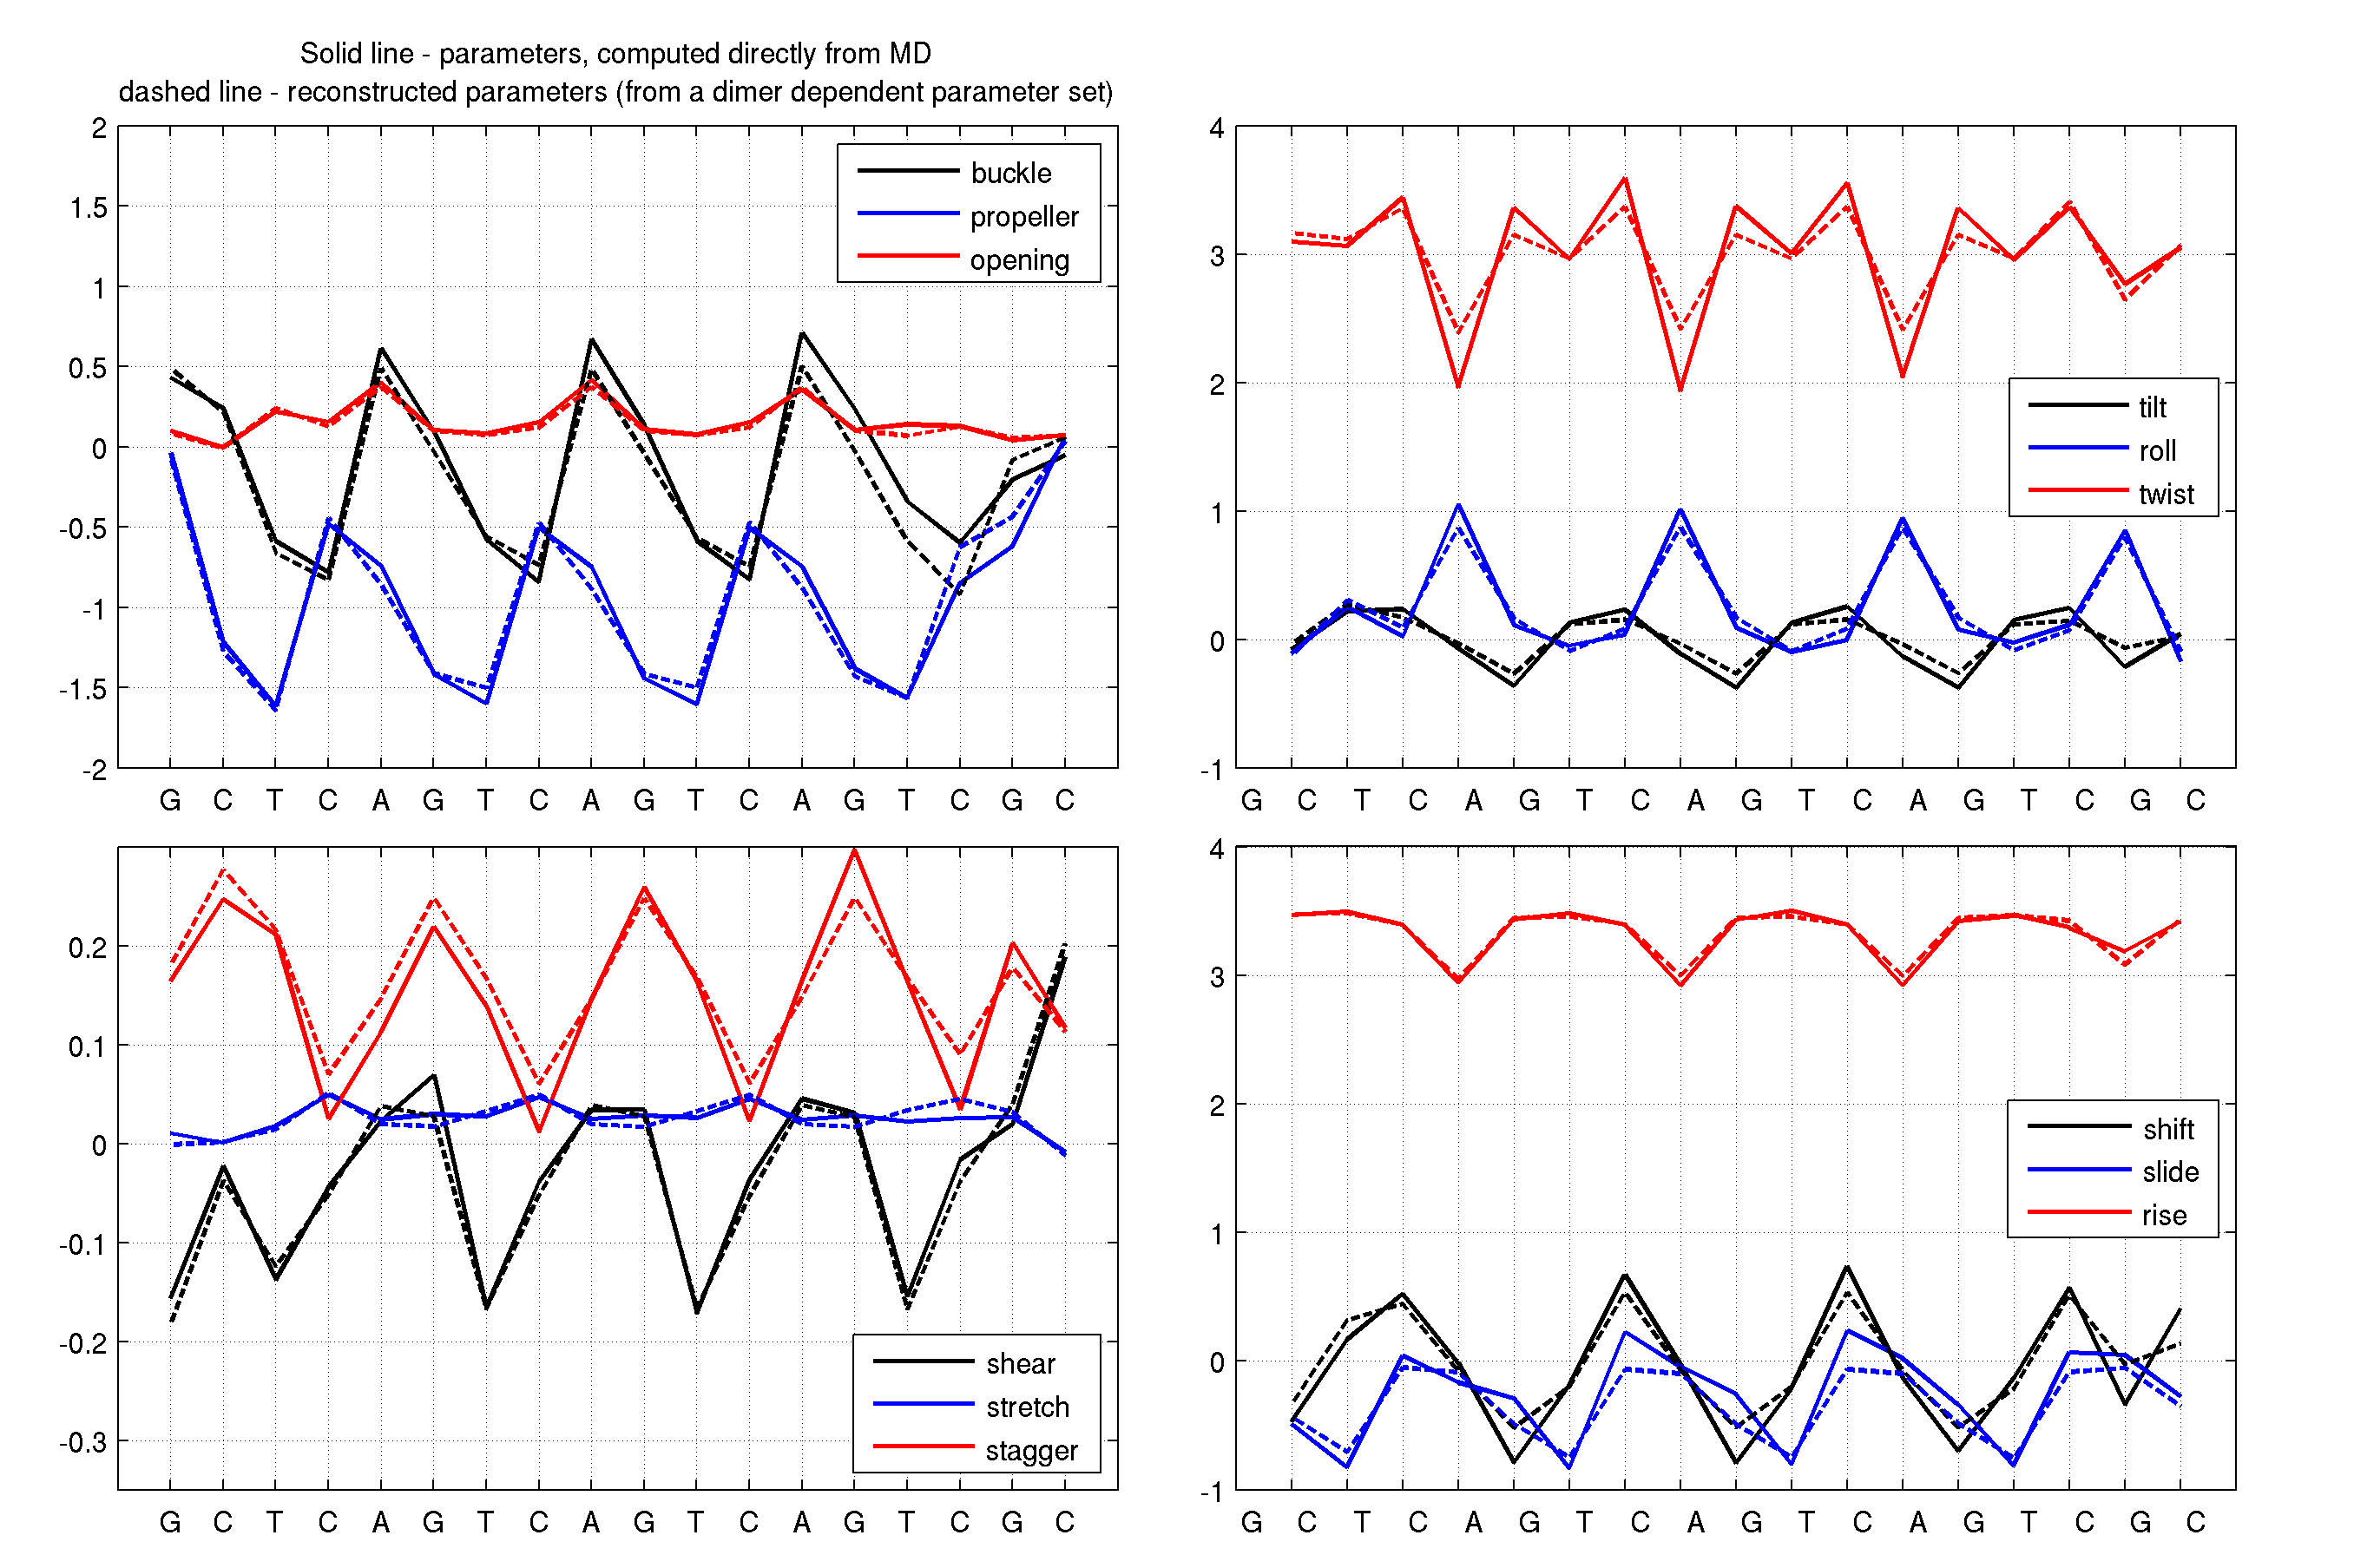
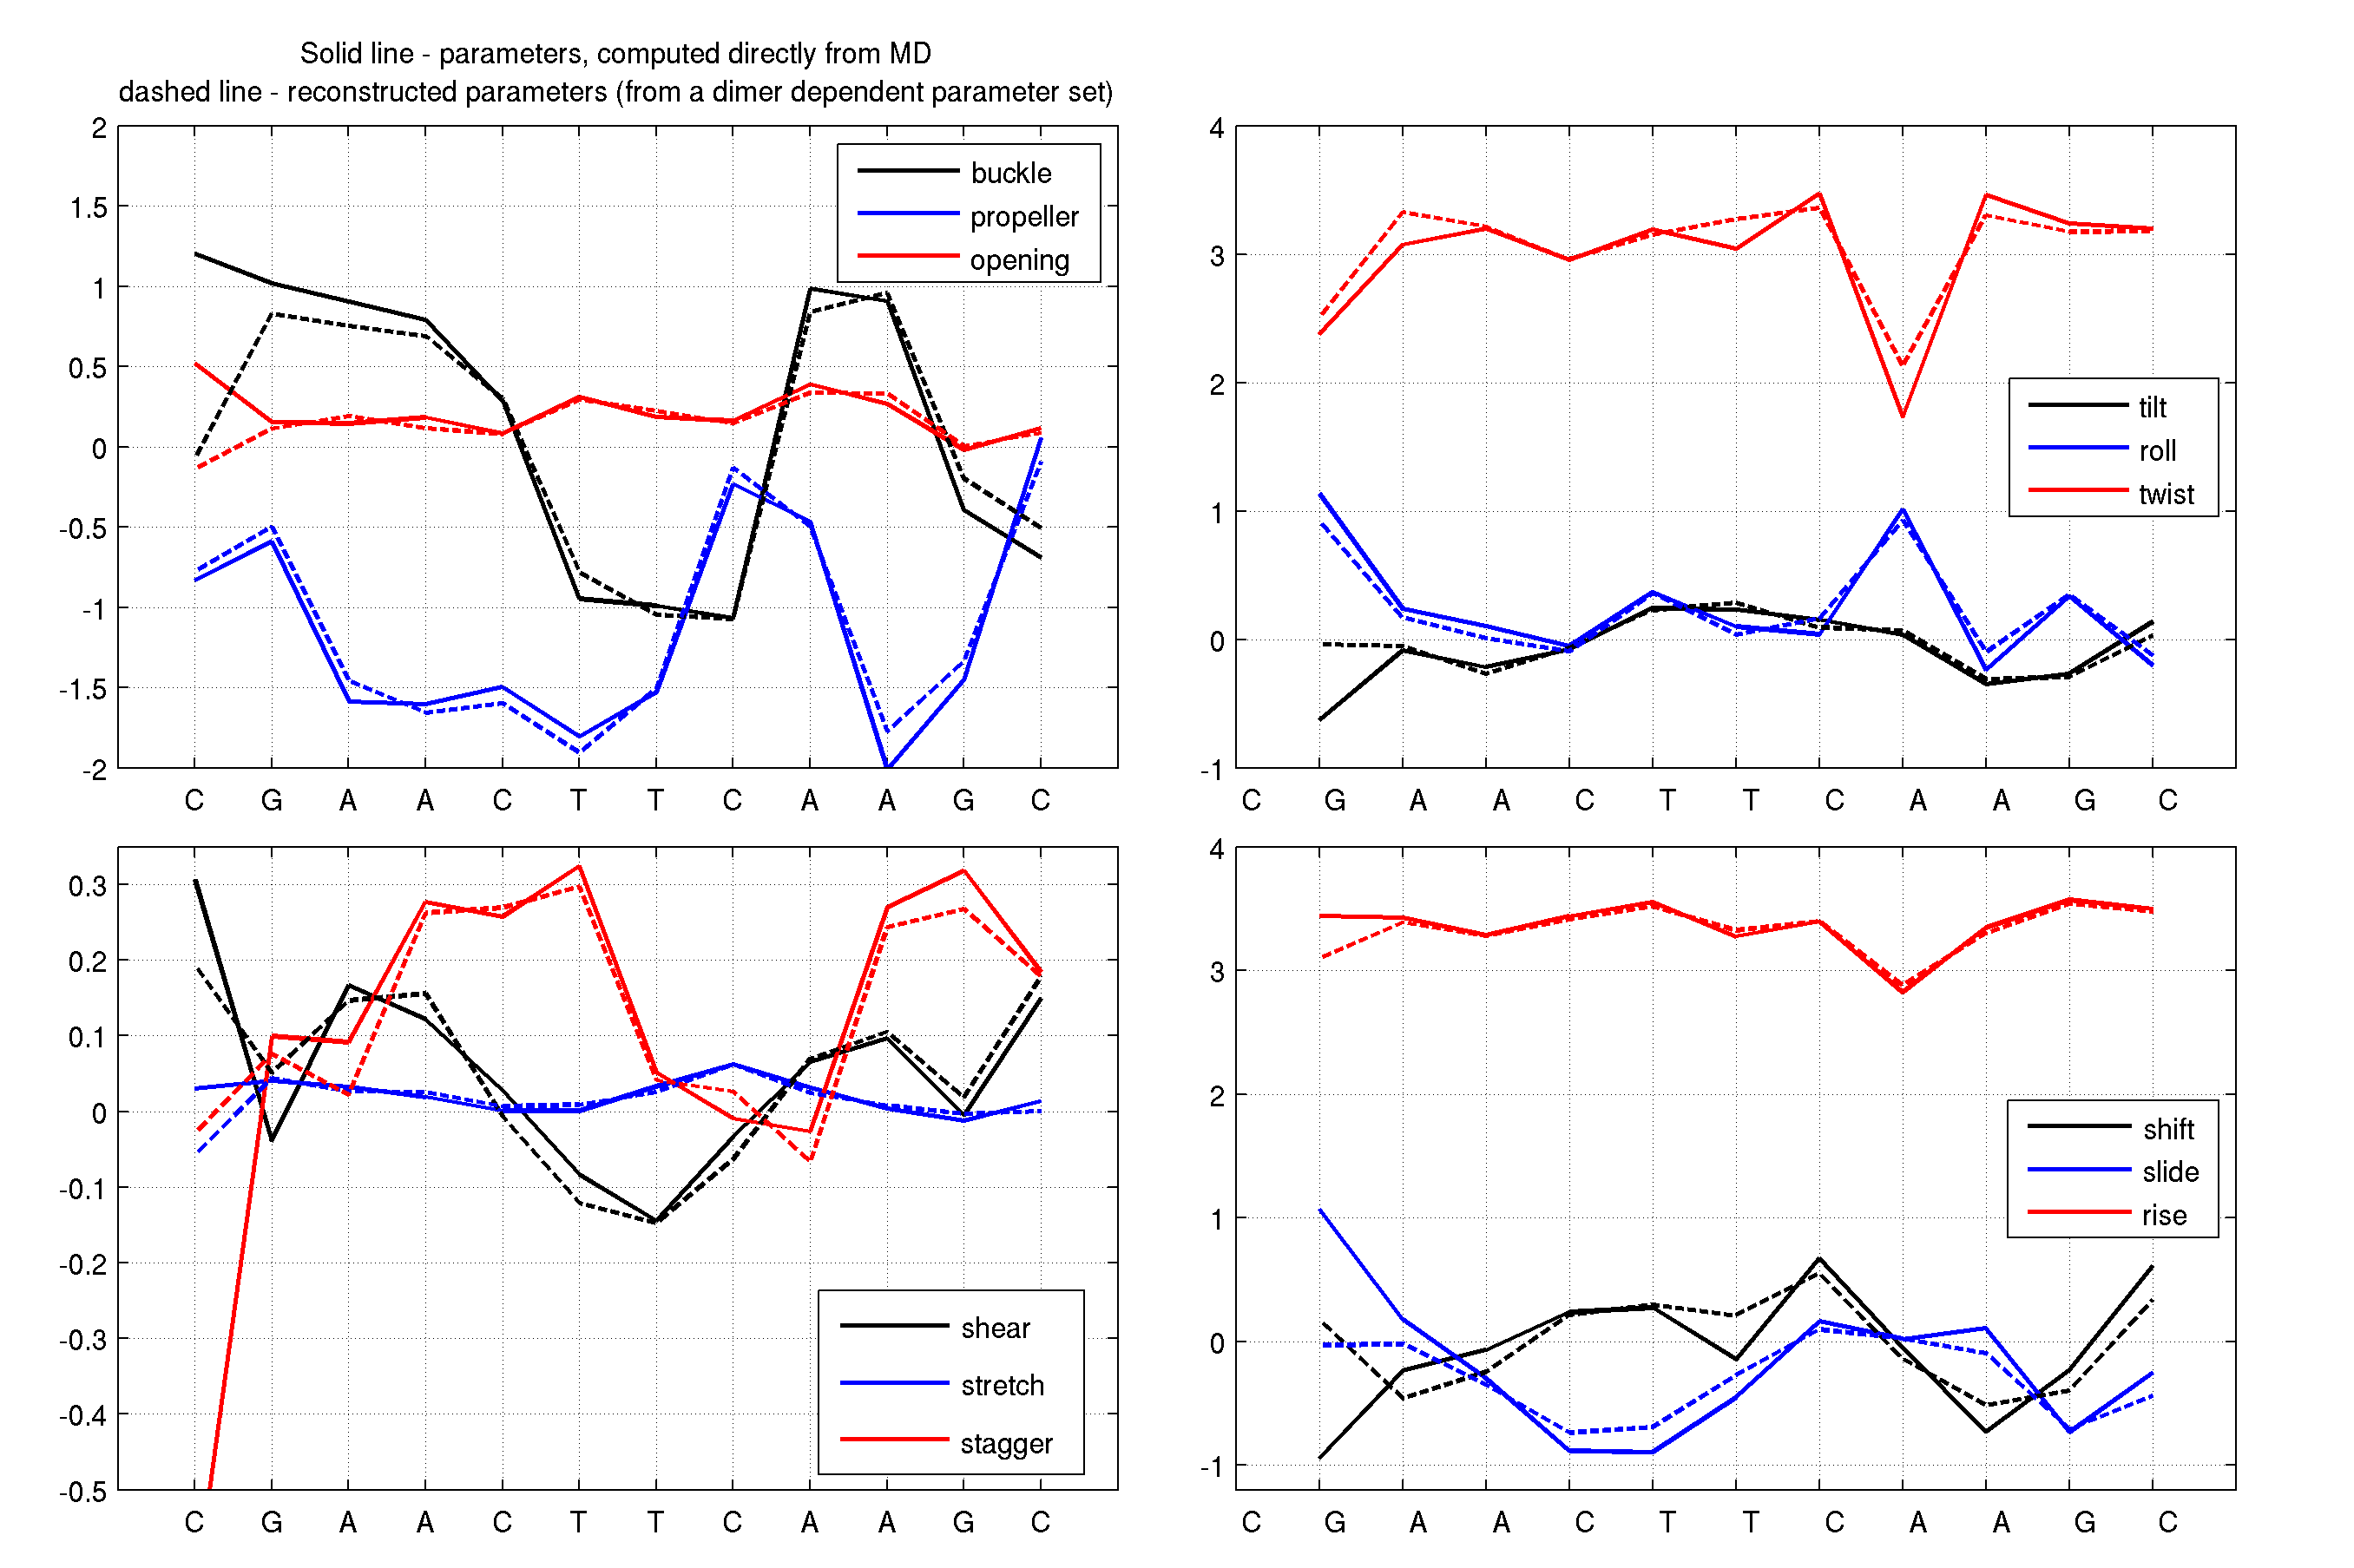
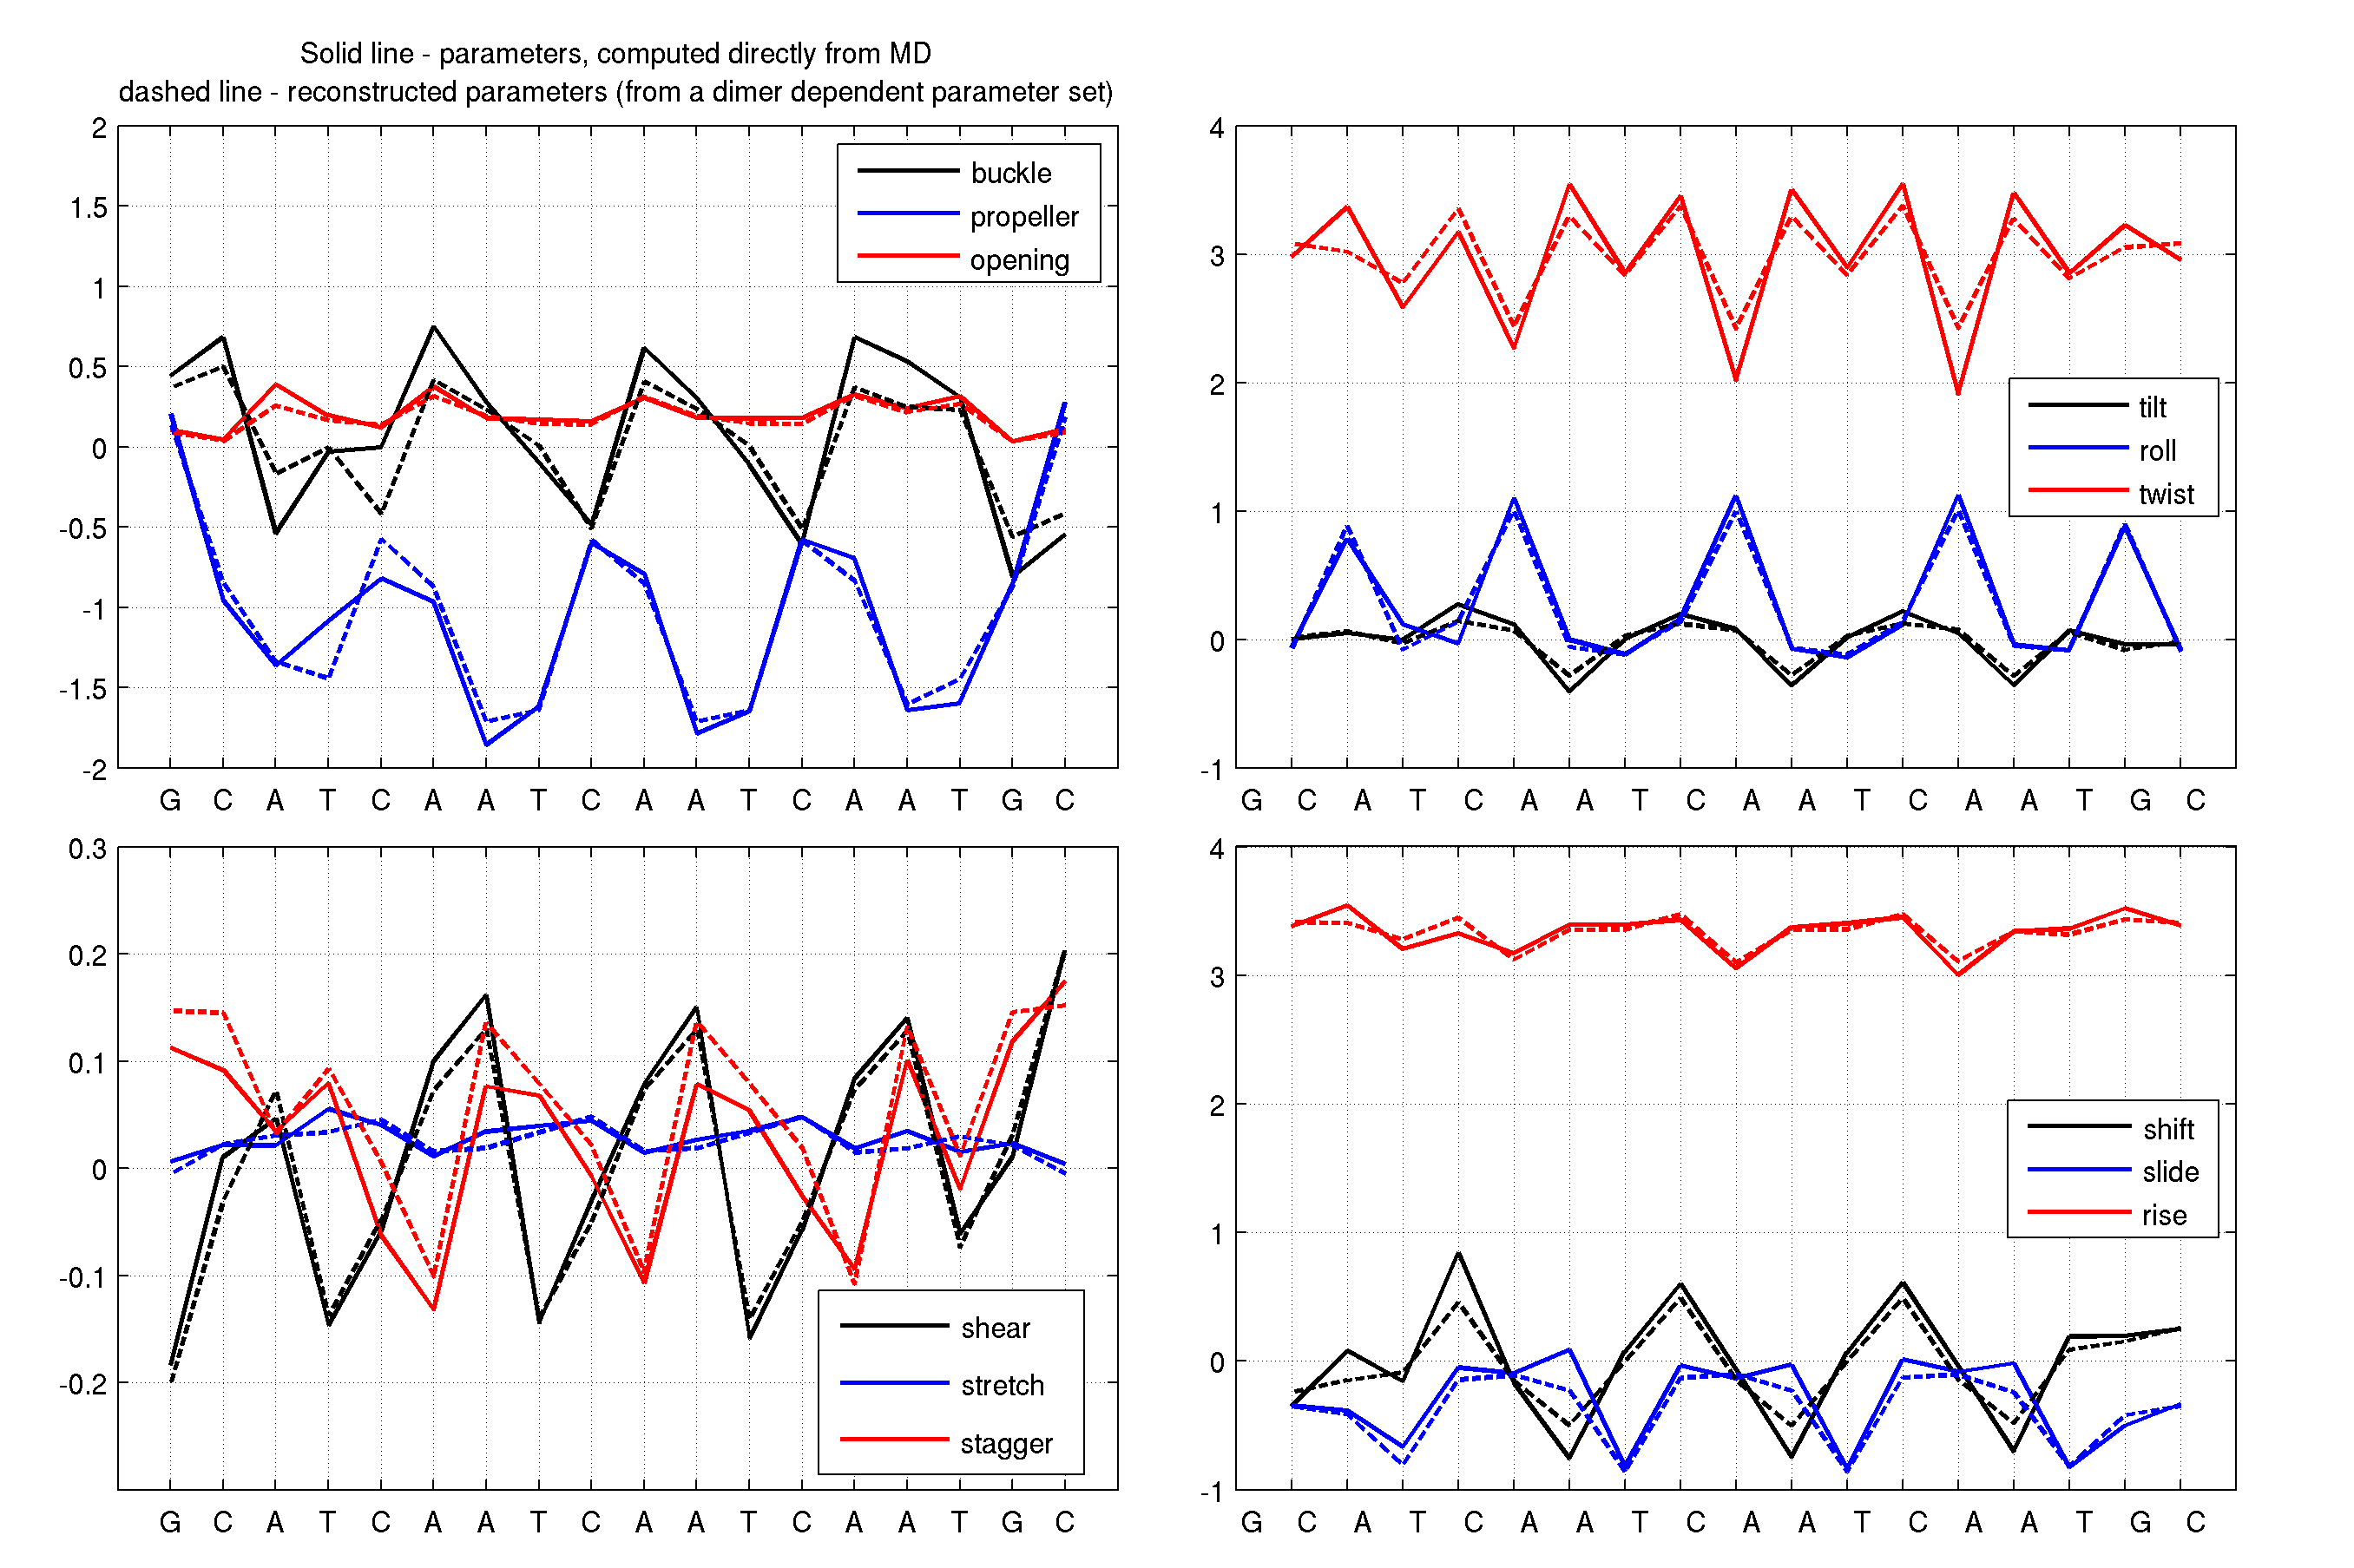
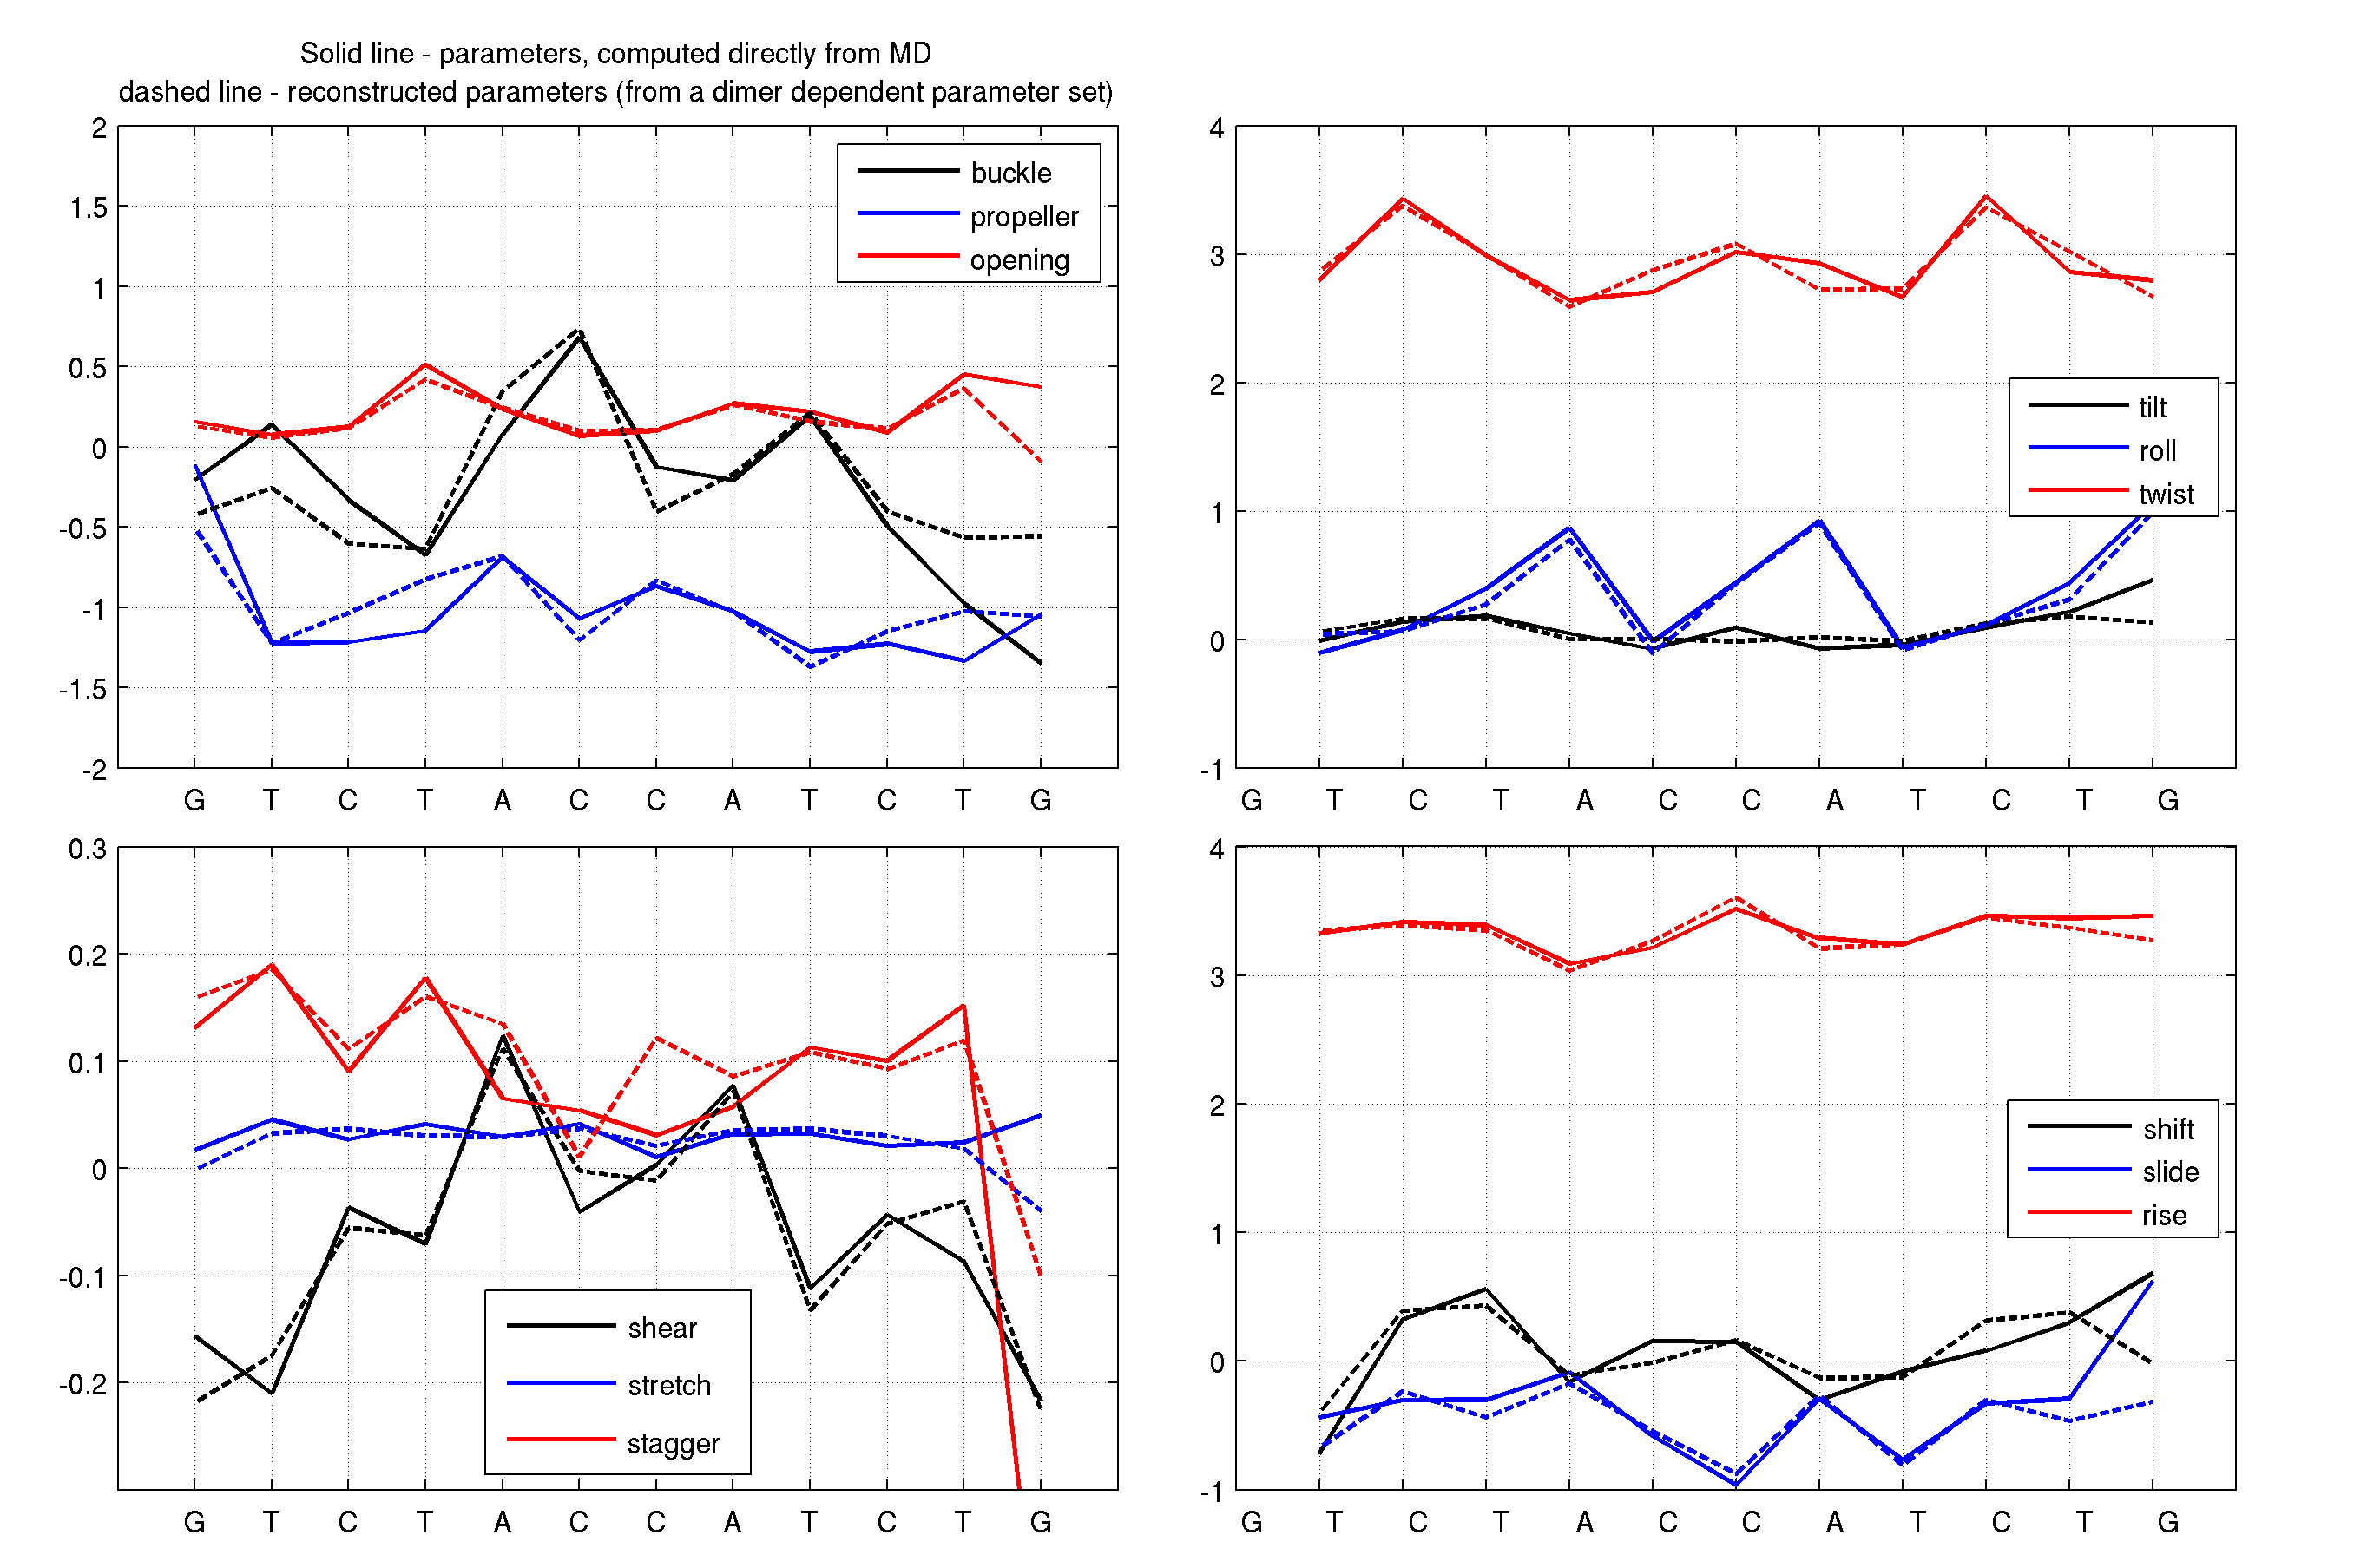
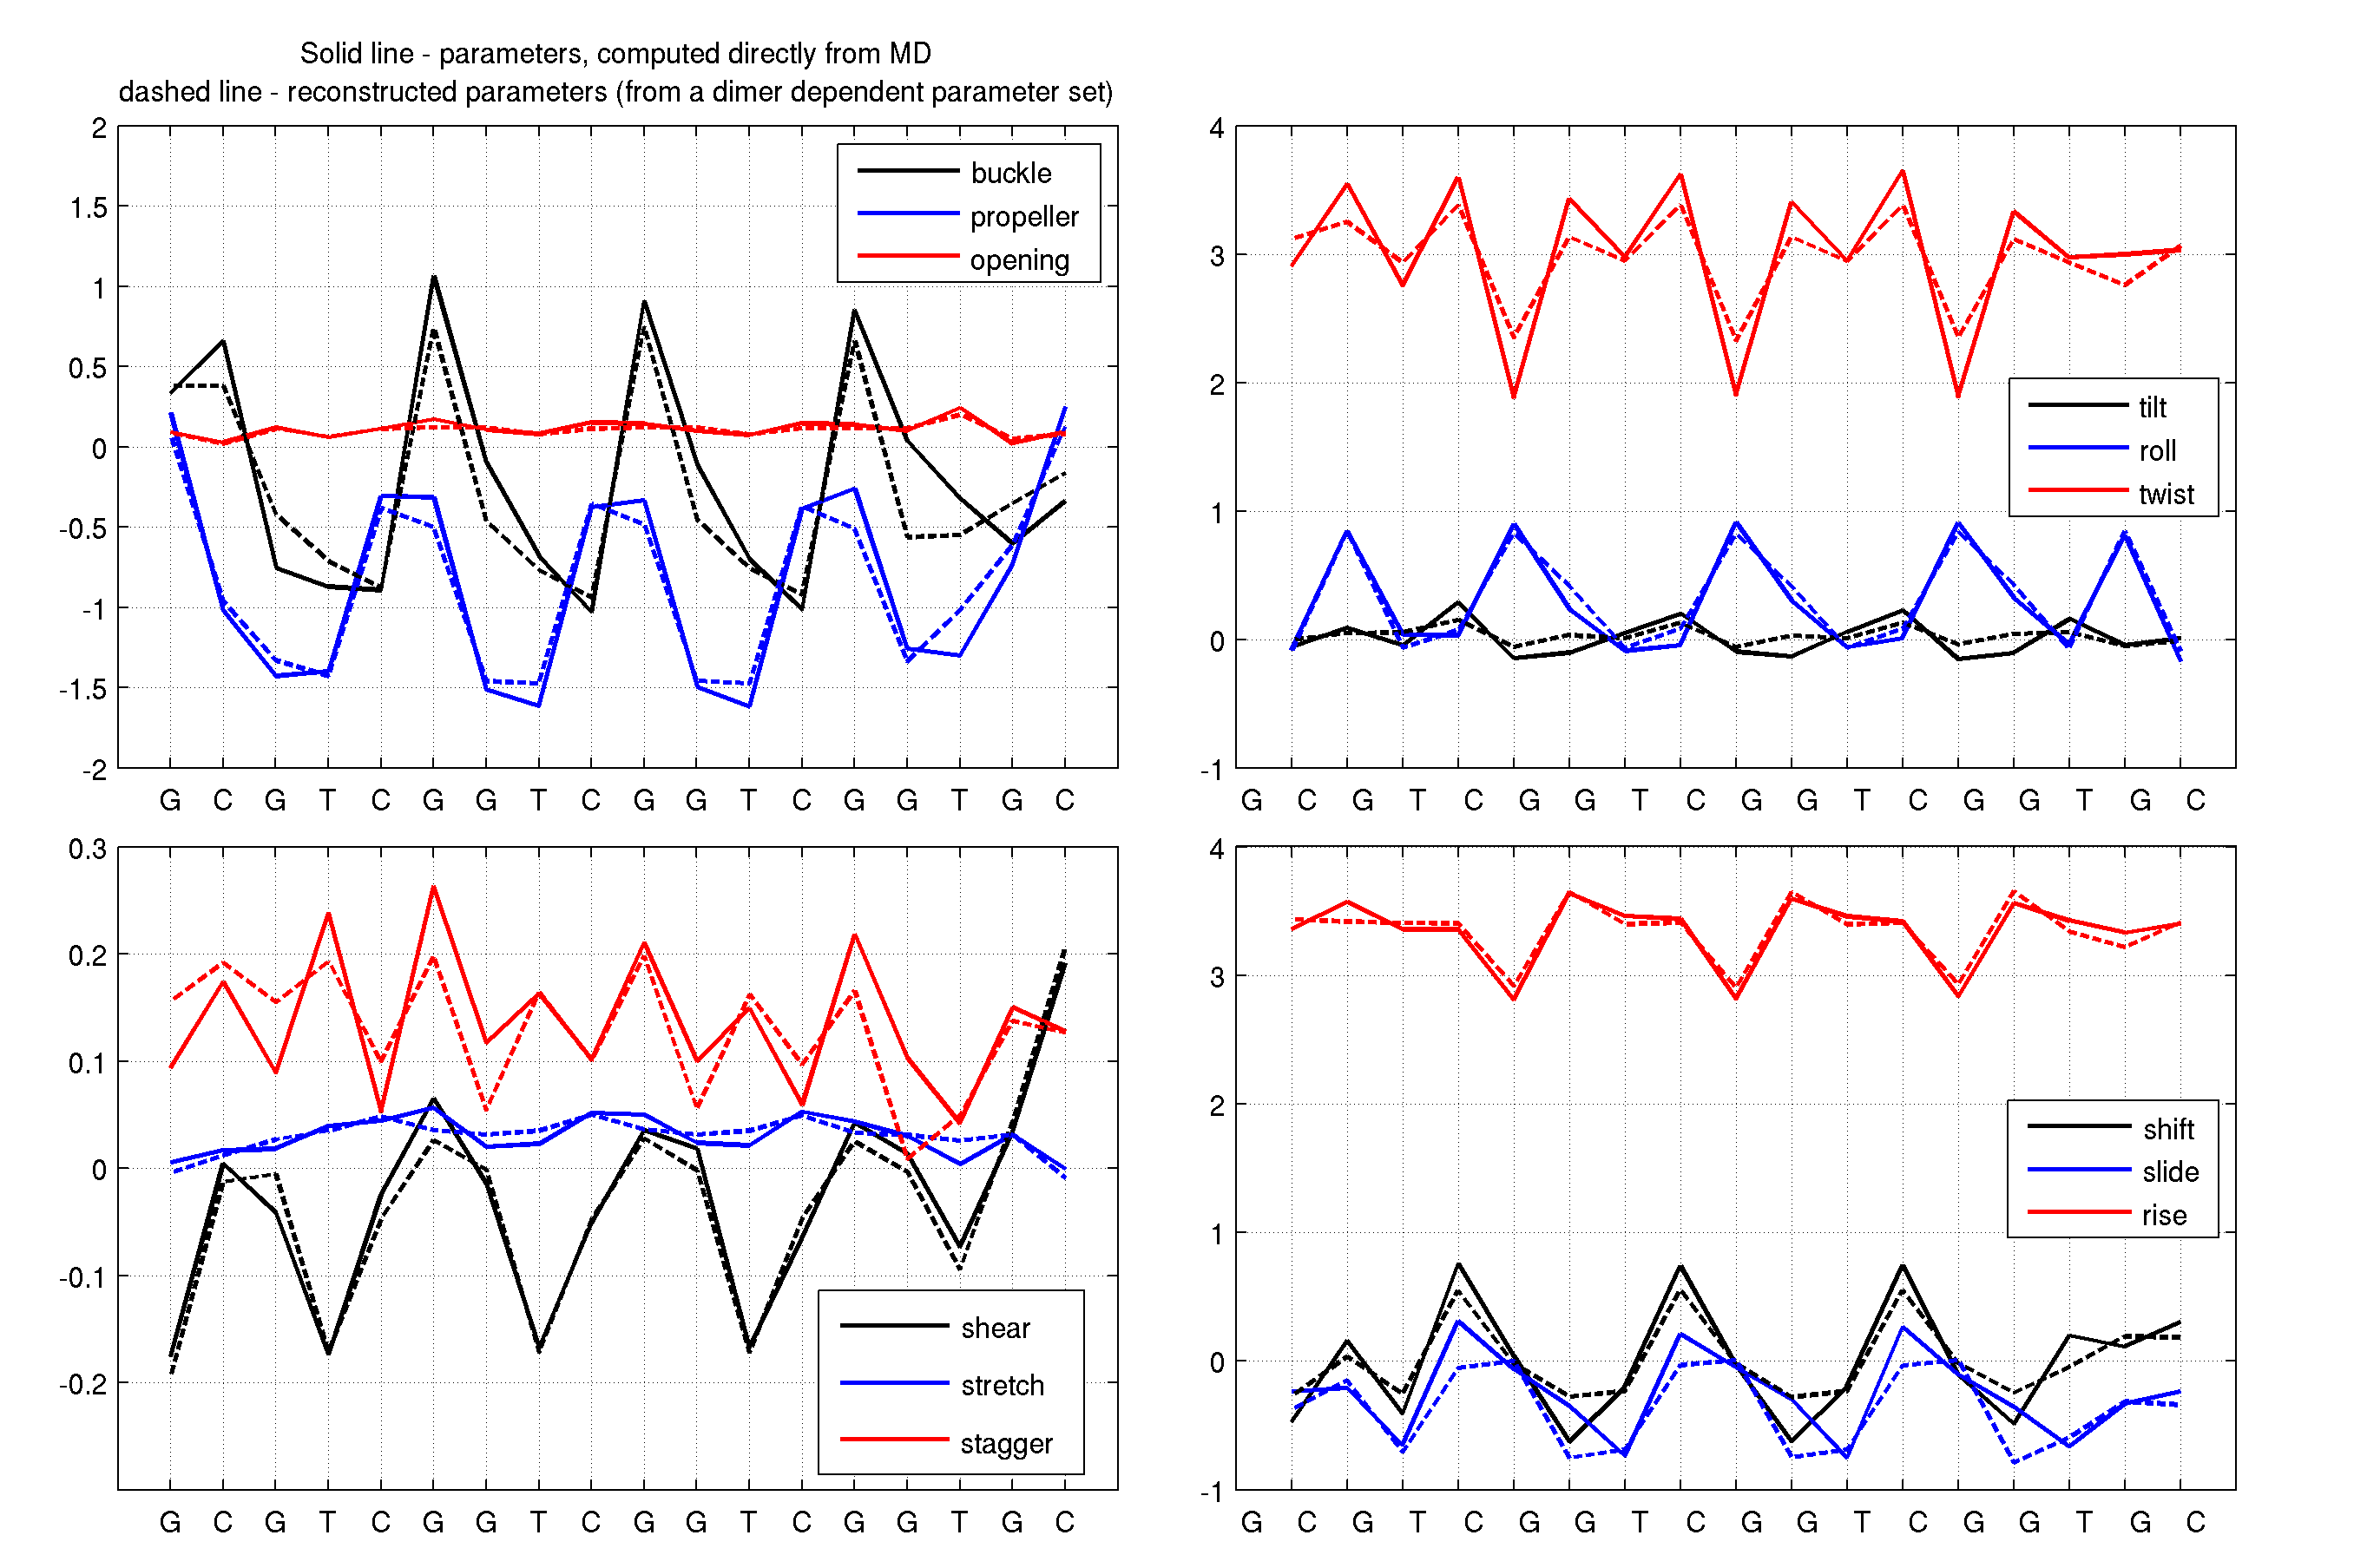
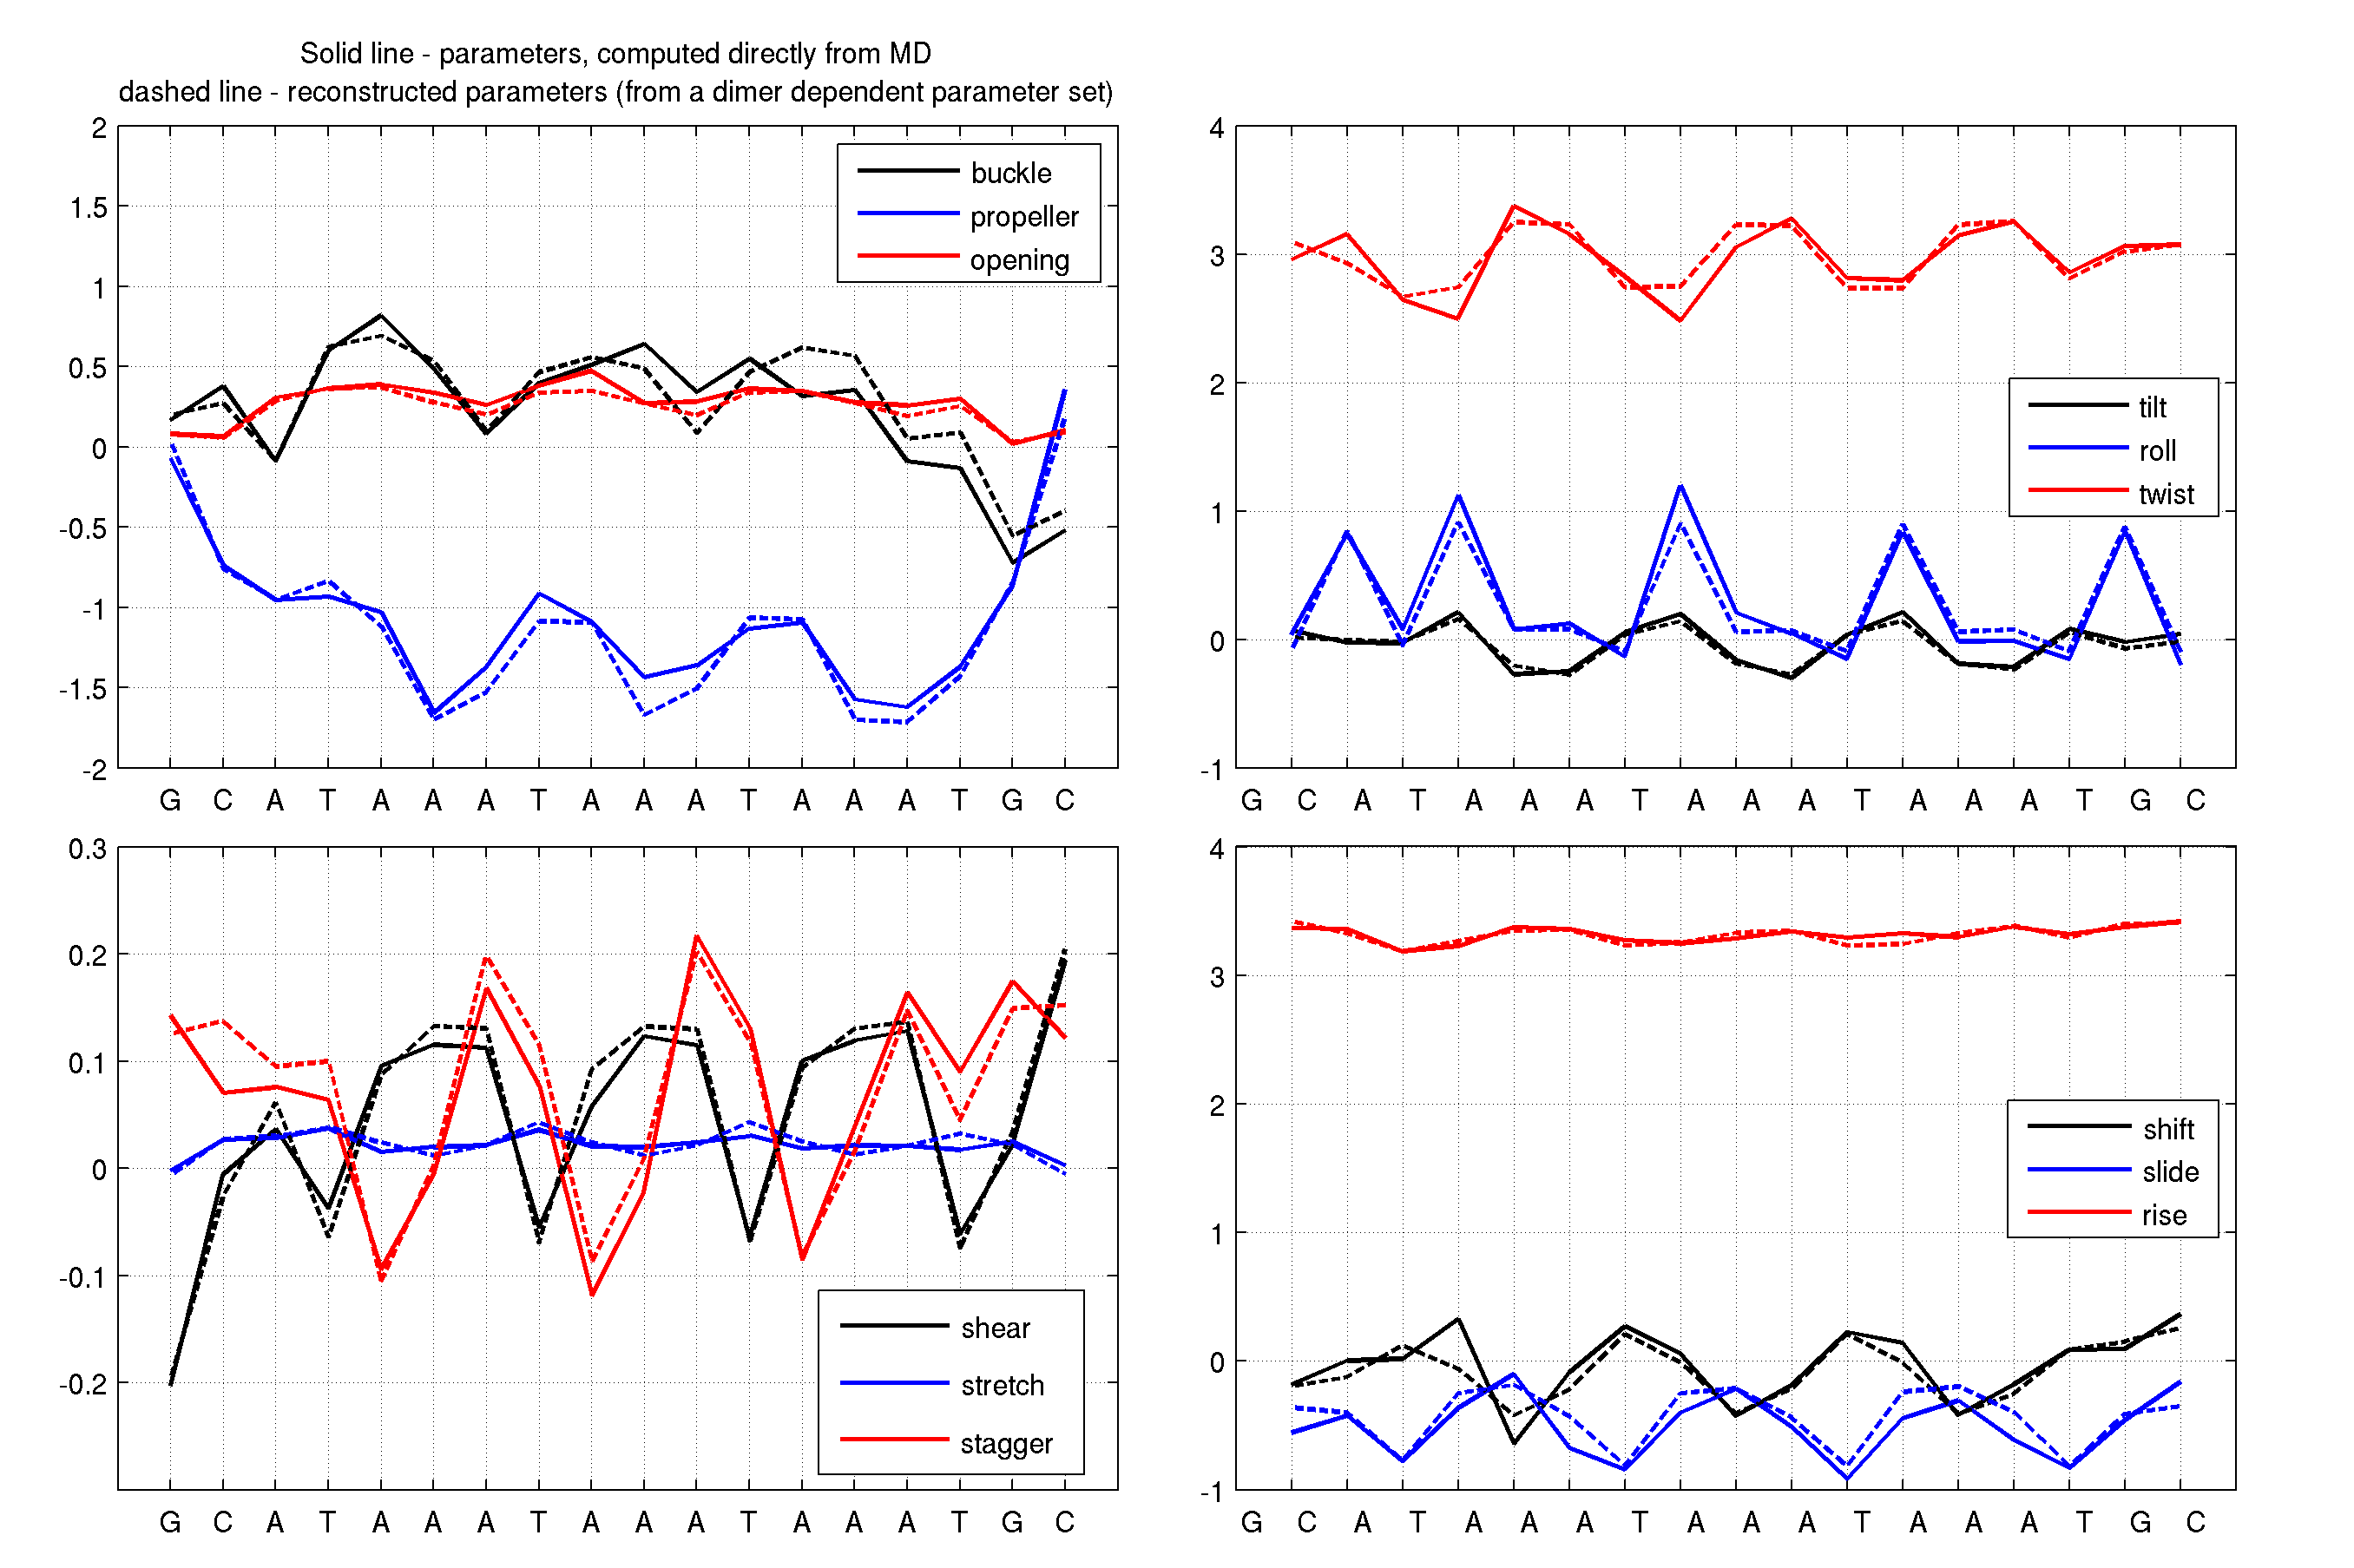
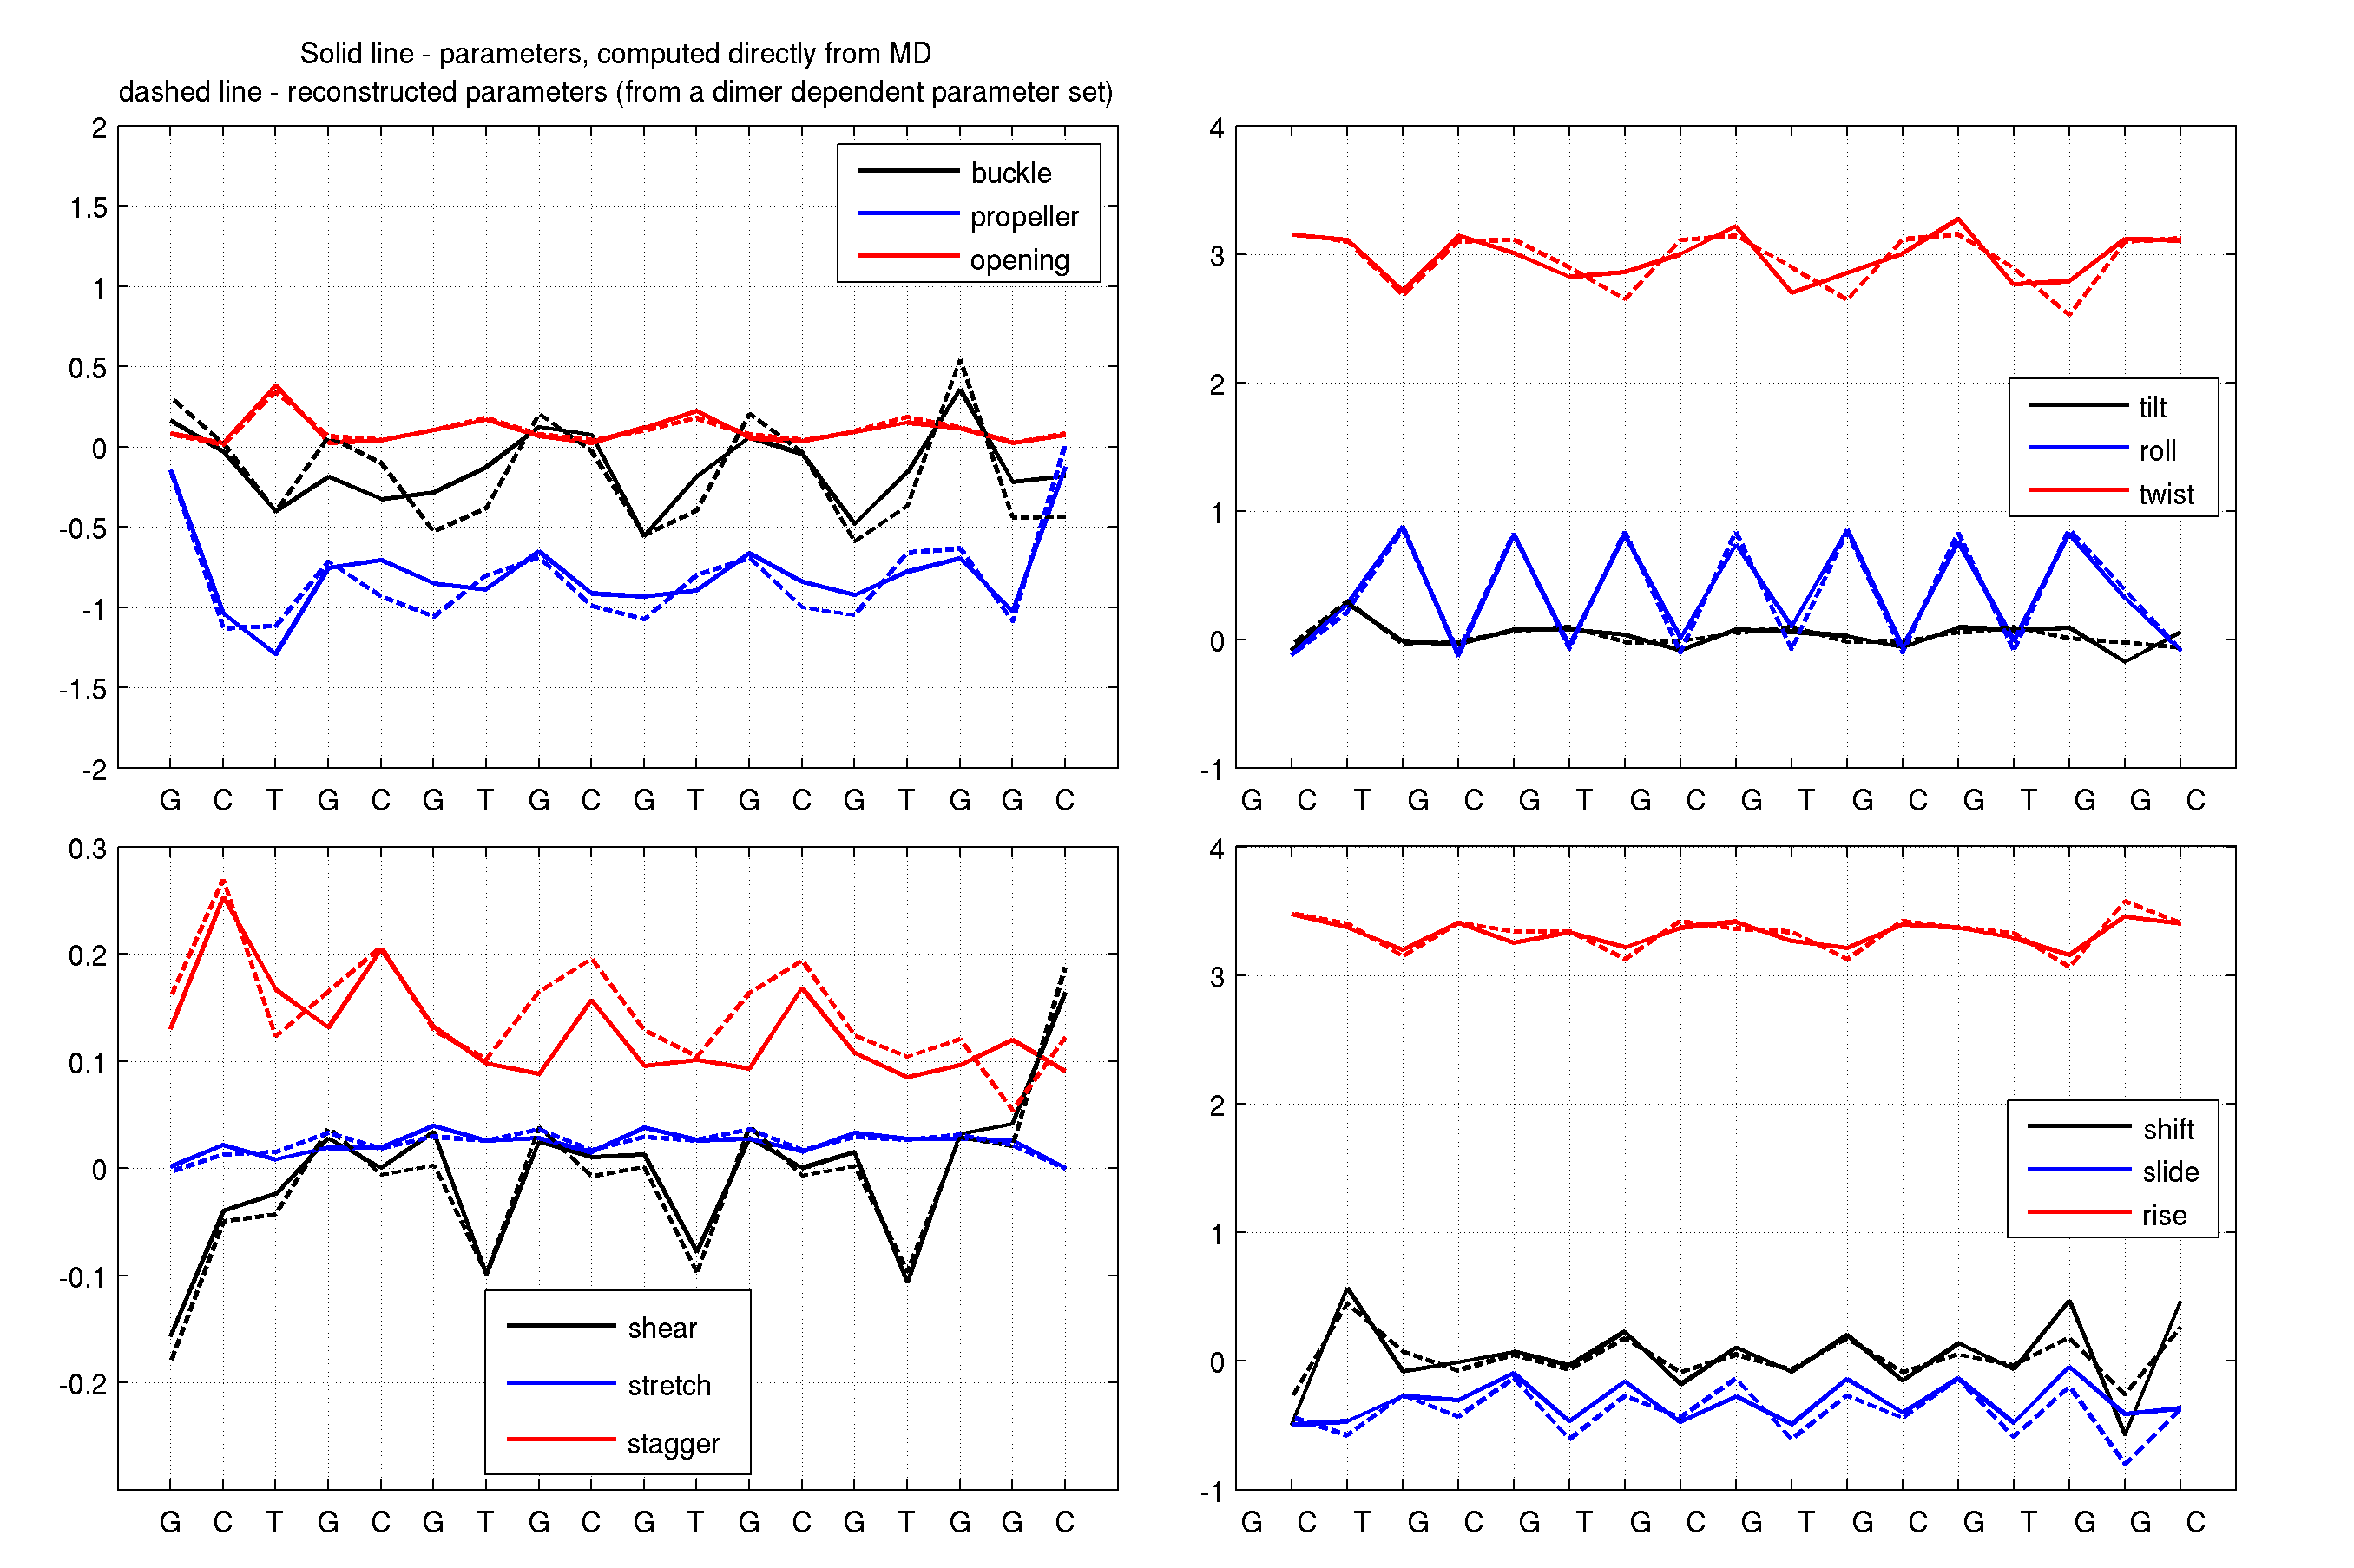
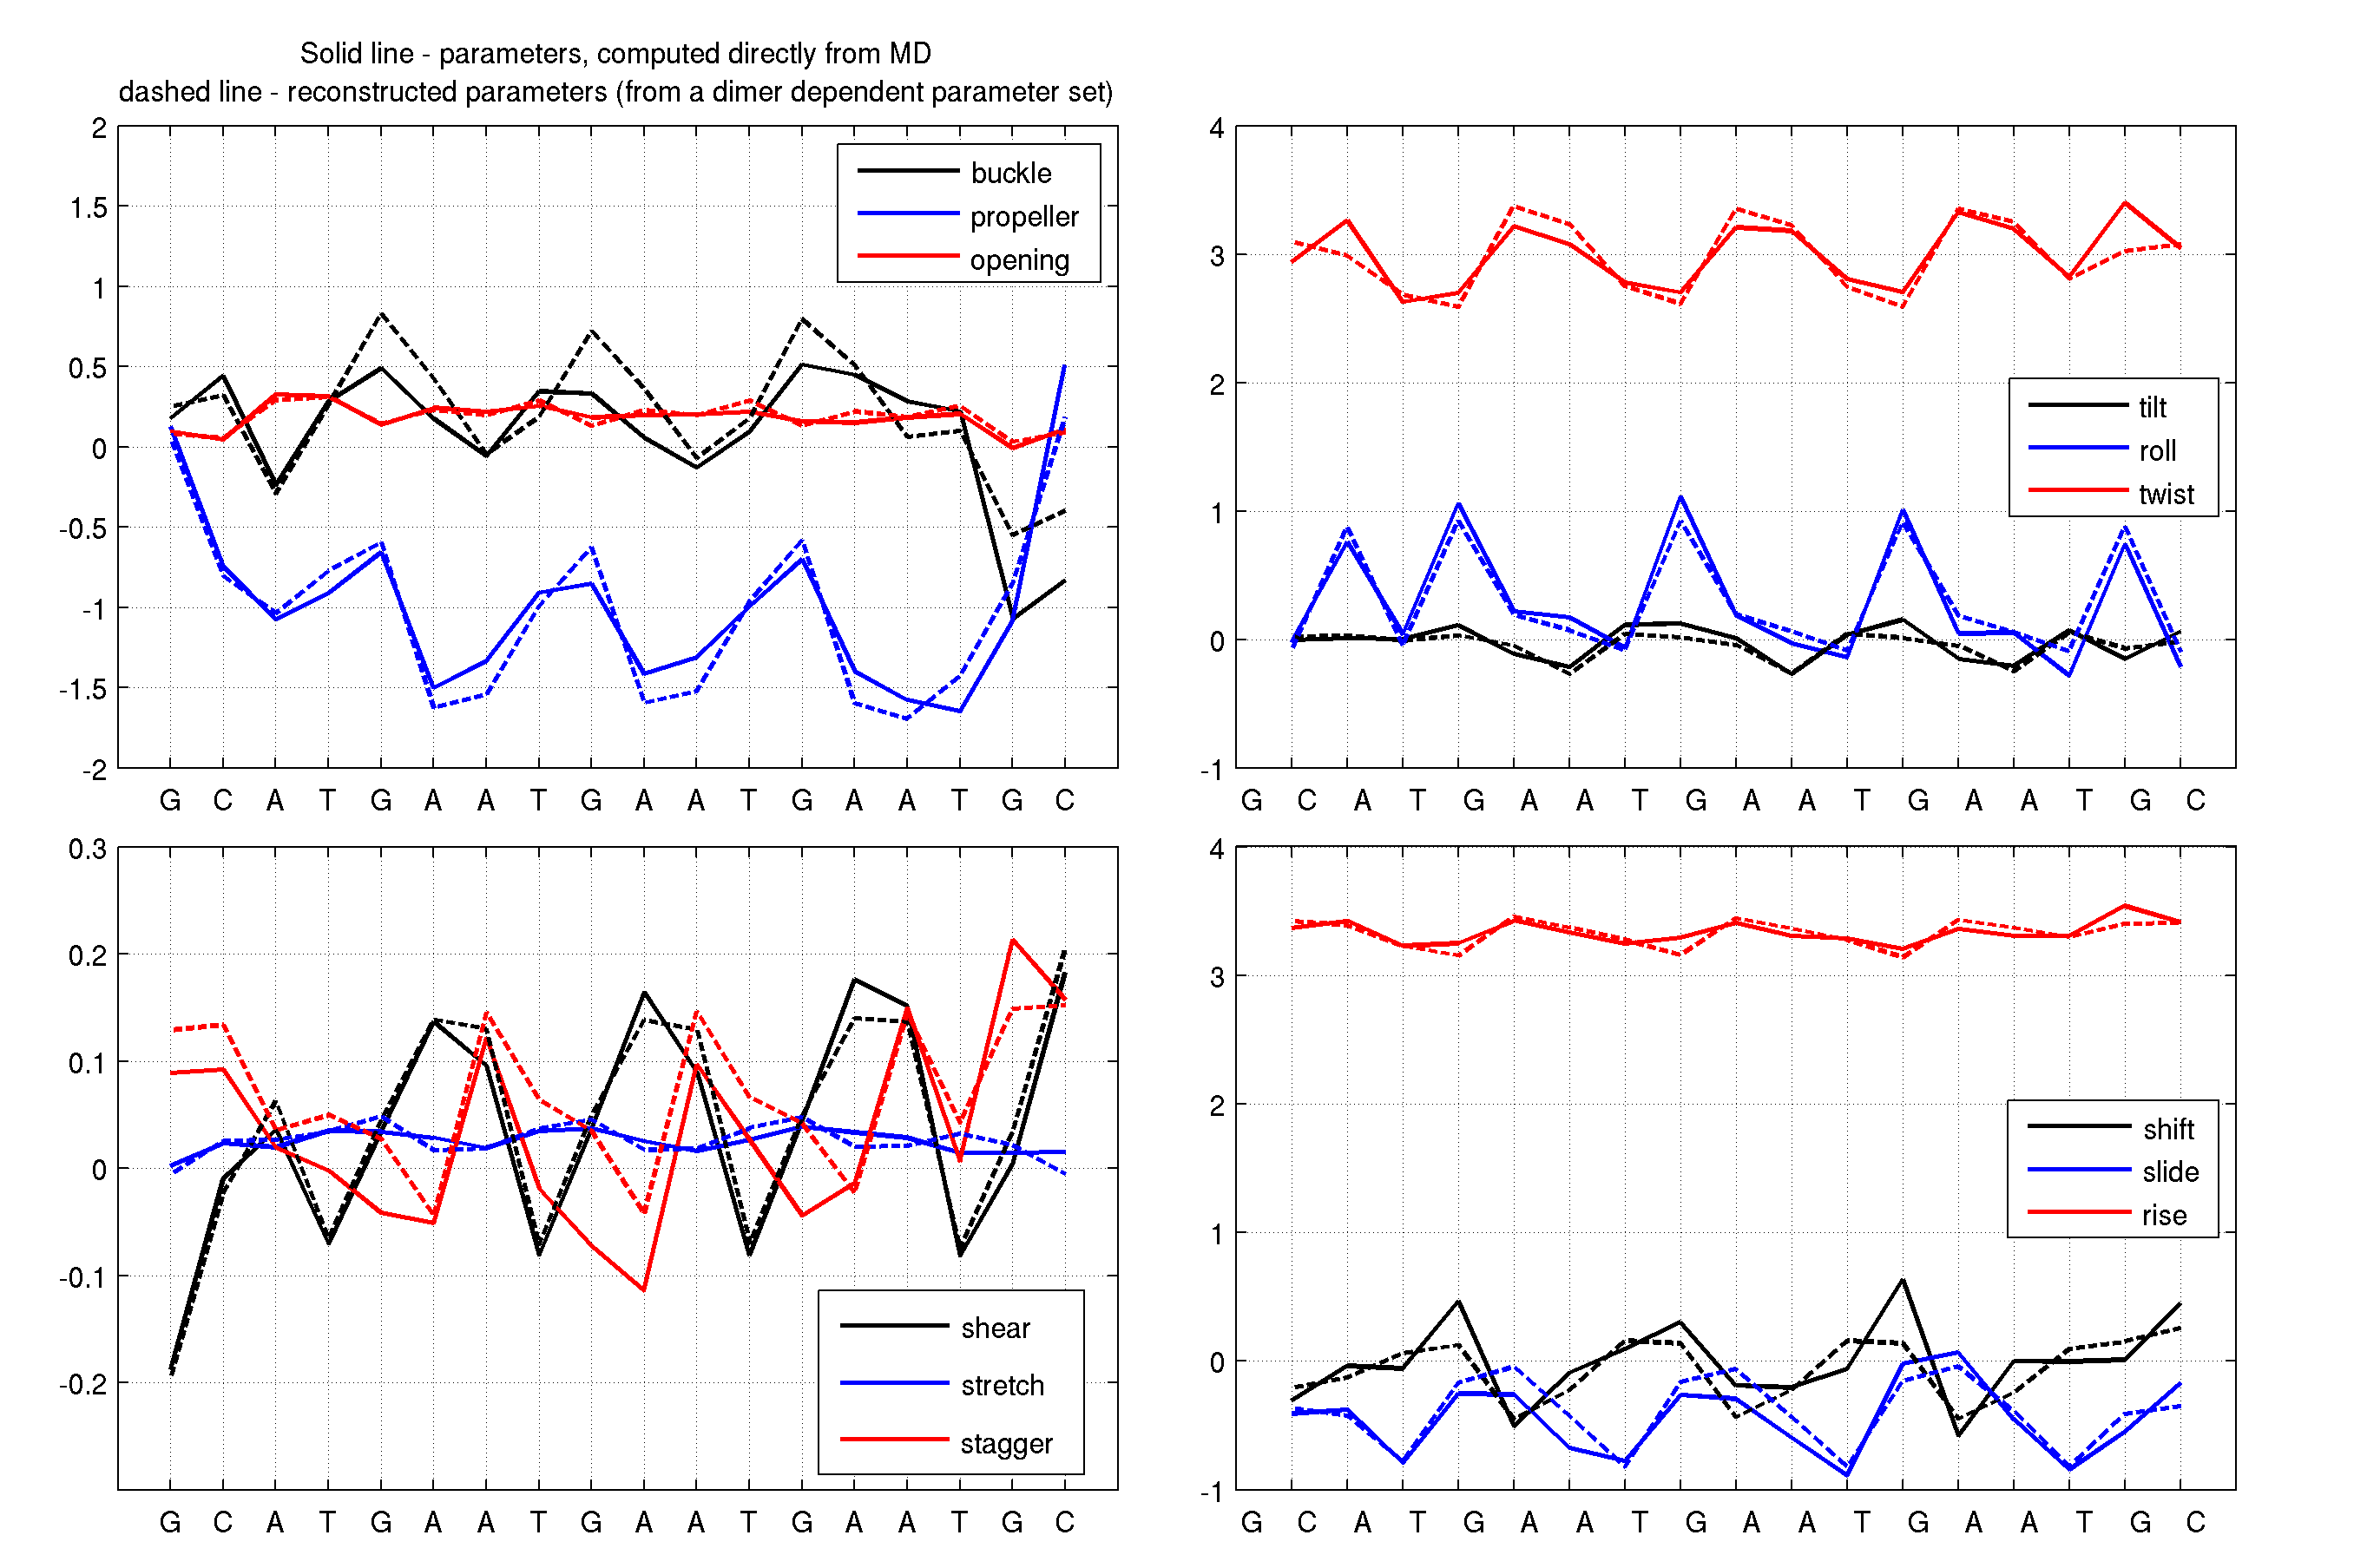
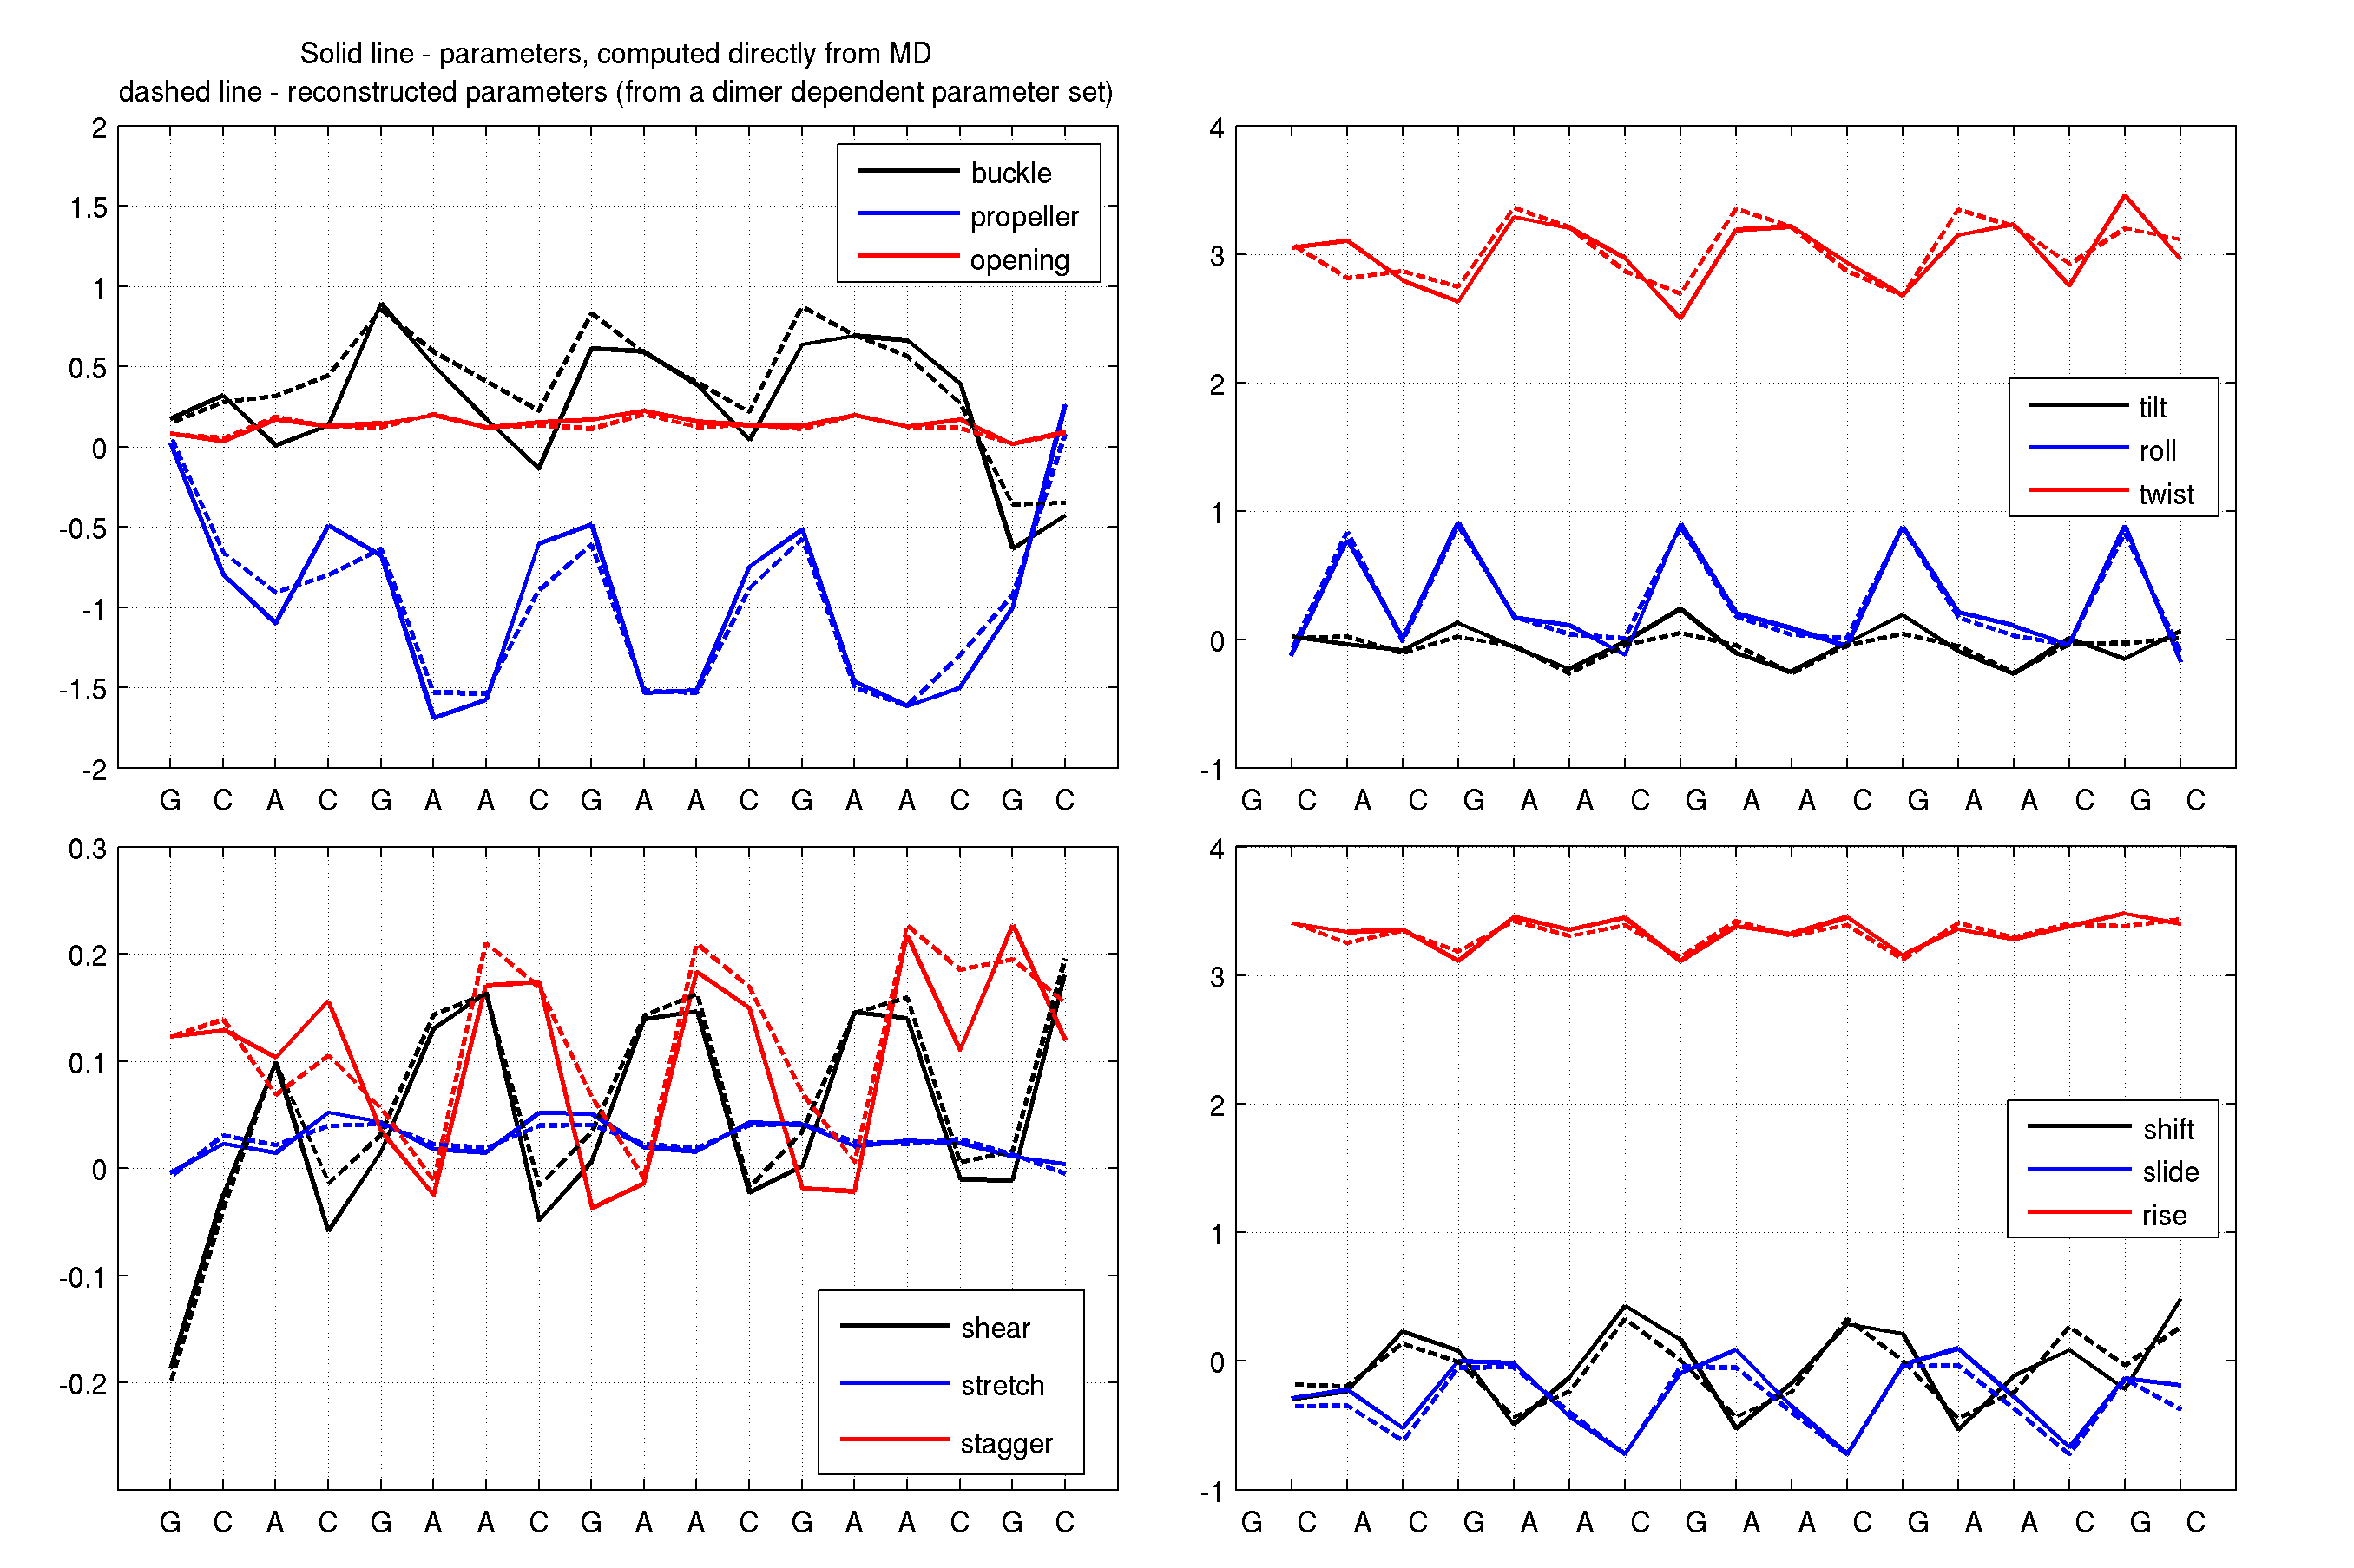
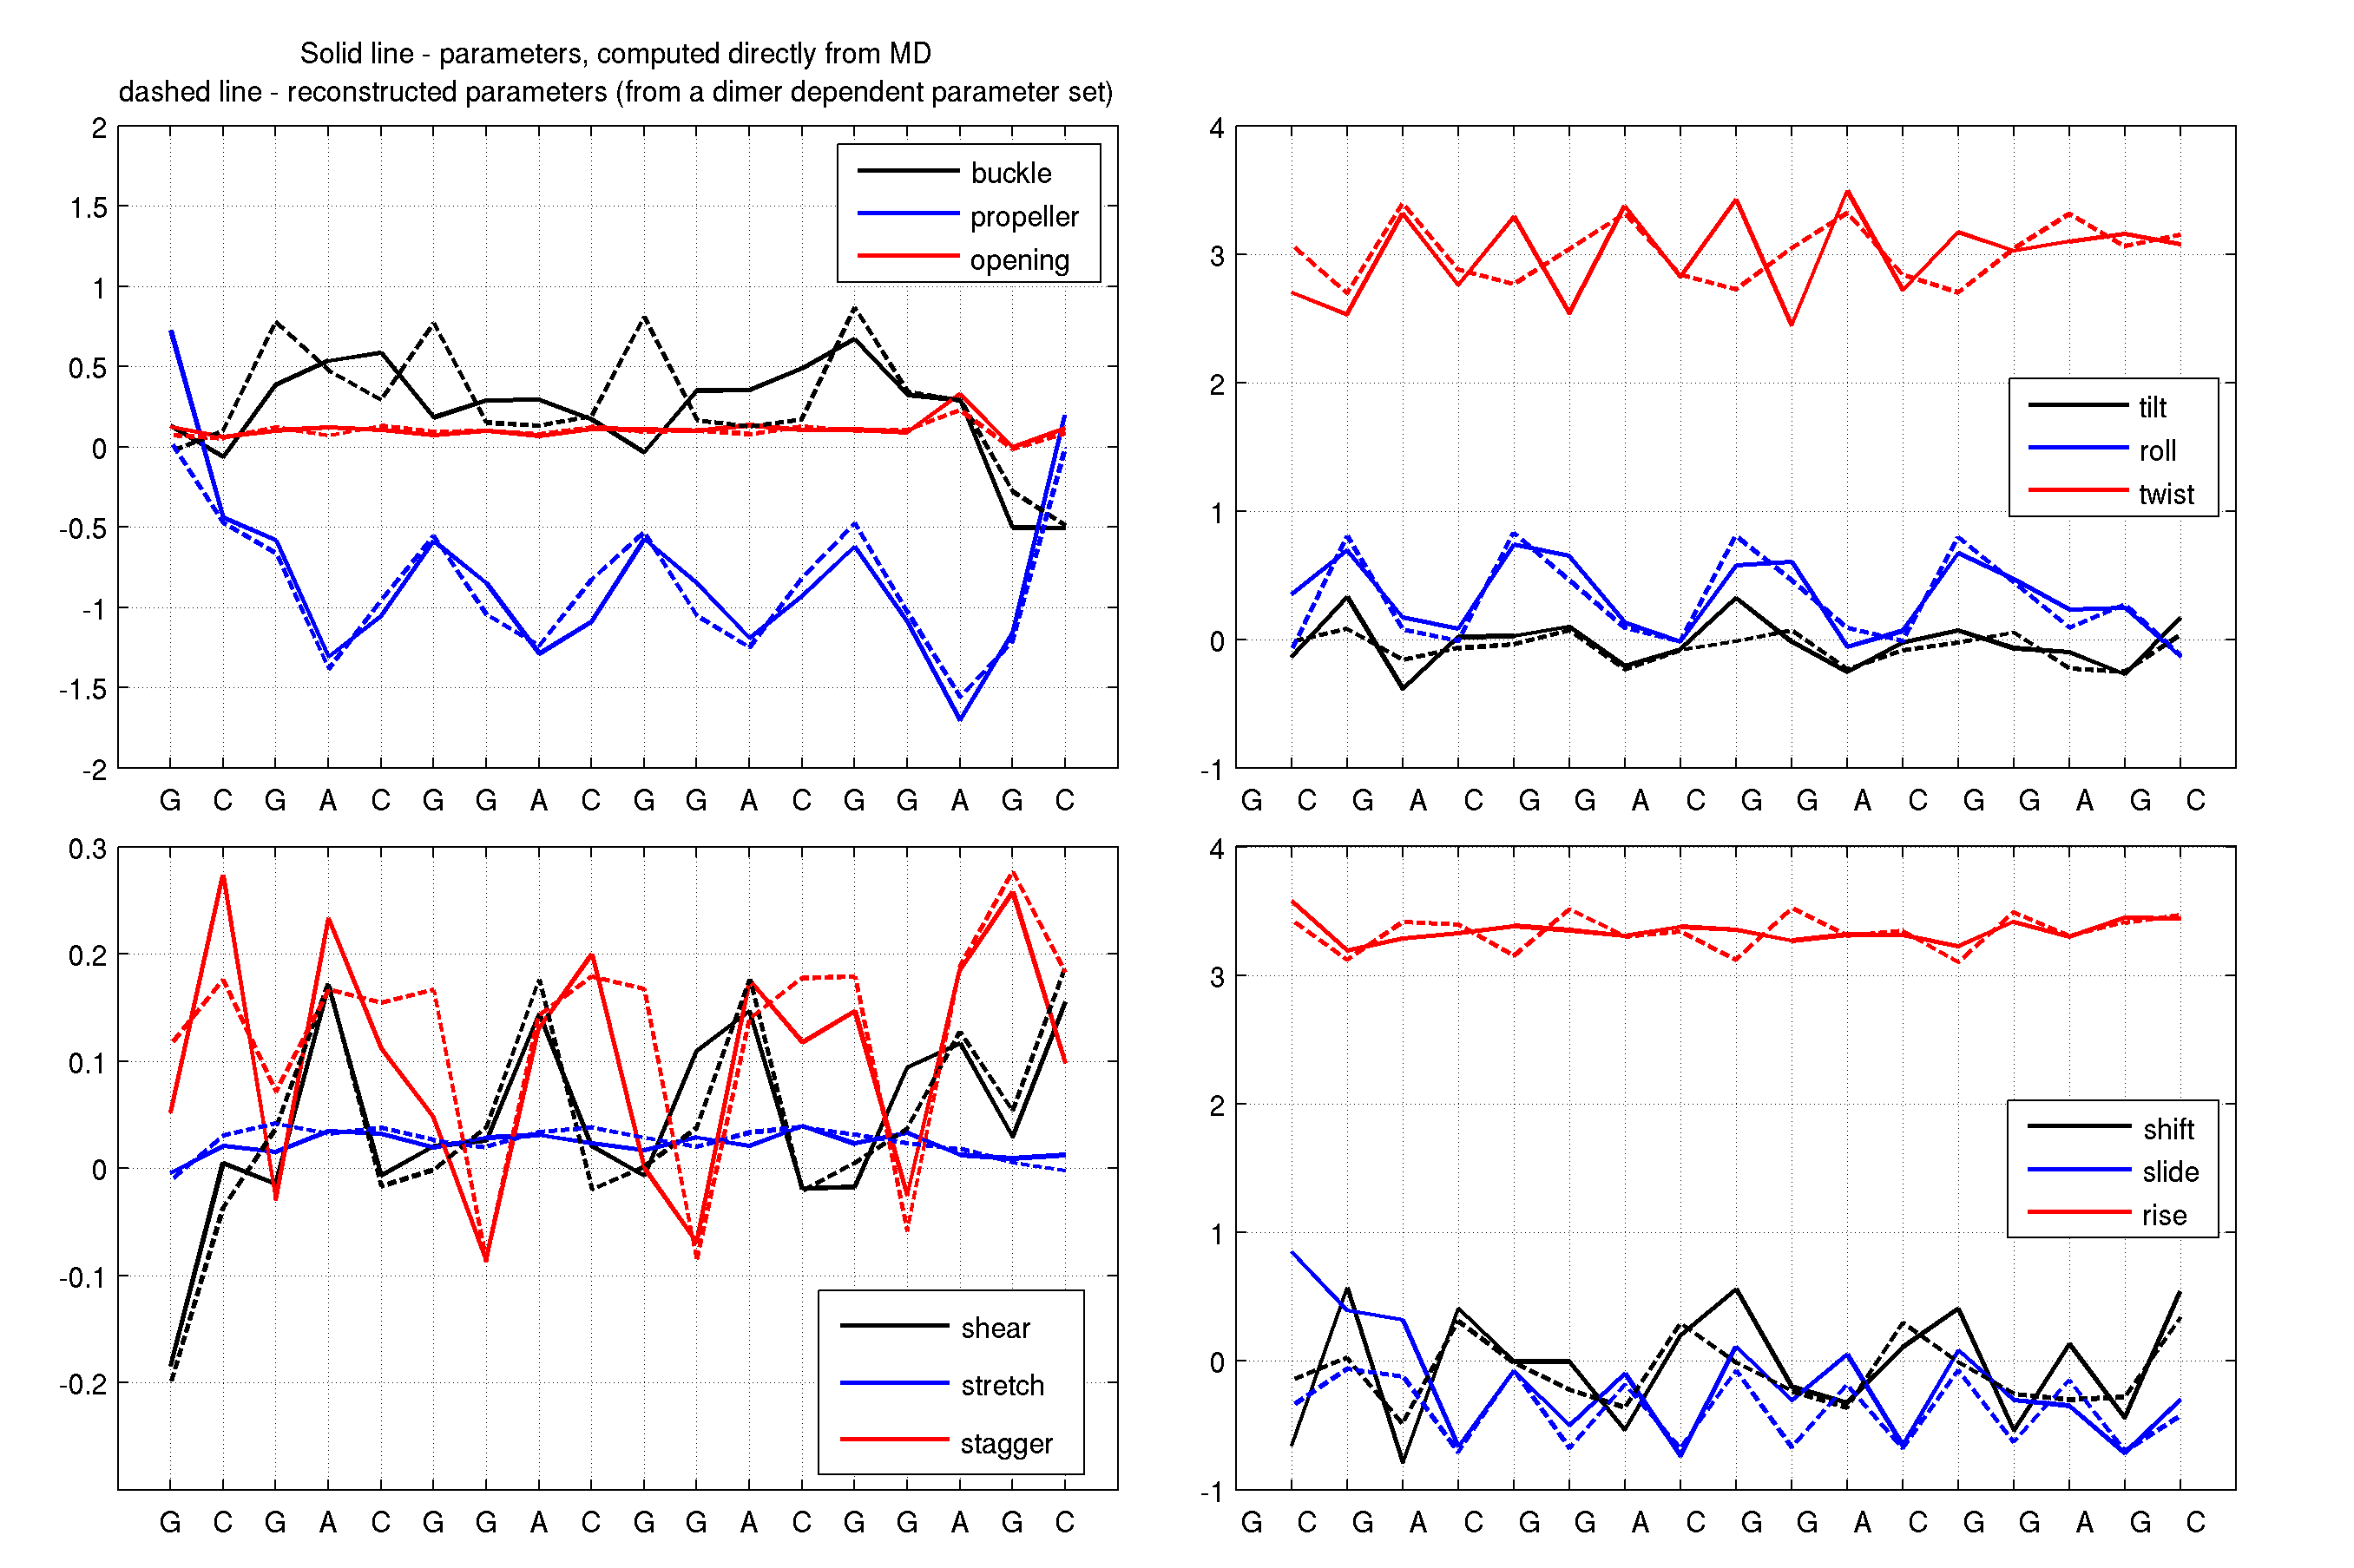
Shapes (ŵ)
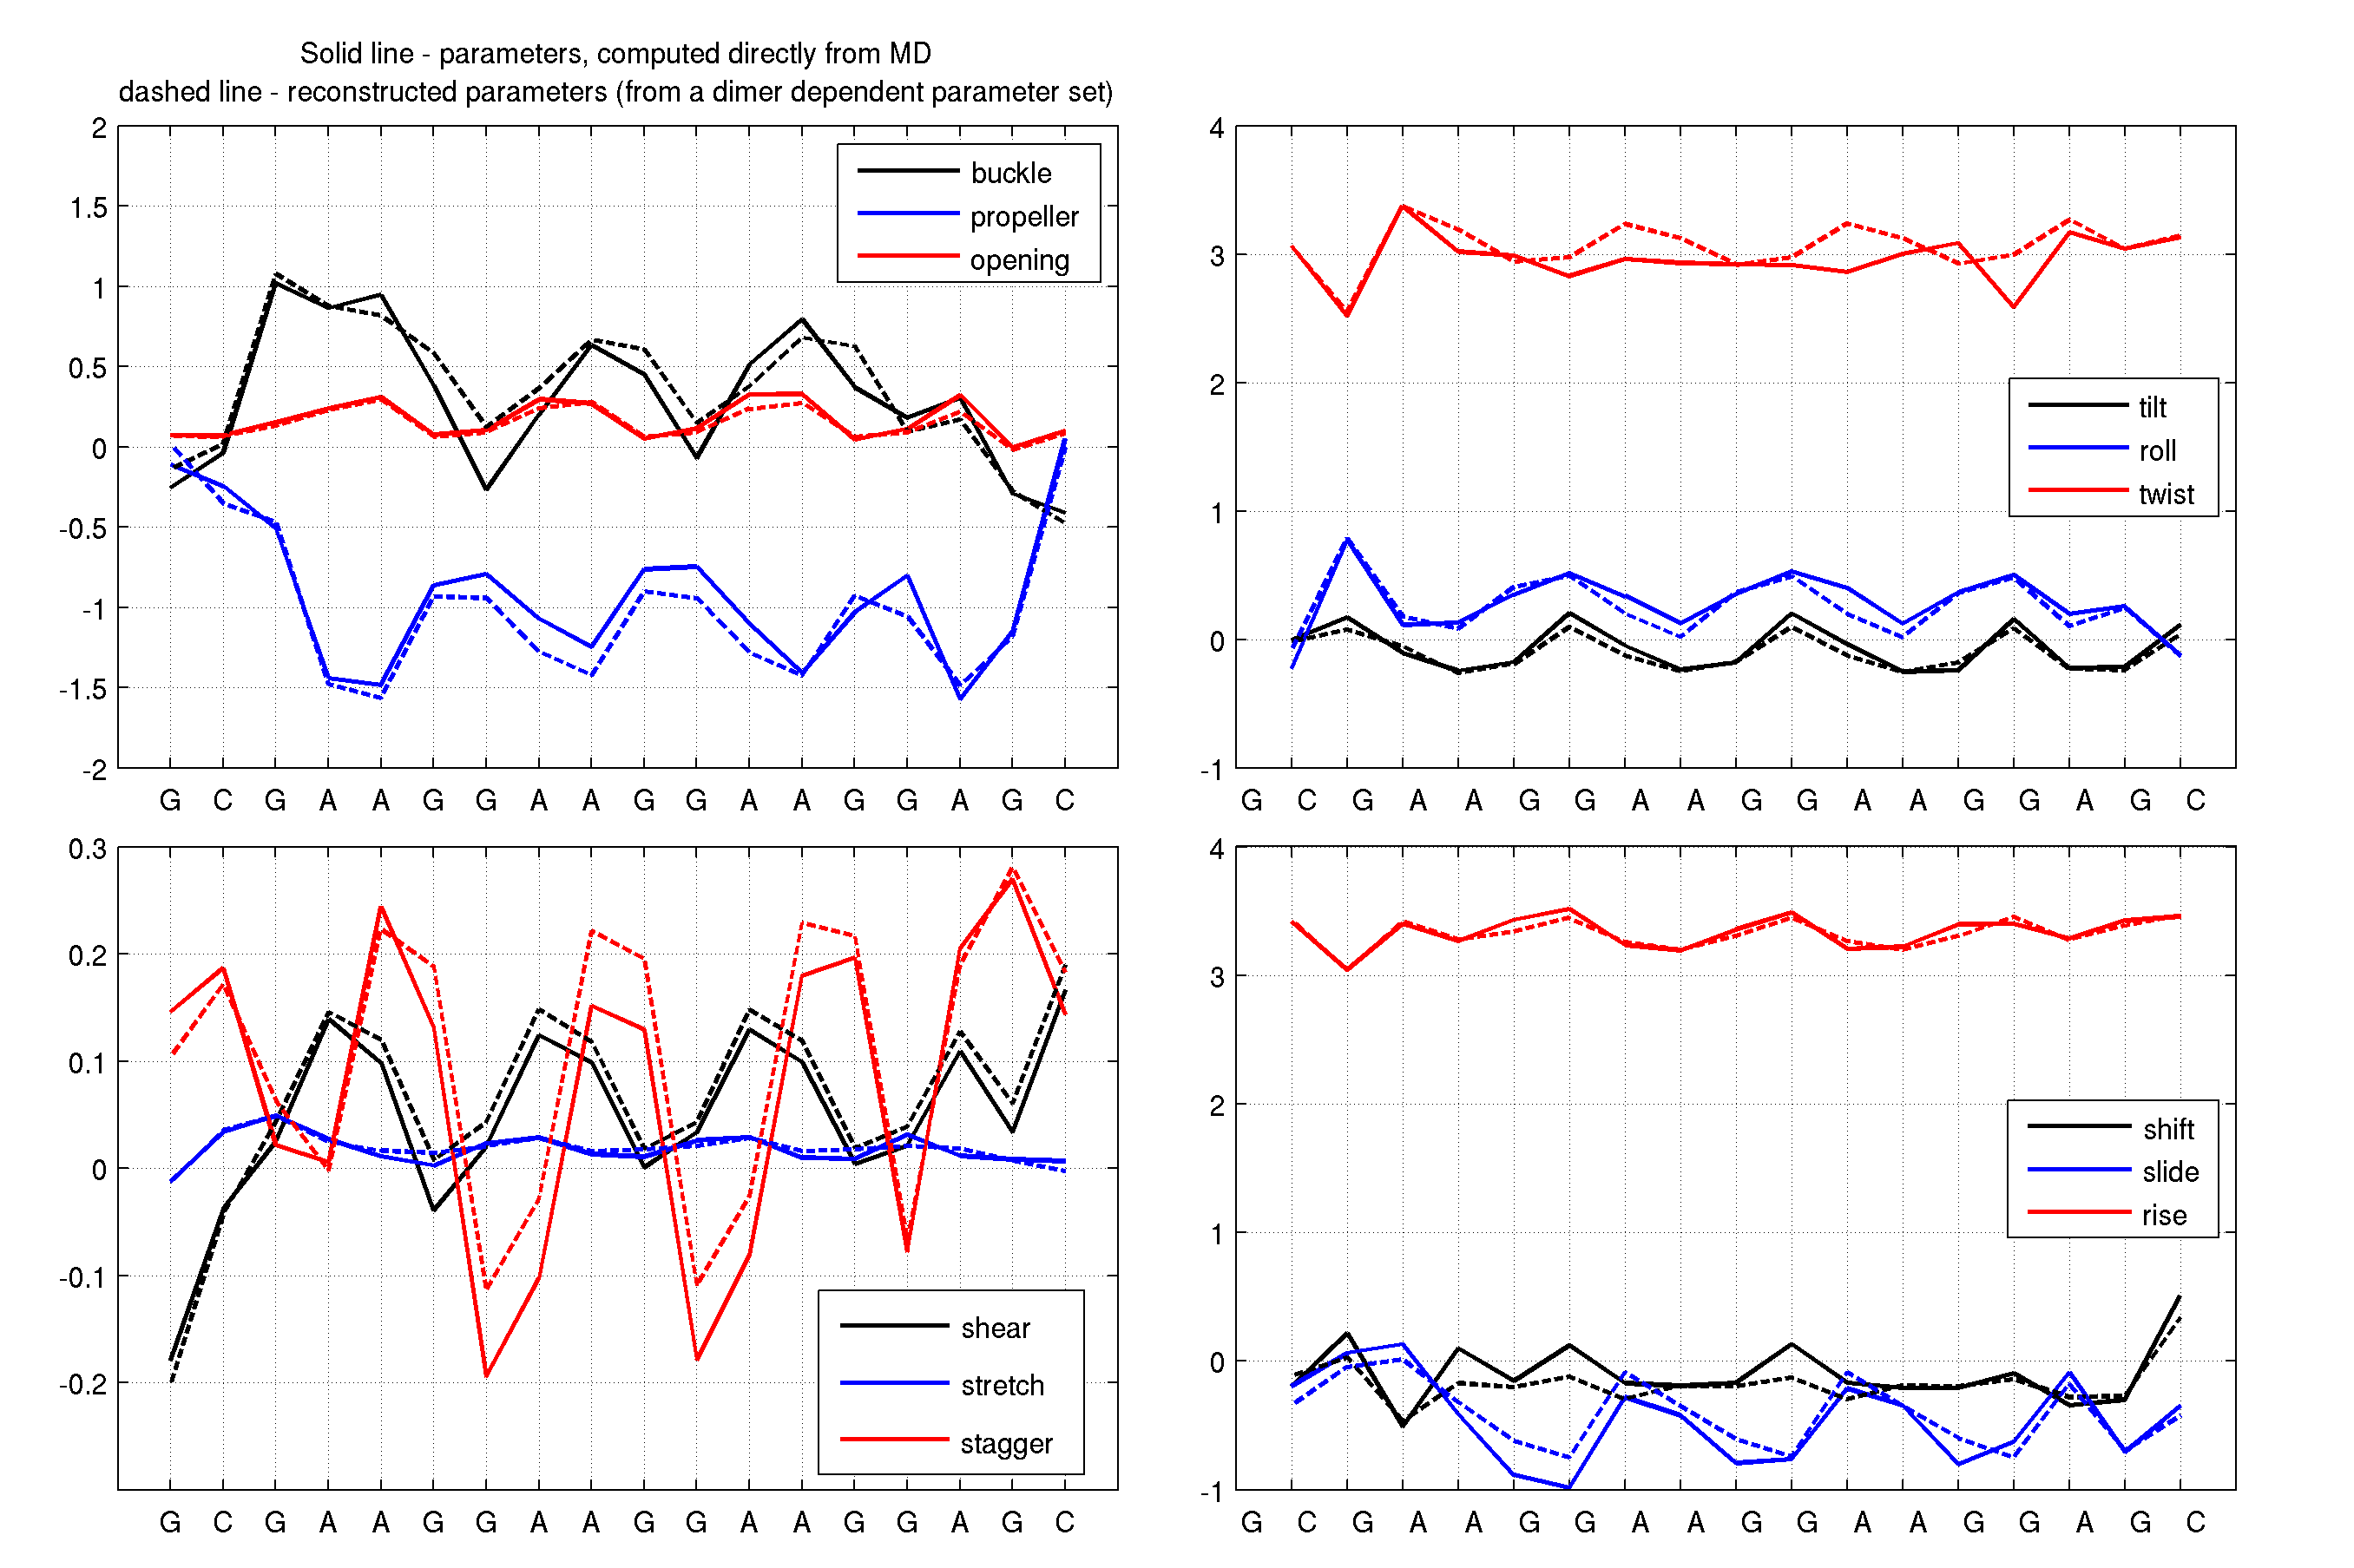
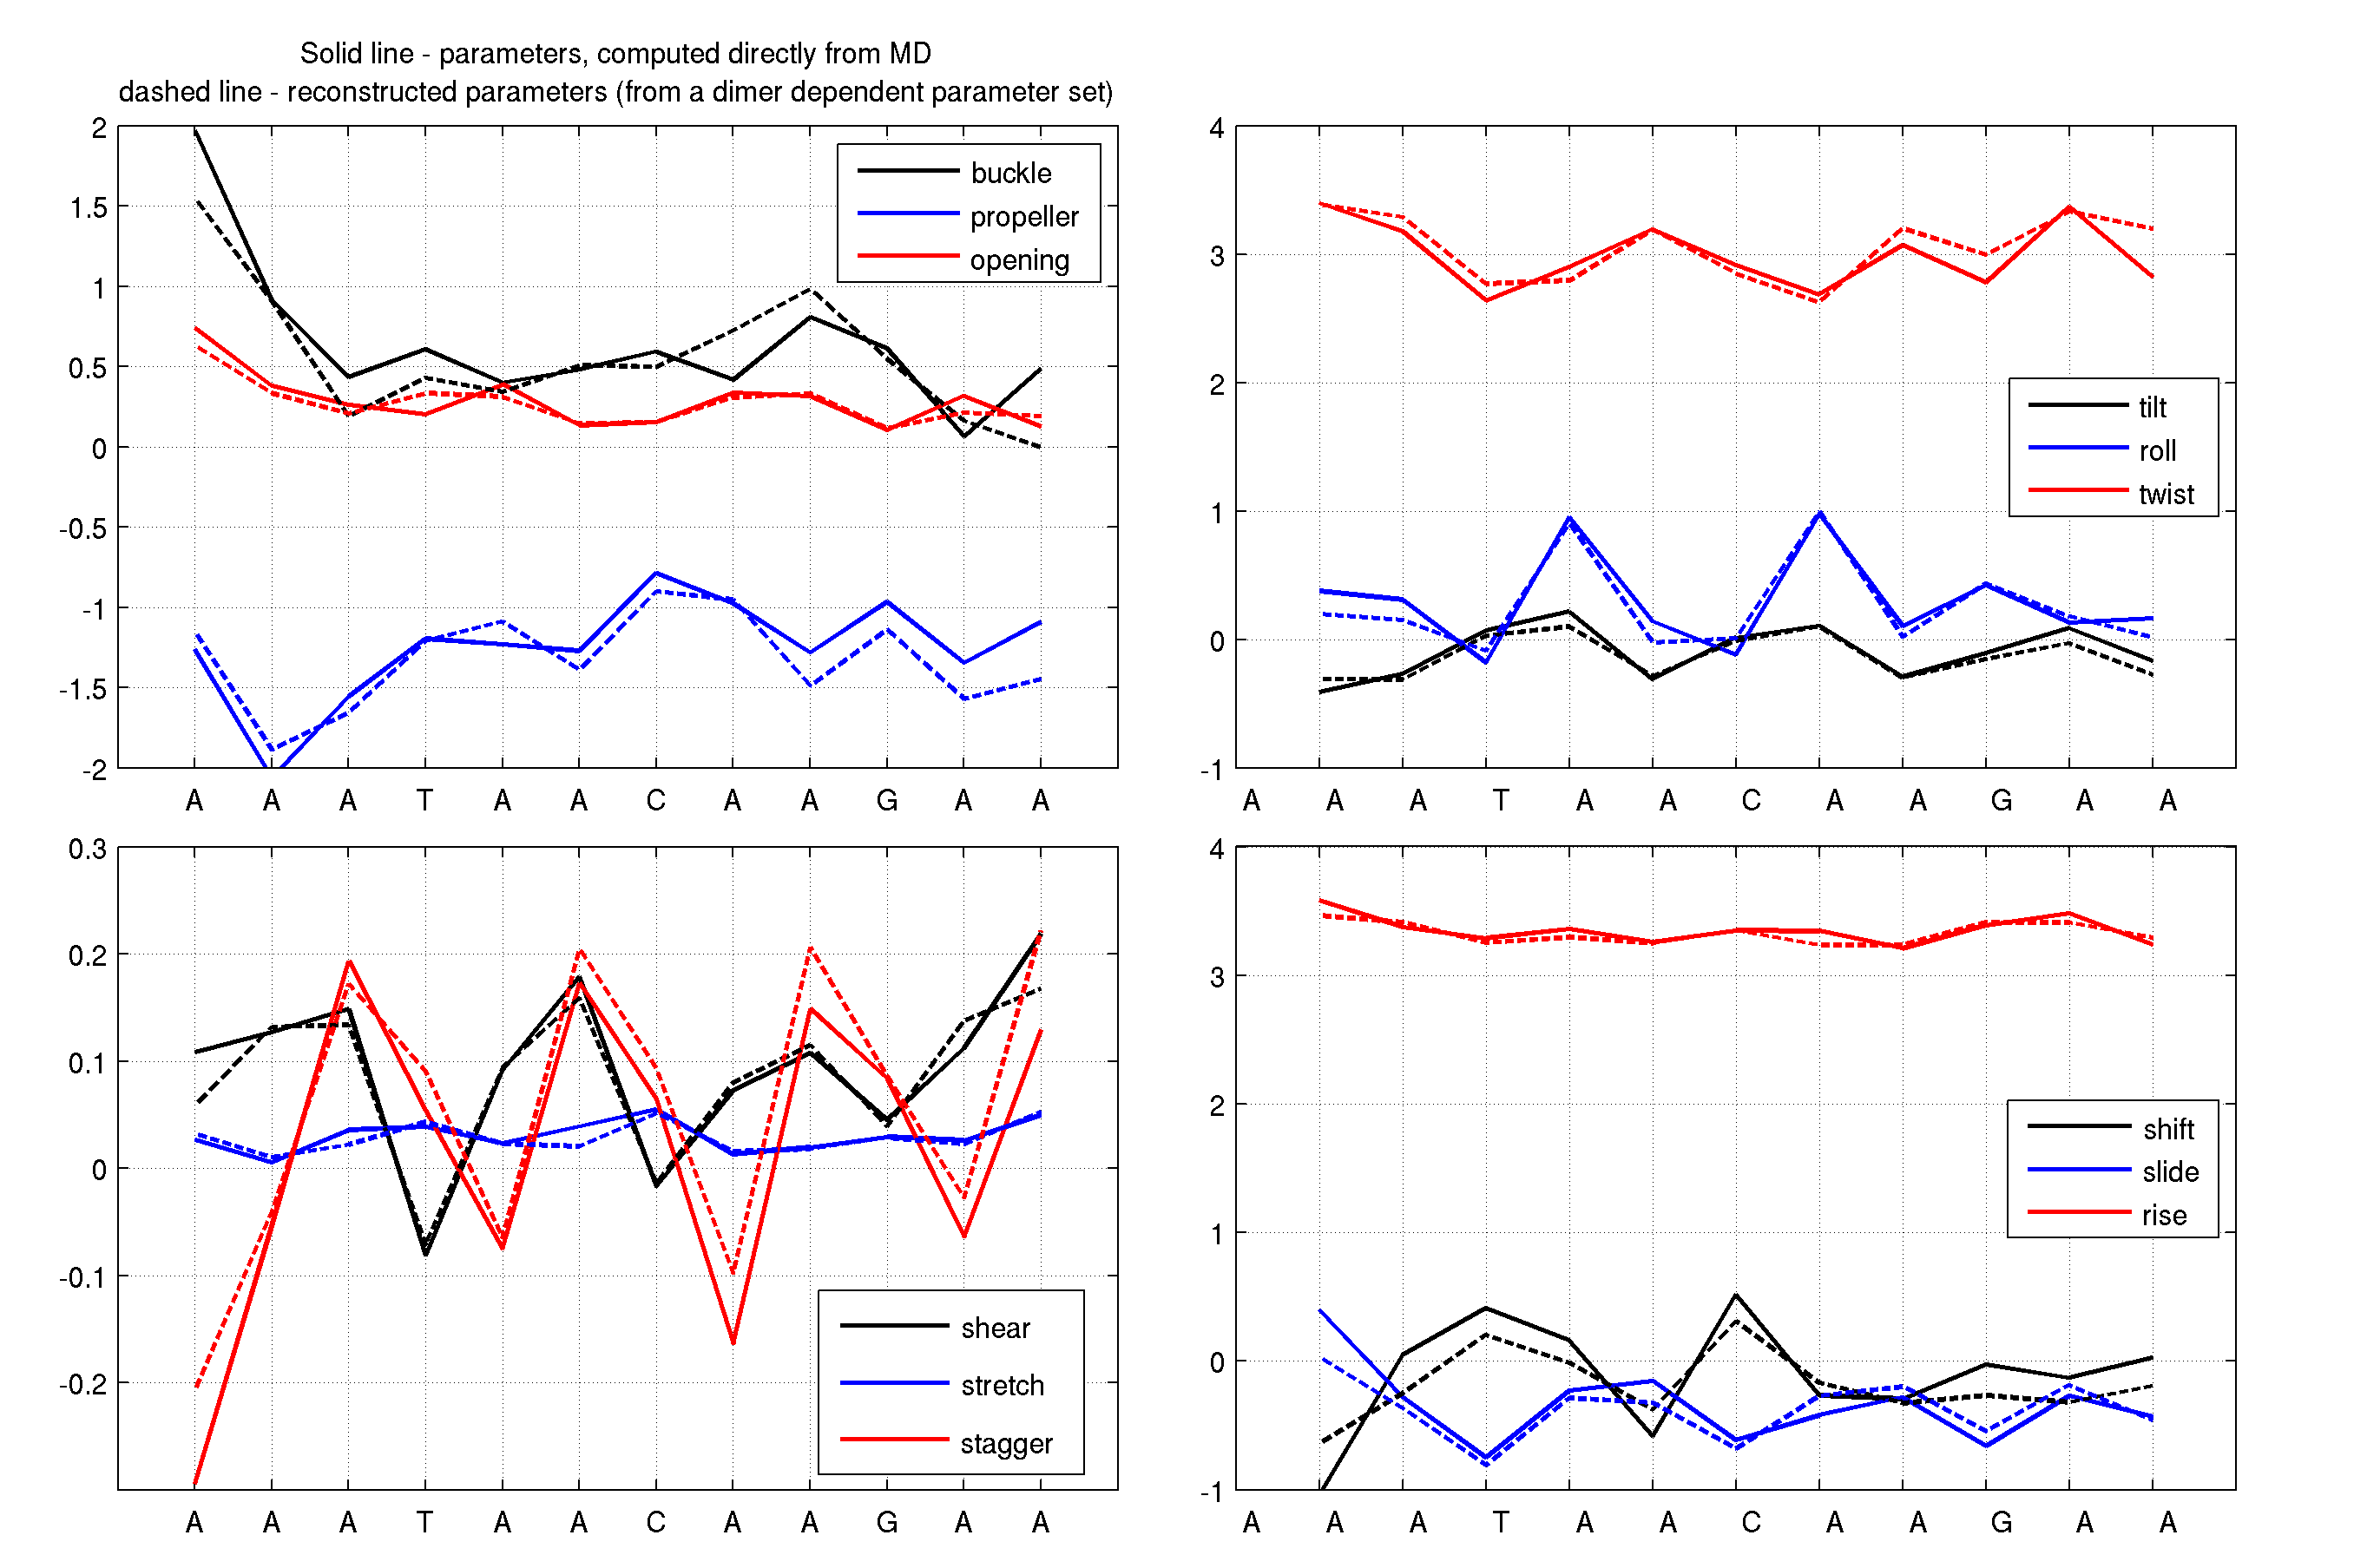
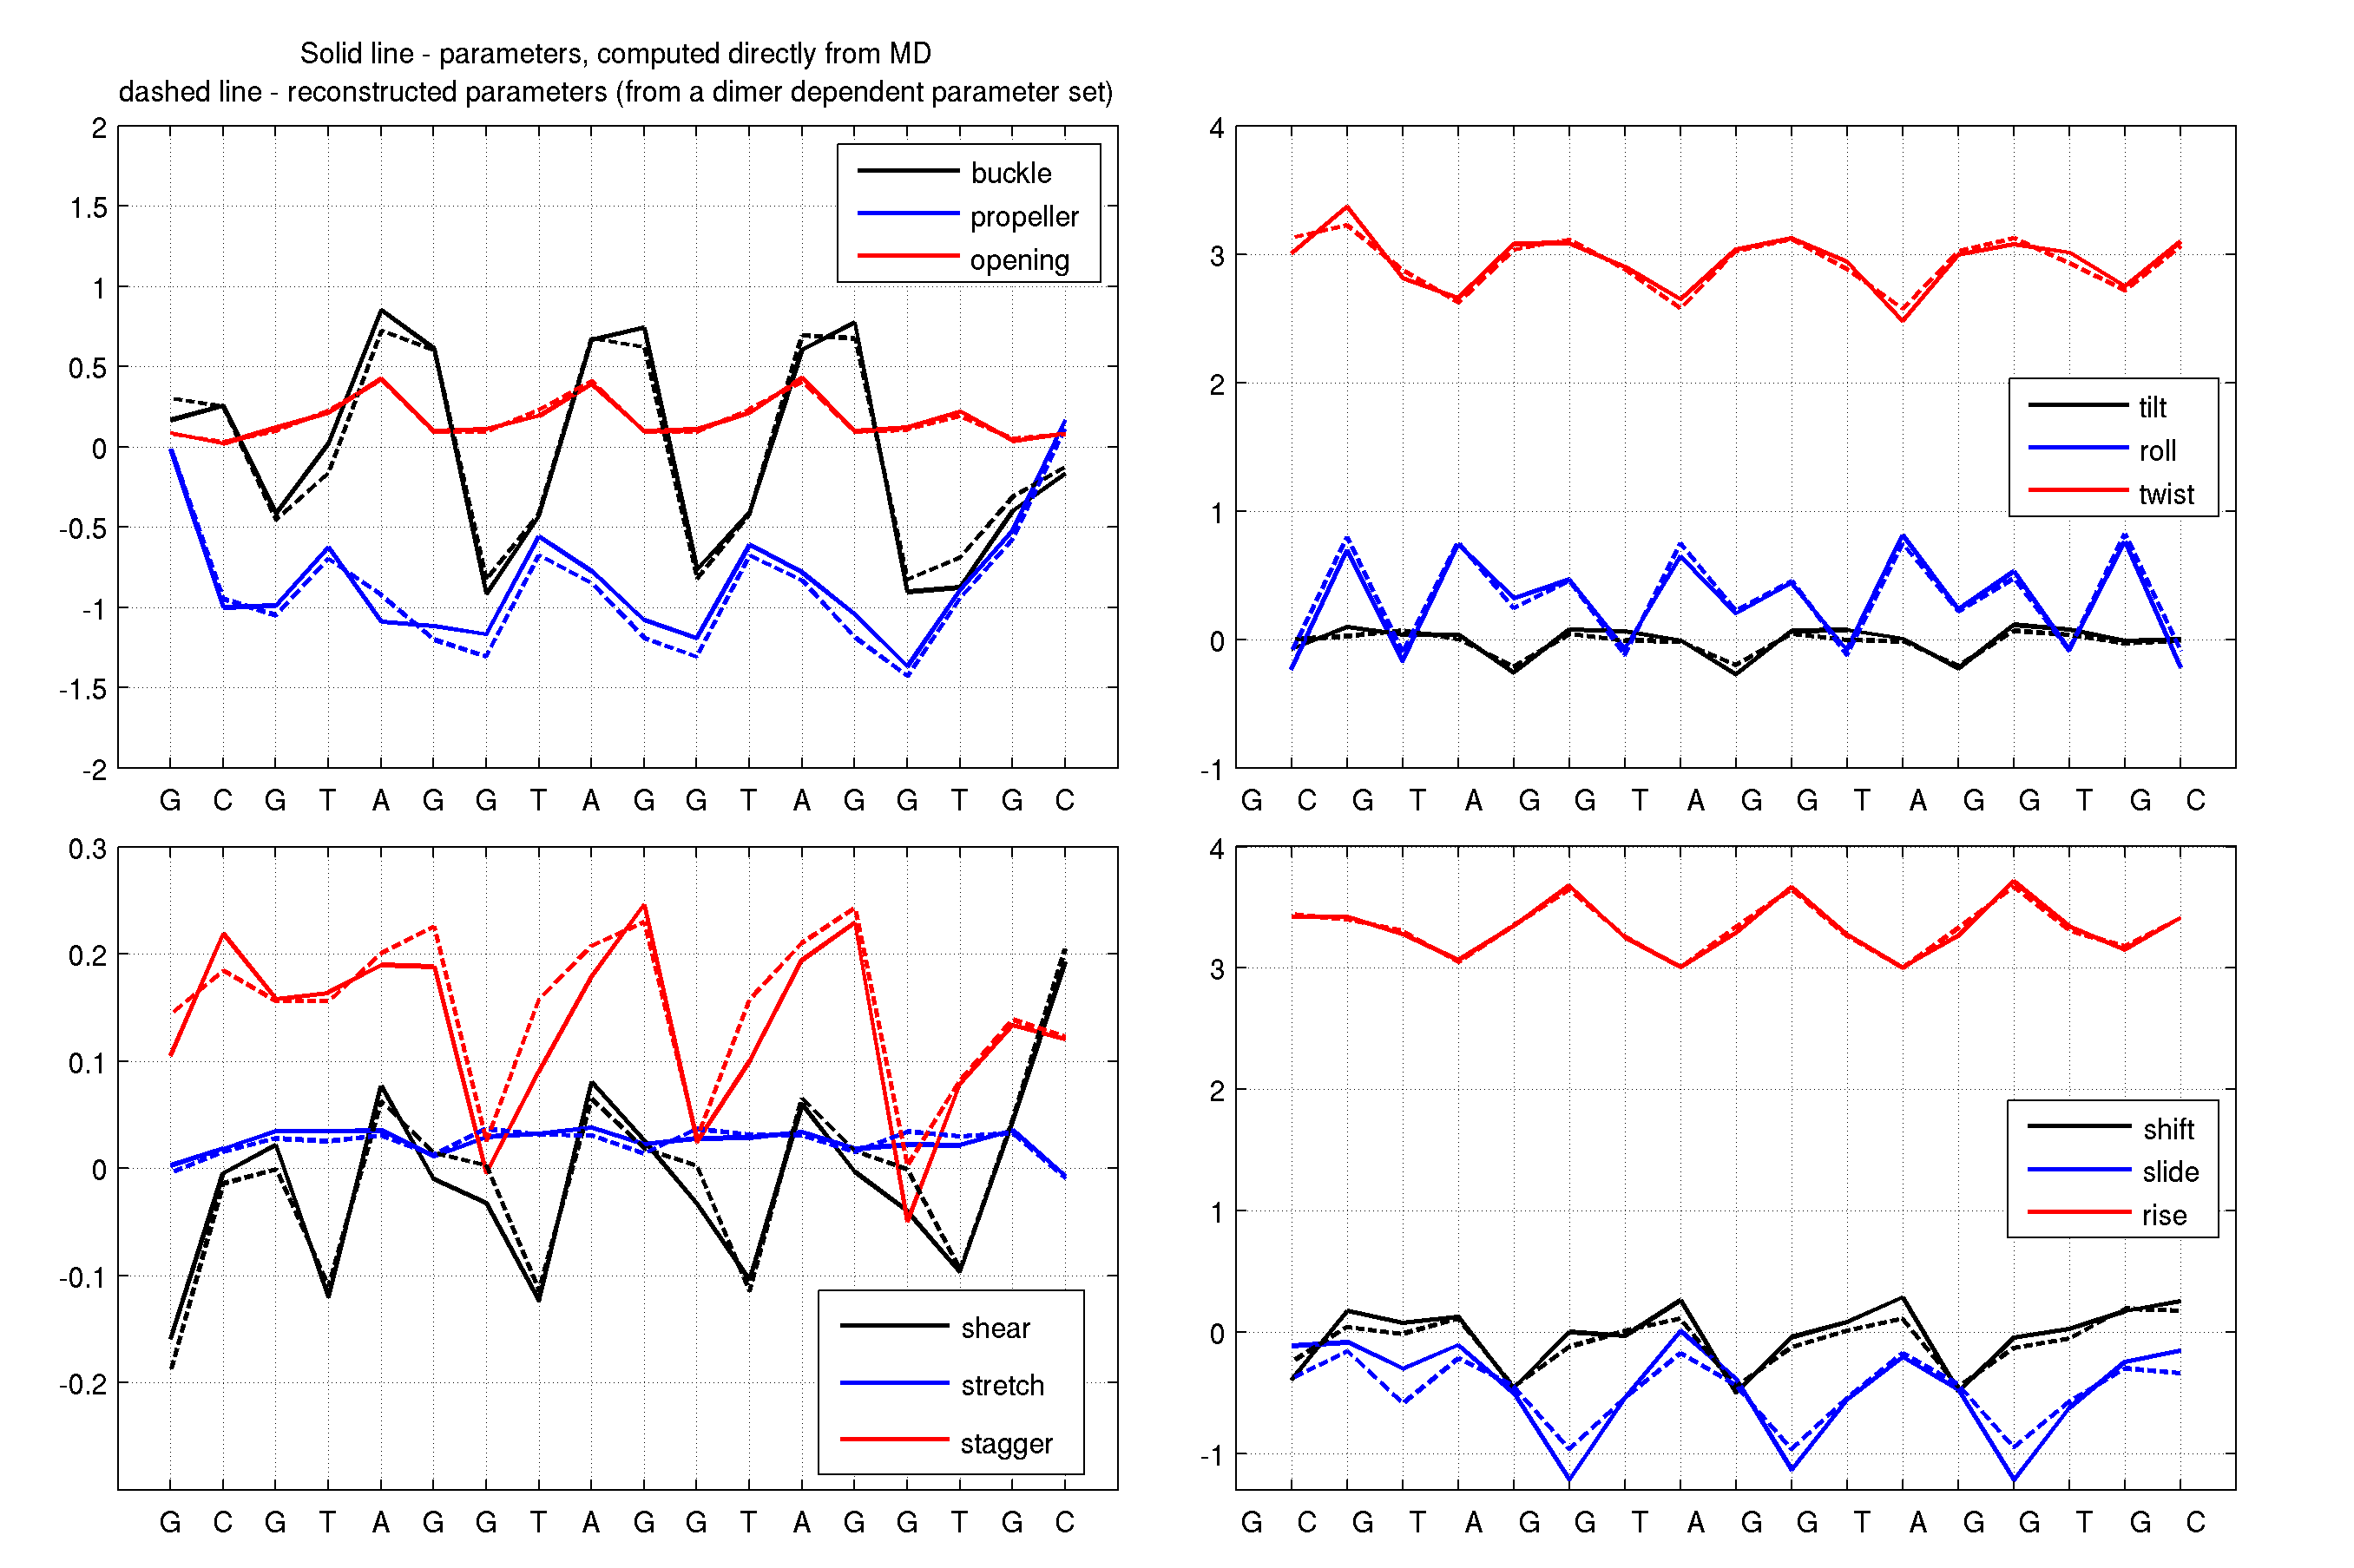
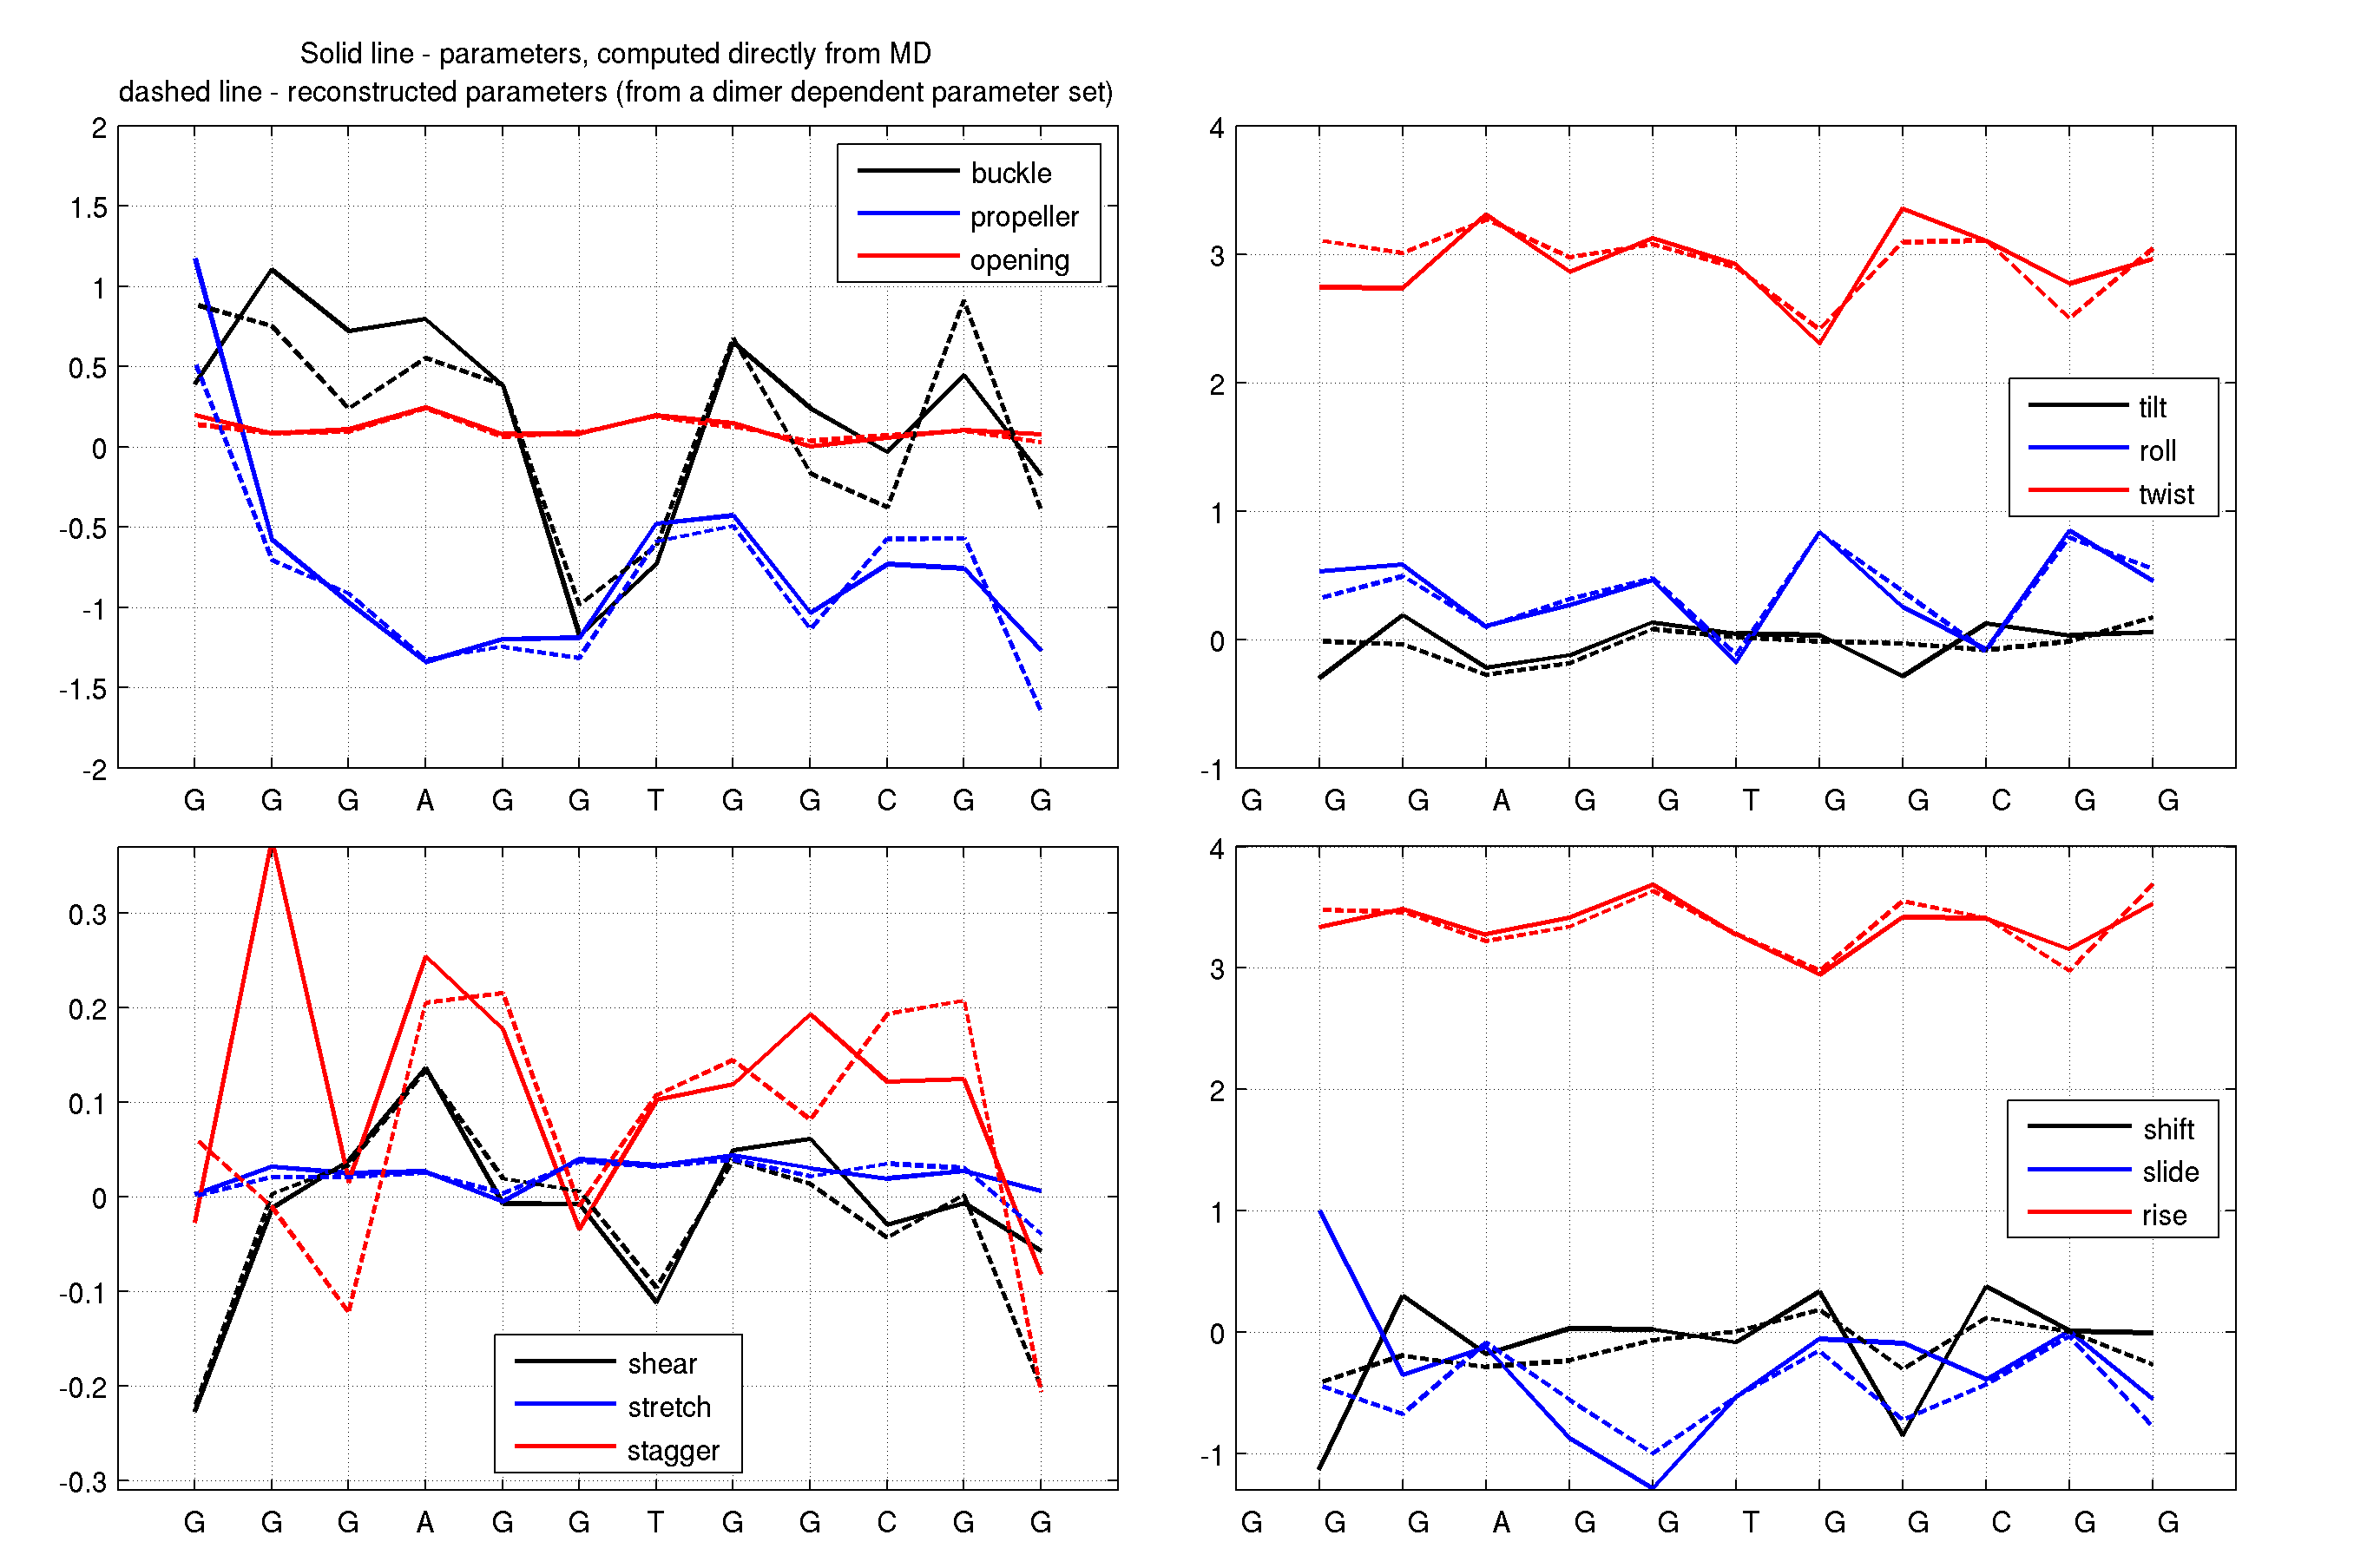
Plots of shape parameters for the sequences 1-56 from the training data set. Each figure contains four panels. The two panels on the left are plots of intra base pair parameters and the two panels on the right are plots of inter base pair (junction) parameters. Rotational parameters are plotted in the top panels and translational parameters are in the bottom panels. Sequences are indicated on the abscissa of each plot.
For better visualization parameter values are interpolated by piecewice-linear curves, where solid lines correspond to the parameters estimated directly from the MD data and dashed lines correspond to the parameters reconstructed from our dimer dependent parameter set. Note that even though the parameter set is dimer dependent, due to the phenomeneon of frustration, shapes have a non-local sequence dependence.